1. Introduction
Cardiovascular disease is a major cause of mortality and morbidity in developing and developed nations. Data from the UK shows that lethal arrhythmias account for 50% of these deaths [
1]. Many lives could be saved if a cost effective, non invasive technology for cardiac rhythm monitoring was widely available to primary care practitioners, as many lethal arrhythmias initially manifest as non-lethal, transient episodes during the early stages of the condition [
2].
Remote site bipolar electrocardiogram (ECG) activity recovery using non-invasive techniques is a challenge [
2]. Electric field dissipation, due to distance from its source, along with increased motion and myographic signal levels, mean the desired ECG is buried in electrical noise. Due to the small ECG signal levels direct extraction using purely hardware filtering is not effective. Therefore, a low latency digital signal processing technique, capable of running on a microprocessor, is essential if remote site ECG recovery is to be exploited in the clinical theater of ambulatory medicine. This paper discusses the development of a low latency QRS activity recovery technique for use with an ECG recording device on the upper left arm. The work continues from previous research on QRS extraction using single fiducial point aligned signal averaged electrocardiogram (SAECG) [
3]. Also, empirical mode decomposition (EMD), as described by Rato
et al. [
4], was implemented and assessed in conjunction with an innovative dry electrode technology and the results compared with the gel electrode and SAECG system described by Lynn
et al. [
2].
2. Methods
2.1. Signal Recording and Denoising
The EMD process is described extensively in the literature [
5]. Basically, selective deletion of intrinsic mode functions (IMFs), prior to recomposition, is used to filter the wanted signal. Then, a combined model of IMF extraction and classical filtering post recomposition was also implemented.
Bipolar lead ECG signal recovery at remote sites is exigent [
2]. High fidelity signal extraction depends on two factors: firstly, the signal recording method, and secondly, the signal processing technique used post measurement. The industry standard signal recovery technique of signal averaging is compared with filters designed using EMD [
6]. The adopted comparison metric was the ratio of signal, measured across the QRS interval and the level of noise measured in the ST segment of the ECG waveform. In order that a direct comparison can be drawn, the measurement windows were as Lynn described [
2] (see
Figure 1). Noise figures for each subject were measured using a 40 mS window located on the S-T segment. This positioning was chosen for its regional stability. Signal noise figures were measured in a 120 mS window centered on the QRS complex. The standard deviation of the data points was calculated and subsequently the signal-to-noise ratio (SNR).
2.2. Dry Electrode Recording System
As discussed previously, the aim of this study was to provide some evidence of feasibility for the development of an arm worn, cardiac rhythm monitor. Therefore, a short pilot investigation of the dry electrode technology developed by Plessey Semiconductors, UK, EPIC™ model number PS25101 (
Figure 2), was conducted and bioelectric signals from the upper arm of two subjects were recorded in an open lab environment and also inside an anechoic chamber. An EMD filtering algorithm was applied and the results compared.
Figure 1.
Signal-to-noise ratio (SNR) measurement windows.
Figure 1.
Signal-to-noise ratio (SNR) measurement windows.
Figure 2.
Plessey, EPIC™ evaluation kit.
Figure 2.
Plessey, EPIC™ evaluation kit.
The chamber was original test equipment developed by Nortel for University of Ulster. Its primary purpose was to simulate an open field site for the measurement of the effective radiated power of radio transmitters and to facilitate EMC testing of network equipment. The anechoicity of the chamber was not critical for the purposes of the dry electrode system testing, however the screened environment provided by the chamber allowed for effective electrical field isolation during measurement periods.
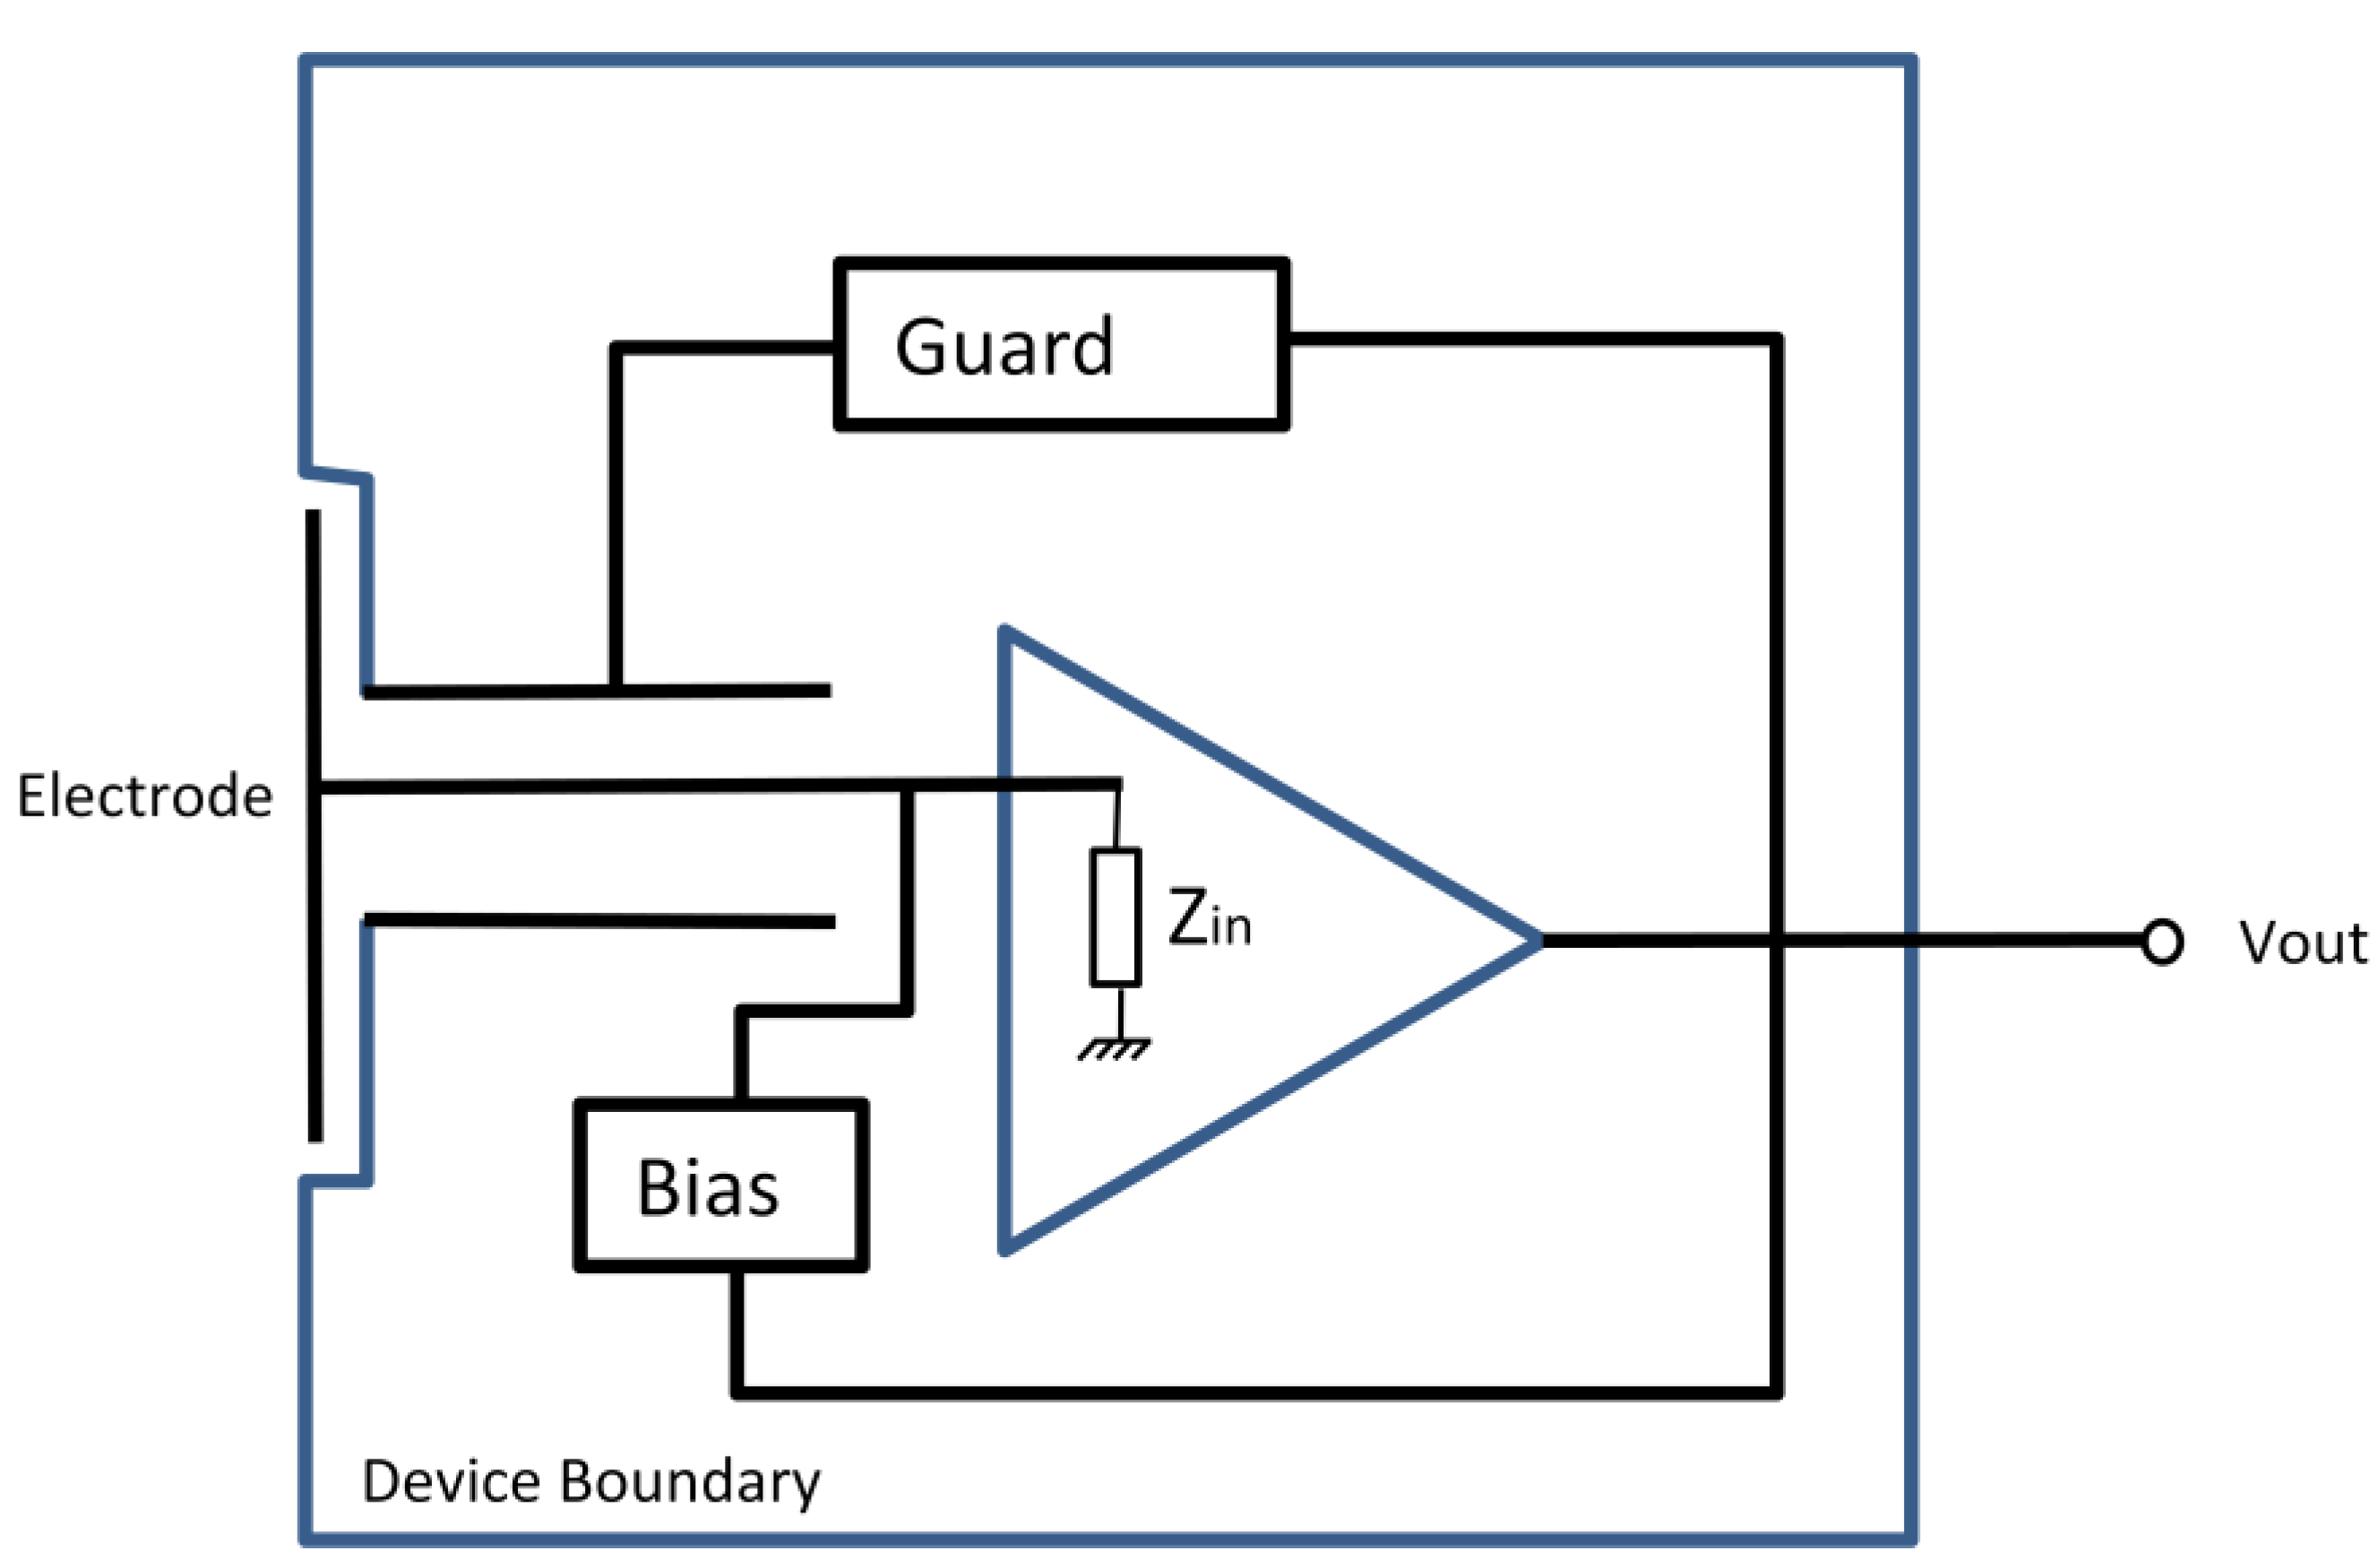
The basic principles of operation of charge amplifier used with the dry electrode technology are described by Smith
et al. [
7]. They illustrate a method of ECG recovery using an innovative, non-contact biopotential electrode. Their technique utilizes an OPA129 FET op-amp from Burr-Brown in, what is essentially an open loop gain, differential input. A small portion of negative feedback has been applied to the non-inverting input via a 500 GΩ resistor to prevent the amplifier from saturating. Smith states that the circuit is a charge amplifier with an overall gain of 2 when the capacitively coupled electrode is 5 mm from the body. Smith has quoted noise figures for his design in the order of 70 uV/√Hz to 9.4 uV/√Hz dependent of frequency. However, Smith’s method requires that the measurement system be referenced to the body by means of a contact electrode so is not ideal for our proposed the wrist monitor study. Nevertheless, the technique may be adapted in a later stage to be of use. Sullivan
et al. [
8] has developed an integrated sensor specifically for the purpose of EEG and ECG recovery in non-contact mode. Sullivan has highlighted the areas where wet and dry contact electrodes can prove to be unreliable if used for long periods. It is also worth noting that both contact technologies are susceptible to variation in performance due to the wide range of skin types seen in application. This variation was evident across the relatively small sample size recorded during our previously reported pilot study [
2]. Sullivan was able to solve the referencing issue experienced by Smith by using an annular design electrode topology. The central copper of the electrode layout is a capacitive sense element, as reported by Smith [
7], but noted some potential instability problem without some critical negative feedback strategy in place.
The technology used for the purpose of this evaluation is an evolution of the aforementioned charge amplifier technology and provides an excellent base from which to test the viability of a long term wearable rhythm monitor. The dry electrode system (
Figure 3) is a hypersensitive electric field detector and provides an output proportional to the electrical field magnitude near the electrodes location [
9]. The operating bandwidth is 200 mHz to 10 KHz; however, this hardware is limited due to sampling rate restrictions of the data logging equipment (@ 1 kHz).
Figure 3.
Charge amplifier technology.
Figure 3.
Charge amplifier technology.
2.3. Remote Electrodes Location
The main focus of remote ECG recording location was the upper bicep region of the left arm. In each case, the electrodes were placed on the upper arm, diametrically opposite and vectored away from the heart. A silicon rubber tourniquet was used to secure the dry electrodes in soft contact with the skin (
Figure 4).
Each recorded subject was in a relaxed, seated position and recorded for a period of 3 min. However, only a 10 s time period, selected from the beginning of the recording, was used to generate the data for this short pilot study. Previous work, using signal averaging (SAECG), required approximately 400 beats before sufficient noise reduction could be achieved, producing a signal recovery latency in excess of 5 min [
2]. SAECG is ideal for repetitive feature identification, for example ventricular late potential analysis. However, a syntactic approach, such as EMD, does not require an extended ‘learning’ period as its design recognizes and enhances patterns in the data which are indicative of the signal of interest, thus, the system is virtually real-time.
A 10 s period was chosen for this study as an illustration of the speed by which the EMD tool can extract the desired signal. The displayed data portion could have been reduced to encompass just one beat, though this would have been at the loss of the demonstrative function of the figure.
Figure 4.
Bipolar electrodes position.
Figure 4.
Bipolar electrodes position.
3. Results and Discussion
3.1. Signal Averaging and EMD Comparative Study
The standard deviation of all data points within the temporal windows of
Figure 1 provides the noise data shown in
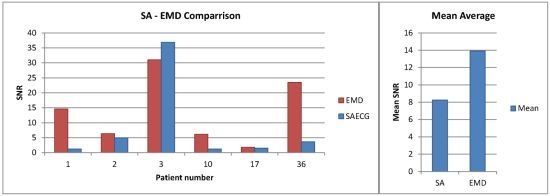
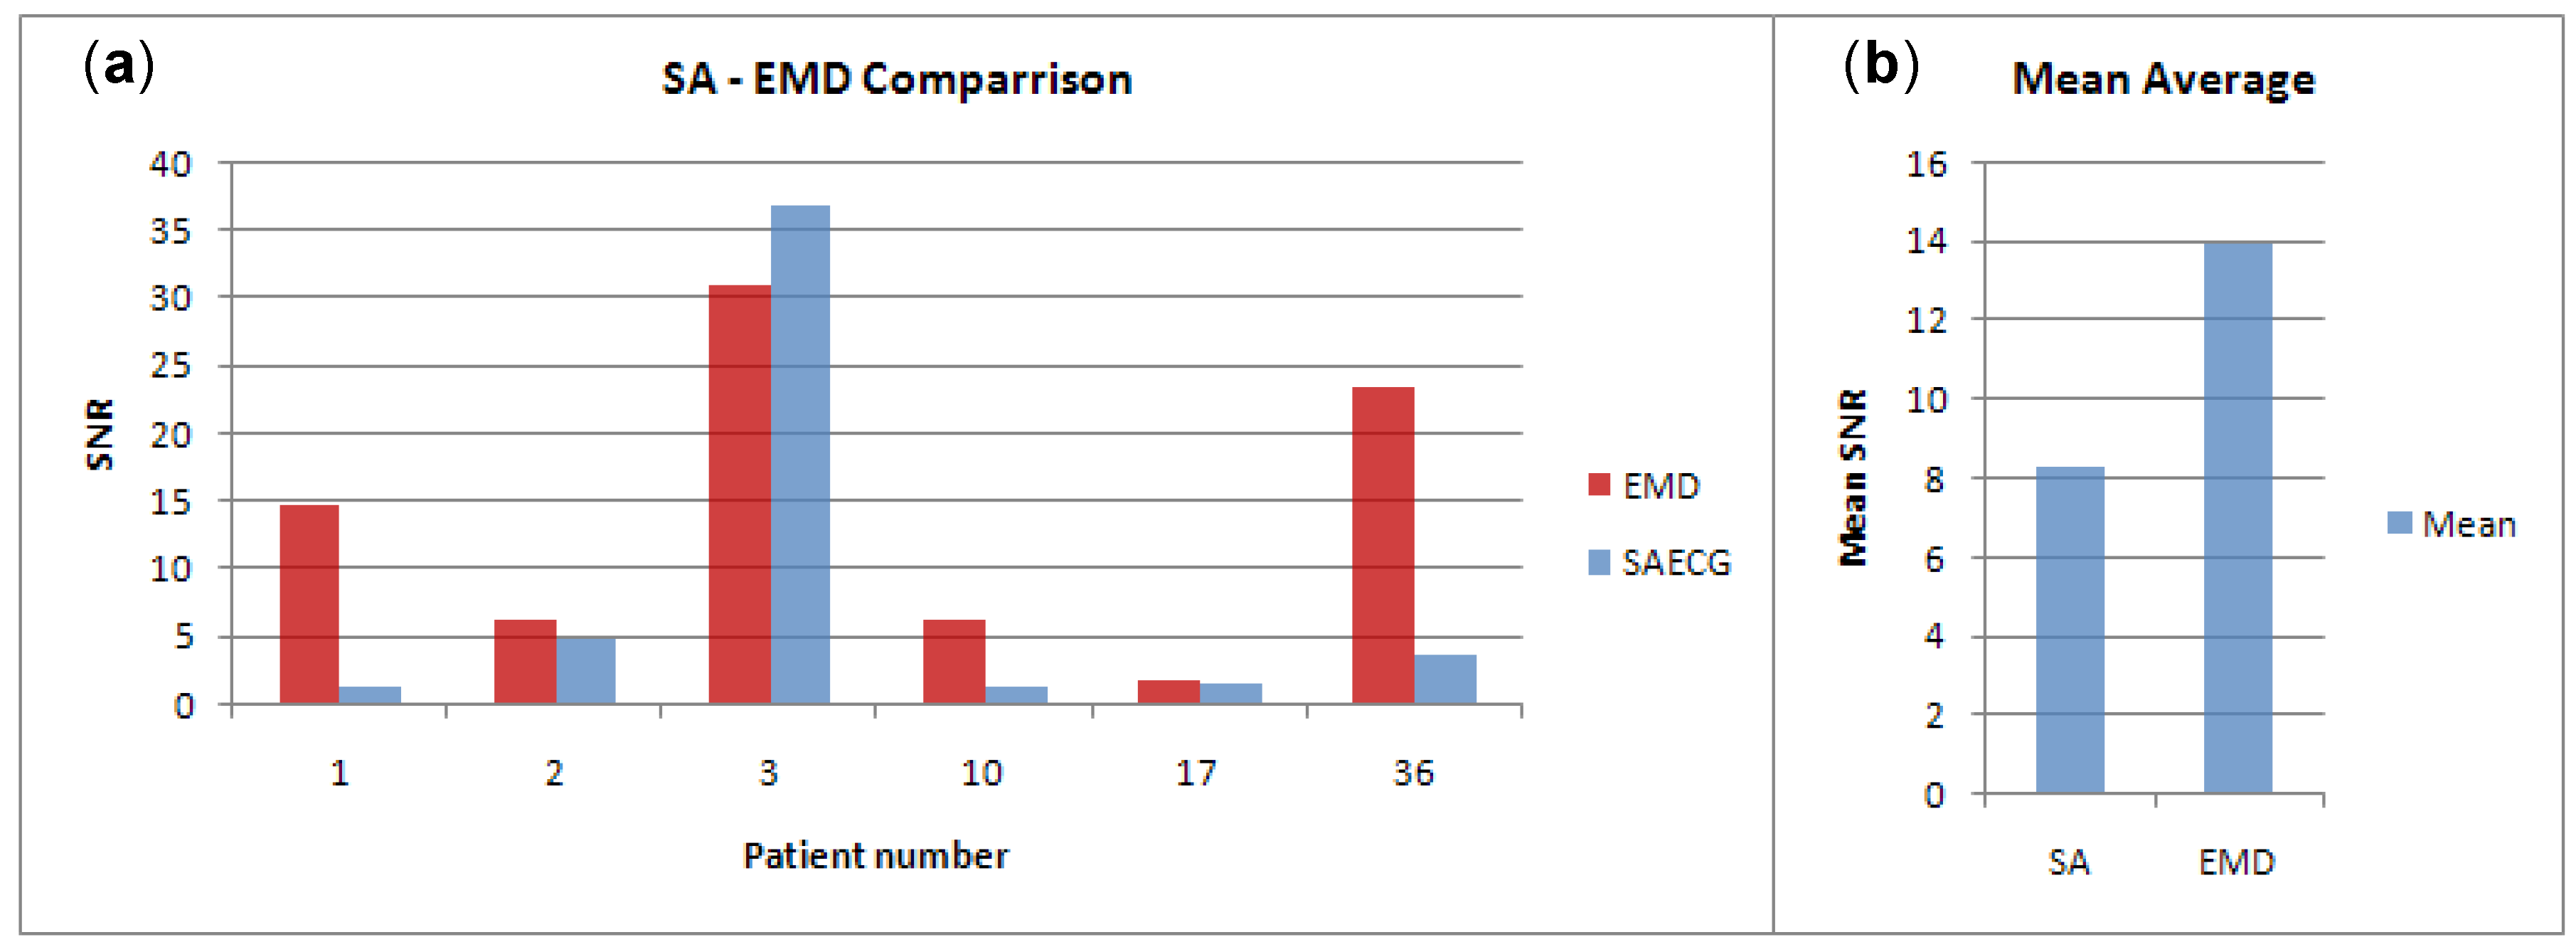
Table 1 and
Figure 5. On average, EMD provides for a lower noise filter than SAECG.
Figure 6 shows the d
V/d
t waveforms of subject 3 before and after signal processing.
Table 1.
SNR of signal averaged electrocardiogram (SAECG) compared to empirical mode decomposition (EMD).
Table 1.
SNR of signal averaged electrocardiogram (SAECG) compared to empirical mode decomposition (EMD).
| Subject | 1 | 2 | 3 | |
|---|
| sig | noise | snr | sig | noise | snr | sig | noise | snr | |
|---|
| SAECG | 2.65 | 2.09 | 1.27 | 4.54 | 0.92 | 4.93 | 7.93 | 0.22 | 36.86 | |
| EMD | 0.936 | 0.064 | 14.608 | 163.448 | 25.811 | 6.333 | 188.908 | 6.091 | 31.015 | |
| Subject | 10 | 17 | 36 | |
| sig | noise | snr | sig | noise | snr | sig | noise | snr | Mean |
| SAECG | 2.65 | 0.02 | 1.27 | 6.44 | 4.31 | 1.49 | 4.57 | 1.25 | 3.67 | 8.2483 |
| EMD | 284.105 | 46.026 | 6.173 | 381.860 | 212.238 | 1.799 | 334.054 | 14.230 | 23.474 | 13.9 |
Figure 5.
(a) SAECG and EMD SNR comparisons, (b) mean average for the six cases.
Figure 5.
(a) SAECG and EMD SNR comparisons, (b) mean average for the six cases.
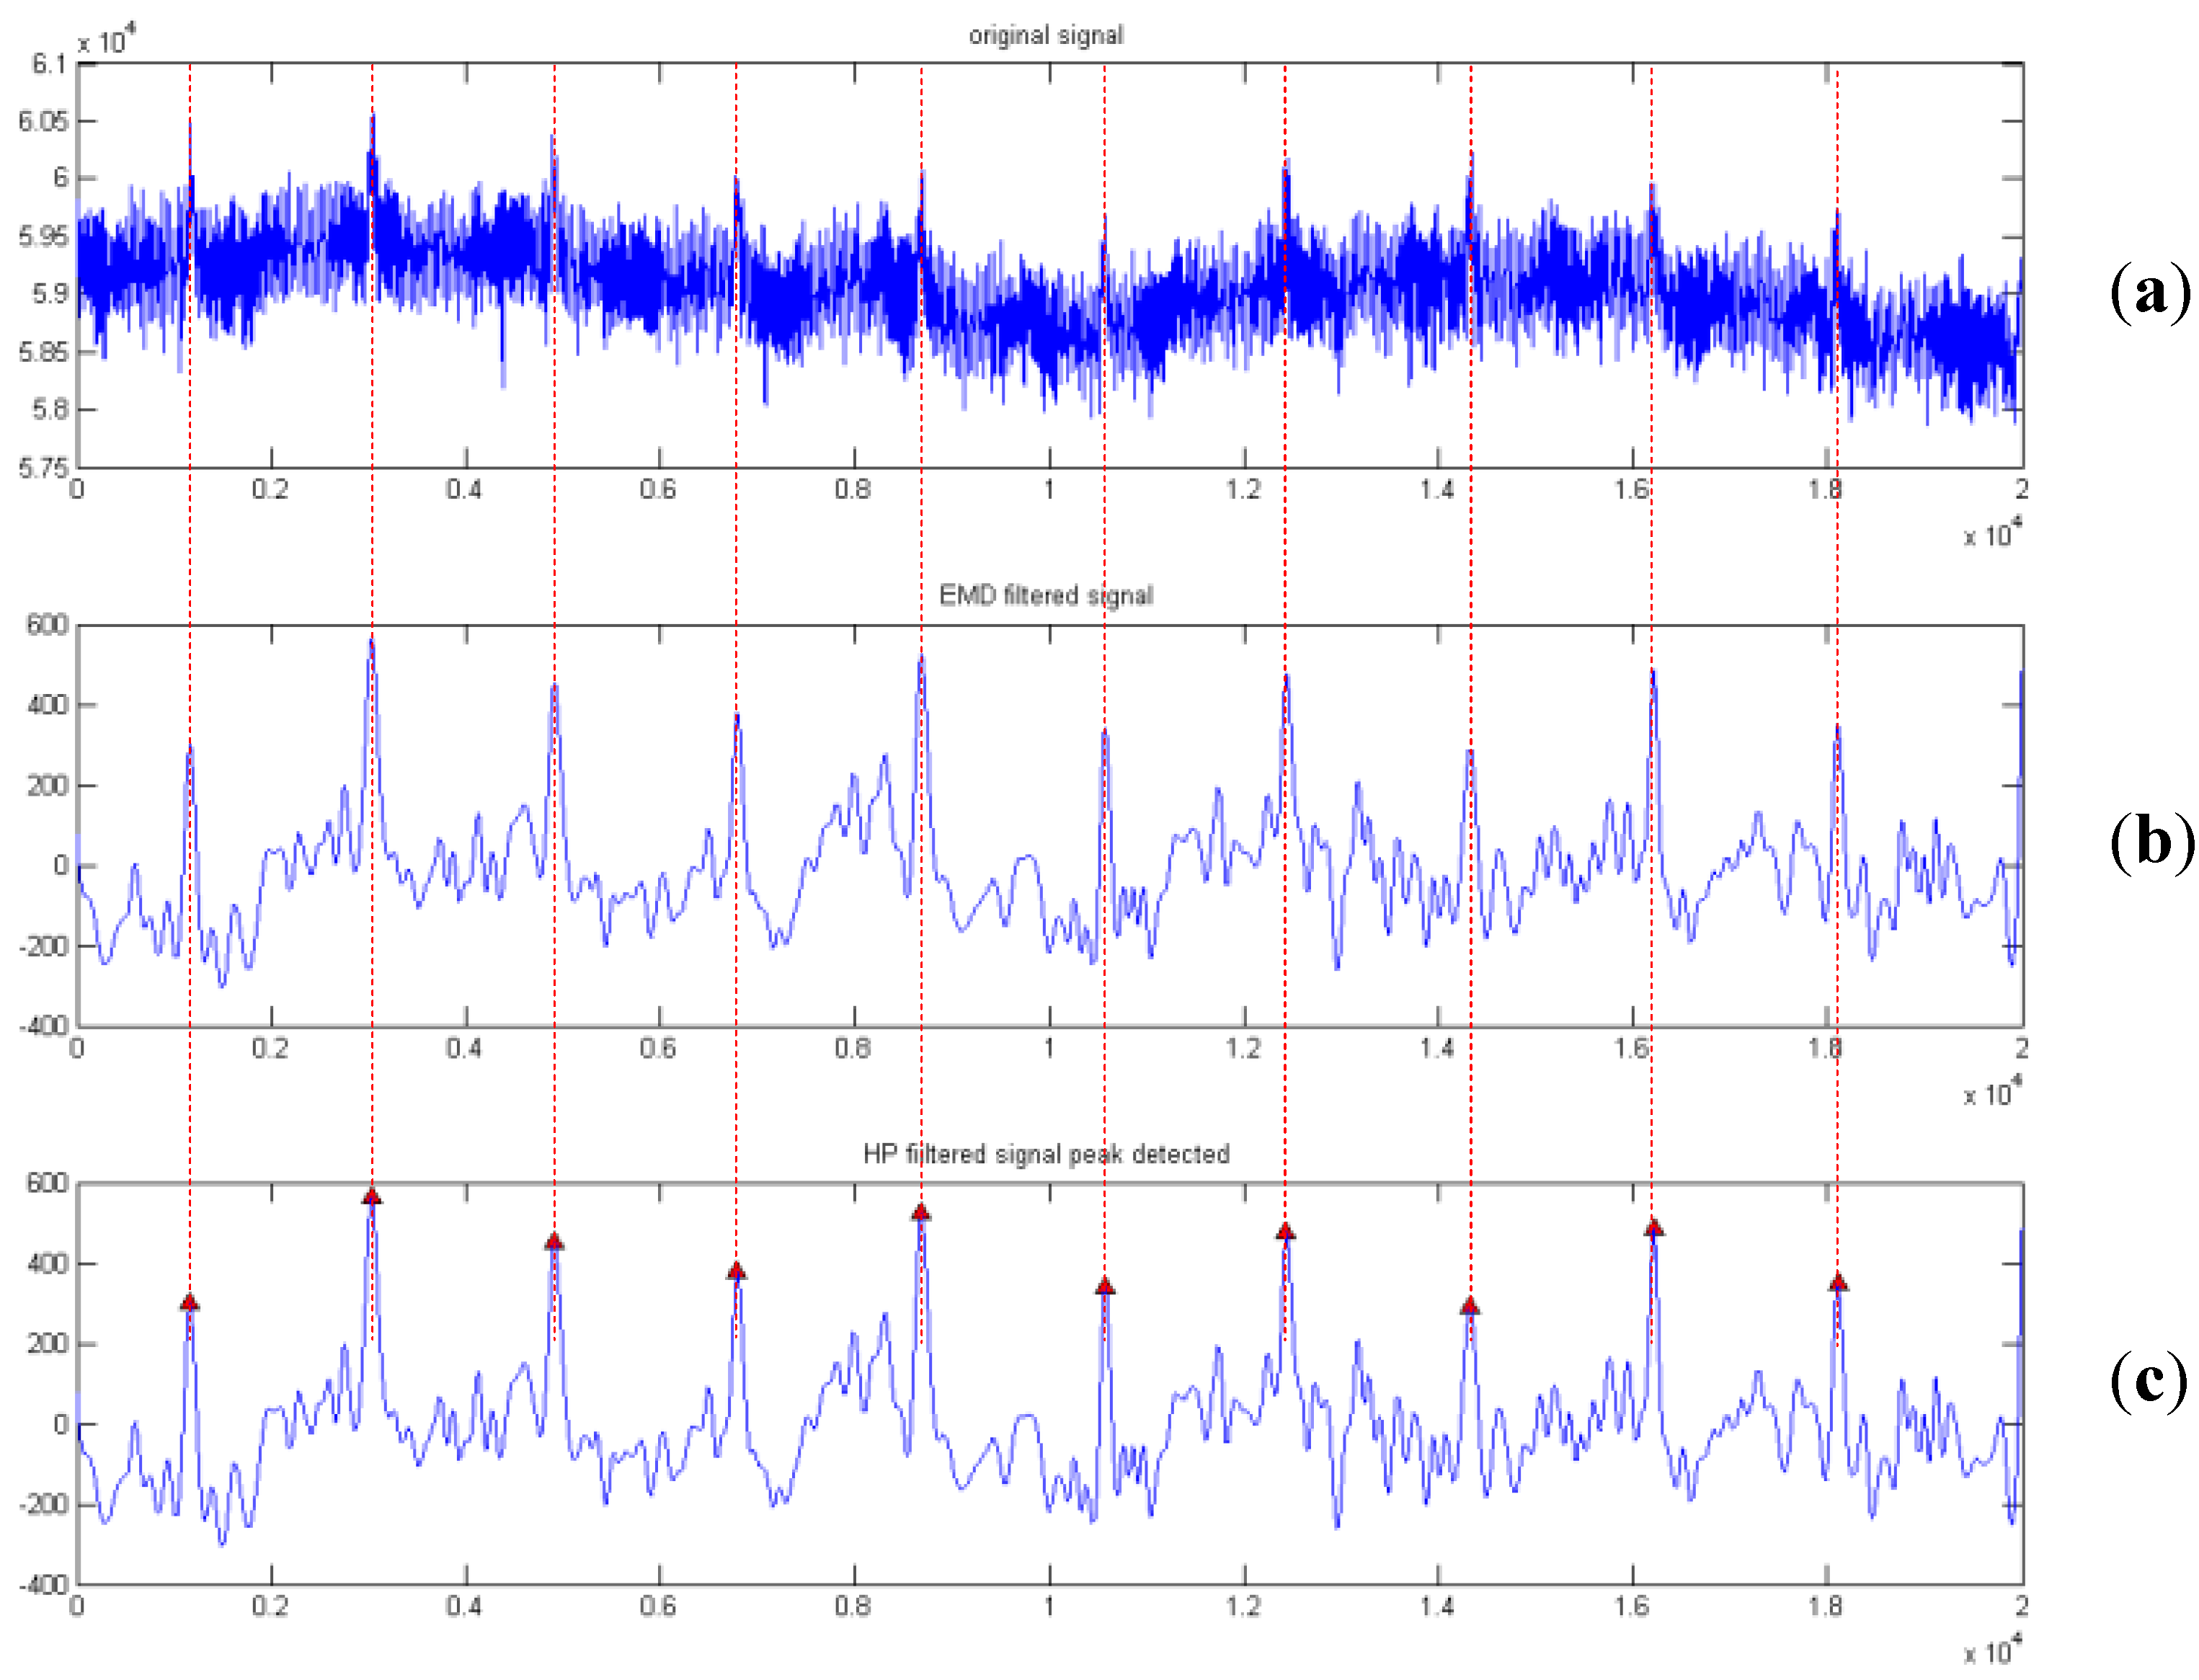
Figure 6.
Subject 3 (a) shows 10 s of lead 1, (b) shows the signal across the bicep post EMD filter, (c) shows the output post HP filter.
Figure 6.
Subject 3 (a) shows 10 s of lead 1, (b) shows the signal across the bicep post EMD filter, (c) shows the output post HP filter.
The 6 subject data exhibited in
Table 1 were the best quality recordings selected from a wider database (
N = 37) [
2] of arm recordings due to the SNR being greater than 1. In each case the QRS signal was easily discernable post signal averaging and is considered to be the best available data sets.
Subject 3 shows a high signal to noise ratio when filtered using both signal averaging and EMD. It is worth noting that this particular patient recorded extremely well. The elevated signal levels may be due to the fact that the subject had low BMI (16.5) and hence little body fat. An elevation in QRS level detected across the bicep was observed on patents with low body fat during the course of this study.
Figure 6 shows a voltage against time plot of the signal from subject 3. The QRS locations are clearly discernable above the noise. The figure demonstrates the output from each stage of the filtering process. The final stage applies a classic Butterworth high pass filter. This removes any baseline drift (BLD) which is reintroduced during the EMD reconstruction stage. Reintroduction of BLD is unavoidable as frequency components from the QRS complex are overlapped with the BLD. The high pass filter simplifies the detection of the QRS to a simple threshold or peak detection.
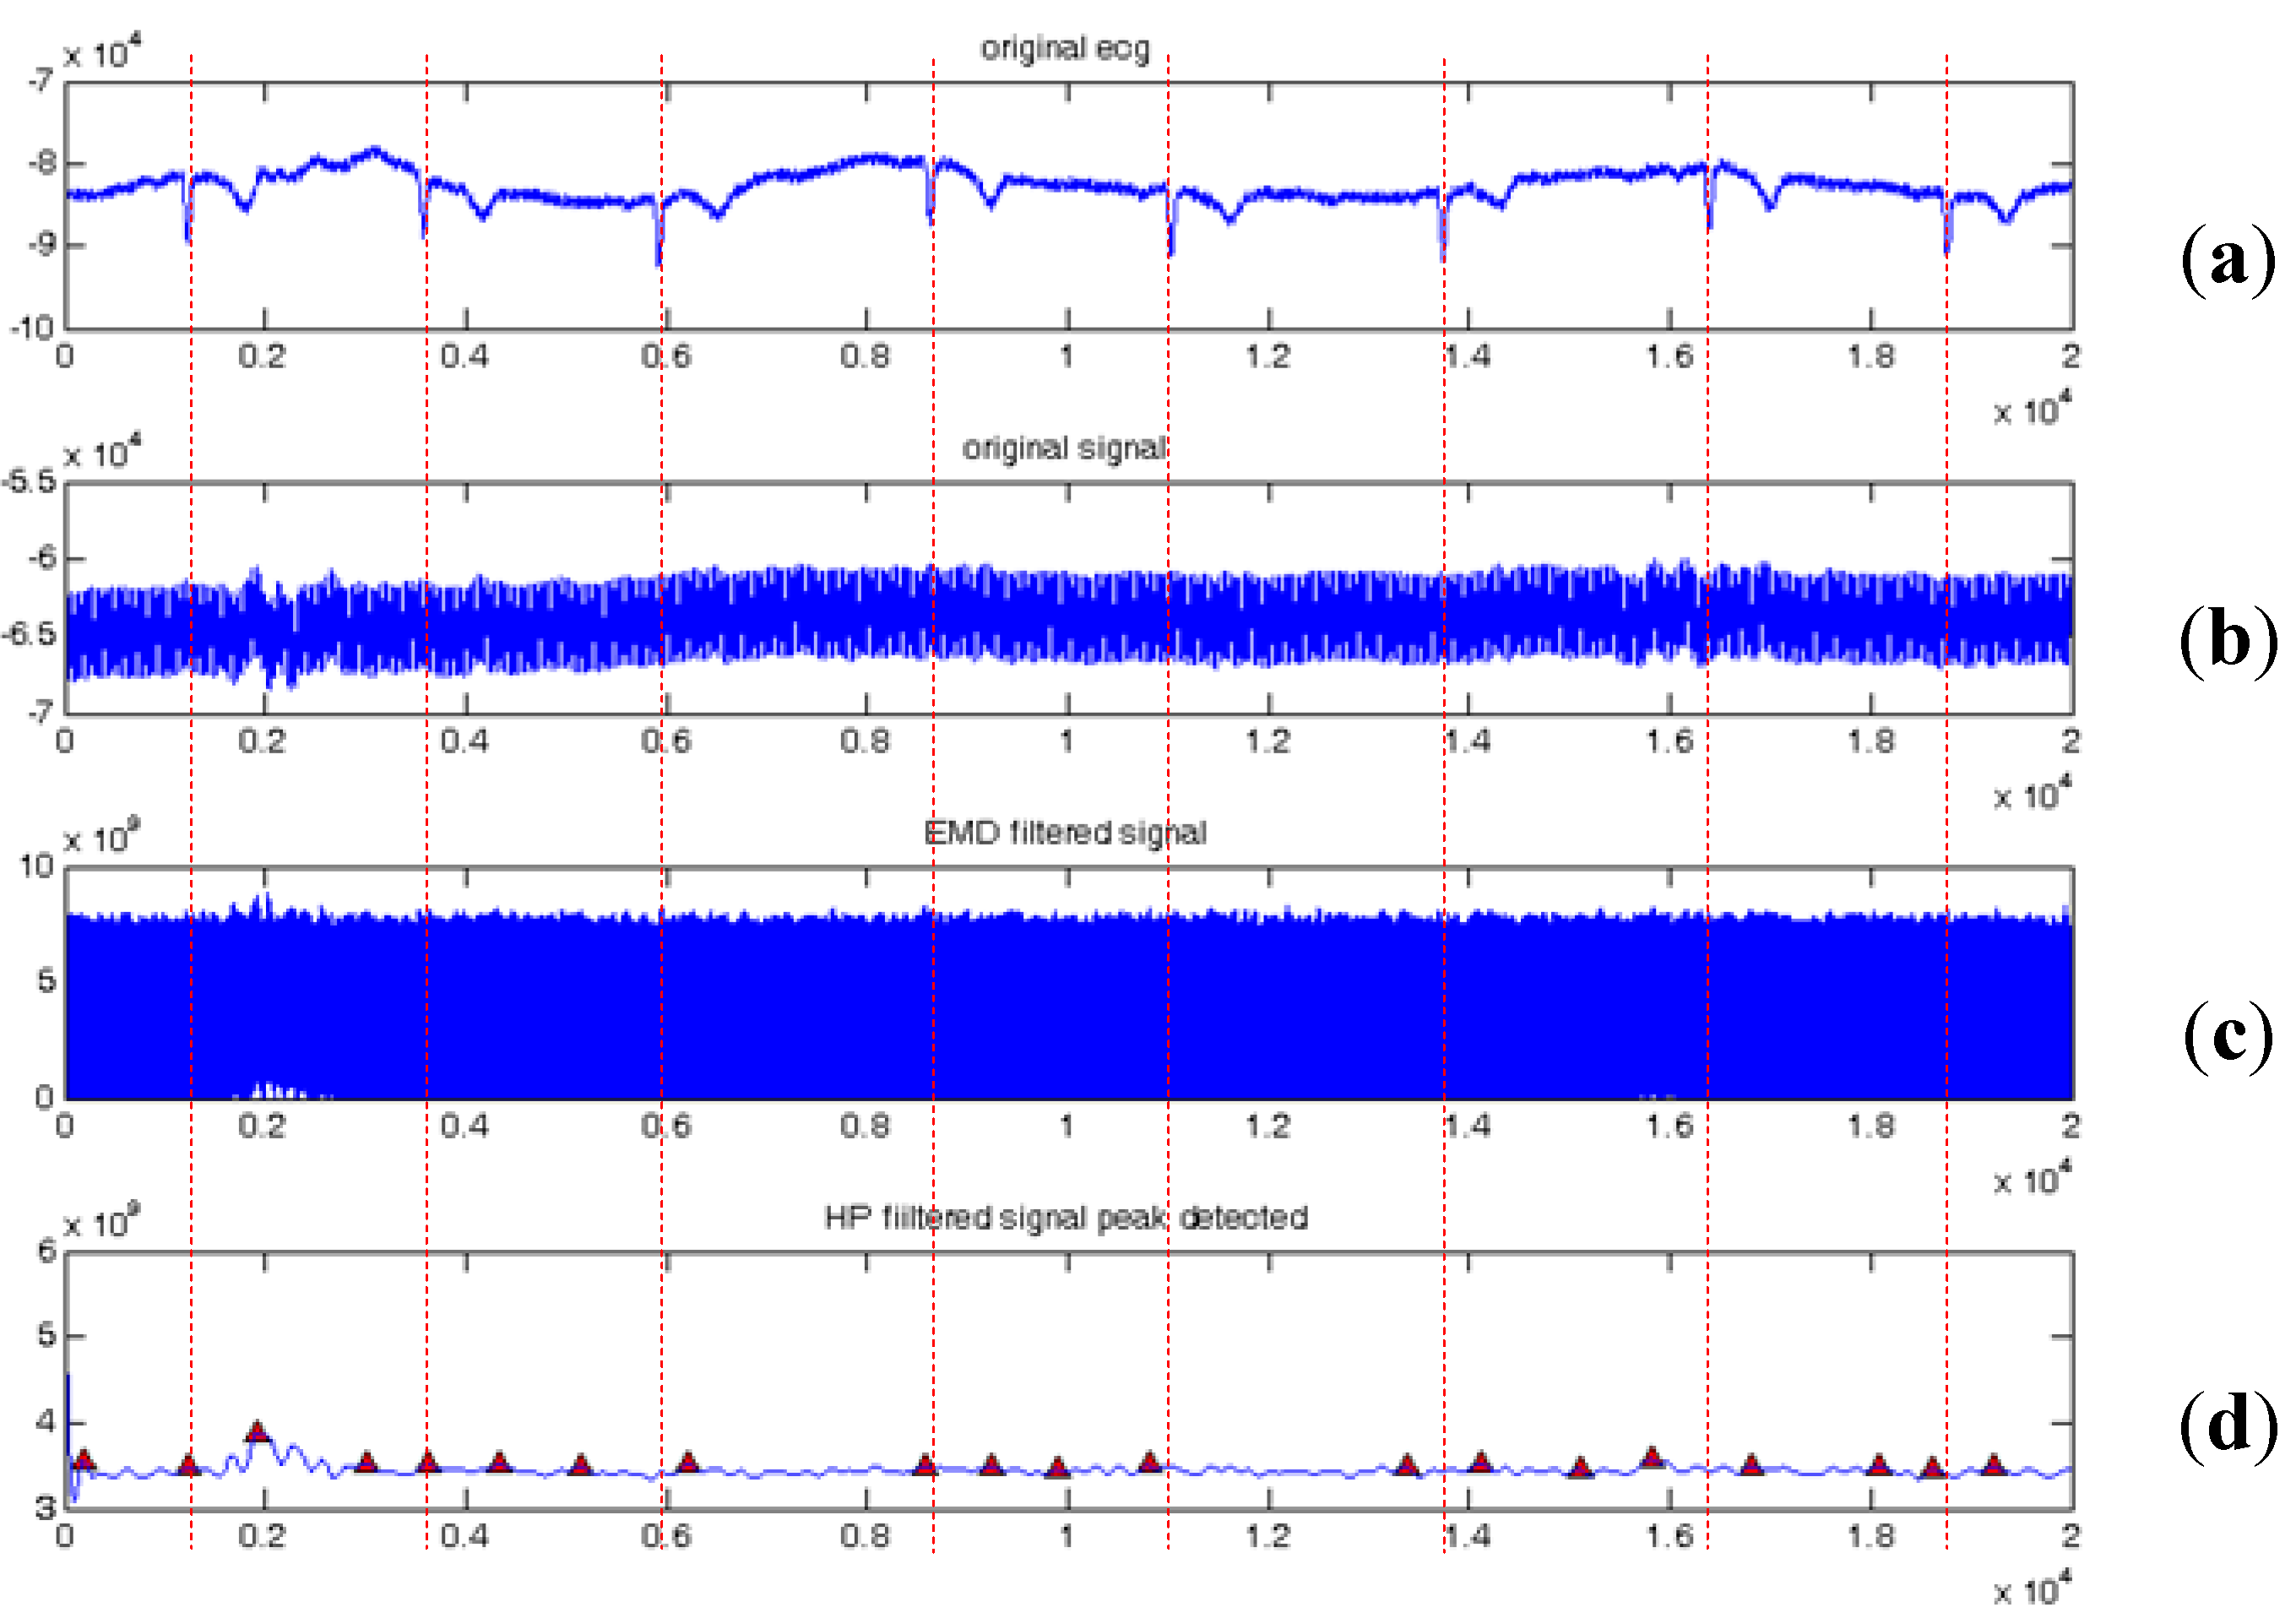
Subject 1 shows an SNR of 14.608 when filtered using EMD, while SAECG provides an SNR of 1.27. The d
V/d
t plot of
Figure 7 shows the original signal and filter output (10 s). It is apparent, when compared with the plot of
Figure 6 that there is no visually discernable ventricular electrical activity. The original chest ECG lead is included to demonstrate the temporal location of the QRS activity.
The high SNR is generated due to the high frequency noise present in the signal. The signal window is saturated in comparison with the relatively narrow noise measurement window, giving a false SNR. The error is detectable when attempting to locate the QRS using automated peak detection.
Figure 7.
Subject 1 dV/dt (a) shows 10 s of lead 1, (b) shows the signal across the bicep, (c) shows the signal across the bicep post EMD filter, (d) peak detector output.
Figure 7.
Subject 1 dV/dt (a) shows 10 s of lead 1, (b) shows the signal across the bicep, (c) shows the signal across the bicep post EMD filter, (d) peak detector output.
3.2. Dry Electrode Technology Evaluation
Table 2 compares 2 subjects measured using the charge amplifier recorder with the bipolar electrodes placed on the bicep region (
Figure 4). The charge signal is extremely prone to rapid excursions from stability, due to environmental noise spikes. Tribological charge generation is evident and expected as the electrode surface impedance is in the order of 20 GΩ. The high input impedance also increases susceptibility to radiated field interference.
Table 2.
Dry electrode comparison. Normal environment (N) and an anechoic chamber(C). Mean value for n = 2.
Table 2.
Dry electrode comparison. Normal environment (N) and an anechoic chamber(C). Mean value for n = 2.
| Subject | 1(N) | 1(C) | | |
|---|
| sig | noise | snr | sig | noise | snr | | |
|---|
| EMD | 503.278 | 18.5992 | 27.06 | 0.035 | 0.0001 | 296 | | |
| Subject | 2(N) | 2(C) | | |
| sig | noise | snr | sig | noise | snr | Mean(N) | Mean(C) |
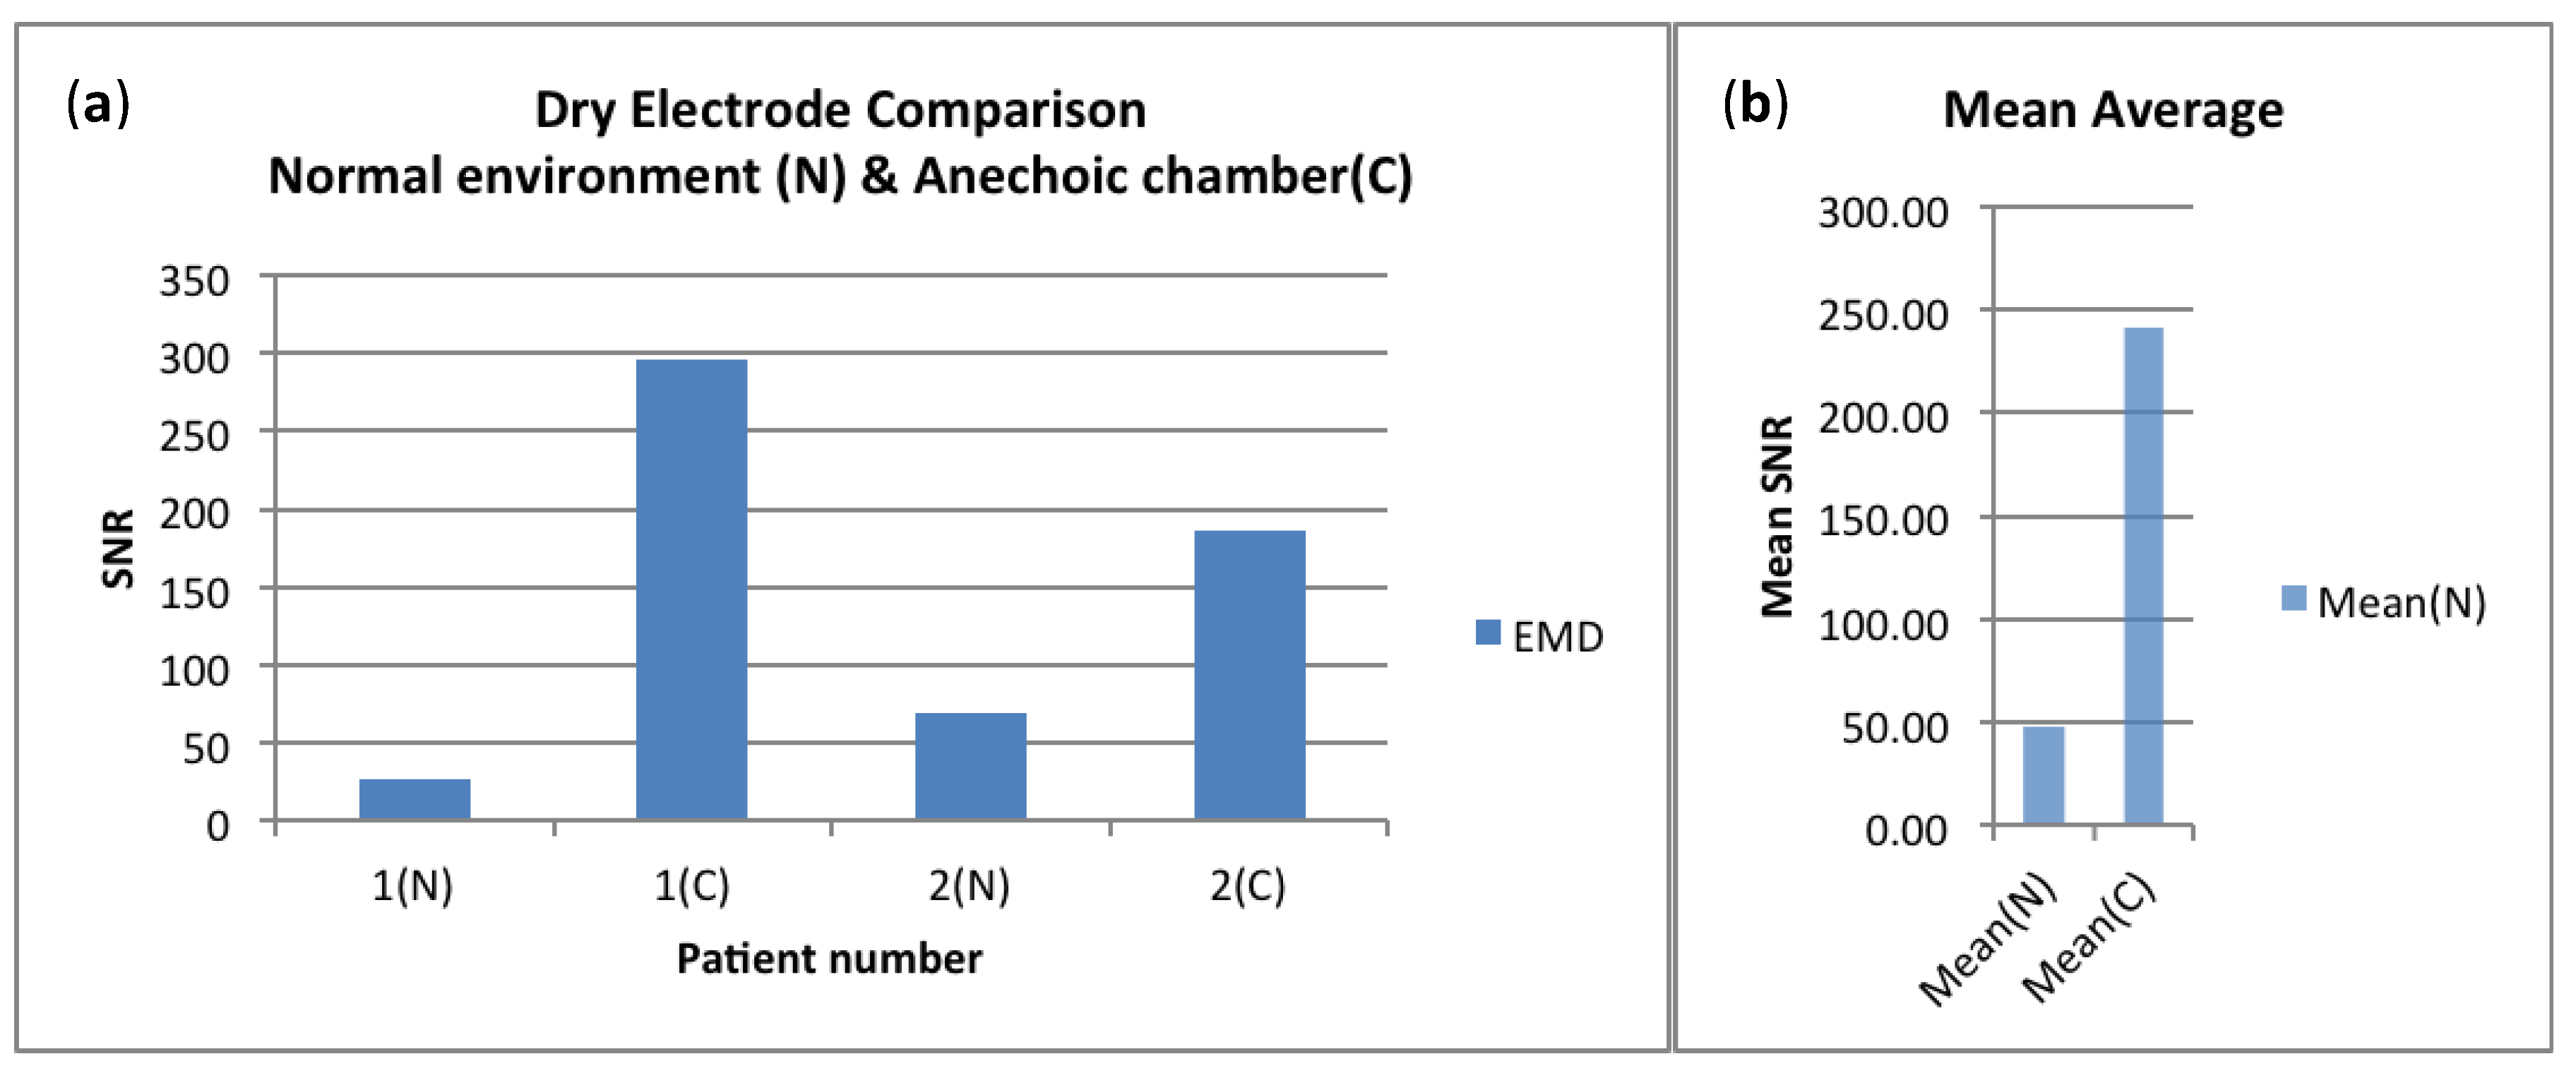
| EMD | 0.0124 | 0.00018 | 68.89 | 0.0182 | 0.0001 | 185.8 | 47.97 | 240.906 |
“Normal environment” is defined as a lab environment. No precautions are taken to reduce radiated or conducted noise coupling. The subject is seated, however, small movements of the left hand were encouraged to simulate normal EMG noise. An “anechoic chamber” measurement was used as a comparison to demonstrate the quantity of noise attributable to radiated susceptibility of the charge amplifier topology. In each case EMD partial recomposition was used to filter the acquired signals.
Table 2 and
Figure 8 show the comparison data.
Figure 8.
(a) SNR of dry electrode, charge amplifier recordings, (b) Mean average of both subjects (N = 2).
Figure 8.
(a) SNR of dry electrode, charge amplifier recordings, (b) Mean average of both subjects (N = 2).
4. Conclusions
It is evident from this comparative study detailed in 3.1, that EMD partial recomposition can be used as a low latency denoising technique for the recovery of remote site cardiac rhythm data. Since there is little associated adaption time once the filter has been constructed, the EMD based filter can be applied in almost real-time, as opposed to the SAECG algorithm which processed in excess of 400 beats per subject to acquire the data in
Table 1.
The benefit of real time acquisition being that missing beats or transient arrhythmias can be immediately identified. While signal averaging is a useful tool for recovering irregularities in high definition, it requires a constant repetition of an event before it can be extracted. Time varying occurrences, such as ectopic or missing beats will be averaged out.
The dry electrode technology is still at an early stage and is relatively unstable when used with low signal to noise ratios or on the ambulatory patient. The system electrodes are very susceptible to motion and every care was taken to avoid arterial locations on the subject so as to remove blood pressure pulse artifact. Lead positioning and environmental noise also greatly affect the signal recovery.
5. Limitations
This study analysed signals from only a few subjects and the duration of the recordings were relatively short. Therefore, at the moment, the conclusions drawn can be considered only as preliminary. However, the EMD filtering algorithm has shown its potential in distal site ECG recovery studies.
It is notable that signal recovery using EMD filtering is not 100% autonomous. Each signal decomposes differently, giving a varying set of IMF’s. The ECG frequency distribution across the IMF’s is also unpredictable, making the reconstruction process somewhat complex.
On average, the signals discussed in this paper were decomposed into 12 IMF’s, with the maximum IMF count being 15. The ECG signal was distributed across 7 IMF’s, namely IMF’s 3-7, 9, 10.
Mode mixing [
10] was observed and has lead to a desensitisation of the technique, as seen in
Figure 7.
Author Contributions
DL and OE designed research methods; DMcE was responsible for ethical procedures and clinical protocol design; all authors contributed equally to data analysis, interpretation of results and manuscript preparation. All authors read and approved the final manuscript.
Conflicts of Interest
The authors declare no conflict of interest.
References
- Heikki, V.; Castellanos, A.; Myerburg, R.J. Sudden death due to cardiac arrhythmias. N. Engl. J. Med. 2001, 345, 1473–1482. [Google Scholar] [CrossRef]
- Lynn, W.D. Arm and wrist surface potential mapping for wearable ECG rhythm recording devices: A pilot clinical study. IOP Sci. 2013, 450, 3–8. [Google Scholar]
- Escalona, O.J. Analog implementation of the single fiducial point alignment technique for real-time high resolution ECG analysis in the P-R interval. In Proceedings of Computers in Cardiology 1998, Cleveland, OH, USA, 13–16 September 1998; pp. 229–232.
- Rato, R.T.; Ortigueira, M.D.; Batista, A.G. On the HHT, its problems, and some solutions. Mech. Syst. Signal Pr. 2008, 22, 1374–1394. [Google Scholar] [CrossRef]
- Chang, K.M. Arrhythmia ECG noise reduction by ensemble empirical mode decomposition. IOP Sci. 2010, 10, 6065. [Google Scholar]
- Wu, Z.; Huang, N.E. Ensemble empirical mode decomposition: A noise-assisted data analysis method. Adv. Adapt. Data Anal. 2009, 1, 1–41. [Google Scholar]
- Smith, W.J.; LaCourse, J.R. Non-contact biopotential measurement from the human body using a low-impedance charge amplifier. In Proceedings of the IEEE 30th Annual Northeast Bioengineering Conference, Durham, NH, USA, 17–18 April 2004.
- Sullivan, T.J.; Deiss, S.R.; Cauwenberghs, G. A Low noise, non-contact EEG/ECG sensor. In Proceedings of the IEEE Biomedical Circuits and Systems Conference, 2007, BIOCAS 2007. Montreal, PQ, Canada, 27–30 November 2007.
- Plessey Semiconductors. Datasheet PS25251 EPIC Ultra High Impedance ECG Sensor. Available online: http://www.plesseysemiconductors.com/doc/?id=291766 (accessed on 3 July 2014).
- Wu, S.-D.; Chiou, J.-C.; Goldman, E. Solution for mode mixing phenomenon of the empirical mode decomposition. In Proceedings of the 2010 3rd International Conference on Advanced Computer Theory and Engineering (ICACTE), Chengdu, China, 20–22 August 2010; Volume 2, pp. 500–504.
© 2014 by the authors; licensee MDPI, Basel, Switzerland. This article is an open access article distributed under the terms and conditions of the Creative Commons Attribution license (http://creativecommons.org/licenses/by/3.0/).


