Article

A Wearable System for the Evaluation of the Human-Horse Interaction: A Preliminary Study

1
Research Center “E.Piaggio”, School of Engineering, University of Pisa, Largo Lucio Lazzarino 1, Pisa 56122, Italy
2
Department of Veterinary Sciences, Laboratory of Equine Behavior and Physiology, University of Pisa, Viale delle Piagge 2, Pisa 56124, Italy
*
Author to whom correspondence should be addressed.
Electronics 2016, 5(4), 63; https://doi.org/10.3390/electronics5040063
Submission received: 26 June 2016 / Revised: 14 September 2016 / Accepted: 18 September 2016 / Published: 26 September 2016

Abstract

:
This study reports on a preliminary estimation of the human-horse interaction through the analysis of the heart rate variability (HRV) in both human and animal by using the dynamic time warping (DTW) algorithm. Here, we present a wearable system for HRV monitoring in horses. Specifically, we first present a validation of a wearable electrocardiographic (ECG) monitoring system for horses in terms of comfort and robustness, then we introduce a preliminary objective estimation of the human-horse interaction. The performance of the proposed wearable system for horses was compared with a standard system in terms of movement artifact (MA) percentage. Seven healthy horses were monitored without any movement constraints. As a result, the lower amount of MA% of the wearable system suggests that it could be profitably used for reliable measurement of physiological parameters related to the autonomic nervous system (ANS) activity in horses, such as the HRV. Human-horse interaction estimation was achieved through the analysis of their HRV time series. Specifically, DTW was applied to estimate dynamic coupling between human and horse in a group of fourteen human subjects and one horse. Moreover, a support vector machine (SVM) classifier was able to recognize the three classes of interaction with an accuracy greater than 78%. Preliminary significant results showed the discrimination of three distinct real human-animal interaction levels. These results open the measurement and characterization of the already empirically-proven relationship between human and horse.

Graphical Abstract

1. Introduction

In the last few decades, the interest in decoding the human-horse relationship and interaction (HHRI) has increased dramatically. This was guided by the strong empirical evidence of the positive outcomes in equine assisted therapy (EAT) and horseback riding in therapeutic programs [1], as well as the positive impact of animal companionship on human quality of life [2], where the equine is an important element of these therapeutic practices, with its feelings and behavior. For this purpose, the investigation of the modality in which both human and horse can communicate might be crucial. Measuring and evaluating the impact of the interaction experience might be relevant [3]. Some studies investigated the equine perception of humans in terms of positive, negative or neutral valence [4]. A study on how human psychological and physiological state can be perceived by horses was performed in [5] via the study of the heart rate. A more relaxed equine behavior was observed when humans showed positive attitudes toward them [6,7], while an equine increased heart rate was observed when humans were engaged in negative thinking [8]. A nervous mood can be transmitted from humans to horses under handling and riding conditions [9]. Voice [10,11,12], posture [13,14], facial expression [15,16], autonomic signals [17,18,19], hormones [20,21,22,23] and pheromones [24] might be used to fruitfully describe and characterize the emotional content [25]. Non-verbal communication between human and horse was also investigated in [26,27]. Heart rate and behavior resulted in being sensitive and reliable indicators of fear or anxiety in horses [28,29]. Horses that are in discomfort were observed to be more aggressive toward humans [30] or to be characterized by an increased heart rate, motor activity and vocalizations [31]. The effect of the gender of the person interacting with the horse was discussed in [32]. Although a recent review described a parallel behavior between the human multi-sensorial perception and the demonstrated equine cross-modal recognition [33,34], an interdisciplinary approach is mandatory to reach a deeper knowledge of human-horse interaction. In fact, these achieved experimental findings pointed out complex and multidimensional aspects of the interaction, which involve medical, bioengineering, physics and veterinary science [2,35,36]. In [9], the heart rate of both human and horse were monitored simultaneously under different experimental handling or riding conditions. In this study, Keeling et al. asserted that the analysis of heart rate is an important tool to investigate horse-human interactions. Again, hormones, heart rate and some standard heart rate variability-related indices were investigated in [20] during both training and performance. Different feature trends were observed between human and horse when they were obtained from ECG (electrocardiographic) recordings related to public or private sessions. A body sensors network technology was used to real-time monitor the horse-rider dyad in [37]. The aim of such a monitoring was evaluating the human-horse interaction. Specifically, based on a study concerning the equine emotional response during physical activity [38], the evaluation was based on the measurements of heart rate and physical activities via a mathematical model. Such a model was proposed to decompose the equine heart rate into two different components. The first one was concerning the physical component, while the second one contained information about equine emotional state [38]. Finally, in [39], the link between horse and human was also investigated by studying their electroencephalograph signals (EEG), revealing a higher synchronicity in EEG waves at increasing interactions. A correlation analysis between human and equine hormone concentrations was performed in [20,21].
Therefore, the human-horse relationship appears to be a complex interaction affected by several psychological factors [40]. The perception of humans by horses seems to be based on experience and repeated interactions, with horses that form a memory of humans that impacts their reactions in subsequent interactions [5]. Hence, previous negative experiences with human contact could lead horses toward a negative emotional reaction [7] or, vice versa, previous positive experience could lead them toward positive feelings with humans [41].
In our hypothesis, human and horse are considered as complex systems that interact through a coupling process. In this frame, we hypothesize that coupling can be modulated by the type and time duration of the contact itself. Specifically, we analyzed the level of coupling by studying their heart rate variability (HRV) time series [42] through dynamic time warping (DTW). As is well known from the literature, HRV can be considered as a non-linear time series, in which complex oscillations are present [43]. Therefore, we aimed at measuring this biological coupling over time [44]. DTW is, generally, used for studying time series dynamics of non-stationary systems. It calculates the best possible warp alignment between two time series, by selecting the one with the minimum distortion. Specifically, DTW is also defined as a measure of similarity between two time series, and it is calculated as the minimum mapping distance between them. DTW was widely used in many contexts, including data mining [45], speech processing [46] and medicine [47].
In this study, DTW was adopted to evaluate how heart activities evolve in a similar or dissimilar way. For example, if during an experiment with increasing exciting levels we detect an increasing DTW between human and equine HRVs, it indicates that the distance of the two HRV dynamics is increasing, and therefore, the heart activities are following different patterns. In order to perform a continuous, comfortable and non-invasive monitoring of the interaction in a natural environment, we developed, and here present, a wearable monitoring system for horses. The amount of advantages that wearable systems have brought to physiological signal monitoring for humans is well known, occupying an even larger space in the research. Moreover, the continuous technological development and the increasing demand of smart systems push wearables as the most used and suitable systems for ubiquitous and pervasive investigations. In addition, their flexibility allows researchers and clinicians to face the large variability of biomedical signals and tasks in monitoring subjects during their daily activities [48,49,50,51,52]. However, the biggest limitation in using wearable systems with humans and animals is due to motion artifacts (MA) [53,54,55,56,57,58], which are the major source of noise in biomedical signal acquisition, inducing the loss and alteration of informative content. For instance, the electrocardiographic (ECG) signal acquired in a naturalistic environment without movement constraints can be severely affected by important artifacts, and a great amount of data might be lost in contrast to the signal quality easily achievable in controlled environments and protocols [59]. As a matter of fact, cardiac stress tests or simply respiration can generate a big amount of MAs that can alter the signal [59]. Moreover, it is important to highlight that restraining horse is usually discouraged since it is unnatural and stressful and induces an increase of the sympathetic contribution of the heart control [60] that leads to misleading ECG interpretations [61]. In this work, we present a textile-based system for the ECG monitoring in horses, where the electrodes are completely made of fabric (electro-textile or e-textile). Normally, textile materials are insulators, but for this application, conductive yarns are integrated into the fabric during the manufacturing process [62]. In the human biomedical field, e-textiles are considered as higher value-added textiles and are prominently developed for being used in smart clothing. Smart clothing refers to a new garment that is able to acquire and process information, as well as actuate responses [63]. The potentialities deriving from these kinds of textile sensors enable the application of wearable systems in a great variety of experimental settings. As a matter of fact, many human studies showed reliable recordings of biomedical signals [64,65,66,67,68]: for example, ECG in [69,70,71,72,73,74,75,76], respiration in [69,70,73,74,77,78,79], electrodermal response (EDR) in [51,80] and, finally, PhotoPlethysmoGraphy (PPG)and blood pressure in [81,82]. In this kind of application, physiological signals are monitored and recorded in order to evaluate or follow the health status of the person who is wearing the wearable device [48,83].
Similarly in the veterinary research field, some authors [84,85,86,87] proposed to use Holter devices in equine applications and subsequently systems with radiotelemetry. Here, we propose the use of wearable systems in both animals and humans simultaneously, in order to acquire their cardiac activity in a reliable and artifact-free way, as was generally demonstrated in [72,88,89,90,91,92]. The aim is to infer autonomic nervous system responses enabling the detection of uncontrolled responses of animals when elicited with emotional stimuli coming from humans and vice versa. The manuscript is organized as follows: Section 2 deals with the materials’ and methods’ description; specifically, it describes the wearable systems, the experimental protocol of the interaction and the signal processing chain. Section 3 reports the achieved results, and Section 4 is focused on the discussion and conclusion of the study highlighting the future perspectives of this pioneering work.

2. Materials and Methods

In this study, two wearable monitoring systems, i.e., one for humans and the other for horses, were employed. Each system was comprised of a smart garment and portable electronics. The human system (Figure 1) was designed as a sensorized t-shirt (Smartex, Pisa, IT, Italy), and it is exhaustively described in [48,79,93,94,95]. Differently, the equine system (Figure 2) was comprised of an elastic smart belt (Smartex, Pisa, IT, Italy) [89,91] fastened around the chest behind the shoulder area. In both systems, two textiles electrodes (Smartex, Pisa, IT, Italy) and a strain gauge sensor (Smartex, Pisa, IT, Italy) were integrated to acquire the ECG (with a sampling frequency of 250 Hz) and respiration activity (with a sampling frequency of 25 Hz). The strain gauge is carried out by textile sensors that monitor the cross-sectional variations of the rib cage. The respiration sensor along with electrodes are integrated in an elastic band through a one-step process in the fabric by means of a circular knitting machine [96]. They are developed by Smartex s.r.l.; many details can be found in [92,96]. Moreover, equine ECG was recorded by placing the electrodes according to the modified base-apex configuration [97]. It is worthwhile to note that the use of a dry textile-based electrode provides several advantages. Firstly, the system is easy to use through an automatic placement of the sensors and allows high comfort. Secondly, electrodes are made of a special multilayer structure of textile material that increases the amount of sweat and reduces the rate of evaporation reaching very rapidly an electrochemical equilibrium between skin and electrode. This means that the signal quality [72] is remarkably improved and kept as constant as possible. These materials are knitted together and are fully integrated in the garment without any mechanical and physical discontinuity, creating areas with different functionalities (see Figure 1). For each system, the two ECG e-textile electrodes and the strain gauge sensor are finally connected to portable electronics through a simple plug that can be easily unplugged when necessary.
Moreover, an inertial platform (triaxial accelerometer) (Smartex, Pisa, IT, Italy) integrated into the portable electronics that was positioned on the back of the horse allowed the monitoring of the horse’s physical activity at a sampling frequency of 25 Hz. Finally, the wearable system was wirelessly connected to a smartphone where a dedicated app enabled checking the status of the sensors and remotely controlling the storing process of the physiological information in a secure digital (SD) card.

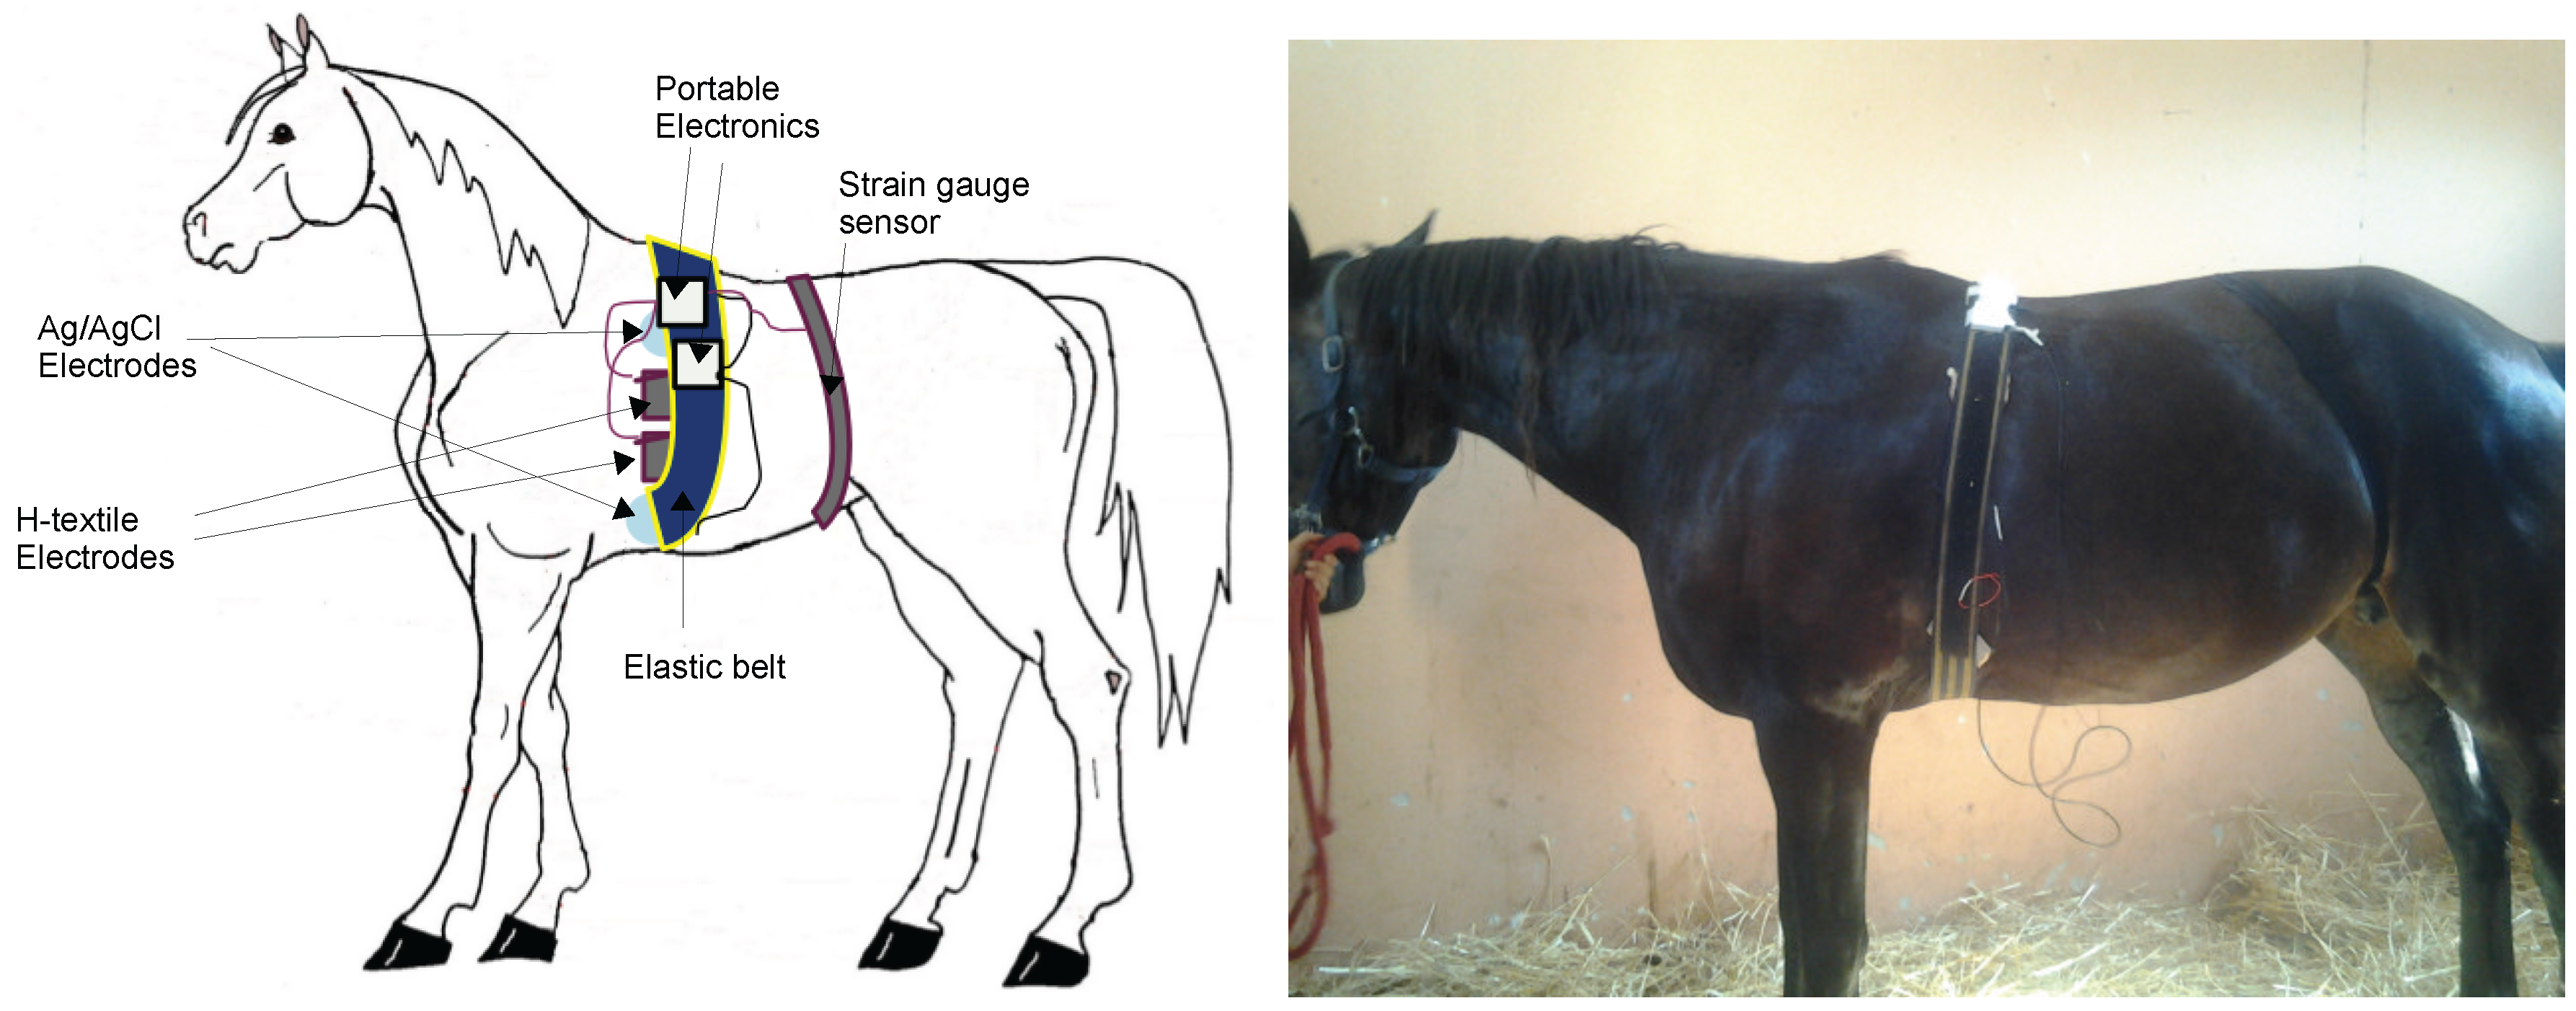
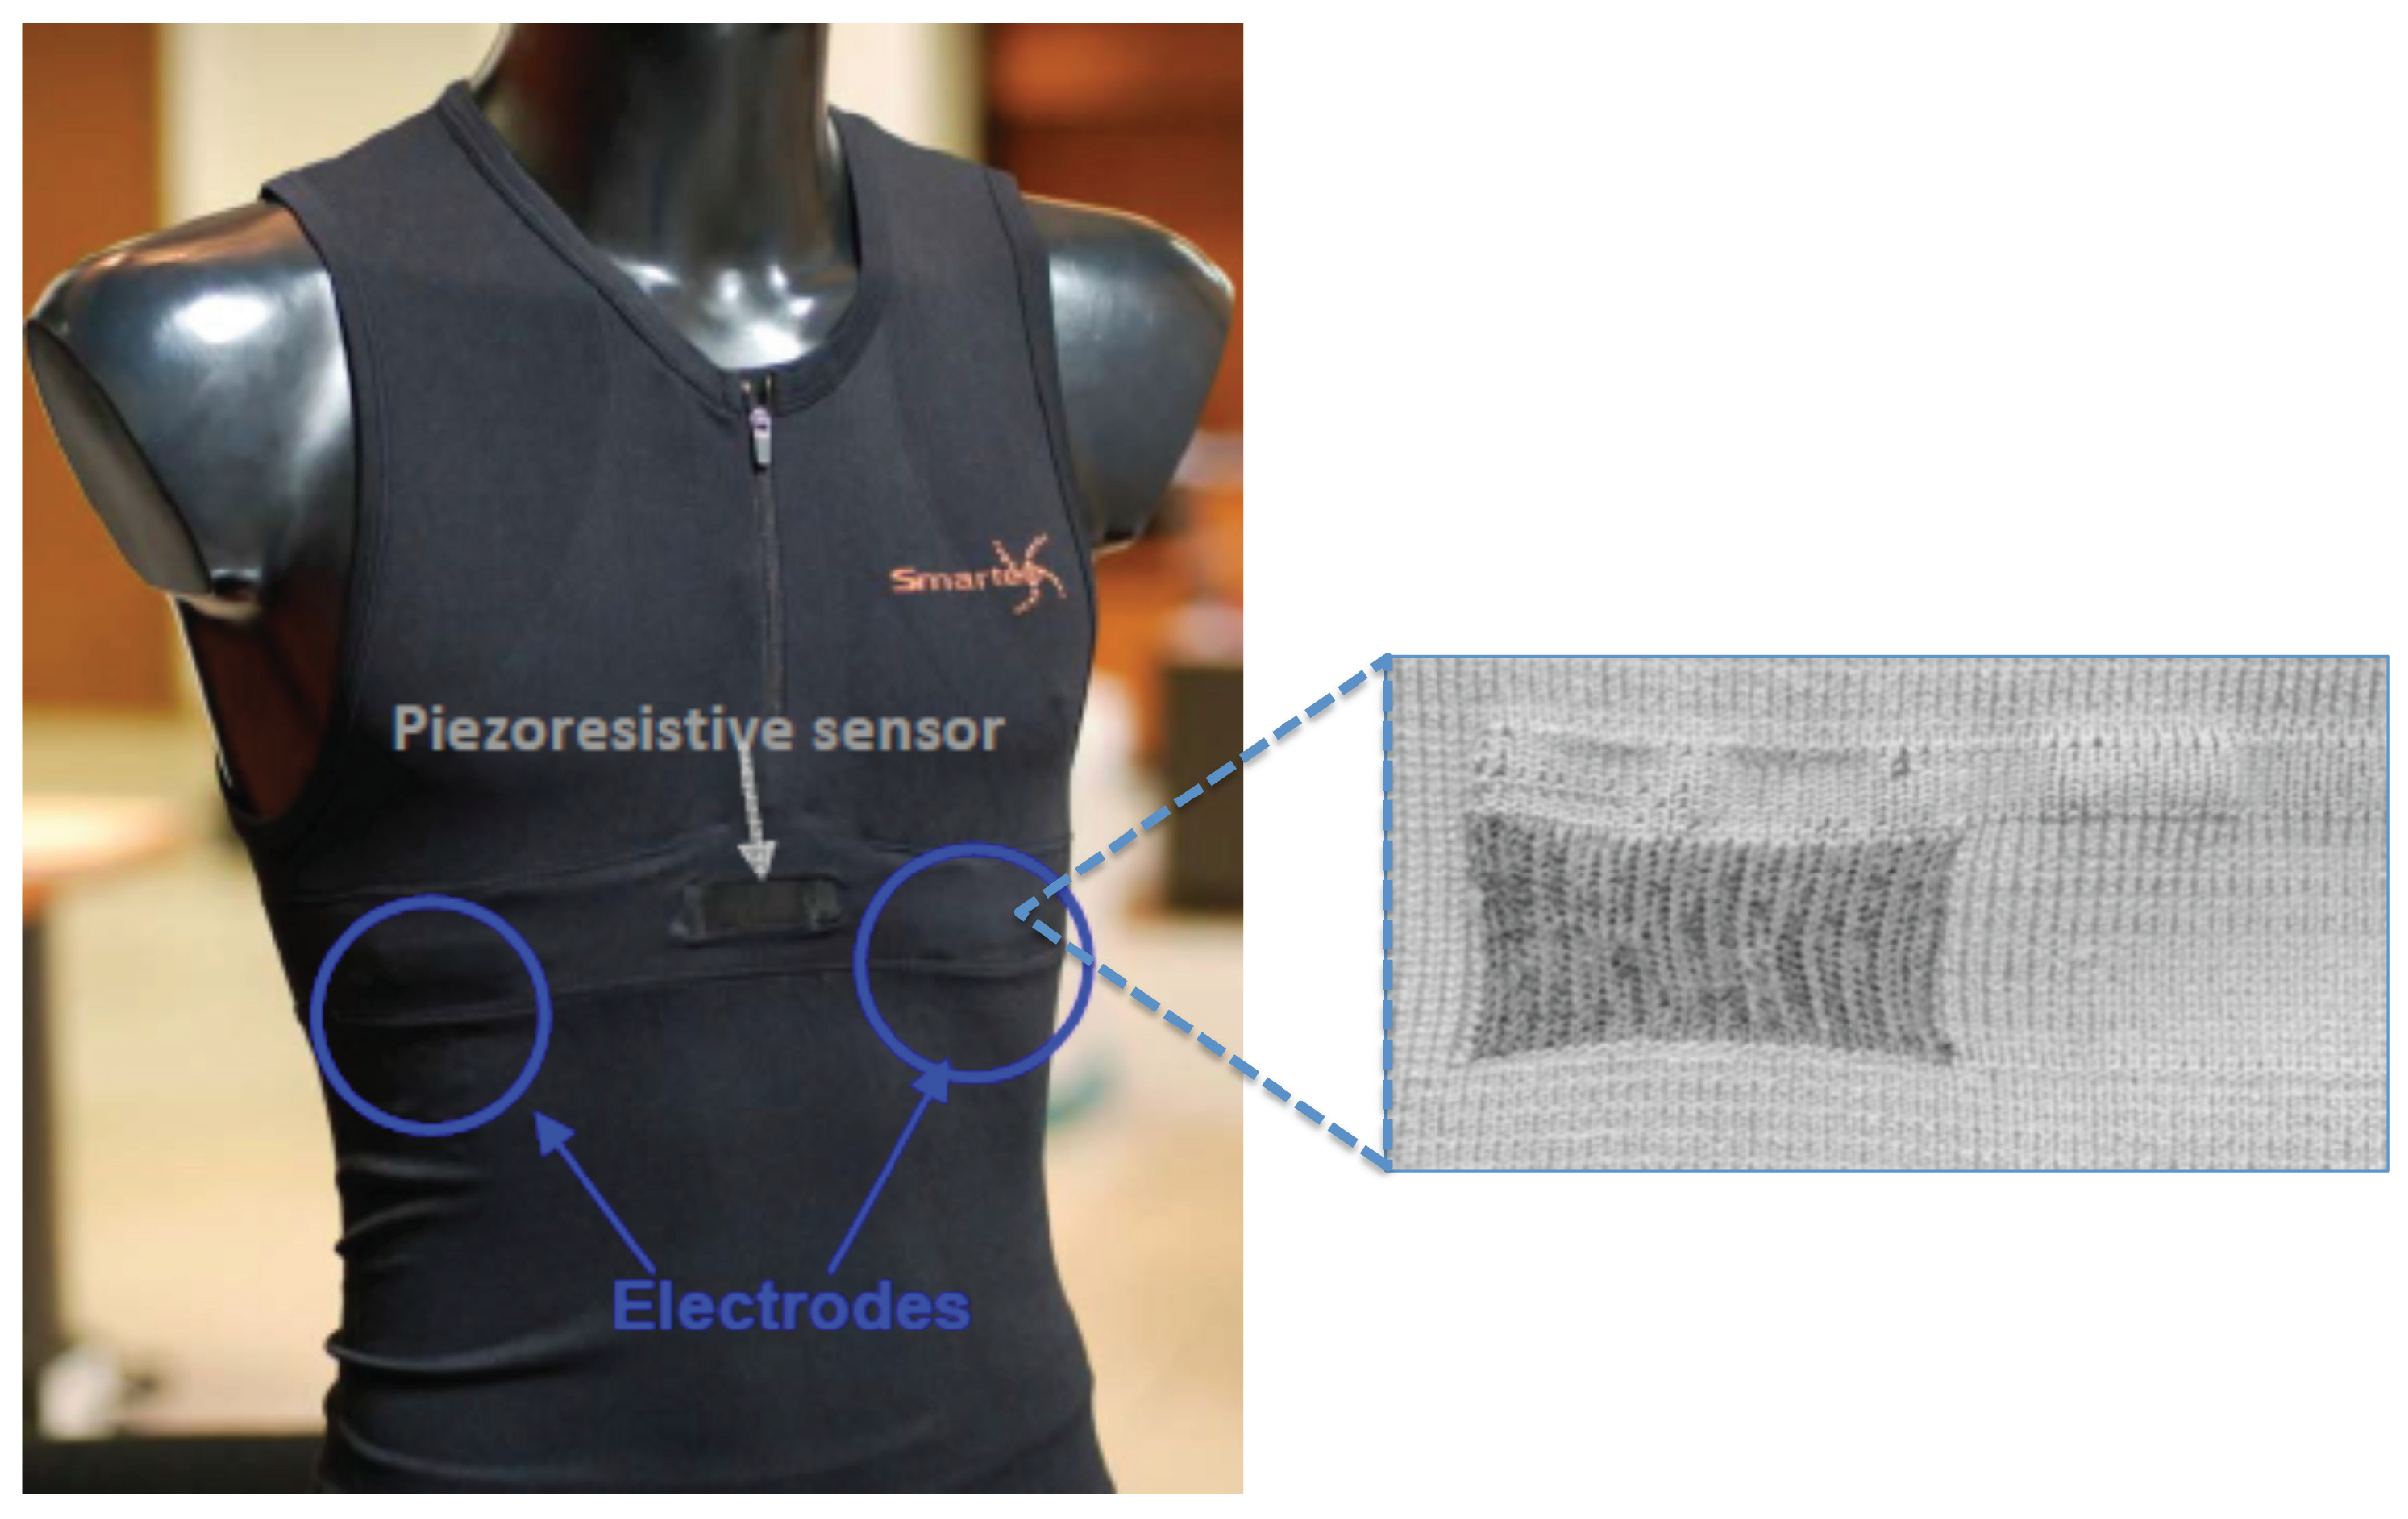
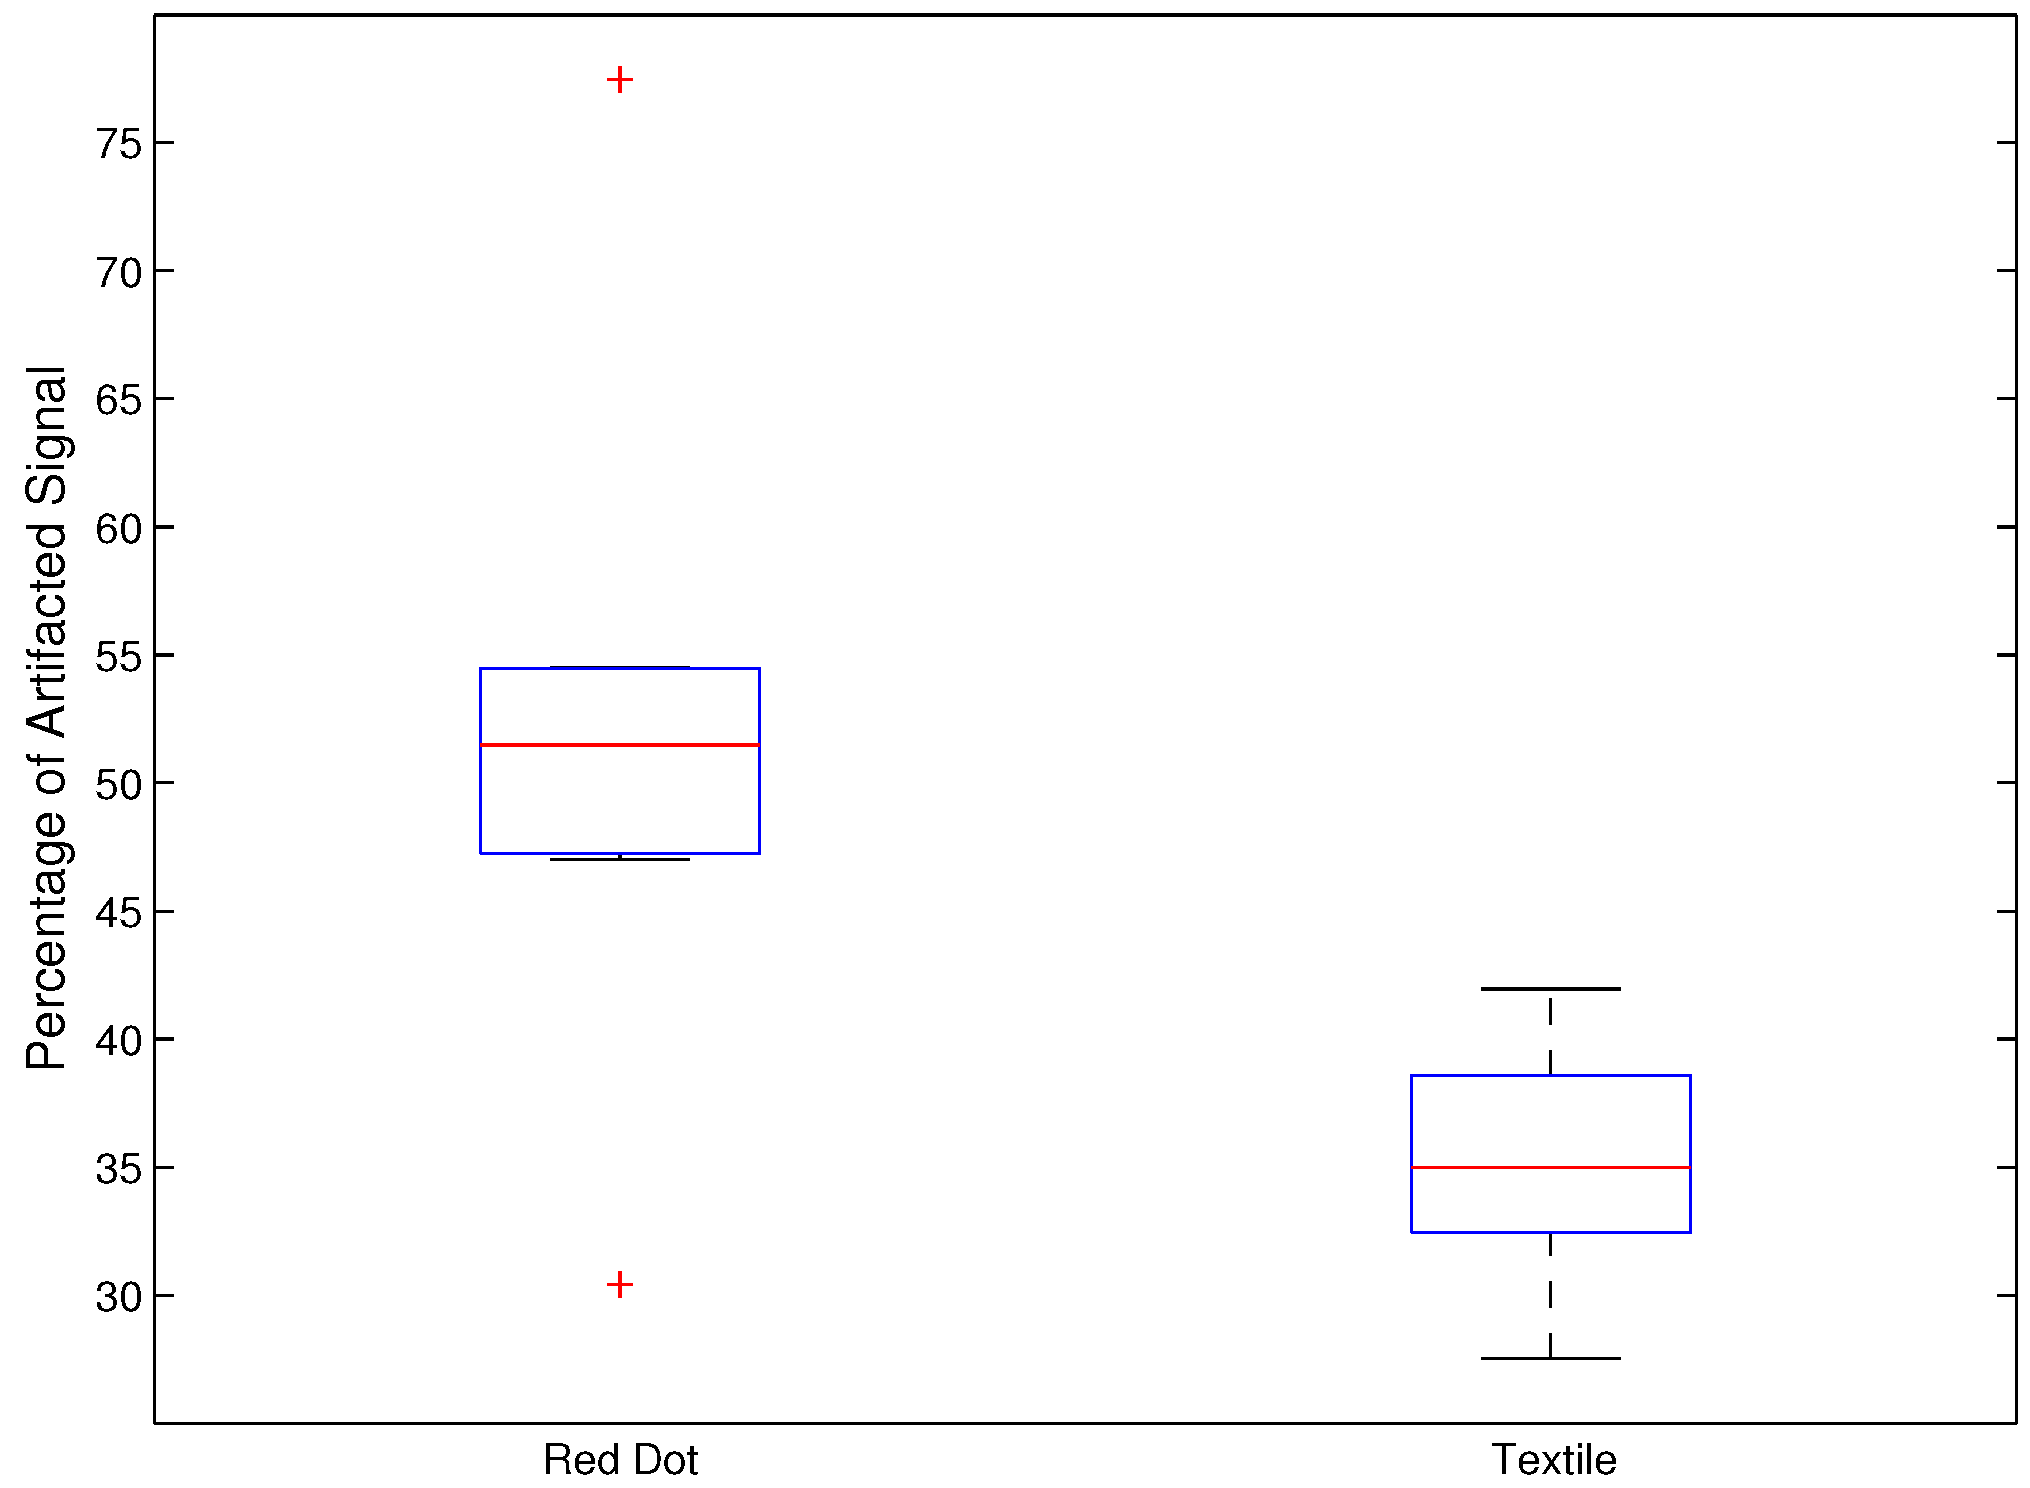
2.1. Equine Textile-Based ECG: Test and Validation

This section is focused on testing and validating the reliability of the equine ECG traces coming from textile electrodes. For this study, seven healthy standard bred mares in anestrus (mean age 8.4 ± 1.3 years) were enrolled. Equine subjects were socially housed in a paddock (75 × 75 m) and were provided ad libitum access to both hay and water. Horses were used as receivers in the embryo transfer program of the Department of Veterinary Sciences (University of Pisa, Italy) where this study was performed. Mares were in healthy condition and not pregnant at the time of this protocol.
The signal quality test of e-textile electrodes was performed by means of a comparative study in terms of the motion artifact (MA) between e-textiles and conventional Ag/AgCl electrodes. Each horse was simultaneously monitored by the wearable system, i.e., equine elastic smart belt and Ag/AgCl electrodes (see Figure 2). Two identical electronics were employed for both couples of electrodes Ag/AgCl and the textile ones. All data were acquired in a stall (4 × 4 m), where horses were left free to spontaneously move for 60 min. At the end of the recording session, all of the acquired ECGs were visually examined by one expert, and all of the ECG segments, corrupted by MAs, were marked. The goal was the estimation of the percentage of corrupted signal. Such a percentage was calculated as the sum of the time intervals in which an MA was observed over the whole time length of the recording.
A nonparametric Wilcoxon signed-rank test for paired samples was used to compare the percentage of corrupted signals between the signals acquired by the two kinds of electrodes, i.e., e-textile and Ag/AgCl. Specifically, the test was designed to compare the performance of the two kinds of electrodes while simultaneously recording the heart activity of each horse. A significant result of such a test would indicate a coherent different percentage of corrupted signal between the traces acquired by means of the two kinds of electrodes.

2.2. Protocol of Interaction

Here, the design of the interaction protocol is reported. Fourteen subjects (25 ± 3 years old, 4 males) were enrolled. The participants did not show any past or current experience of mental or personality disorder. In addition, one standard bred mare out of the seven previously described was enrolled (age: 8 years, weight: 560 kg, height: 160 cm). Informed consent was signed by the participants according to this specific protocol approved by the Ethical Committee of the University of Pisa.
During the whole experimental protocol, the autonomic nervous system (ANS) response of both human and horse were monitored. Specifically, two different systems were used to acquire the ECG signal. The fabric-based monitoring system [48,79,93,94,95] was used to record the human ECG, while the elastic smart belt [89,91] was used to record the equine one.
The experimental protocol consisted of three phases, each one lasting 4 min. During the first phase, P 1 , the human and the mare were in different stalls (4 × 4 m). In this phase, considered as the resting phase, the subject sat on a chair, while the horse was free to move. Successively, the horse was moved from her stall to the human’s. In this phase, P 2 , the subject was asked to keep himself/herself still on the chair, while the horse was free to move and explore the environment. This phase implies a visual and olfactory interaction. Finally, in the third phase, P 3 , all of the participants were asked to stand up and groom the horse. It is worthwhile to note that in order to keep the visual conditions of the horse as constant as possible, all of the subjects were asked to wear an azure plain t-shirt.

2.3. Signal Processing Chain for Human-Horse Interaction

This section deals with the description of the signal processing chain, which can be summarized in three steps. First, the HRV of both human and horse were estimated. Then, the DTW coupling index is computed. Finally, in the third step, the statistical analysis of DTW in the three sessions and the pattern recognition of the three phases is performed.

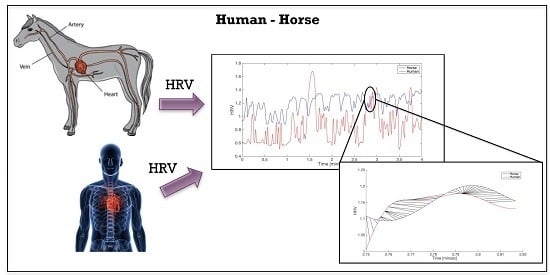
2.3.1. Heart Rate Variability Estimation

HRV is considered to be one of the most important ANS-related series. HRV describes the variations in the beat-to-beat intervals or in the instantaneous heart rate, since it reflects the regulatory mechanism of the cardiac activity by the ANS [98]. ANS is divided into sympathetic and parasympathetic branches. According to a simple model, sympathetic activity is responsible for the increasing of the heart rate (HR) and of the decreasing of HRV, while parasympathetic activity is usually considered to be in charge of decreasing HR and increasing HRV [99]. Many studies have focused on the significant relationship between ANS and HRV. Specially, frequency domain indexes, e.g., the LF/HF ratio (i.e., it is the ratio between the power in the low frequency bandwidth and the power in the high frequency bandwidth), have been deeply investigated [100], as well as temporal [19], spectral [101] and non-linear [102,103,104] indices. Several tools have been developed for its analysis [105], since its estimation is quite simple. In fact, HRV can be estimated as the series obtained from the interpolation of the beat-to-beat distances, i.e., RR distances (i.e. it means the distance between consecutive R-peaks of QRS complex). For this purpose, ECG signals were first of all digitally filtered with a zero-phase Butterworth infinite impulse response band-pass filter with cut-off frequencies between 0.5 and 40 Hz. Then, different R-peak detection algorithms were used to process human and equine ECG signals with the aim of estimating the HRV. More precisely, R-peaks related to the human ECG signals were detected by means of the well-known Pan–Tompkins method [106], while the method proposed in [91] was used to detect the R-peaks in the equine ECG signals. The Pan–Tompkins method [106] is an algorithm based on a pre-processing phase, including band-pass filtering, squaring of the data samples and moving average filtering, and on a decision rule phase, which includes an amplitude threshold to detect R-peaks. Differently, the algorithm proposed in [91] to detect R-peaks in equine ECG was based on the estimation of the energy of the second derivative of the ECG signal. R-peaks were detected by performing a thresholding of the obtained energy-signal. Finally, a cubic spline interpolation was applied to the irregular RR sampled series with a new sampling frequency equal to 10 Hz [105]. To do that, the cubic spline interpolation was used to create an evenly-distributed sampled series. This procedure is necessary since RRseries are irregularly sampled, due to the physiological variability of the heart activity, and an evenly-distributed sampled series is a mandatory condition in several analyses. Then, since the RR interval sampling frequency is usually chosen among 2, 4, 6, 8 and 10 Hz [107], we decided to obtain a sampling frequency equal to 10 Hz as performed in [108,109]. In fact, according to [107], it is important to highlight that the bandwidth within which the autonomic nervous system has a significant response is 0–1 Hz.

2.3.2. Feature Estimation

This section reports on the computation of the dynamic time warping [110]. DTW is usually used for studying time series dynamics of non-stationary systems. It computes the best possible warp alignment between two time series, by selecting the one with the minimum distortion. DTW was widely used in many contexts including data mining [45], speech processing [46] and medicine [47]. Specifically, DTW is a measure of the similarity between two temporal series. To estimate it, a temporal non-linear warping is performed to find the optimal match between the two sequences. In this frame, given two sequences, x and y of length N and M, respectively, it is possible to define a (N,M)-warping path as a sequence p = ( p 1 , . . . , p L ) , with p l = ( n l , m l ) [ 1 : N ] × [ 1 : M ] for l [ 1 : L ] , able to align the elements of x and y. Such an alignment assigns the element x n l of x to the element y m l of y. Hence, the total cost c p ( x , y ) of a warping-path p between x and y can be defined, with respect to the local cost measure or local distance measure c, as reported in Equation (1).
c p ( x , y ) = l = 1 L c ( x n l , y m l )
Finally, the optimal warping path between x and y is the warping path p corresponding to the minimal total cost. DTW distance is defined as the cost of p , according to (Equation (2)):
DTW ( x , y ) = c p ( x , y ) = min ( c p ( x , y ) )
where p is a (N,M)-warping path. This means that a low DTW distance implies a short warping path, which results in a higher similarity between the two time series.
In this study, DTW is used to estimate the degree of similarity/dissimilarity between the two subjects’ heart activities (i.e., horse and human), as well as the degree of similarity/dissimilarity among all of the phases within each single subject (i.e., only human or horse). To this aim, the DTW method is applied to both human and horse HRV series.

2.3.3. Statistical Analysis and Pattern Recognition

A Wilcoxon signed rank test for paired data was used to compare the features estimated during the different phases of the experimental protocol. All of the possible combinations of the 2-class problems were taken into account. Specifically, the DTW, estimated between human and horse in each phase, was compared with the one obtained from the other phases, i.e., P 1 vs. P 2 , P 1 vs. P 3 and P 2 vs. P 3 , to evaluate possible statistically-significant differences between the human-horse interactions occurring during the different phases. Moreover, DTW was also estimated among the HRV series of each single enrolled subject between the different phases, i.e., only horse and only human. In this case, we aimed at comparing the degree of similarity/dissimilarity passing through the different phases within the same subject. A correction factor for multiple comparisons was applied according to the Benjamini and Hochberg method [111]. Such a correction was necessary to cope with the rate of Type I errors in null hypothesis testing when conducting multiple comparisons. The Benjamini and Hochberg method, which is a false discovery rate (FDR)-controlling procedure, takes into account the expected proportion of rejected null hypotheses that were incorrect rejections (“false discoveries”) [111]. A significance level equal to 0.05 was used.
The classification process was performed by means of a supervised learning method, which aimed at performing the recognition of the experimental phases, i.e., the human-horse interaction, and evaluating the discriminant power of the DTW feature, as estimated between human and horse. Specifically, we implemented a support vector machine (SVM) classifier, with a radial-based kernel function (see Equation (3)):
K ( x , x ) = exp ( - γ | x - x | 2 )
where γ is equal to 1 and x and x stand for the two samples. Moreover, a Leave-One-Subject-Out (LOSO) architecture was developed to apply our pattern recognition approach on the estimated DTW. Of note, the LOSO architecture is appositely designed to test the developed classifier on untreated and unknown data. Specifically, if N is the number of enrolled subjects (in this case, N = 14 ), the classifier is trained N - 1 times on the N - 1 subjects and, therefore, tested on the remaining 1 subject. To this aim, first of all, the data related to each subject were Z-transformed and then given as input to the LOSO architecture.

3. Results

3.1. Results of the E-Textiles’ Validation and Testing

The percentages of artifact signal recorded both by using Ag/AgCl electrodes and e-textile electrodes were estimated. Such an estimation was performed by manually placing the labels. A person with experience in the field of equine cardiology was in charge of this issue. The obtained results are displayed in Table 1.
In addition, a non-parametric Wilcoxon signed-rank test for paired samples was implemented to analyze the statistical significance of the differences observed between the two kinds of electrodes in terms of the percentage of corrupted signal. A significant p-value equal to 0.0156 was achieved (Figure 3). This indicated a statistically-significant difference between the performance of the two kinds of electrodes. In fact, as is easily detectable in Figure 3 and in Table 1, the percentage of corrupted signal was significantly lower when ECG traces were recorded via e-textile electrodes.

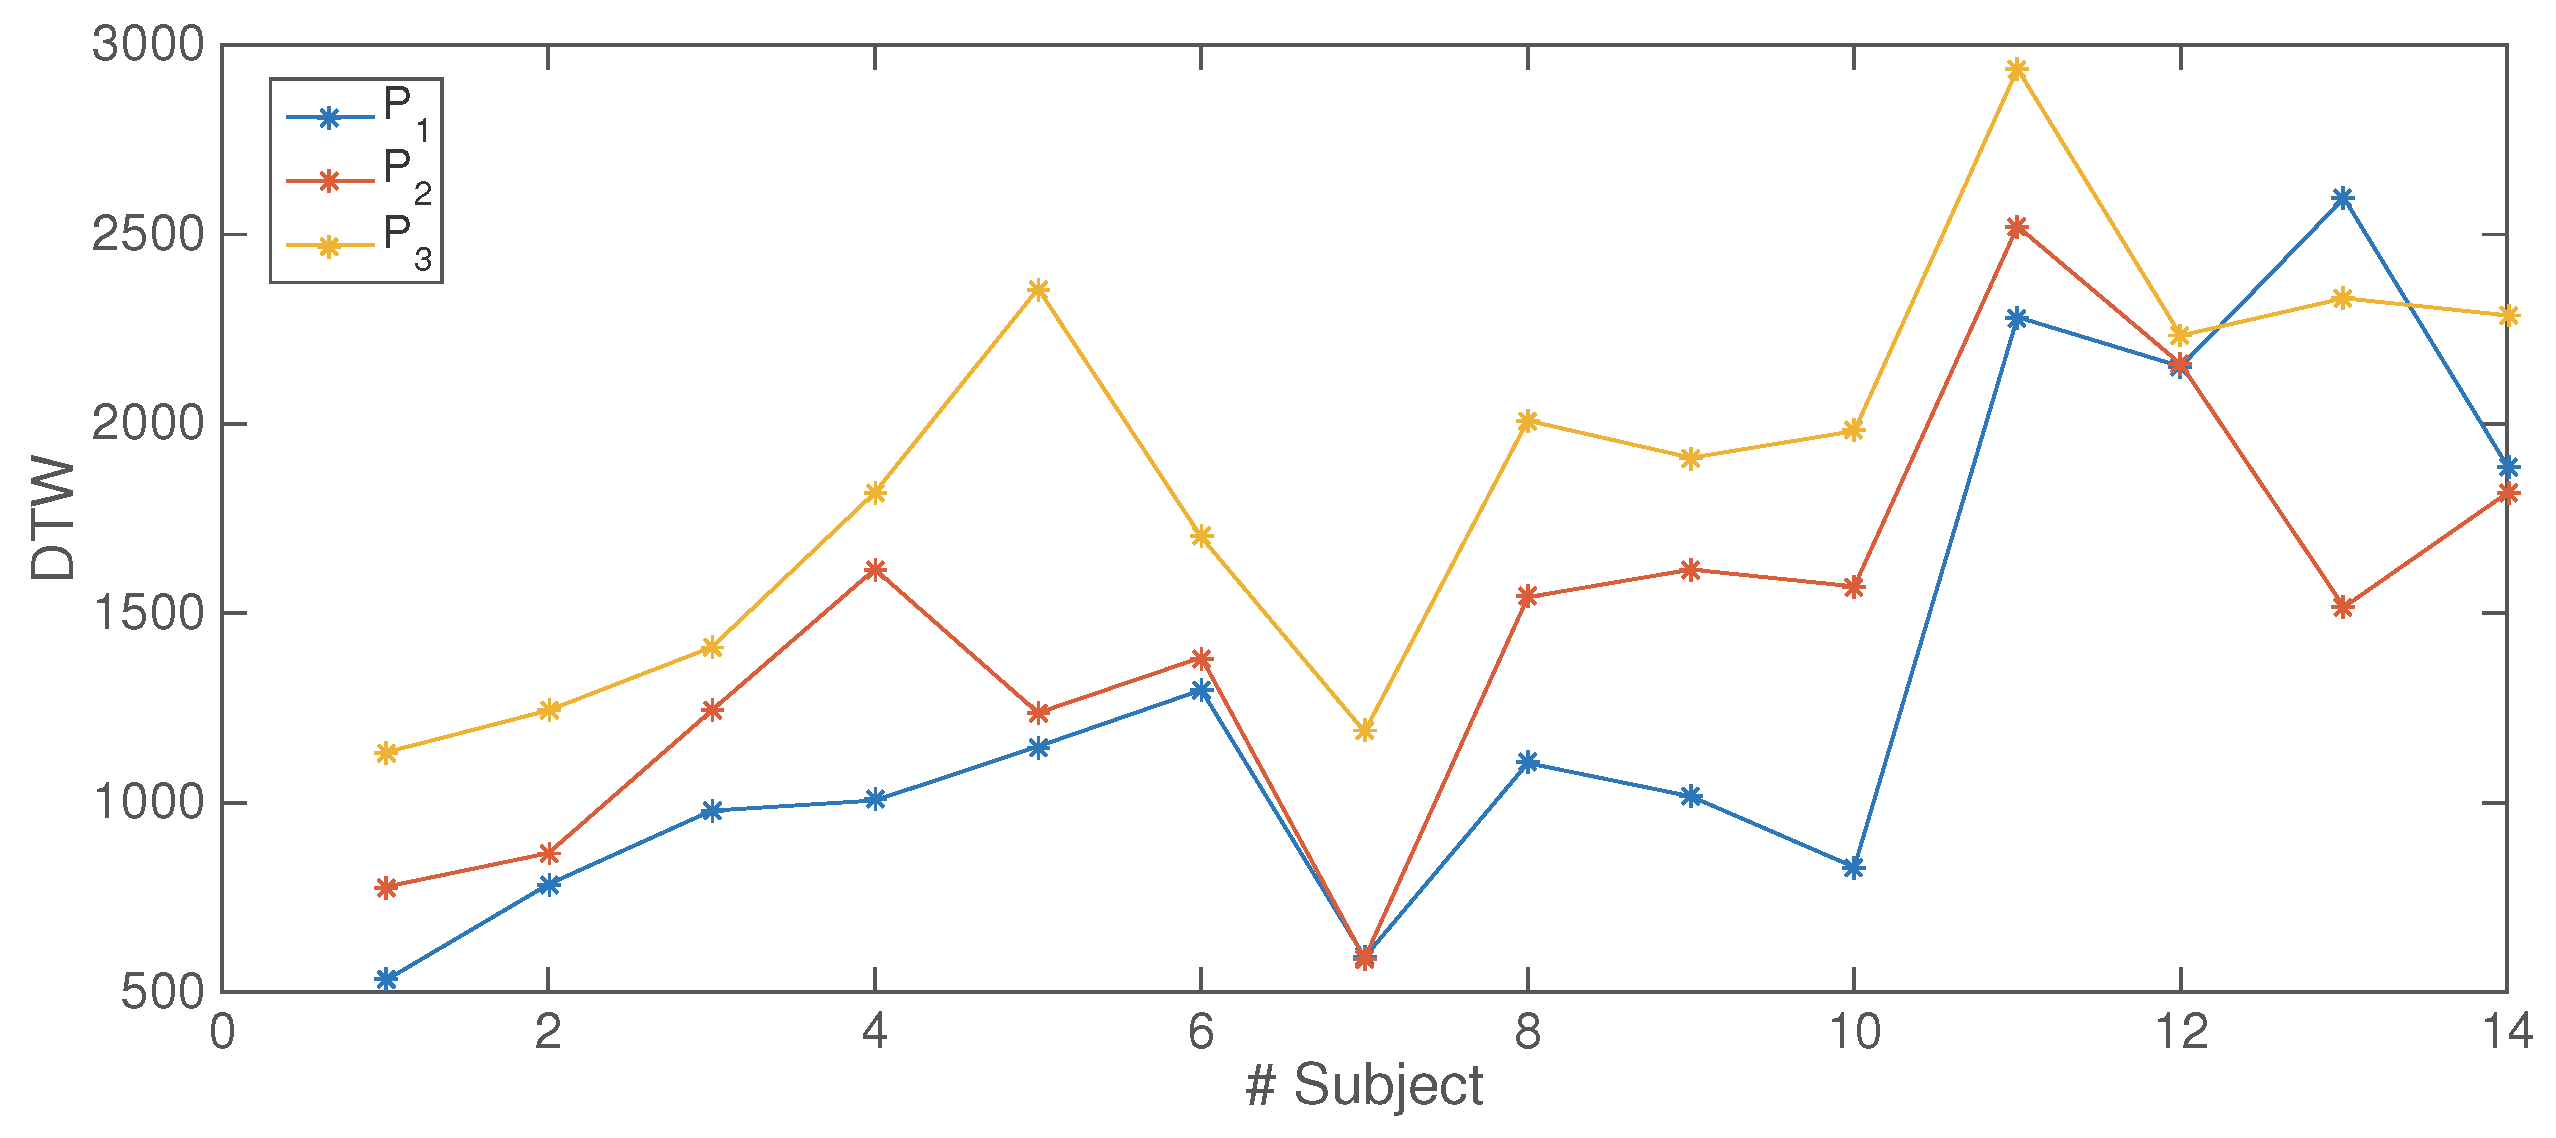
3.2. Results of the Human-Horse Interaction

In Figure 4, an example of two HRVs estimated from both equine and human ECG traces is shown. There, it is possible to observe, within a smaller signal portion, how warping-paths are defined.
The statistical analysis performed on the DTW estimated between the human and equine HRV traces of the three different phases is reported in Table 2 in terms of p-values. All of the pairwise comparisons between different phases were statistically significantly different after performing the p-value correction via the Benjamini and Hochberg method. Specifically, as highlighted in Table 2 by means of the rising arrows, a loss of similarity, i.e., an increased DTW distance value, can be observed as the human-horse interaction becomes progressively stronger. These trends can be also observed in Figure 5. In fact, in 12 out of 14 subjects, the DTW value can be observed to be lower or equal in P 1 compared to in P 2 , i.e., human and equine HRV are more similar in the P 1 phase than in P 2 . In 12 out of 14 subjects, the DTW value can be detected to be higher in the P 2 phase than in P 1 , but lower than in P 3 , while 12 out of 14 subjects show a higher DTW value in the P 3 phase with respect to the other ones.
In Table 3, the statistical results obtained by comparing only the human DTW and only horse DTW, separately, between the different phases are reported. Observing the reported p-values and arrows, a significant difference is reported for horse DTW between P 1 P 2 and P 2 P 3 with a higher value for the P 2 P 3 . For humans, a significant difference was found in the comparison of DTW between P 1 P 2 and P 1 P 3 , showing a higher value for the P 1 P 3 , and the comparison of DTW between P 1 P 3 and P 2 P 3 , showing a higher value for the P 1 P 3 . These results seem to show that the P 3 phase is the more responsive for both humans and horses.
The results of the pattern recognition are returned as a confusion matrix (Table 4). In the main diagonal, each element represents the correct recognition percentage. Upper and lower triangular matrices report the percentage of incorrect recognition. The overall accuracy is about 85 . 71 % .

4. Discussion and Conclusions

The objective of the study here presented was two-fold: the first one was to investigate the reliability of using wearable systems for monitoring physiological signal in horses; the second objective was to estimate and quantify the human horse interaction in a specific experimental protocol. As a matter of fact, concerning the first objective, the obtained results showed that the e-textile-based system outperformed the standard monitoring one, in terms of comfortability and reduction of the amount of movement artifacts. This latter one was demonstrated by the comparison of the blind visual inspection performed by an expert applied to both signals. Specifically, an amount of 7 h of equine ECG recording was analyzed, and the statistical analysis showed that ECG signals acquired with the textile electrodes had a lower percentage of corruption, revealing a greater robustness against movement artifacts. It is worthwhile to note that textile-based wearable monitoring systems offer interesting advantages in horse applications. In fact, it resulted in being very easy to use and very comfortable, and it could be automatically placed without any adhesive, glue and adhesive bandages. Furthermore, the multilayer structure of the textile electrode increased the amount of sweat and reduced the rate of evaporation, reaching an optimal electrochemical equilibrium between skin and electrode, rapidly. As a matter of fact, the signal quality was notably improved and kept as constant as possible. Moreover, wearable systems allow us to reliably monitor heart activity and parameters related to the involvement of ANS activity also without any restriction of movement. Indeed, it is possible to record an artifact-free ECG that enables non-linear signal processing techniques’ application to horse’s HRV signal. This allowed us to perform an objective measurement of the complex ANS responses for the investigation of human-horse interaction over a temporal dynamic evolution. Specifically, by analyzing the dynamic of the HRV of both human and horse, a similarity estimator, i.e., DTW, has been studied to describe different interaction phases. DTW comparisons for horse showed that the transition from P 2 to P 3 is more significant with respect to the transition from P 1 to P 2 , whilst for humans, we found that the difference between P 1 P 3 is higher than both P 1 P 2 and P 2 P 3 . These results seem to show that the P 3 phase is the more responsive for both humans and horses. Moreover, the achieved results in the horse-human DTW estimation showed that it was able to significantly discriminate all of the three phases of the experimental protocol. Furthermore, a significantly continuous increment from P 1 to P 2 and then to P 3 was observed in human-horse DTW. This may indicate a monotonic variation of the coupling between the human and horse cardiovascular systems. Specifically, as highlighted in Table 2, a loss of similarity, i.e., an increasing DTW distance value, can be observed as the human-horse interaction changes. These trends can be also observed in Figure 5. In fact, almost all of the involved subjects showed a DTW value lower in P 1 than in P 2 and than in P 3 . A possible justification of this phenomenon could be found in the nature of the interaction. Probably, when human and horse are in physical contact, human and horse may suspiciously behave with a decrease of similarity and an increase of the distance between the two heart activities. The ability of the classification procedure of recognizing all of the three phases (i.e., accuracy greater than 85%) means that there exists a hyperplane able to differentiate these phases, whose distribution is not explained only by statistics, but it could be due to a non-linear dataset configuration in the feature space [112]. As a matter of fact, the achieved results are not sufficient, at the moment, to generalize and confirm the described phenomena. Hence, an increased number of measures, including further variables, is needed to clarify the phenomena involved in the human-horse interaction. In conclusion, this work poses the basis for the application of novel high level signal processing techniques for stationary and non-stationary signals [113,114], already used in investigating human-to-human interaction [115,116,117], to animals, and particularly to horses, in order to objectively reveal interesting responses of both the central and autonomic nervous system (ANS) for a particular uncommon stimulation. Moreover, the achieved results lead us to conclude that a quantitative measure of the human-horse interaction is viable, and it could be very effective in many fields of application, for example in therapy assisted by equine (EAT) [2,118] or for controlling the effect of therapeutic horseback riding [119]. In this field, our paradigm could permit analyzing the emotional interaction of a human patient with a “standardized horse” (a horse specifically trained and managed to create a controlled positive emotional background with a human). From a research point of view, these results can open a new scenario in which the emotional interaction [120] between human [121] and horse may be detectable and measurable, thus extending the current knowledge on comparative neuroscience.

5. Ethical Statement

This study was carried out in accordance with the recommendations in the Italian Animal Care Act (Decree Law 116/92). The experimental protocols were approved by the Ethics Committee on Animal Experimentation of the University of Pisa. Consent to participation in the test was signed by each horse owner.

Author Contributions

All authors contributed equally to this work.

Conflicts of Interest

The authors declare no conflict of interest.

References

  1. Anderson, M.K.; Friend, T.H.; Evans, J.W.; Bushong, D.M. Behavioral assessment of horses in therapeutic riding programs. Appl. Anim. Behav. Sci. 1999, 63, 11–24. [Google Scholar] [CrossRef]
  2. Schultz, P.N.; Remick-Barlow, G.; Robbins, L. Equine-assisted psychotherapy: A mental health promotion/intervention modality for children who have experienced intra-family violence. Health Soc. Care Community 2007, 15, 265–271. [Google Scholar] [CrossRef] [PubMed]
  3. Hausberger, M.; Roche, H.; Henry, S.; Visser, E.K. A review of the human–horse relationship. Appl. Anim. Behav. Sci. 2008, 109, 1–24. [Google Scholar] [CrossRef]
  4. Waiblinger, S.; Boivin, X.; Pedersen, V.; Tosi, M.V.; Janczak, A.M.; Visser, E.K.; Jones, R.B. Assessing the human–animal relationship in farmed species: A critical review. Appl. Anim. Behav. Sci. 2006, 101, 185–242. [Google Scholar] [CrossRef]
  5. Fureix, C.; Jego, P.; Sankey, C.; Hausberger, M. How horses (Equus caballus) see the world: Humans as significant objects? Anim. Cogn. 2009, 12, 643–654. [Google Scholar] [CrossRef] [PubMed]
  6. Chamove, A.S.; Crawley-Hartrick, O.J.; Stafford, K.J. Horse reactions to human attitudes and behavior. Anthrozoös 2002, 15, 323–331. [Google Scholar] [CrossRef]
  7. Lesimple, C.; Fureix, C.; Menguy, H.; Hausberger, M. Human direct actions may alter animal welfare, a study on horses (Equus caballus). PLoS ONE 2010, 5. [Google Scholar] [CrossRef]
  8. Hama, H.; Yogo, M.; Matsuyama, Y. Effects of stroking horses on both humans’ and horses’ heart rate responses1. Jpn. Psychol. Res. 1996, 38, 66–73. [Google Scholar] [CrossRef]
  9. Keeling, L.J.; Jonare, L.; Lanneborn, L. Investigating horse–human interactions: The effect of a nervous human. Vet. J. 2009, 181, 70–71. [Google Scholar] [CrossRef] [PubMed]
  10. Koolagudi, S.G.; Rao, K.S. Emotion recognition from speech: A review. Int. J. Speech Technol. 2012, 15, 99–117. [Google Scholar] [CrossRef]
  11. Guidi, A.; Vanello, N.; Bertschy, G.; Gentili, C.; Landini, L.; Scilingo, E.P. Automatic analysis of speech F0 contour for the characterization of mood changes in bipolar patients. Biomed. Signal Process. Control 2015, 17, 29–37. [Google Scholar] [CrossRef]
  12. Guidi, A.; Scilingo, E.; Gentili, C.; Bertschy, G.; Landini, L.; Vanello, N. Analysis of running speech for the characterization of mood state in bipolar patients. In Proceedings of the 2015 AEIT International Annual Conference (AEIT), Naples, Italy, 14–16 October 2015.
  13. Bianchi-Berthouze, N.; Cairns, P.; Cox, A.; Jennett, C.; Kim, W.W. On posture as a modality for expressing and recognizing emotions. In Proceedings of the Emotion and HCI Workshop at BCS HCI London, London, UK, 11–15 September 2006.
  14. Baragli, P.; Gazzano, A.; Martelli, F.; Sighieri, C. How Do Horses Appraise Humans’ Actions? A Brief Note over a Practical Way to Assess Stimulus Perception. J. Equine Vet. Sci. 2009, 29, 739–742. [Google Scholar] [CrossRef]
  15. Ekman, P. Facial expression and emotion. Am. Psychol. 1993, 48, 384–392. [Google Scholar] [CrossRef] [PubMed]
  16. Keltner, D.; Ekman, P.; Gonzaga, G.C.; Beer, J. Facial expression of emotion. Am. Psychol. 1993, 48, 173–183. [Google Scholar]
  17. Ekman, P.; Levenson, R.W.; Friesen, W.V. Autonomic nervous system activity distinguishes among emotions. Science 1983, 221, 1208–1210. [Google Scholar] [CrossRef] [PubMed]
  18. Pluta, M.; Osiński, Z. Variability of heart rate in primitive horses and their relatives as an indicator of stress level, behavioral conduct towards humans and adaptation to living in wild. Bull. Vet. Inst. Pulawy 2014, 58, 495–501. [Google Scholar] [CrossRef]
  19. Nardelli, M.; Valenza, G.; Greco, A.; Lanata, A.; Scilingo, E.P. Recognizing emotions induced by affective sounds through heart rate variability. IEEE Trans. Affect. Comput. 2015, 6, 385–394. [Google Scholar] [CrossRef]
  20. von Lewinski, M.; Biau, S.; Erber, R.; Ille, N.; Aurich, J.; Faure, J.M.; Möstl, E.; Aurich, C. Cortisol release, heart rate and heart rate variability in the horse and its rider: Different responses to training and performance. Vet. J. 2013, 197, 229–232. [Google Scholar] [CrossRef] [PubMed]
  21. Strzelec, K.; Kędzierski, W.; Bereznowski, A.; Janczarek, I.; Bocian, K.; Radosz, M. Salivary cortisol Levels in horses and their riders during three-day-events. Bull. Vet. Inst. Pulawy 2013, 57, 237–241. [Google Scholar]
  22. Kang, O.D.; Lee, W.S. Changes in Salivary Cortisol Concentration in Horses during Different Types of Exercise. Asian-Australas. J. Anim. Sci. 2016, 29. [Google Scholar] [CrossRef] [PubMed]
  23. Fazio, E.; Medica, P.; Aveni, F.; Ferlazzo, A. The potential role of training sessions on the temporal and spatial physiological patterns in young Friesian horses. J. Equine Vet. Sci. 2016, 47, 84–91. [Google Scholar] [CrossRef]
  24. Van Dyke Parunak, H.; Bisson, R.; Brueckner, S.; Matthews, R.; Sauter, J. A model of emotions for situated agents. In Proceedings of the Fifth International Joint Conference on Autonomous Agents and Multiagent Systems, Hakodate, Japan, 8–12 May 2006; ACM: New York, NY, USA, 2006; pp. 993–995. [Google Scholar]
  25. Smith, A.V.; Proops, L.; Grounds, K.; Wathan, J.; McComb, K. Functionally relevant responses to human facial expressions of emotion in the domestic horse (Equus caballus). Biol. Lett. 2016, 12. [Google Scholar] [CrossRef] [PubMed]
  26. Brandt, K. A language of their own: An interactionist approach to human-horse communication. Soc. Anim. 2004, 12, 299–316. [Google Scholar] [CrossRef]
  27. Rochais, C.; Henry, S.; Sankey, C.; Nassur, F.; Gorecka-Bruzda, A.; Hausberger, M. Visual attention, an indicator of human-animal relationships? A study of domestic horses (Equus caballus). Front. Psychol. 2014, 5. [Google Scholar] [CrossRef] [PubMed]
  28. Gehrke, E.K.; Baldwin, A.; Schiltz, P.M. Heart rate variability in horses engaged in equine-assisted activities. J. Equine Vet. Sci. 2011, 31, 78–84. [Google Scholar] [CrossRef]
  29. Visser, E.; Van Reenen, C.; Van der Werf, J.; Schilder, M.; Knaap, J.; Barneveld, A.; Blokhuis, H. Heart rate and heart rate variability during a novel object test and a handling test in young horses. Physiol. Behav. 2002, 76, 289–296. [Google Scholar] [CrossRef]
  30. Popescu, S.; Diugan, E.A. The relationship between behavioral and other welfare indicators of working horses. J. Equine Vet. Sci. 2013, 33, 1–12. [Google Scholar] [CrossRef]
  31. Forkman, B.; Boissy, A.; Meunier-Salaün, M.C.; Canali, E.; Jones, R. A critical review of fear tests used on cattle, pigs, sheep, poultry and horses. Physiol. Behav. 2007, 92, 340–374. [Google Scholar] [CrossRef] [PubMed]
  32. Birke, L.; Brandt, K. Mutual corporeality: Gender and human/horse relationships. In Women’s Studies International Forum; Elsevier: Amsterdam, The Netherlands, 2009; Volume 32, pp. 189–197. [Google Scholar]
  33. Proops, L.; McComb, K.; Reby, D. Cross-modal individual recognition in domestic horses (Equus caballus). Proc. Natil. Acad. Sci. USA 2009, 106, 947–951. [Google Scholar] [CrossRef] [PubMed]
  34. Proops, L.; McComb, K. Cross-modal individual recognition in domestic horses (Equus caballus) extends to familiar humans. Proc. R. Soc. Lond. B Biol. Sci. 2012, 279, 3131–3138. [Google Scholar] [CrossRef] [PubMed] [Green Version]
  35. MacLean, B. Equine-assisted therapy. J. Rehabil. Res. Dev. 2011, 48, ix–xii. [Google Scholar] [CrossRef] [PubMed]
  36. Christian, J.E. All creatures great and small utilizing equine-assisted therapy to treat eating disorders. J. Psychol. Christianity 2005, 24, 65–67. [Google Scholar]
  37. Piette, D.; Norton, T.; Exadaktylos, V.; Berckmans, D. Real-time monitoring of the horse-rider dyad using body sensor network technology. In Proceedings of the 2016 IEEE 13th International Conference on Wearable and Implantable Body Sensor Networks (BSN), San Francisco, CA, USA, 14–17 June 2016; IEEE: New York, NY, USA, 2016; pp. 287–291. [Google Scholar]
  38. Jansen, F.; Van der Krogt, J.; Van Loon, K.; Avezzu, V.; Guarino, M.; Quanten, S.; Berckmans, D. Online detection of an emotional response of a horse during physical activity. Vet. J. 2009, 181, 38–42. [Google Scholar] [CrossRef] [PubMed]
  39. Crews, D. The Bond Between a Horse and a Human. Arizona State University: Phoenix, Arizona, July 2009. [Google Scholar]
  40. Sankey, C.; Henry, S.; André, N.; Richard-Yris, M.A.; Hausberger, M. Do horses have a concept of person? PLoS ONE 2011, 6. [Google Scholar] [CrossRef] [PubMed]
  41. Sankey, C.; Richard-Yris, M.A.; Leroy, H.; Henry, S.; Hausberger, M. Positive interactions lead to lasting positive memories in horses, Equus caballus. Anim. Behav. 2010, 79, 869–875. [Google Scholar] [CrossRef]
  42. Electrophysiology, Task Force of the European Society of Cardiology the North American Society of Pacing. Heart rate variability standards of measurement, physiological interpretation, and clinical use. Eur. Heart J. 1996, 17, 354–381. [Google Scholar]
  43. Narayanan, K.; Govindan, R.; Gopinathan, M. Unstable periodic orbits in human cardiac rhythms. Phys. Rev. E 1998, 57, 4594–4602. [Google Scholar] [CrossRef]
  44. Poon, C.S.; Merrill, C.K. Decrease of cardiac chaos in congestive heart failure. Nature 1997, 389, 492–495. [Google Scholar] [CrossRef] [PubMed]
  45. Keogh, E.J.; Pazzani, M.J. Scaling up dynamic time warping for datamining applications. In Proceedings of the Sixth ACM SIGKDD International Conference on Knowledge Discovery and Data Mining, Boston, MA, USA, 20–23 August 2000; ACM: New York, NY, USA, 2000; pp. 285–289. [Google Scholar]
  46. Rabiner, L.; Juang, B.H. Fundamentals of Speech Recognition; Signal Processing Series; Prentice Hall: Englewood Cliffs, NJ, USA, 1993. [Google Scholar]
  47. Caiani, E.; Porta, A.; Baselli, G.; Turie, M.; Muzzupappa, S.; Pieruzzi, F.; Crema, C.; Malliani, A.; Cerutti, S. Warped-average template technique to track on a cycle-by-cycle basis the cardiac filling phases on left ventricular volume. In Proceedings of the 1998 Computers in Cardiology, Cleveland, OH, USA, 13–16 September 1998; IEEE: Cleveland, OH, USA, 1998; pp. 73–76. [Google Scholar]
  48. Valenza, G.; Nardelli, M.; Lanata, A.; Gentili, C.; Bertschy, G.; Kosel, M.; Scilingo, E.P. Predicting Mood Changes in Bipolar Disorder through Heartbeat Nonlinear Dynamics. IEEE J. Biomed. Health Inform. 2016, 20, 1034–1043. [Google Scholar] [CrossRef]
  49. Guidi, A.; Salvi, S.; Ottaviano, M.; Gentili, C.; Bertschy, G.; de Rossi, D.; Scilingo, E.P.; Vanello, N. Smartphone Application for the Analysis of Prosodic Features in Running Speech with a Focus on Bipolar Disorders: System Performance Evaluation and Case Study. Sensors 2015, 15, 28070–28087. [Google Scholar] [CrossRef] [PubMed]
  50. Lorussi, F.; Rocchia, W.; Scilingo, E.P.; Tognetti, A.; De Rossi, D. Wearable, redundant fabric-based sensor arrays for reconstruction of body segment posture. IEEE Sens. J. 2004, 4, 807–818. [Google Scholar] [CrossRef]
  51. Lanata, A.; Valenza, G.; Scilingo, E.P. A novel EDA glove based on textile-integrated electrodes for affective computing. Med. Biol. Eng. Comput. 2012, 50, 1163–1172. [Google Scholar] [CrossRef] [PubMed]
  52. Greco, A.; Valenza, G.; Nardelli, M.; Bianchi, M.; Citi, L.; Scilingo, E.P. Force-Velocity Assessment of Caress-like Stimuli through the Electrodermal Activity Processing: Advantages of a Convex Optimization Approach. IEEE Trans. Hum.-Mach. Syst. 2016, 1–10. [Google Scholar] [CrossRef]
  53. Ödman, S.; Öberg, P.A. Movement-induced potentials in surface electrodes. Med. Biol. Eng. Comput. 1982, 20, 159–166. [Google Scholar] [CrossRef] [PubMed]
  54. Webster, J. Medical Instrumentation: Application and Design; John Wiley & Sons: Hoboken, NJ, USA, 2009. [Google Scholar]
  55. De Talhouet, H.; Webster, J.G. The origin of skin-stretch-caused motion artifacts under electrodes. Physiol. Meas. 1996, 17, 81–93. [Google Scholar] [CrossRef] [PubMed]
  56. Thakor, N.; Webster, J. The origin of skin potential and its variations. In Proceedings of the 31st Annual Conference on Engineering in Medicine and Biology, Atlanta, GA, USA, 1978; Volume 20, p. 212.
  57. Milanesi, M.; Martini, N.; Vanello, N.; Positano, V.; Santarelli, M.; Paradiso, R.; De Rossi, D.; Landini, L. Multichannel techniques for motion artifacts removal from electrocardiographic signals. In Proceedings of the 28th Annual International Conference of the IEEE Engineering in Medicine and Biology Society, EMBS’06, New York, NY, USA, 31 August –3 September 2006; IEEE: New York, NY, USA, 2006; pp. 3391–3394. [Google Scholar]
  58. Martini, N.; Milanesi, M.; Vanello, N.; Positano, V.; Santarelli, M.; Landini, L. A real-time adaptive filtering approach to motion artefacts removal from ECG signals. Int. J. Biomed. Eng. Technol. 2010, 3, 233–245. [Google Scholar] [CrossRef]
  59. Scheffer, C.; van Oldruitenborgh-Oosterbaan, M.S. Computerized ECG recording in horses during a standardized exercise test. Vet. Q. 1996, 18, 2–7. [Google Scholar] [CrossRef] [PubMed]
  60. Vitale, V.; Balocchi, R.; Varanini, M.; Sgorbini, M.; Macerata, A.; Sighieri, C.; Baragli, P. The effects of restriction of movement on the reliability of heart rate variability measurements in the horse (Equus caballus). J. Vet. Behav. Clin. Appl. Res. 2013, 8, 400–403. [Google Scholar] [CrossRef]
  61. Young, L.; Van Loon, G. Diseases of the heart and vessels. In Equine Sports Medicine and Surgery: Basic and Clinical Sciences of Equine Athlete; Elsevier: Amsterdam, The Netherlands, 2013; pp. 695–744. [Google Scholar]
  62. Stoppa, M.; Chiolerio, A. Wearable electronics and smart textiles: A critical review. Sensors 2014, 14, 11957–11992. [Google Scholar] [CrossRef] [PubMed]
  63. Suh, M. E-Textiles for Wearability: Review of Integration Technologies. Available online: http://www.textileworld.com/textile-world/features/2010/04/e-textiles-for-wearability-review-of-integration-technologies/ (accessed on 20 April 2010).
  64. Gargiulo, G.; Bifulco, P.; Calvo, R.A.; Cesarelli, M.; Jin, C.; Van Schaik, A. Mobile biomedical sensing with dry electrodes. In Proceedings of the 2008 International Conference on Intelligent Sensors, Sensor Networks and Information Processing, ISSNIP 2008, Sydney, Australia, 15–18 December 2008; IEEE: New York, NY, USA, 2008; pp. 261–266. [Google Scholar]
  65. Seoane, F.; Ferreira, J.; Alvarez, L.; Buendia, R.; Ayllón, D.; Llerena, C.; Gil-Pita, R. Sensorized garments and textrode-enabled measurement instrumentation for ambulatory assessment of the autonomic nervous system response in the atrec project. Sensors 2013, 13, 8997–9015. [Google Scholar] [CrossRef] [PubMed]
  66. Carvalho, H.; Catarino, A.P.; Rocha, A.; Postolache, O. Health monitoring using textile sensors and electrodes: An overview and integration of technologies. In Proceedings of the 2014 IEEE International Symposium on Medical Measurements and Applications (MeMeA), ISCTE, University of Lisbon, Lisbon, Portugal, 11–12 June 2014; IEEE: New York, NY, USA, 2014; pp. 1–6. [Google Scholar]
  67. Lanatà, A.; Valenza, G.; Greco, A.; Gentili, C.; Bartolozzi, R.; Bucchi, F.; Frendo, F.; Scilingo, E.P. How the Autonomic Nervous System and Driving Style Change With Incremental Stressing Conditions during Simulated Driving. IEEE Trans. Intell. Transp. Syst. 2015, 16, 1505–1517. [Google Scholar] [CrossRef]
  68. Zito, D.; Pepe, D.; Neri, B.; De Rossi, D.; Lanata, A.; Tognetti, A.; Scilingo, E.P. Wearable system-on-a-chip UWB radar for health care and its application to the safety improvement of emergency operators. In Proceedings of the 2007 29th Annual International Conference of the IEEE Engineering in Medicine and Biology Society, Lyon, France, 23–26 August 2007; IEEE: New York, NY, USA, 2007; pp. 2651–2654. [Google Scholar]
  69. Ishijima, M. Cardiopulmonary monitoring by textile electrodes without subject-awareness of being monitored. Med. Biol. Eng. Comput. 1997, 35, 685–690. [Google Scholar] [CrossRef] [PubMed]
  70. Paradiso, R.; Gemignani, A.; Scilingo, E.; De Rossi, D. Knitted bioclothes for cardiopulmonary monitoring. In Proceedings of the 25th Annual International Conference of the IEEE Engineering in Medicine and Biology Society, Cancun, Mexico, 17–21 September 2003; IEEE: New York, NY, USA, 2003; Volume 4, pp. 3720–3723. [Google Scholar]
  71. Milanesi, M.; Vanello, N.; Positano, V.; Santarelli, M.; Paradiso, R.; Rossi, D.D.; Landini, L. Frequency domain approach to blind source separation in ECG monitoring by wearable system. In Proceedings of the 2005 Computers in Cardiology, Lyon, France, 25–28 September 2005; IEEE: New York, NY, USA, 2005; pp. 767–770. [Google Scholar]
  72. Scilingo, E.P.; Gemignani, A.; Paradiso, R.; Taccini, N.; Ghelarducci, B.; De Rossi, D. Performance evaluation of sensing fabrics for monitoring physiological and biomechanical variables. IEEE Trans. Inf. Technol. Biomed. 2005, 9, 345–352. [Google Scholar] [CrossRef] [PubMed]
  73. Watanabe, K.; Watanabe, T.; Watanabe, H.; Ando, H.; Ishikawa, T.; Kobayashi, K. Noninvasive measurement of heartbeat, respiration, snoring and body movements of a subject in bed via a pneumatic method. IEEE Trans. Biomed. Eng. 2005, 52, 2100–2107. [Google Scholar] [CrossRef] [PubMed]
  74. Paradiso, R.; Bianchi, A.; Lau, K.; Scilingo, E. Psyche: Personalised monitoring systems for care in mental health. In Proceedings of the 2010 Annual International Conference of the IEEE Engineering in Medicine and Biology Society (EMBC), Buenos Aires, Argentina, 1–4 September 2010; IEEE: New York, NY, USA, 2010; pp. 3602–3605. [Google Scholar]
  75. Peltokangas, M.; Verho, J.; Vehkaoja, A. Night-time EKG and HRV monitoring with bed sheet integrated textile electrodes. IEEE Trans. Inf. Technol. Biomed. 2012, 16, 935–942. [Google Scholar] [CrossRef] [PubMed]
  76. Lanata, A.; Valenza, G.; Mancuso, C.; Scilingo, E.P. Robust multiple cardiac arrhythmia detection through bispectrum analysis. Expert Syst. Appl. 2011, 38, 6798–6804. [Google Scholar] [CrossRef]
  77. Zito, D.; Pepe, D.; Neri, B.; Zito, F.; De Ross, D.; Lanatà, A. Feasibility study and design of a wearable system-on-a-chip pulse radar for contactless cardiopulmonary monitoring. Int. J. Telemed. Appl. 2008, 2008, 6. [Google Scholar] [CrossRef] [PubMed]
  78. Zito, D.; Pepe, D.; Mincica, M.; Zito, F.; De Rossi, D.; Lanata, A.; Scilingo, E.; Tognetti, A. Wearable system-on-a-chip UWB radar for contact-less cardiopulmonary monitoring: Present status. In Proceedings of the 2008 30th Annual International Conference of the IEEE Engineering in Medicine and Biology Society, Vancouver, BC, Canada, 21–24 August 2008; IEEE: New York, NY, USA, 2008; pp. 5274–5277. [Google Scholar]
  79. Lanata, A.; Scilingo, E.P.; De Rossi, D. A multimodal transducer for cardiopulmonary activity monitoring in emergency. IEEE Trans. Inf. Technol. Biomed. 2010, 14, 817–825. [Google Scholar] [CrossRef] [PubMed]
  80. Betella, A.; Zucca, R.; Cetnarski, R.; Greco, A.; Lanatà, A.; Mazzei, D.; Tognetti, A.; Arsiwalla, X.D.; Omedas, P.; De Rossi, D.; et al. Inference of human affective states from psychophysiological measurements extracted under ecologically valid conditions. In Using Neurophysiological Signals that Reflect Cognitive or Affective State, Frontiers in Neuroscience; Frontiers Media SA: Lausanne, Switzerland, 2014; p. 66. [Google Scholar]
  81. Zhang, Y.T.; Poon, C.C.; Chan, C.H.; Tsang, M.W.; Wu, K.F. A health-shirt using e-textile materials for the continuous and cuffless monitoring of arterial blood pressure. In Proceedings of the 2006 3rd IEEE/EMBS International Summer School on Medical Devices and Biosensors, Cambridge, MA, USA, 4–6 September 2006; IEEE: New York, NY, USA, 2006; pp. 86–89. [Google Scholar]
  82. Chan, C.; Zhang, Y. Continuous and long-term arterial blood pressure monitoring by using h-Shirt. In Proceedings of the 2008 International Conference on Information Technology and Applications in Biomedicine (ITAB 2008), Shenzhen, China, 30–31 May 2008; IEEE: New York, NY, USA, 2008; pp. 267–269. [Google Scholar]
  83. Arshad, A. A Study on Health Monitoring System: Recent Advancements. IIUM Eng. J. 2014, 15, 87–99. [Google Scholar]
  84. Baha, S. T wave shape as fitness indicator in racehorse. A study by the Holter method. Rev. Méd. Vét. 1991, 142, 125–129. [Google Scholar]
  85. Raekallio, M. Long term ECG recording with Holter monitoring in clinically healthy horses. Acta Vet. Scand. 1991, 33, 71–75. [Google Scholar]
  86. Reef, V.; Marr, C.; Hammett, B. Holter monitoring in the management of atrial fibrillation following conversion. In Proceedings of the 11th American College of Veterinary Internal Medicine Forum, Washington, DC, USA, 20 May 1993; pp. 610–613.
  87. Scheffer, C.; Robben, J.; Sloet, O.O.M. Continuous monitoring of ECG in horses at rest and during exercise. Vet. Rec. 1995, 137, 371–374. [Google Scholar] [CrossRef] [PubMed]
  88. Pantelopoulos, A.; Bourbakis, N.G. A survey on wearable sensor-based systems for health monitoring and prognosis. IEEE Trans. Syst. Man Cybern. C (Appl. Rev.) 2010, 40, 1–12. [Google Scholar] [CrossRef]
  89. Lanata, A.; Guidi, A.; Baragli, P.; Paradiso, R.; Valenza, G.; Scilingo, E.P. Removing movement artifacts from equine ECG recordings acquired with textile electrodes. In Proceedings of the 2015 37th Annual International Conference of the IEEE Engineering in Medicine and Biology Society (EMBC), Milan, Italy, 25–29 August 2015; IEEE: New York, NY, USA, 2015; pp. 1955–1958. [Google Scholar]
  90. Pandian, P.; Mohanavelu, K.; Safeer, K.; Kotresh, T.; Shakunthala, D.; Gopal, P.; Padaki, V. Smart Vest: Wearable multi-parameter remote physiological monitoring system. Med. Eng. Phys. 2008, 30, 466–477. [Google Scholar] [CrossRef] [PubMed]
  91. Lanata, A.; Guidi, A.; Baragli, P.; Valenza, G.; Scilingo, E.P. A Novel Algorithm for Movement Artifact Removal in ECG Signals Acquired from Wearable Systems Applied to Horses. PLoS ONE 2015, 10, e0140783. [Google Scholar] [CrossRef] [PubMed]
  92. Lanatà, A.; Scilingo, E.P.; Nardini, E.; Loriga, G.; Paradiso, R.; De-Rossi, D. Comparative evaluation of susceptibility to motion artifact in different wearable systems for monitoring respiratory rate. IEEE Trans. Inf. Technol. Biomed. 2010, 14, 378–386. [Google Scholar] [CrossRef] [PubMed]
  93. Valenza, G.; Citi, L.; Gentili, C.; Lanata, A.; Scilingo, E.P.; Barbieri, R. Characterization of depressive states in bipolar patients using wearable textile technology and instantaneous heart rate variability assessment. IEEE J. Biomed. Health Inform. 2015, 19, 263–274. [Google Scholar] [CrossRef] [PubMed]
  94. Valenza, G.; Lanatà, A.; Scilingo, E.P.; Rossi, D.D. Towards a smart glove: Arousal recognition based on textile electrodermal response. In Proceedings of the 32nd Annual International Conference of the IEEE Engineering in Medicine and Biology Society, Buenos Aires, Argentina, 1–4 September 2010; IEEE: New York, NY, USA, 2010; pp. 3598–3601. [Google Scholar]
  95. Valenza, G.; Gentili, C.; Lanatà, A.; Scilingo, E.P. Mood recognition in bipolar patients through the PSYCHE platform: Preliminary evaluations and perspectives. Artif. Intell. Med. 2013, 57, 49–58. [Google Scholar] [CrossRef] [PubMed]
  96. Pacelli, M.; Loriga, G.; Taccini, N.; Paradiso, R. Sensing fabrics for monitoring physiological and biomechanical variables: E-textile solutions. In Proceedings of the 2006 3rd IEEE/EMBS International Summer School on Medical Devices and Biosensors, Cambridge, MA, USA, 4–6 September 2006; pp. 1–4.
  97. Verheyen, T.; Decloedt, A.; De Clercq, D.; Deprez, P.; Sys, S.; van Loon, G. Electrocardiography in horses, part 1: How to make a good recording. Vlaams Diergeneeskd. Tijdschr. 2010, 79, 331–336. [Google Scholar]
  98. Saul, J.P. Beat-to-beat variations of heart rate reflect modulation of cardiac autonomic outflow. Physiology 1990, 5, 32–37. [Google Scholar]
  99. Berntson, G.G. Heart rate variability: Origins, methods, and interpretive caveats. Psychophysiology 1997, 34, 623–648. [Google Scholar] [CrossRef] [PubMed]
  100. Acharya, U.R.; Joseph, K.P.; Kannathal, N.; Lim, C.M.; Suri, J.S. Heart rate variability: A review. Med. Biol. Eng. Comput. 2006, 44, 1031–1051. [Google Scholar] [CrossRef] [PubMed]
  101. Rodríguez-Liñares, L.; Méndez, A.J.; Lado, M.J.; Olivieri, D.N.; Vila, X.A.; Gómez-Conde, I. An open source tool for heart rate variability spectral analysis. Comput. Methods Progr. Biomed. 2011, 103, 39–50. [Google Scholar] [CrossRef] [PubMed]
  102. Guzzetti, S.; Signorini, M.G.; Cogliati, C.; Mezzetti, S.; Porta, A.; Cerutti, S.; Malliani, A. Non-linear dynamics and chaotic indices in heart rate variability of normal subjects and heart-transplanted patients. Cardiovasc. Res. 1996, 31, 441–446. [Google Scholar] [CrossRef]
  103. Valenza, G.; Nardelli, M.; Bertschy, G.; Lanata, A.; Scilingo, E. Mood states modulate complexity in heartbeat dynamics: A multiscale entropy analysis. Europhys. Lett. 2014, 107. [Google Scholar] [CrossRef]
  104. Valenza, G.; Greco, A.; Lanata, A.; Sebastiani, L.; Menicucci, D.; Gemignani, A.; Scilingo, E.P. Combining electroencephalographic activity and instantaneous heart rate for assessing brain–heart dynamics during visual emotional elicitation in healthy subjects. Phil. Trans. R. Soc. A. 2016, 374, 441–446. [Google Scholar]
  105. Tarvainen, M.P.; Niskanen, J.P.; Lipponen, J.A.; Ranta-Aho, P.O.; Karjalainen, P.A. Kubios HRV–heart rate variability analysis software. Comput. Methods Progr. Biomed. 2014, 113, 210–220. [Google Scholar] [CrossRef] [PubMed]
  106. Pan, J.; Tompkins, W.J. A real-time QRS detection algorithm. IEEE Trans. Biomed. Eng. 1985, 3, 230–236. [Google Scholar] [CrossRef] [PubMed]
  107. Singh, D.; Vinod, K.; Saxena, S. Sampling frequency of the RR interval time series for spectral analysis of heart rate variability. J. Med. Eng. Technol. 2004, 28, 263–272. [Google Scholar] [CrossRef] [PubMed]
  108. Anosov, O.; Patzak, A.; Kononovich, Y.; Persson, P.B. High-frequency oscillations of the heart rate during ramp load reflect the human anaerobic threshold. Eur. J. Appl. Physiol. 2000, 83, 388–394. [Google Scholar] [CrossRef] [PubMed]
  109. Allen, J.J. Calculating metrics of cardiac chronotropy: A pragmatic overview. Psychophysiology 2002, 39, S18. [Google Scholar]
  110. Müller, M. Dynamic time warping. In Information Retrieval for Music and Motion; Springer-Verlag: Berlin, Heidelberg, 2007; pp. 69–84. [Google Scholar]
  111. Benjamini, Y.; Hochberg, Y. Controlling the false discovery rate: A practical and powerful approach to multiple testing. J. R. Stat. Soc. Ser. B (Methodol.) 1995, 57, 289–300. [Google Scholar]
  112. Lanata, A.; Greco, A.; Valenza, G.; Scilingo, E.P. A pattern recognition approach based on electrodermal response for pathological mood identification in bipolar disorders. In Proceedings of the 2014 IEEE International Conference on Acoustics, Speech and Signal Processing (ICASSP), Florence, Italy, 4–9 May 2014; IEEE: New York, NY, USA, 2014; pp. 3601–3605. [Google Scholar]
  113. Nardelli, M.; Valenza, G.; Cristea, I.A.; Gentili, C.; Cotet, C.; David, D.; Lanata, A.; Scilingo, E.P. Characterizing psychological dimensions in non-pathological subjects through autonomic nervous system dynamics. Front. Comput. Neurosci. 2015, 9. [Google Scholar] [CrossRef] [PubMed]
  114. Lanata, A.; Valenza, G.; Nardelli, M.; Gentili, C.; Scilingo, E.P. Complexity index from a personalized wearable monitoring system for assessing remission in mental health. IEEE J. Biomed. Health Inform. 2015, 19, 132–139. [Google Scholar] [CrossRef] [PubMed]
  115. Quer, G.; Daftari, J.; Rao, R.R. Heart rate wavelet coherence analysis to investigate group entrainment. Pervasive Mob. Comput. 2016, 28, 21–34. [Google Scholar] [CrossRef]
  116. Lanata, A.; Valenza, G.; Scilingo, E.P. Eye gaze patterns in emotional pictures. J. Ambient Intell. Humaniz. Comput. 2013, 4, 705–715. [Google Scholar] [CrossRef]
  117. Lazzeri, N.; Mazzei, D.; Greco, A.; Rotesi, A.; Lanatà, A.; De Rossi, D.E. Can a humanoid face be expressive? A psychophysiological investigation. Front. Bioeng. Biotechnol. 2015, 3. [Google Scholar] [CrossRef] [PubMed]
  118. Alfonso, S.V.; Alfonso, L.A.; Llabre, M.M.; Fernandez, M.I. Project Stride: An Equine-Assisted Intervention to Reduce Symptoms of Social Anxiety in Young Women. Explor. J. Sci. Heal. 2015, 11, 461–467. [Google Scholar] [CrossRef] [PubMed]
  119. Bass, M.M.; Duchowny, C.A.; Llabre, M.M. The effect of therapeutic horseback riding on social functioning in children with autism. J. Autism Dev. Disord. 2009, 39, 1261–1267. [Google Scholar] [CrossRef] [PubMed]
  120. Inderbitzin, M.P.; Betella, A.; Lanatá, A.; Scilingo, E.P.; Bernardet, U.; Verschure, P.F. The social perceptual salience effect. J. Exp. Psychol. Hum. Percept. Perform. 2013, 39, 62–74. [Google Scholar] [CrossRef] [PubMed]
  121. Lanatà, A.; Armato, A.; Valenza, G.; Scilingo, E.P. Eye tracking and pupil size variation as response to affective stimuli: A preliminary study. In Proceedings of the 2011 5th International Conference on Pervasive Computing Technologies for Healthcare (PervasiveHealth), Dublin, Ireland, 23–26 May 2011; IEEE: New York, NY, USA, 2011; pp. 78–84. [Google Scholar]
Figure 1. Wearable monitoring system for humans [48]. As is possible to note, from the box on the right, the e-textile electrodes for ECG (electrocardiographic) acquisition are knitted and completely integrated into the garment.
Electronics 05 00063 g001
Figure 2. Systems placement on the horse. Elastic smart belt and Ag/AgCl electrodes placement. A scheme is presented on the left side and a real picture is on the right side.
Electronics 05 00063 g002
Figure 3. Boxplot of the percentage of artifact signals observed in the two categories of data acquired. The central box represents the central 50% of the data. In fact, its lower and upper boundary lines are respectively at the 25% and 75% quantile of the data. A central red line indicates the median of the data. Finally, two vertical lines indicate the remaining data that are outside the central box and not considered as outliers.
Electronics 05 00063 g003
Figure 4. Example of both human and equine heart rate variability (HRV) signals. Within the smaller portion of signal, it is shown how the warping-paths are defined.
Electronics 05 00063 g004
Figure 5. DTW (dynamic time warping) values, as estimated between human and horse, obtained for each subject in each phase.
Electronics 05 00063 g005
Table 1. Percentage of corrupted signal obtained by means of hand labeling of the two categories of signals: signals recorded by using Ag/AgCl electrodes and signals recorded by using textile electrodes.
Ag/AgClE-Textile
h177, 4832, 37
h254, 5035, 00
h351, 4939, 74
h430, 4427, 51
h554, 4432, 66
h647, 0241, 96
h747, 8935, 03
Table 2. p-Values related to pairwise statistical analysis of the DTW (dynamic time warping) values, as estimated between human and horse, during the different phases ( P 1 , P 2 , P 3 ).
Feature P 1 vs. P 2 P 1 vs. P 3 P 2 vs. P 3
DTW0.0353 (↑)0.0026 (↑)0.0018 (↑)
P 1 : resting state, P 2 : visual and olfactory interaction, P 3 : grooming.
Table 3. p-Values related to pairwise statistical analysis of DTW values, as estimated within each enrolled subject, during the different phases ( P 1 , P 2 , P 3 ).
DTW P 1 - P 2 vs. DTW P 1 - P 3 DTW P 1 - P 2 vs. DTW P 2 - P 3 DTW P 1 - P 3 vs. DTW P 2 - P 3
human7.32E-04 (↑)4.63E-013.66E-03 (↓)
horse1.38E-014.4E-02 (↑)8.21E-01
P 1 : resting state, P 2 : visual and olfactory interaction, P 3 : grooming.
Table 4. Confusion matrix obtained by applying the Support Vector Machine (SVM) classifier to the leave-one-subject-out architecture.
P 1 P 2 P 3
P 1 85.71437.14297.1429
P 2 21.428678.57140.0000
P 3 0.00007.142992.8571
P 1 : resting state, P 2 : visual and olfactory interaction, P 3 : grooming.
Note: the percentage of the right recognised classes are marked in bold.

