
On the Application of the Raspberry Pi as an Advanced Acoustic Sensor Network for Noise Monitoring


Abstract
:
1. Introduction
2. Materials and Methods
2.1. Design and Requirements
- The device has to use low-cost components to create affordable sensor networks of several devices with a relation cost-quality.
- The device has to have reliability for long-term measurements.
- The device should have capability to be connected to the cloud for remote updates of the software and for sharing results.
- The quality of the measurements has to be enough for advanced audio parameters’ calculation.
- The device has to have enough computing power to do on-board calculations.
- The device has to be able to connect to the peripherals needed for the purposes of the project (e.g., a microphone).
- The device has to be able to interpret MATLAB programming language.
- The sound flow acquisition has to have the less noise inputs as possible, for avoiding extra filtering steps.
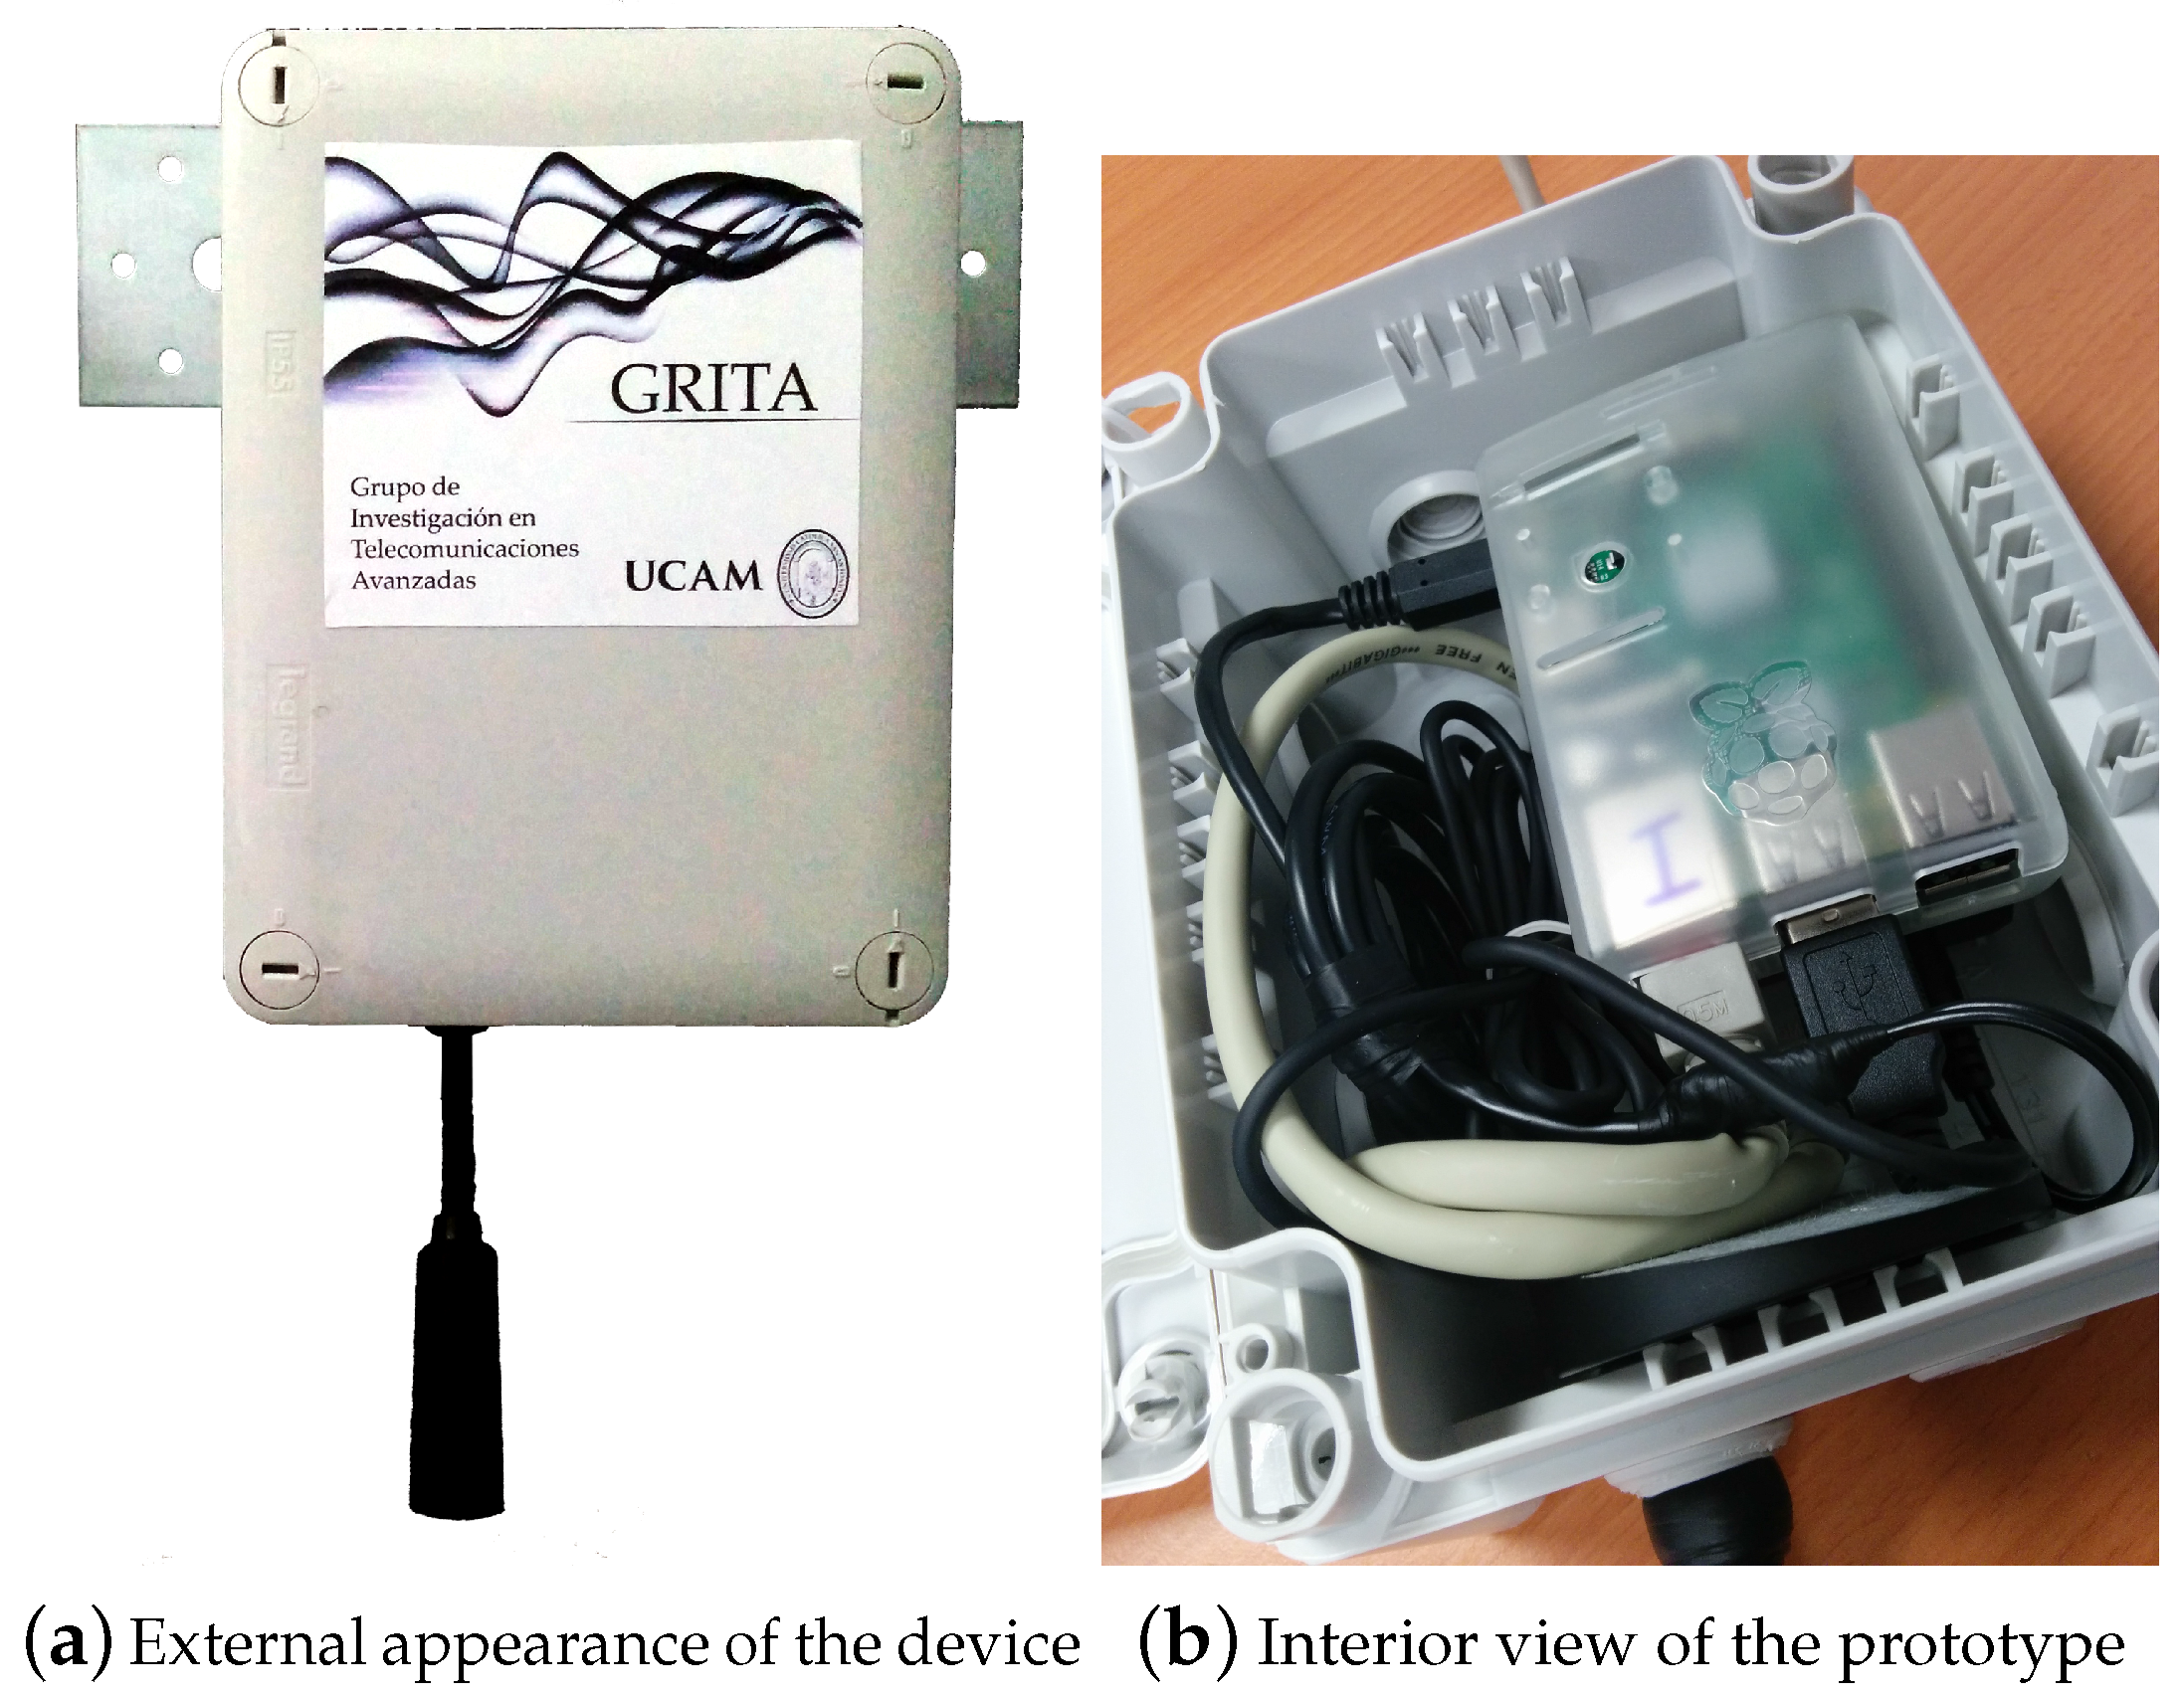
- The final device has to be protected against outdoor conditions using a protective housing.
- The device needs to have different connectivity options (i.e., WiFi or Ethernet).
- The distance from the nodes to the power source should be a maximum of 100 m.
2.2. Selection of the Components
2.2.1. The Core: Raspberry Pi
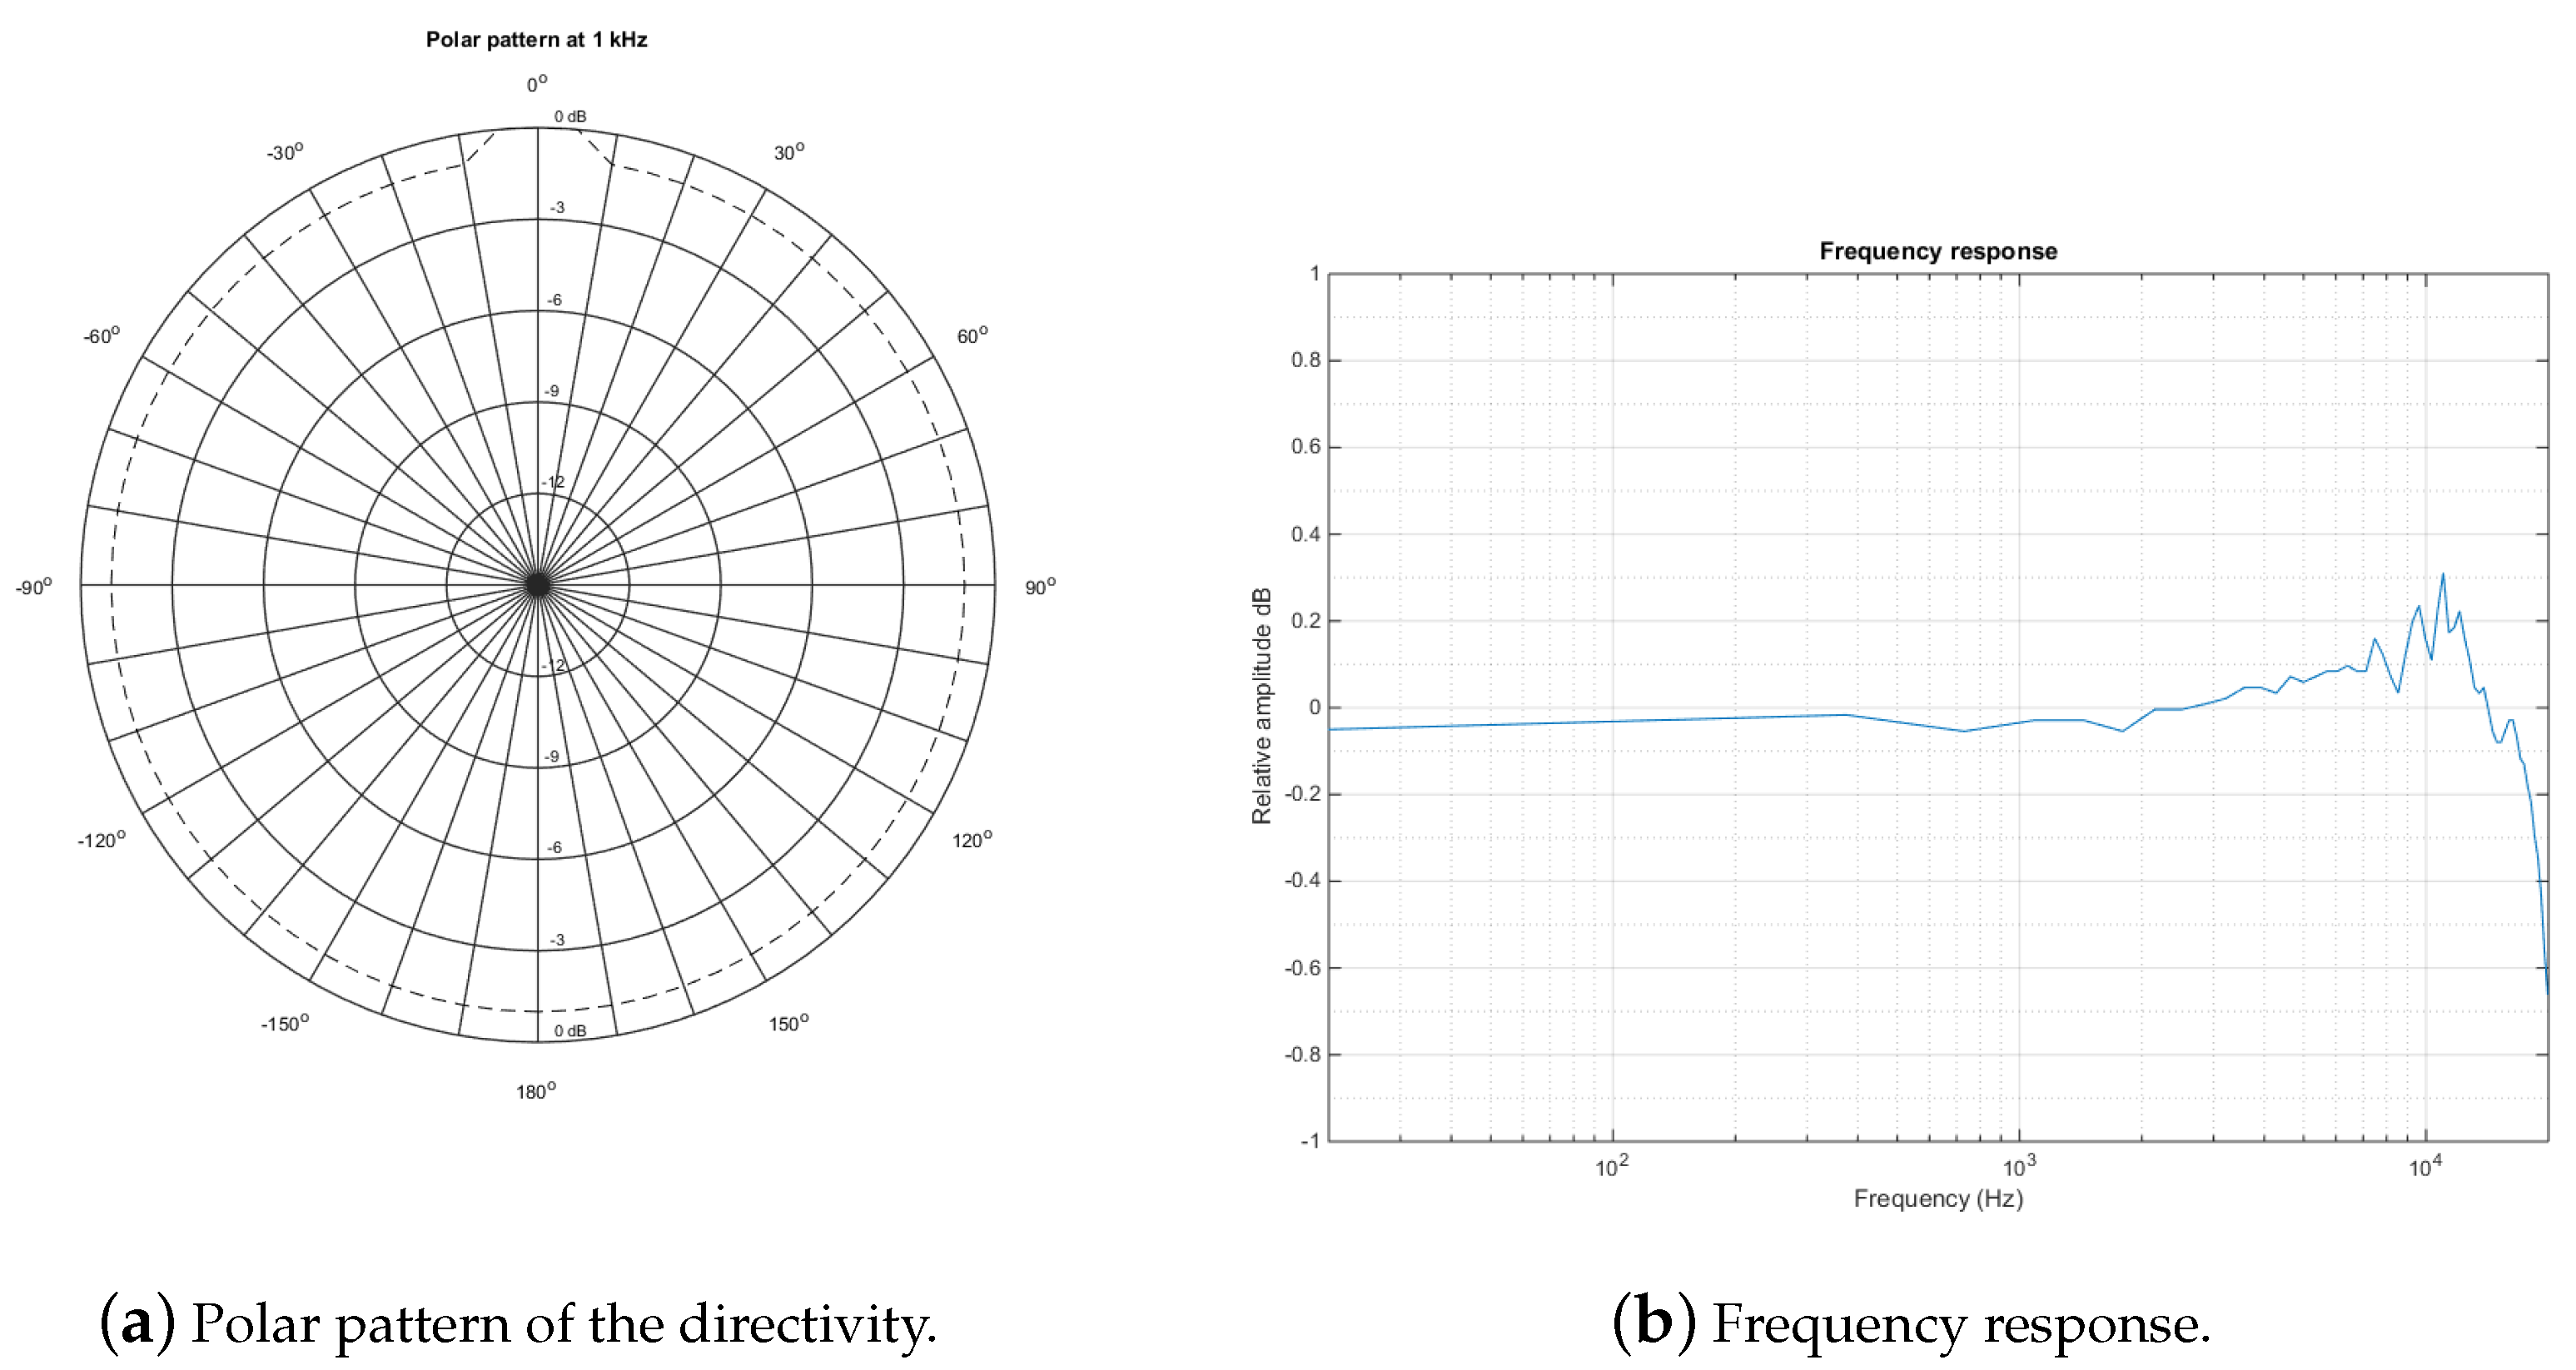
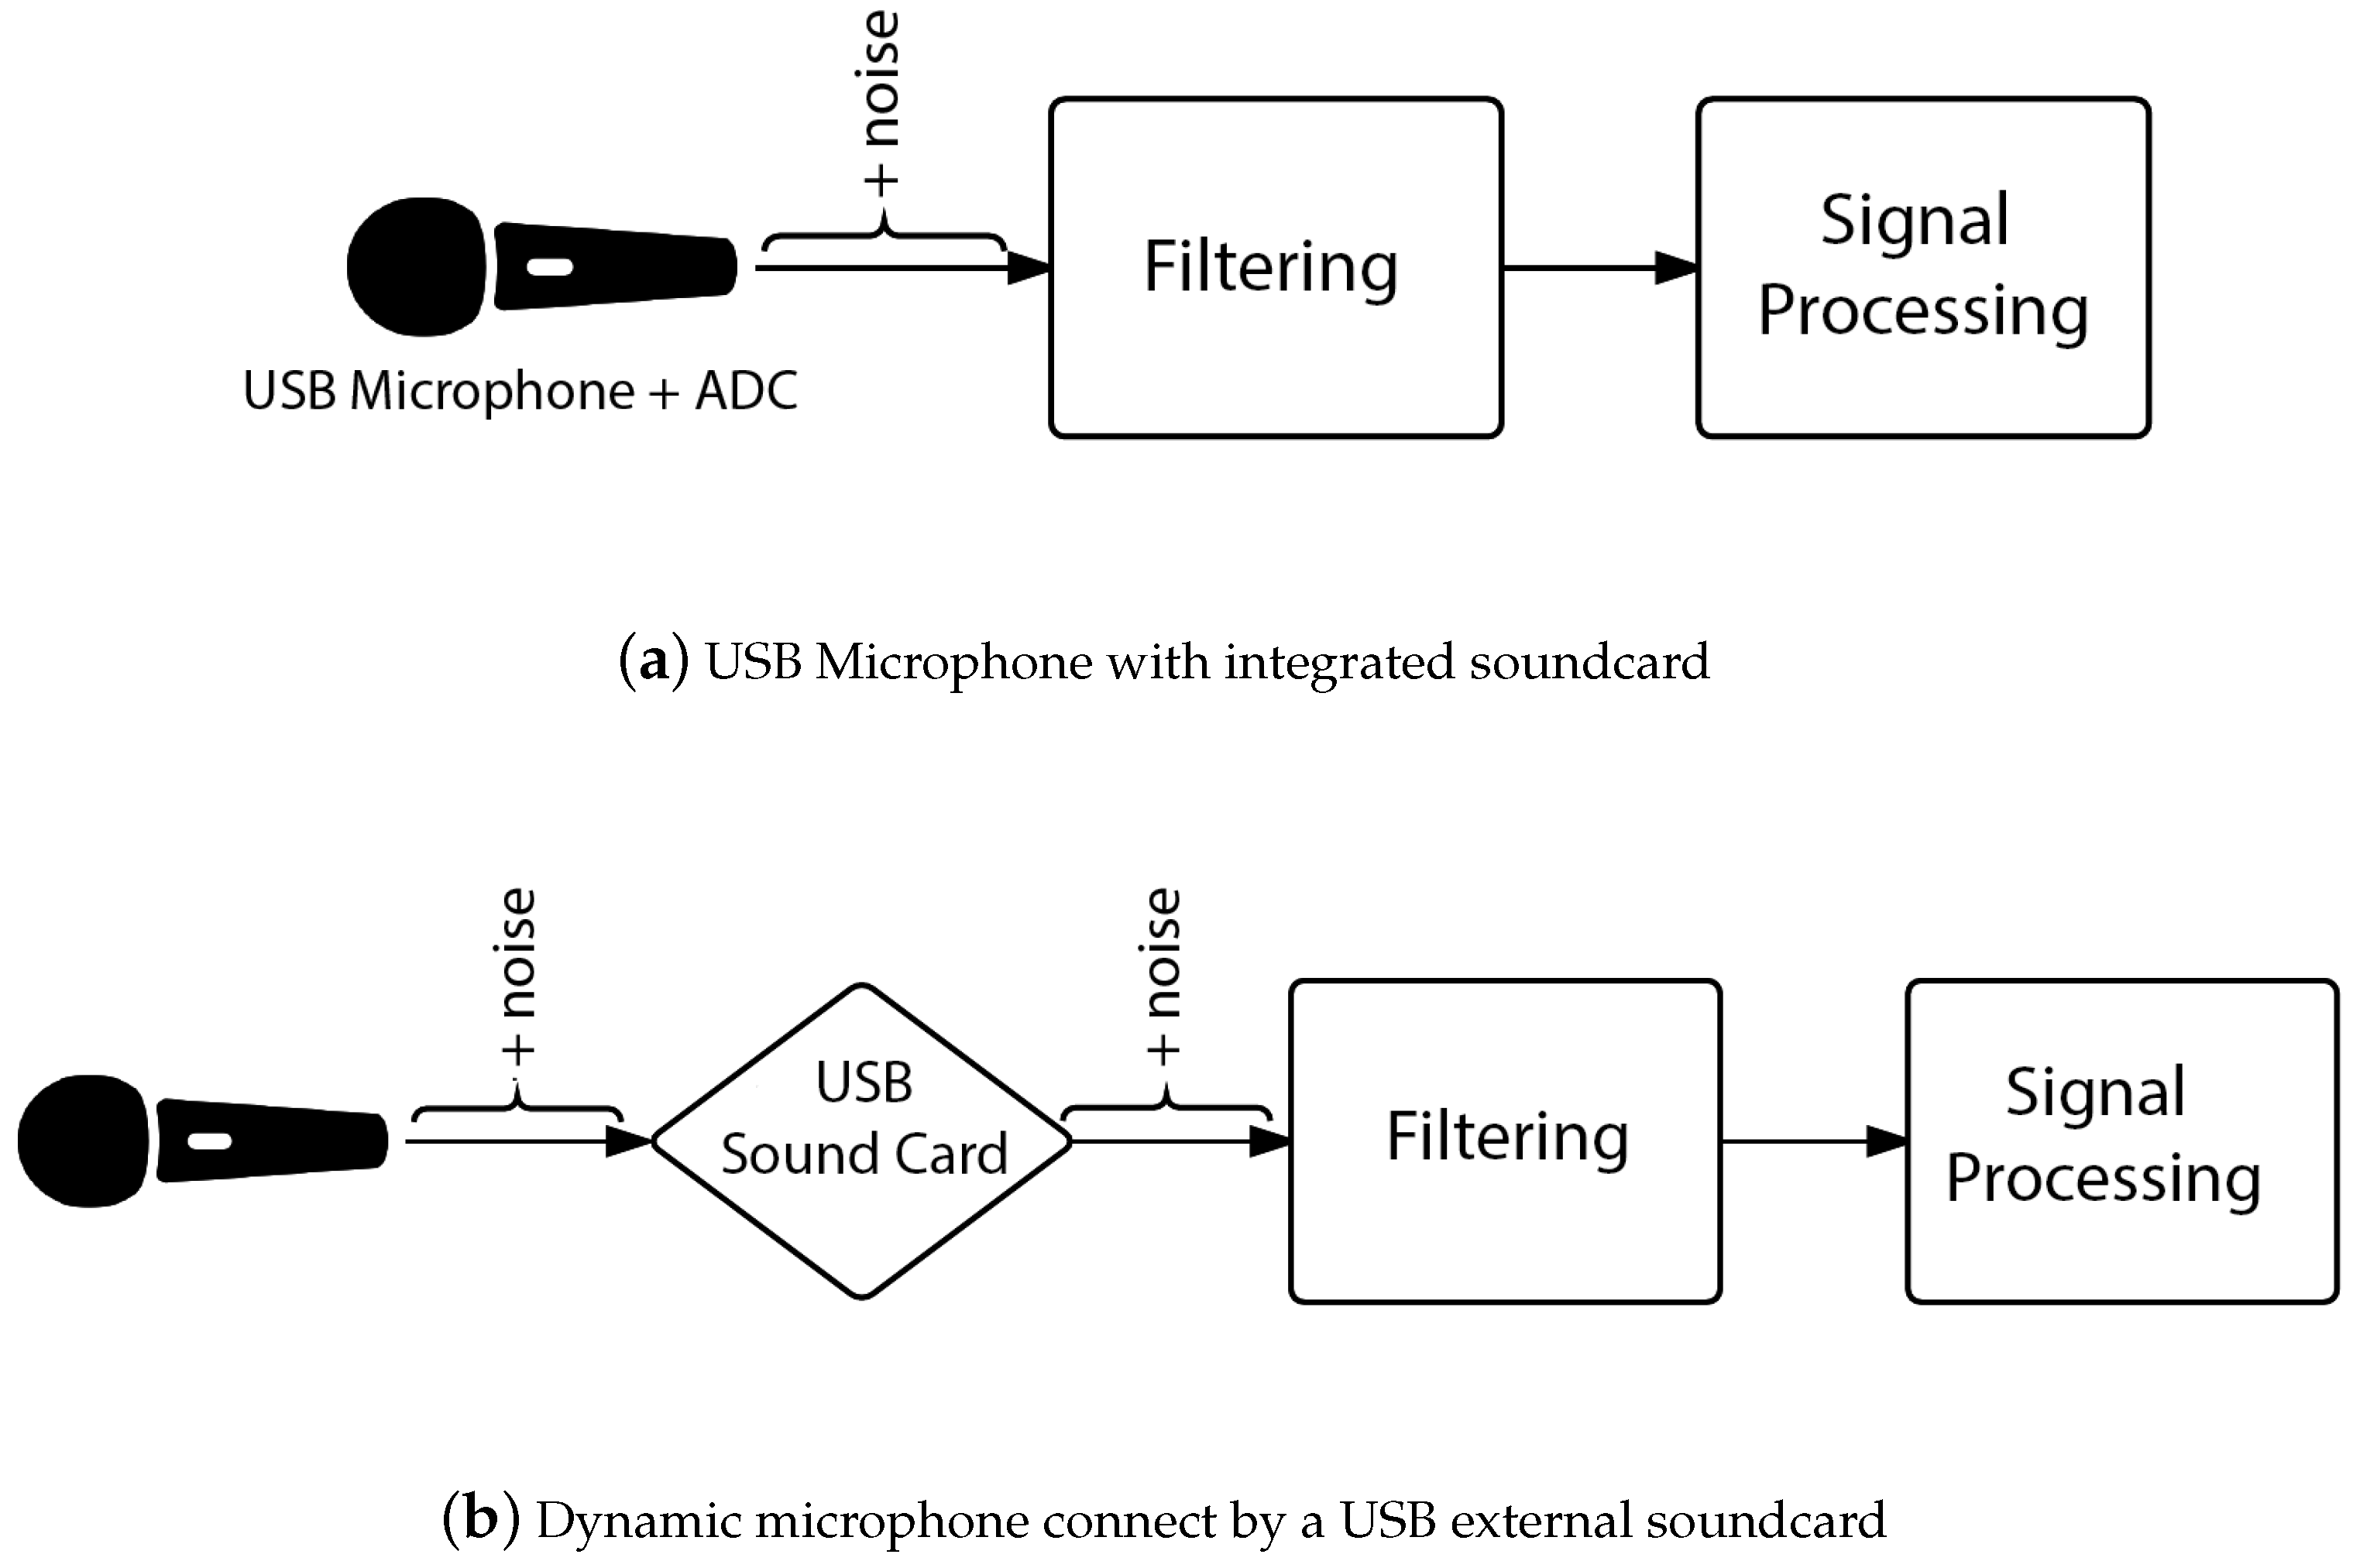
2.2.2. The Acquisition: The Microphone
- A low-cost USB sound card together with a dynamic microphone.
- An electrec USB microphone without an external sound card.
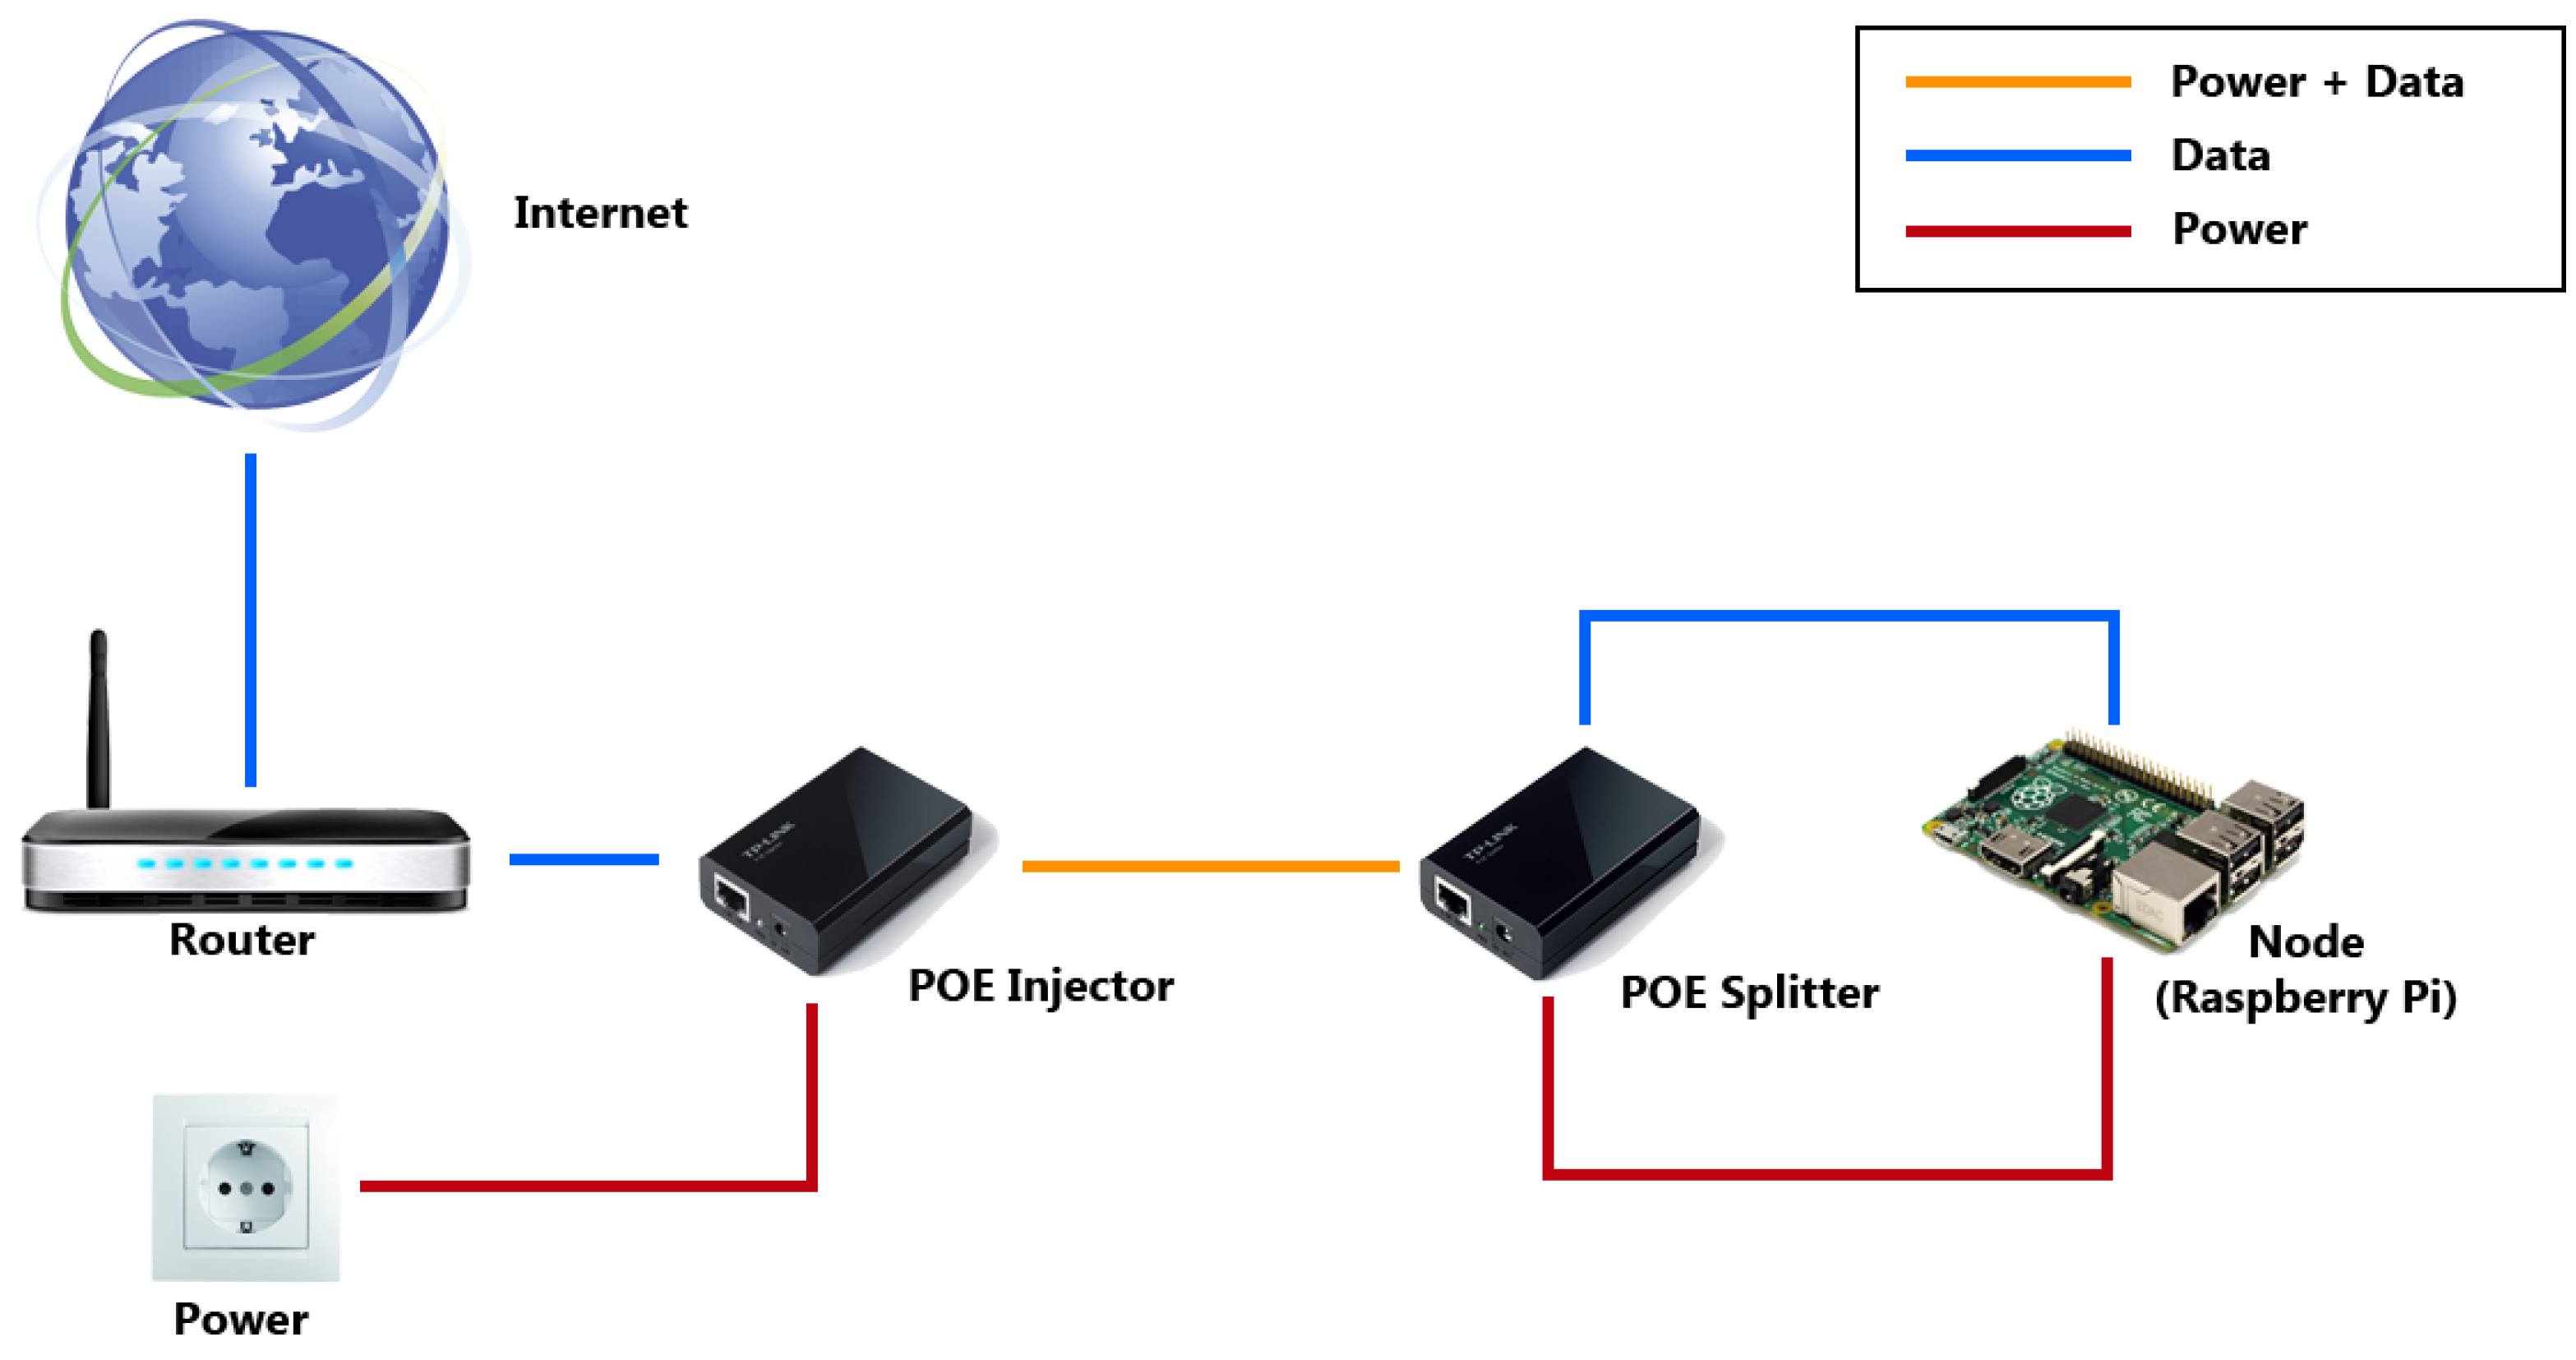
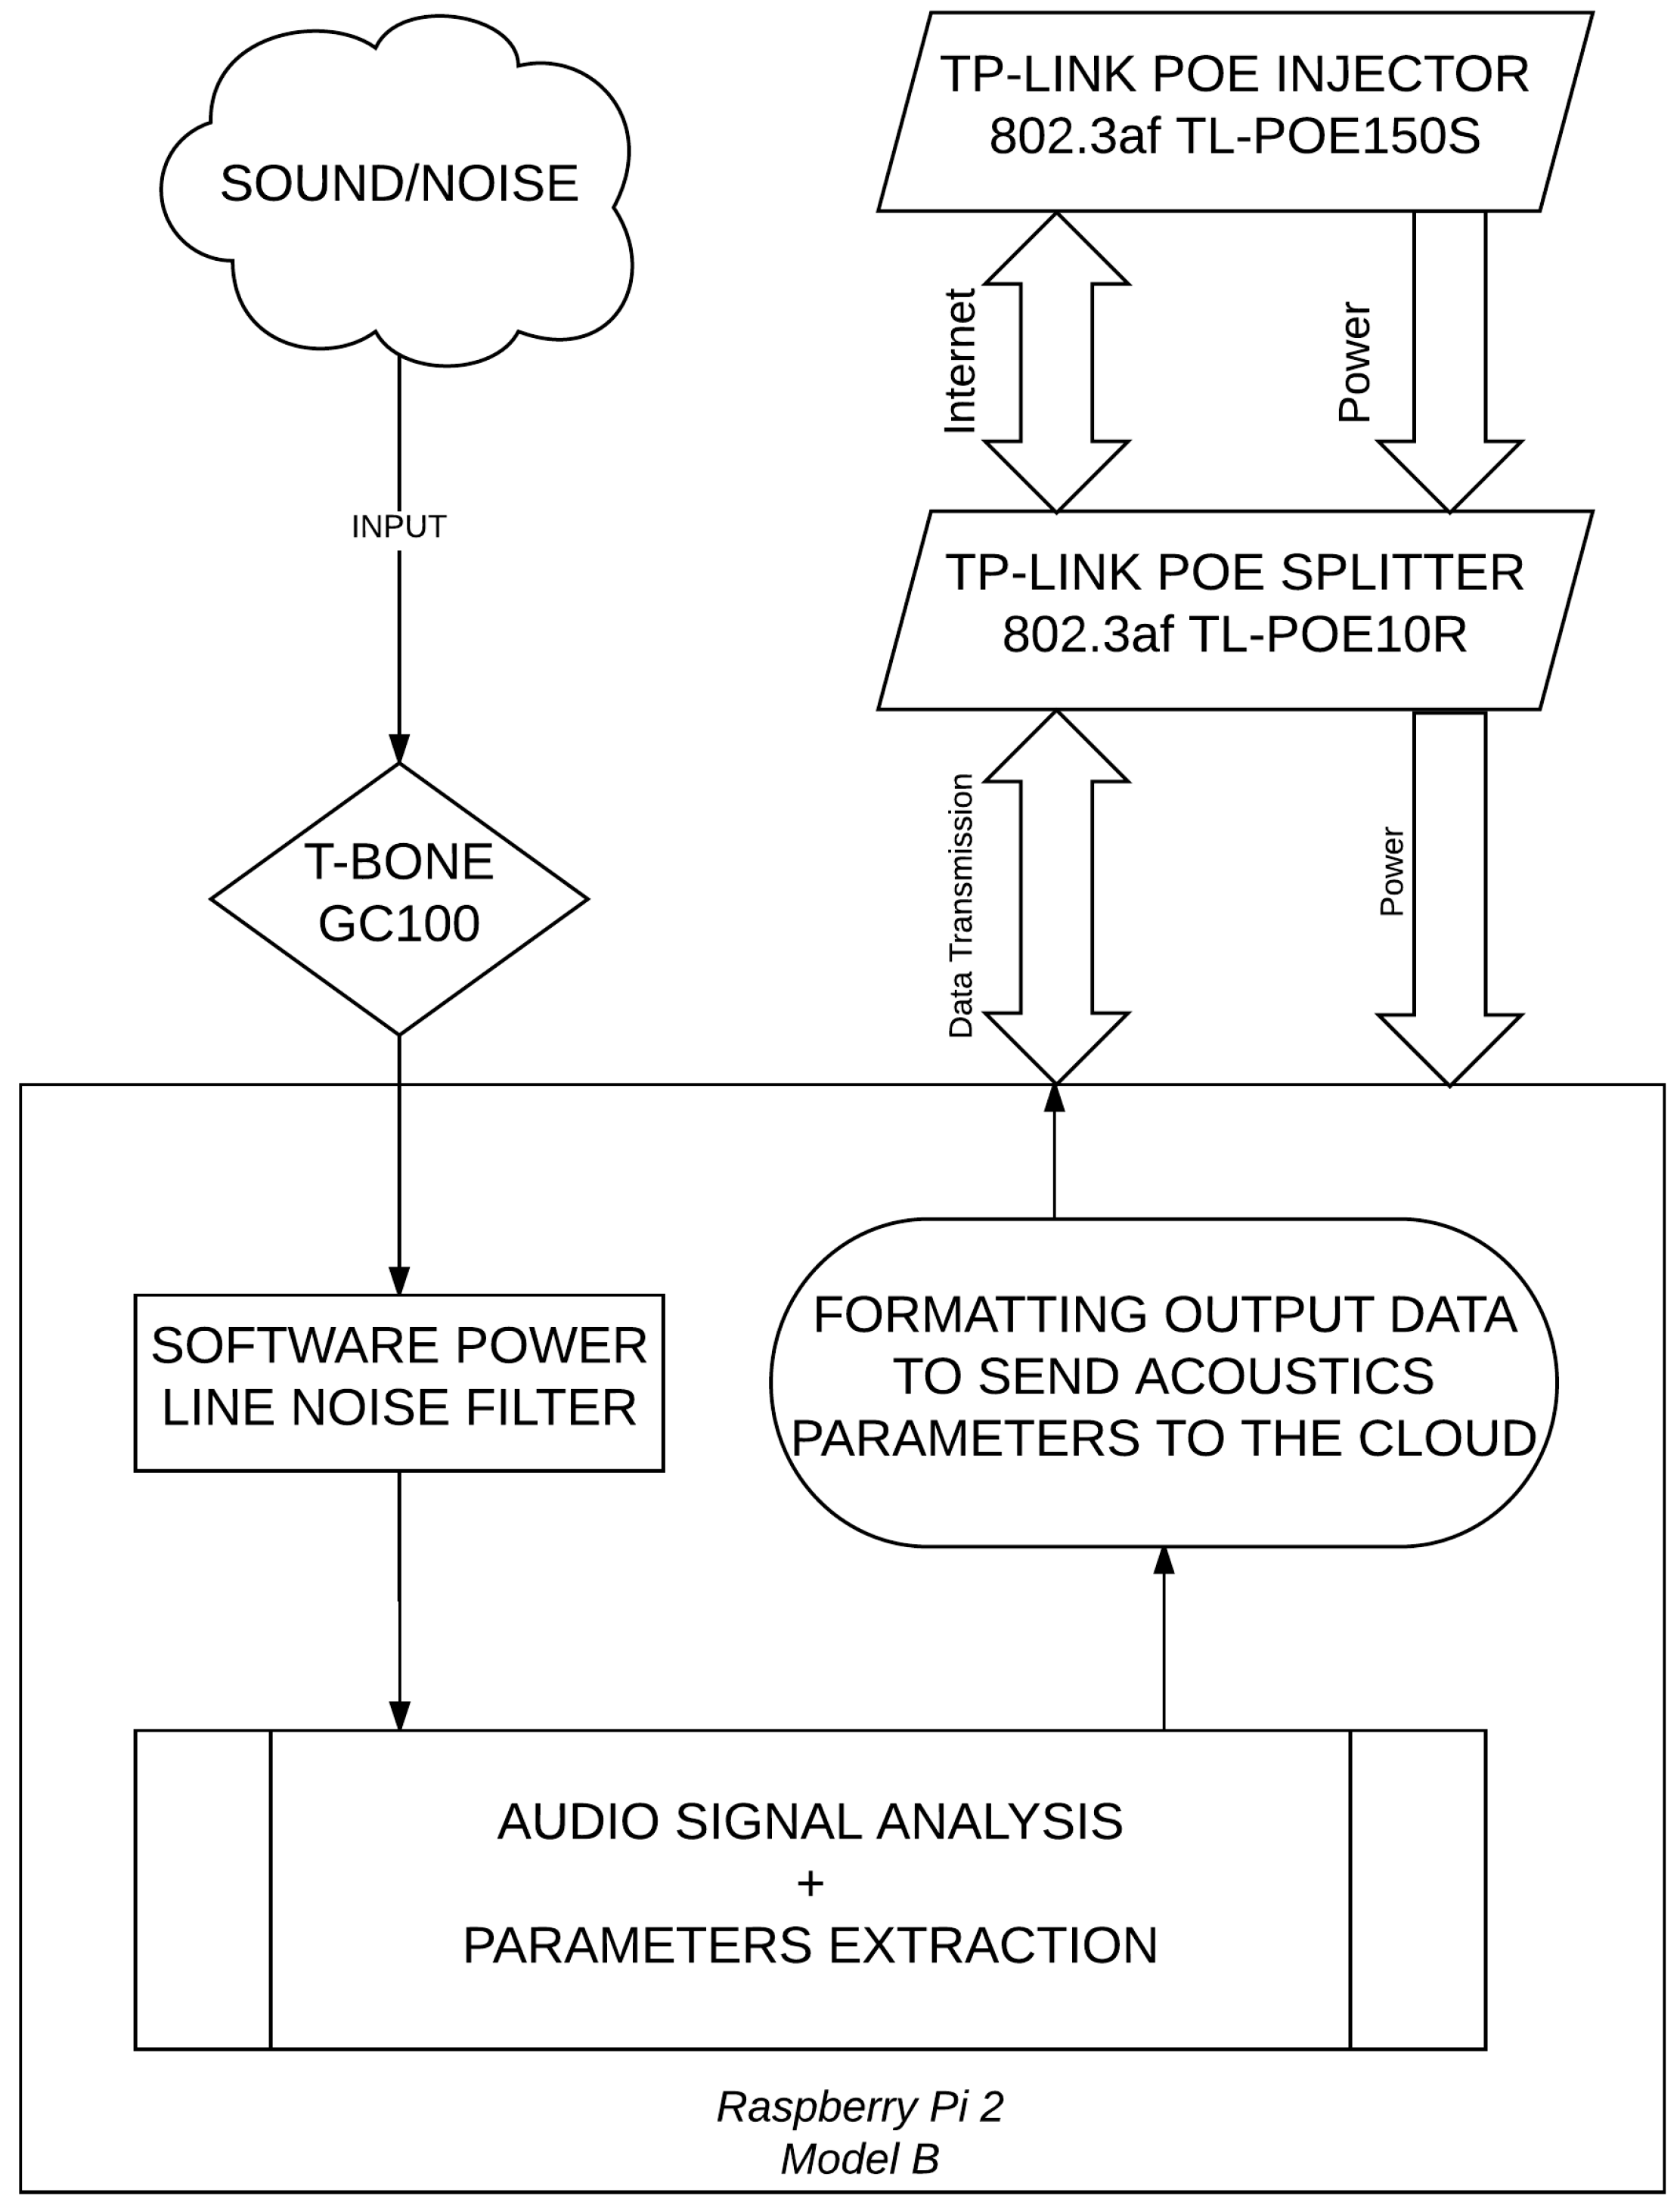
2.3. Algorithms Implementation and Cloud Connection
- Instant sound pressure level, .
- Percentile levels , , .
- Equivalent sound pressure level, .
- , day-evening-night level.
- Third octave sound pressure level (from 125 Hz to 8000 Hz)
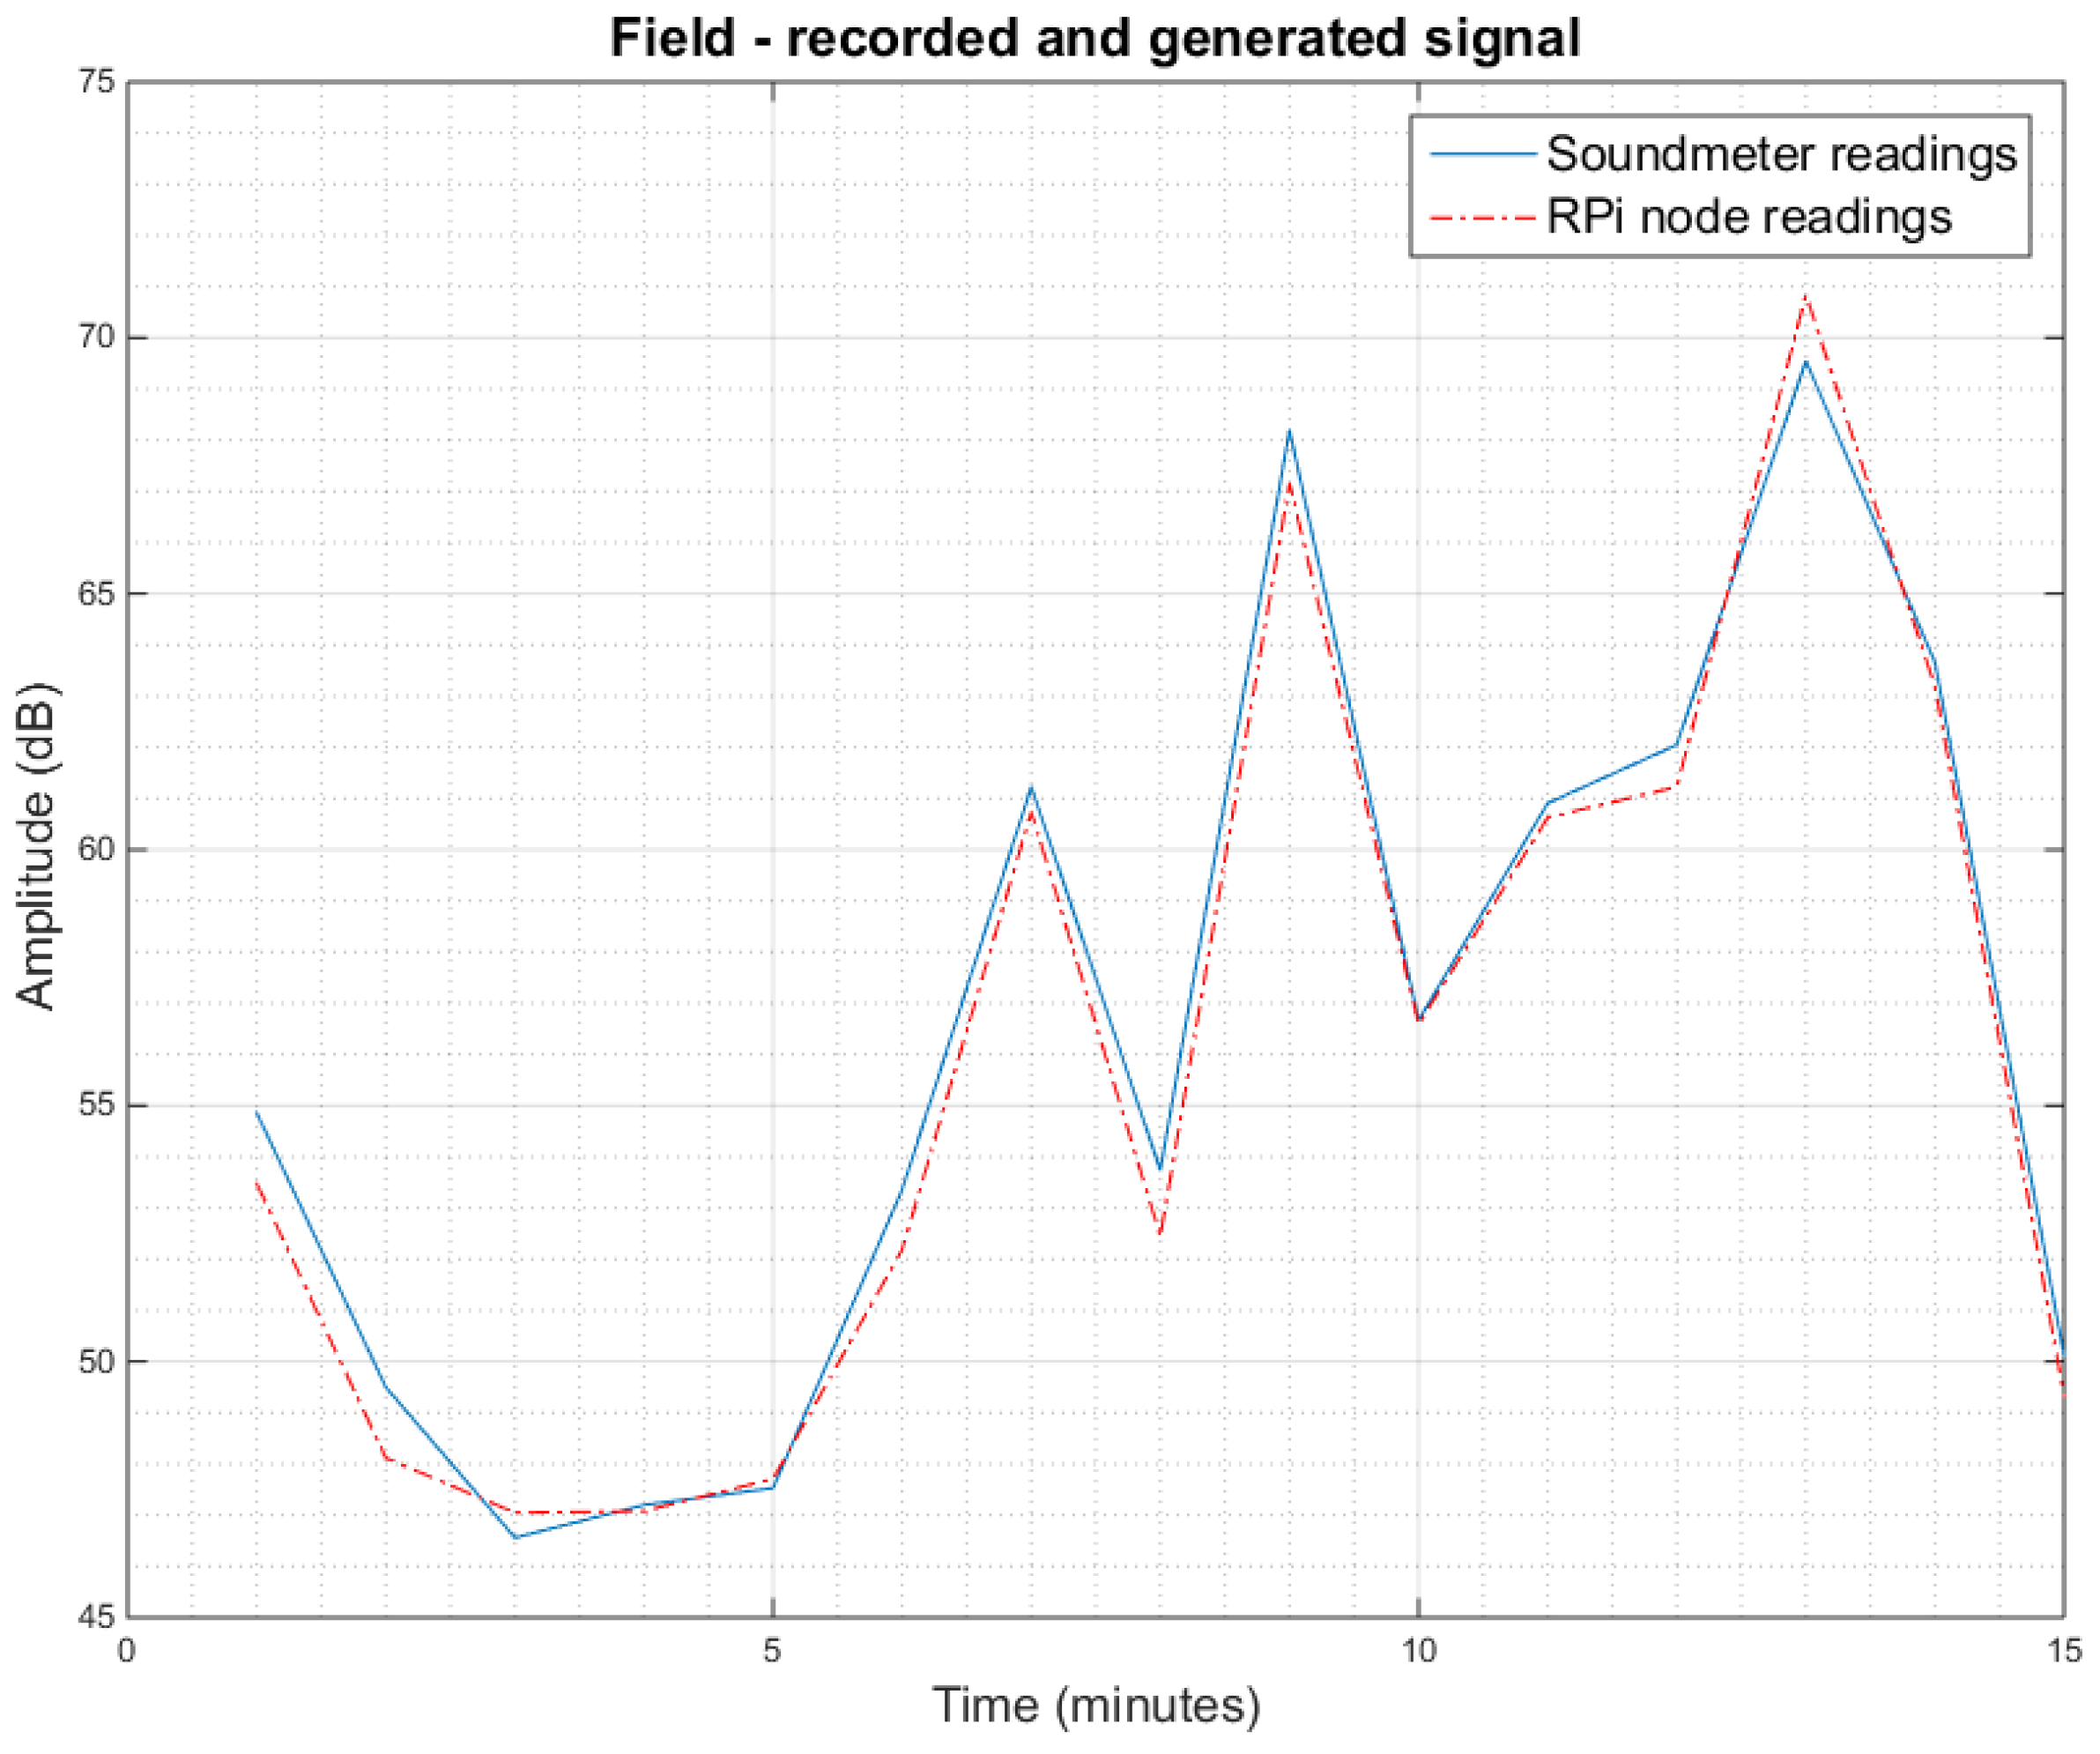
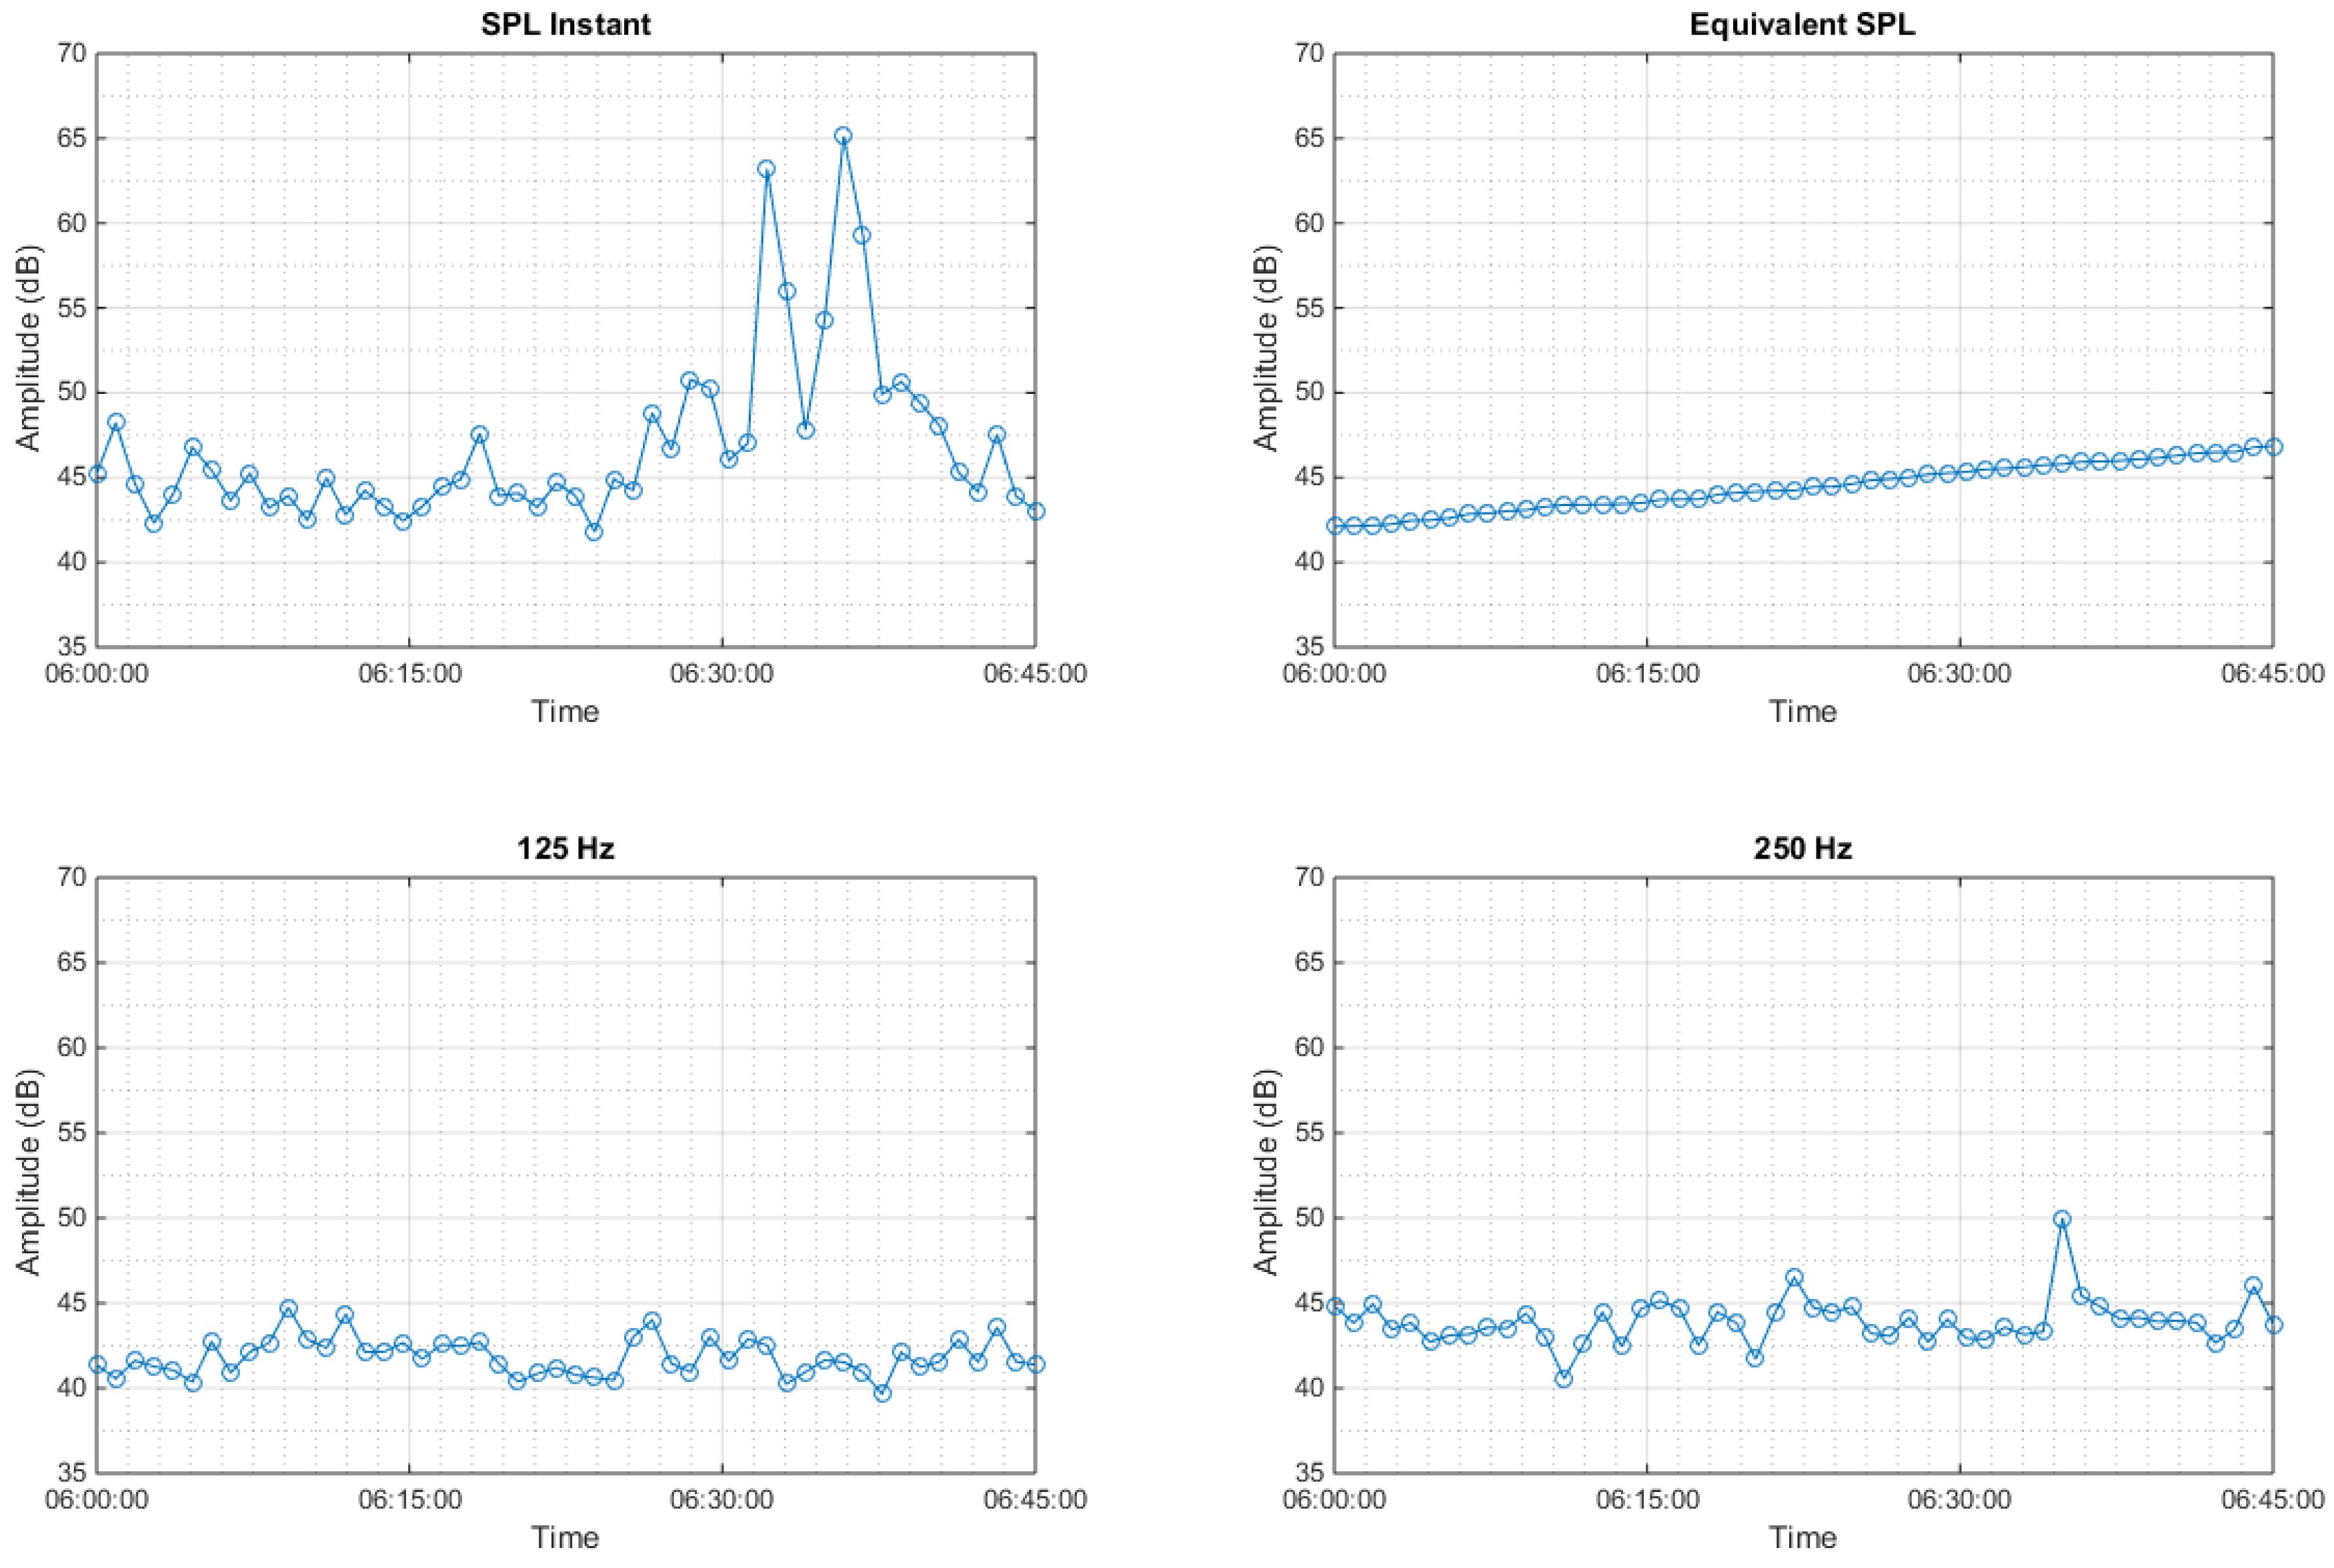
3. Results
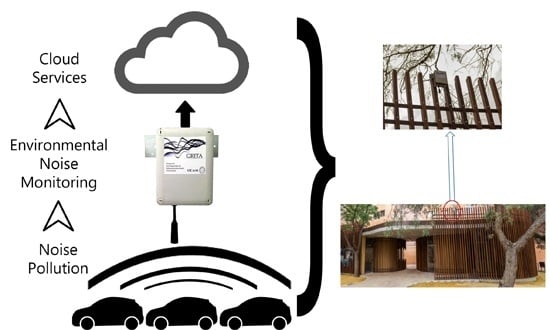
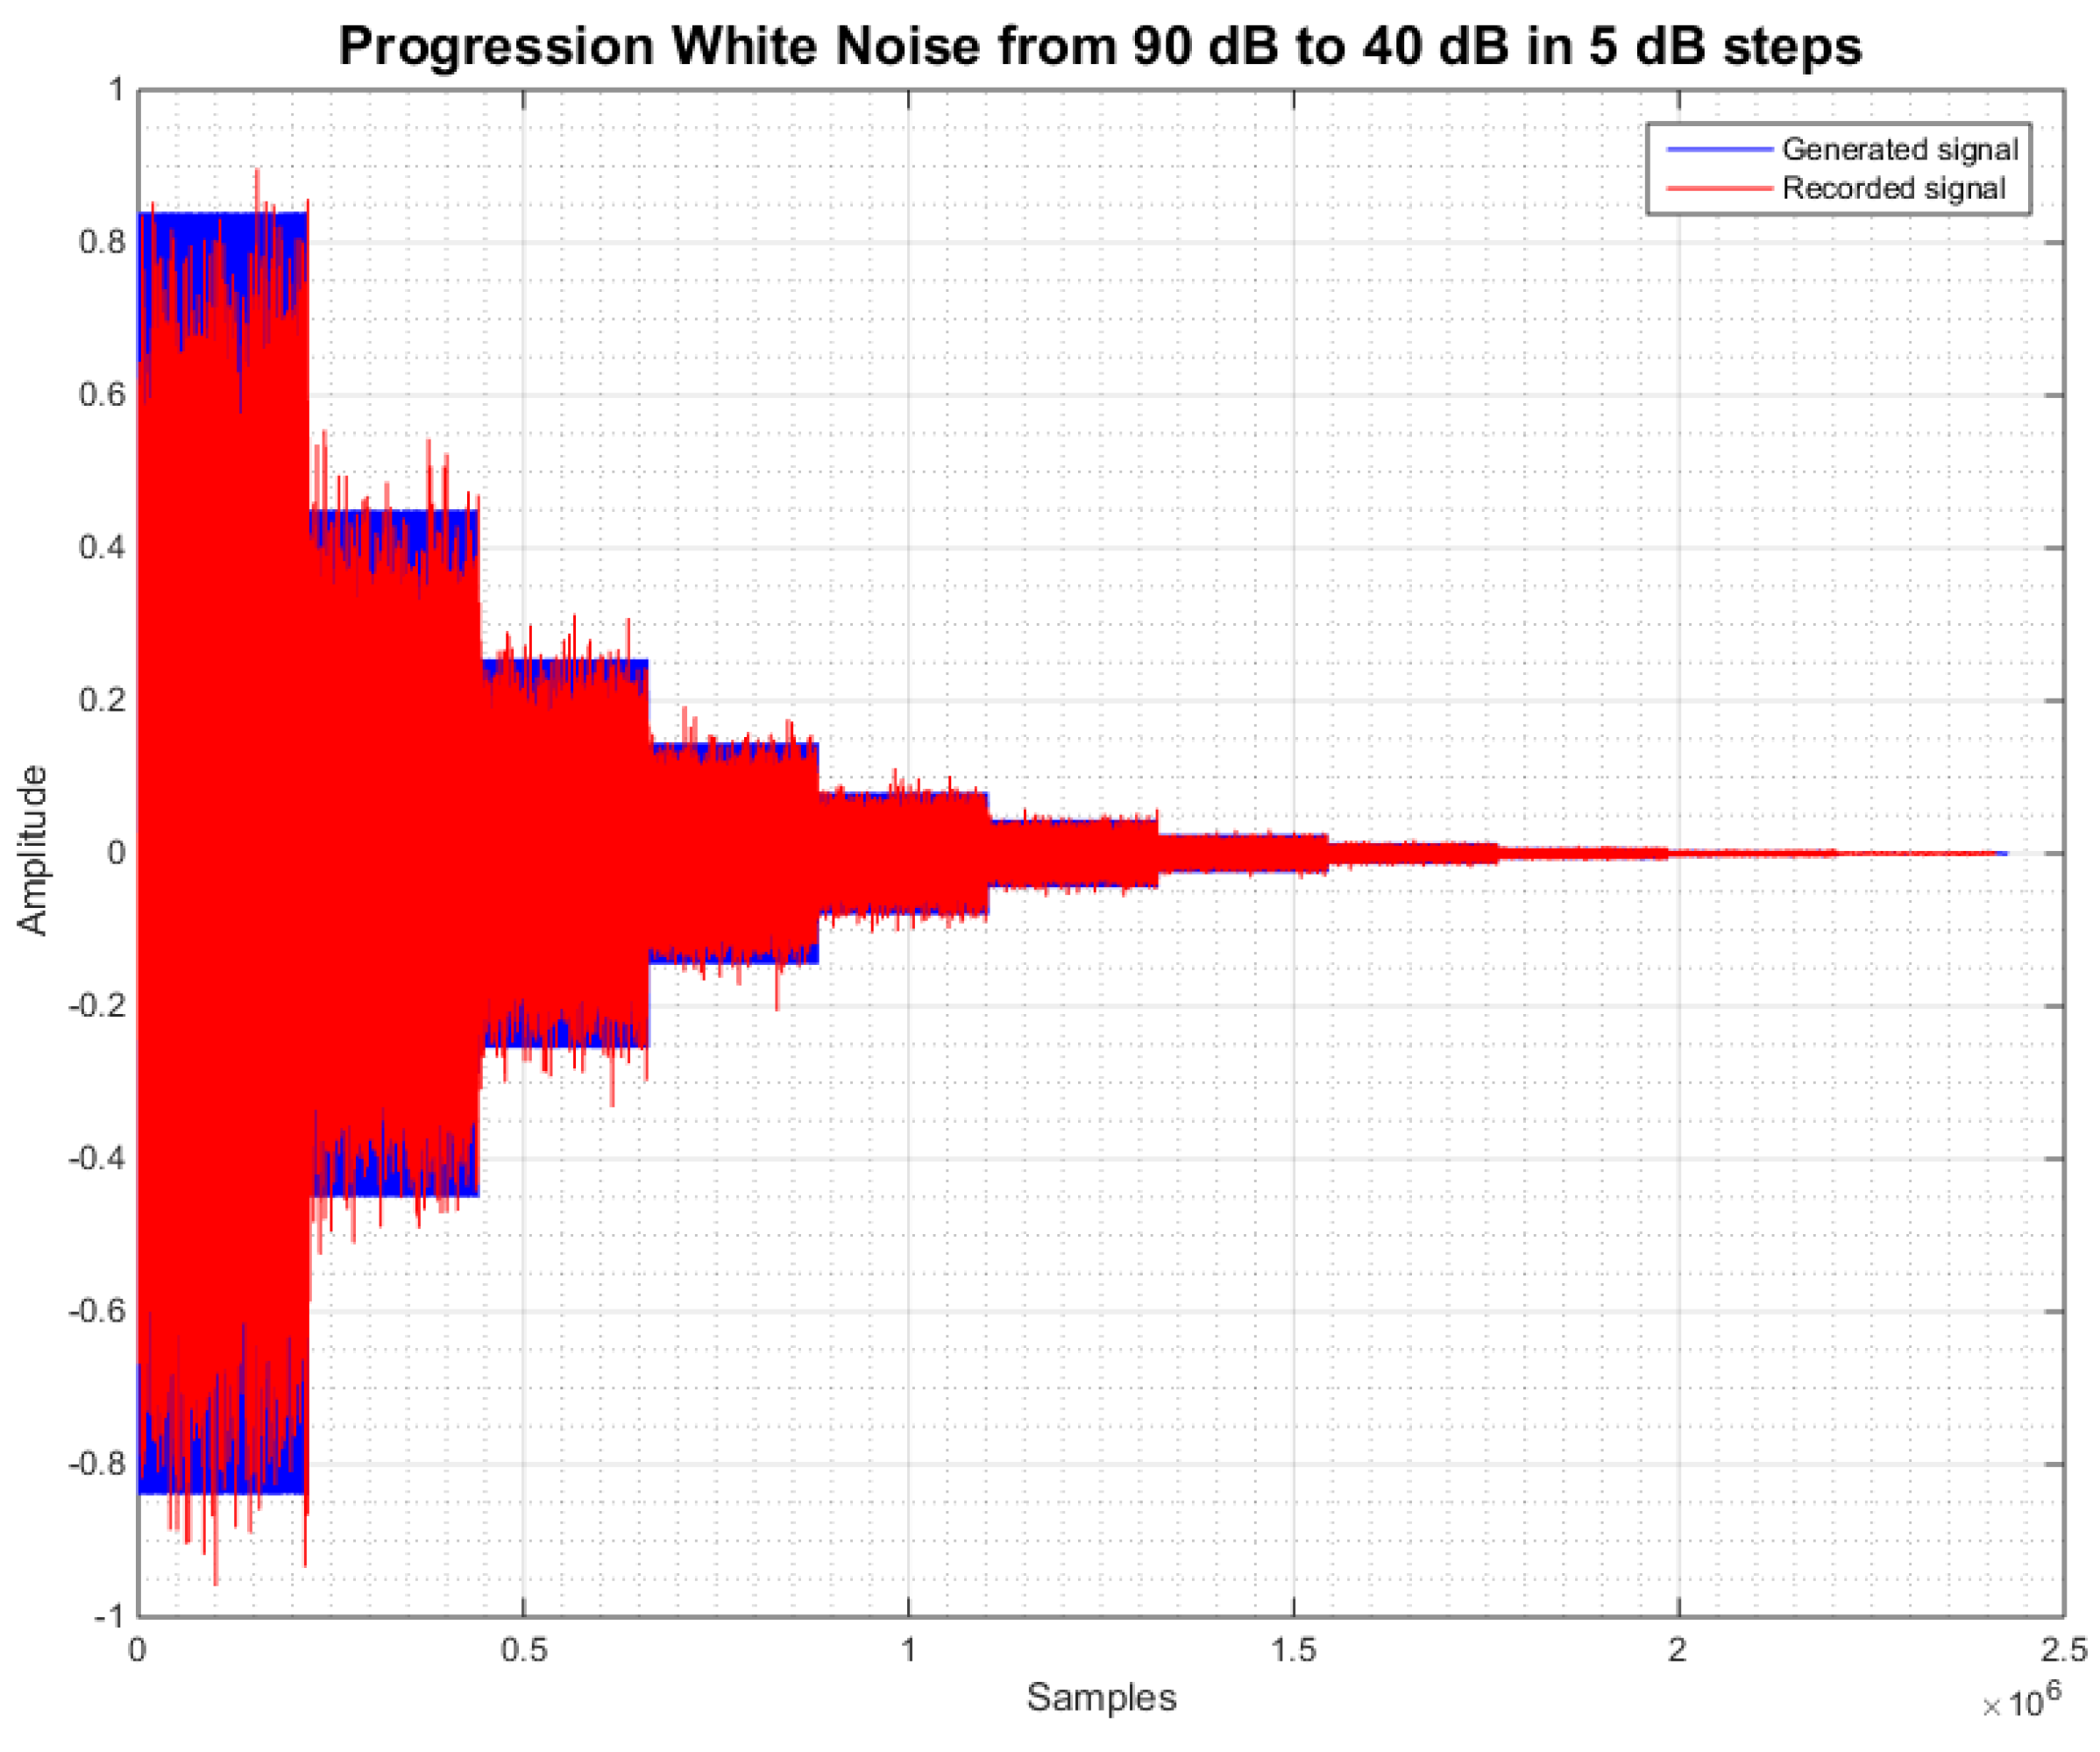
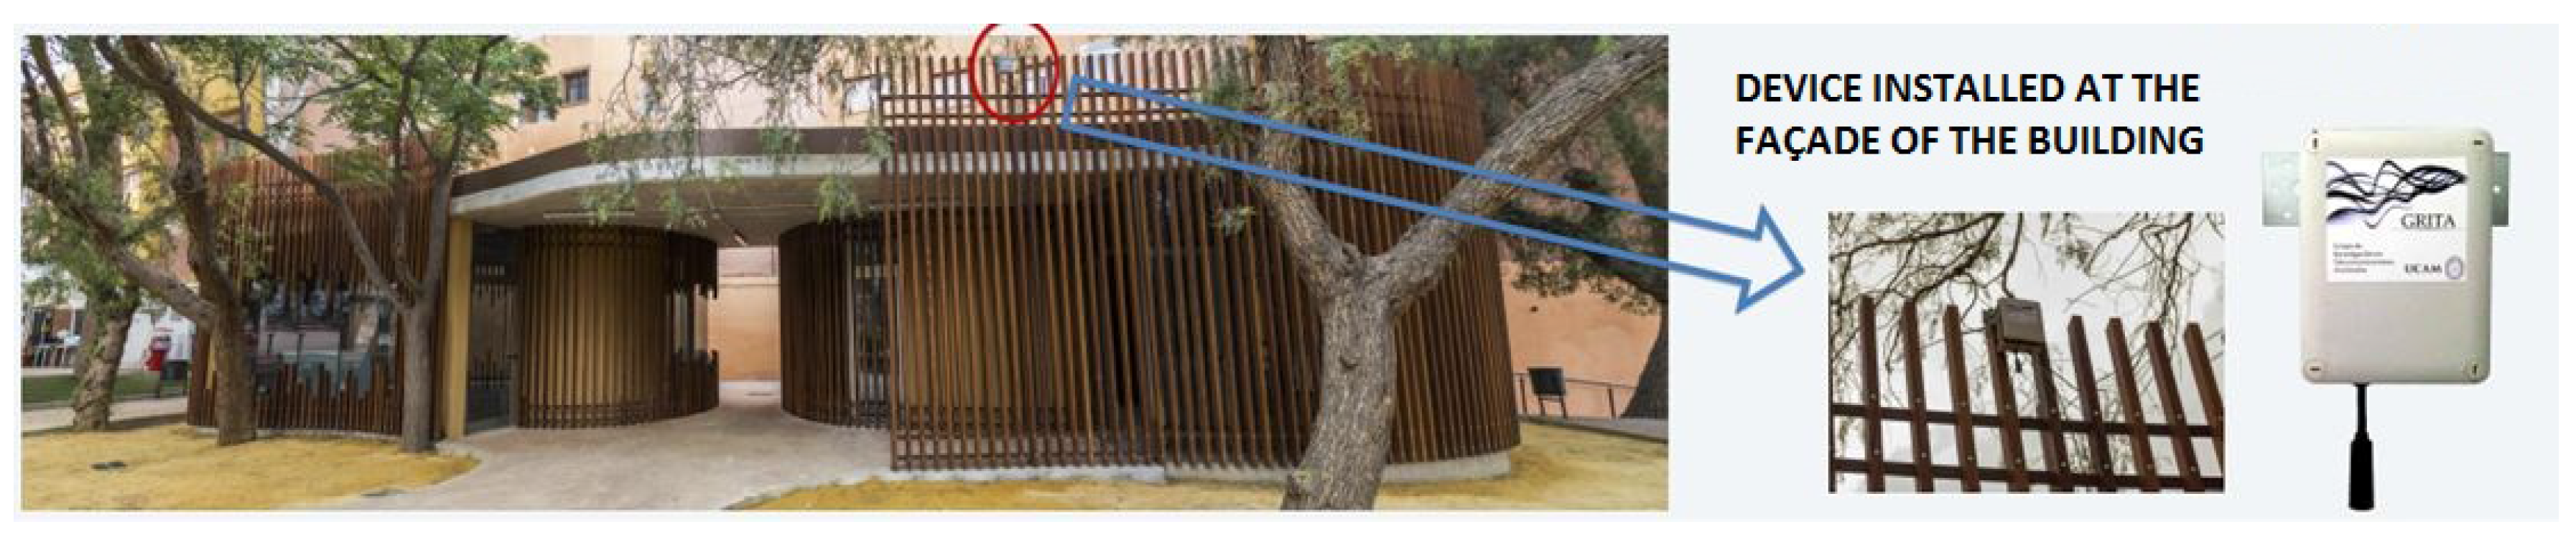
Pilot Test
4. Discussion
Acknowledgments
Author Contributions
Conflicts of Interest
Abbreviations
| Carbon Dioxide | |
| SBC | Single Board Computer |
| IoT | Internet of Things |
| USB | Universal Serial Bus |
| GNU | GNU is Not Unix |
| SO | Operating System |
| SSH | Secure Shell |
| ALSA | Advanced Linux Sound Architecture |
| POE | Power over Ethernet |
| dBA | A-weighted Decibels |
| ADC | Analog-to-digital converter |
| API | Application Programming Interface |
| HTTP | Hypertext Transfer Protocol |
| JSON | JavaScript Object Notation |
| XML | eXtensible Markup Language |
| CSV | Comma-Separated Values |
References
- Dekoninck, L.; Botteldooren, D. Sound sensor network based assessment of traffic noise and air pollution. In Proceedings of the Euronoise 2015, Maastricht, The Netherlands, 31 May–3 June 2015; pp. 2321–2326.
- O’Flynn, B.; Martinez-Catala, R.; Harte, S.; O’Mathuna, C.; Cleary, J.; Slater, C.; Regan, F.; Diamond, D.; Murphy, H. SmartCoast: A wireless sensor network for water quality monitoring. In Proceedings of the 32nd IEEE Conference on Local Computer Networks (LCN 2007), Dublin, Ireland, 15–18 October 2007; pp. 815–816.
- Santini, S.; Ostermaier, B.; Vitaletti, A. First experiences using wireless sensor networks for noise pollution monitoring. In Proceedings of the Workshop on Real-World Wireless Sensor Networks, Glasgow, UK, 1–4 April 2008; pp. 61–65.
- Ising, H.; Kruppa, B. Health effects caused by noise: Evidence in the literature from the past 25 years. Noise Health 2004, 6, 5–13. [Google Scholar] [PubMed]
- Goines, L.; Hagler, L. Noise pollution: A modern plague. South. Med. J. 2007, 100, 287–294. [Google Scholar] [CrossRef] [PubMed]
- Singh, N.; Davar, S.C. Noise pollution-sources, effects and control. J. Hum. Ecol. 2004, 16, 181–187. [Google Scholar]
- Jeon, J.Y.; Lee, P.J.; You, J.; Kang, J. Perceptual assessment of quality of urban soundscapes with combined noise sources and water sounds. J. Acoust. Soc. Am. 2010, 127, 1357–1366. [Google Scholar] [CrossRef] [PubMed]
- Brown, A.L.; Kang, J.; Gjestland, T. Towards standardization in soundscape preference assessment. Appl. Acoust. 2011, 72, 387–392. [Google Scholar] [CrossRef]
- Healey, P. Urban Complexity and Spatial Strategies: Towards a Relational Planning for Our Times; Routledge: Abingdon, UK, 2006. [Google Scholar]
- Chinrungrueng, J.; Sunantachaikul, U.; Triamlumlerd, S. Smart parking: An application of optical wireless sensor network. In Proceedings of the International Symposium on Applications and the Internet Workshops, Hiroshima, Japan, 15–19 January 2007; p. 66.
- Kim, S.; Pakzad, S.; Culler, D.; Demmel, J.; Fenves, G.; Glaser, S.; Turon, M. Health Monitoring of Civil Infrastructures Using Wireless Sensor Networks. In Proceedings of the 6th International Symposium on Information Processing in Sensor Networks, Cambridge, MA, USA, 25–27 April 2007; pp. 254–263.
- Segura-Garcia, J.; Felici-Castell, S.; Perez-Solano, J.J.; Cobos, M.; Navarro, J.M. Low-Cost Alternatives for Urban Noise Nuisance Monitoring Using Wireless Sensor Networks. IEEE Sens. J. 2015, 15, 836–844. [Google Scholar] [CrossRef]
- Manvell, D. Utilising the Strengths of Different Sound Sensor Networks in Smart City Noise Management. In Proceedings of the Euronoise 2015, Maastricht, The Netherlands, 31 May–3 June 2015; pp. 2303–2308.
- Farrés, J.C. Barcelona noise monitoring network. In Proceedings of the Euronoise 2015, Maastricht, The Netherlands, 31 May–3 June 2015; pp. 218–220.
- Hakala, I. Area-based environmental noise measurements with a wireless sensor network. In Proceedings of the Euronoise 2015, Maastricht, The Netherlands, 31 May–3 June 2015; pp. 2351–2356.
- Yen, J. H. U.S. PCI/ISA Bus Single Board Computer Card/CPU Card and Backplane Using Eisa Bus Connectors and Eisa Bus Slots. U.S. Patent 5,852,725, 22 December 1998. [Google Scholar]
- Curran, M.A.; Diehl, R.J.; Peck, G.A.; Rahaman, K.L. Single Board Computer Quotation and Design System and Method. U.S. Patent 6,898,580, 24 May 2005. [Google Scholar]
- Tso, F.P.; White, D.R.; Jouet, S.; Singer, J.; Pezaros, D.P. The Glasgow Raspberry Pi cloud: A scale model for cloud computing infrastructures. In Proceedings of the International Conference on Distributed Computing Systems, Philadelphia, PA, USA, 8–11 July 2013; pp. 108–112.
- Noriega-Linares, J.E.; Navarro, J.M.; Felici, S.; Segura, J. Monitorización del Aislamiento a Ruido Aéreo Mediante Redes de Sensores Inalámbricas. In Proceedings of the Tecniacústica 2014, Murcia, Spain, 29–31 October 2014; pp. 351–359.
- UNE-ISO 1996-1:2005. Acoustics: Description, Measurement and Assessment of Environmental Noise. Part 1: Basic Quantities and Assessment Procedures; ISO: Geneva, Switzerland, 2005. [Google Scholar]
- Passchier-Vermeer, W.; Passchier, W.F. Noise exposure and public health. Environ. Health Perspect. 2000, 108, 123–131. [Google Scholar] [CrossRef] [PubMed]
- Raspberry Pi 2 Model B Datasheet. Available online: https://cdn-shop.adafruit.com/pdfs/raspberrypi2modelb.pdf (accessed on 5 July 2016).
- T-bone GC100. Available online: http://www.tbone-mics.com/en/product/information/details/-d9d6e87219/ (accessed on 5 July 2016).
- Raspbian.org. Available online: https://www.raspbian.org/ (accessed on 5 July 2016).
- Secure Shell. Available online: https://en.wikipedia.org/wiki/Secure_Shell (accessed on 5 July 2016).
- AlsaProject. Available online: http://www.alsa-project.org/main/index.php/Main_Page (accessed on 5 July 2016).
- Mendelson, G. All You Need To Know About Power over Ethernet (PoE) and the IEEE 802.3af Standard. Available online: http://kondorsecurity.com/store/media/pdf/PoE_and_IEEE802_3af.pdf (accessed on 5 July 2016).
- Inyector PoE TL-POE150S. Available online: http://www.tp-link.com/ar/products/details/?model=TL-POE150S (accessed on 5 July 2016).
- Splitter PoE TL-POE10R. Available online: http://www.tp-link.com/ar/products/details/?categoryid=234&model=TL-POE10R#over (accessed on 5 July 2016).
- Van Renterghem, T.; Thomas, P.; Dominguez, F.; Dauwe, S.; Touhafi, A.; Dhoedt, B.; Botteldooren, D. On the ability of consumer electronics microphones for environmental noise monitoring. J. Environ. Monit. 2011, 13, 544–552. [Google Scholar] [CrossRef] [PubMed]
- WM-61A Datasheet. Available online: http://industrial.panasonic.com/cdbs/www-data/pdf/ABA5000/ABA5000CE22.pdf (accessed on 26 August 2016).
- NC-74 Datasheet. Available online: http://www.noise-and-vibration.co.uk/files/pdfs/NC-74.pdf (accessed on 5 July 2016).
- Mainetti, L.; Patrono, L.; Vilei, A. Evolution of wireless sensor networks towards the internet of things: A survey. In Proceedings of the 19th International Conference on Software, Telecommunications and Computer Networks (SoftCOM), Split, Croatia, 15–17 September 2011; pp. 1–6.
- Luo, J.; Chen, Y.; Tang, K.; Luo, J. Remote monitoring information system and its applications based on the Internet of Things. In Proceedings of the International Conference on Future BioMedical Information Engineering (FBIE 2009), Sanya, China, 13–14 December 2009; pp. 482–485.
- Internet of Things—ThingSpeak. Available online: https://thingspeak.com/ (accessed on 5 July 2016).
- IoT—ThingSpeak Results. Available online: https://thingspeak.com/channels/38915 (accessed on 26 August 2016).
- IoT—ThingSpeak Results. Available online: https://thingspeak.com/channels/38916 (accessed on 26 August 2016).


| Part | Comercial Name | Price |
|---|---|---|
| Main board | Raspberry Pi 2 Model B | 35 $ |
| Microphone | T-Bone GC 100 USB | 16 $ |
| POE Splitter | TP-Link TL-POE10R Splitter Power Over Ethernet | 17 $ |
| POE Injector | TP-LINK TL-POE150S Injector Power Over Ethernet | 26 $ |
| Enclosure | 150 mm × 200 mm × 85 mm IP67 Enclosure | 15 $ |
| Cables and consumables | various | 12 $ |
| Total price per node | 121 $ |
| Rion NL-05 | Raspberry Pi Node |
|---|---|
| 90 | 91.1 |
| 85 | 85.1 |
| 80 | 80.3 |
| 75 | 75.45 |
| 70 | 70.39 |
| 65 | 65.27 |
| 60 | 60.2 |
| 55 | 55.21 |
| 50 | 50.18 |
| 45 | 46.15 |
| 40 | 39.85 |
© 2016 by the authors; licensee MDPI, Basel, Switzerland. This article is an open access article distributed under the terms and conditions of the Creative Commons Attribution (CC-BY) license (http://creativecommons.org/licenses/by/4.0/).
Share and Cite
Noriega-Linares, J.E.; Navarro Ruiz, J.M. On the Application of the Raspberry Pi as an Advanced Acoustic Sensor Network for Noise Monitoring. Electronics 2016, 5, 74. https://doi.org/10.3390/electronics5040074
Noriega-Linares JE, Navarro Ruiz JM. On the Application of the Raspberry Pi as an Advanced Acoustic Sensor Network for Noise Monitoring. Electronics. 2016; 5(4):74. https://doi.org/10.3390/electronics5040074
Chicago/Turabian StyleNoriega-Linares, Juan Emilio, and Juan Miguel Navarro Ruiz. 2016. "On the Application of the Raspberry Pi as an Advanced Acoustic Sensor Network for Noise Monitoring" Electronics 5, no. 4: 74. https://doi.org/10.3390/electronics5040074