1. Introduction
Modern critical infrastructures (CI) rely on advanced information and communication technologies (ICT) which have an important role in their monitoring and control. CIs are assets of high importance to the society, such as electricity networks including generation, transmission and distribution, gas network for production, transportation and distribution, financial services (banking, clearing), transportation systems (fuel supply, railway network, airports, harbours, inland shipping), etc. Typically, an ICT layer is employed since it improves the control of the CI leading to better performance while reducing the operational cost. Controlling a CI by means of an ICT framework aims at (a) production profit maximization; (b) satisfying the service demand while ensuring that the parameters of the underlying process are within predetermined limits; and (c) achieving the required operational performance while preventing the occurrence of any type of undesirable behavior.
In principle, each CI should employ its own ICT infrastructure to maximize security. However, in practice, the tendency is to share the ICT layer for minimizing the cost of installation, operation, maintenance, etc. [
1,
2,
3]. The specific advantage comes with the drawback of increased vulnerability since a successful attack on the ICT layer may provide control to multiple CIs. The main type of cyber threats occur on Supervisory Control And Data Acquisition (SCADA) systems [
4,
5]. A recent paradigm is the Stuxnet worm [
6] which compromised industrial control systems. Even though cyber attacks are not common, they have a hazardous socioecomonic impact [
7]. There have been several recent cyber attacks with very unfortunate consequences, such as (a) in August 2012, the Saudi oil giant Aramco was subjected to a large cyber attack [
8] that affected about 30,000 workstations; (b) in April 2012, the big payment processing provider Global Payments confirmed a massive breach [
9] that compromised about 1.5 million cards; (c) in January 2013, the U.S. Department of Energy underwent an intrusion [
10] to 14 of its servers and many workstations located at the Department’s headquarters, aimed at exfiltrating personal information about its employees; and (d) a very recent attack [
11] that lasted two years was detected in the Woods Hole Oceanographic Institution. The organization sustained a “sophisticated, targeted attack” which has resulted in the theft of US commercial secrets, potentially sensitive government information, and military data.
The present article focusses on detecting integrity attacks occurring in the ICT layer. These can be implemented either by affecting the power grid components/equipment, which are responsible for distribution systems, or by manipulating the exchanging protocol messages in order for the attacker to send malicious data to the field device or the control center operator [
12]. There exist different lines of thought in the literature: (a) methods detecting
known time-profiles, so-called signatures, of intrusions, e.g., [
13]; (b) approaches using
countermeasures, i.e., inserting information in the involved signals for facilitating the detection of cyber attacks [
14], and (c)
novelty detection algorithms, i.e., algorithms which search for patterns not existing within the nominal data which may comprise evidence of cyber attacks.
This work concentrates on the third class which is the most generic one, as it can detect integrity attacks of unknown patterns without increasing the computational complexity of the operation of the system. The first class comes with limited capabilities as the attack should have been previously encountered and recorded, not to mention that an experienced attacker would design a novel kind of attack. In our opinion, it may be used as the first line of defence. The drawback of the second class is the fact that it raises computational complexity while there is always the danger of an attacker understanding the authentication scheme by long-term monitoring of the CI and then possessing the ability to permanently exploit the CI undetected.
There are several papers that approach the problem based on the third line of thought. A probabilistic neural network is proposed in [
15] for detecting faults appearing in power utilities which are controlled by a broadband network. However, integrity attacks were not considered. A rough classification algorithm is employed in [
16], which provides a set of rules for detecting anomalies on data associated with a power system control center. The algorithm requires a quite large amount of data while it is affected by noise which may alter the set of rules significantly. An
n-gram analytical model is designed in [
17] for detecting anomalies in SCADA systems. The anomalies include simple fault cases without the presence of integrity attacks. It is worth mentioning a similar line of works focusing on the detection of bad data provided by phasor measurement units [
18,
19].
This paper addresses the problem of integrity attacks occurring in an ICT-controlled CI. Even though the topic is of significant importance, it still needs attention from the scientific community since most approaches examine it only on the side of the cyber layer [
20]. The main objective is to design a detector providing a very low (close to zero) false negative rate, while a low false positive rate would be advantageous. The proposed technique is applied on the data coming from the physical CI layer, which in the experiments is the IEEE 30-bus model. We take advantage of the relationships existing within the voltage measurements of each network node. Linear time invariant models are built to approximate each relationship, and the distribution of their parameters is learned by means of Gaussian mixture models. Subsequently, a clustering scheme based on the Kullback–Leibler divergence is used to detect abnormalities in the incoming data. The main novelties of this approach are the usage of a limited amount of data, and its modularity (meaning that new nominal states can be easily inserted in the framework) while there is no need to know any information regarding the nature of the integrity attacks a priori. Finally, it is the first time that a generative modelling technique, such as Gaussian Mixture Models (GMM), is applied onto the specific problem.
In this work, the objective is to quickly detect the attack jeopardizing the operation of the network without localizing it. In such cases, prompt detection is of critical importance and may be proven particularly beneficial towards limiting or even eliminating the hazardous consequences of such events. After an attack detection, the network operator may decide to switch to an operational state which ensures service while restricting, confining or even overriding the usage of the ICT layer suffering the attack. This way, the network can still satisfy the service demand (even without working while operating in an optimal manner) while the attack will have minimum affects on its components. Concurrently, a localization algorithm can be employed (as the one presented for example in [
21]) to isolate the component that is not functioning properly and restore its operation. In addition, prompt detection and switching to ICT-free operation may be useful for identifying the root cause of the problem and even locating the attacker due to the very fast detection. It should be noted that most infrastructures can already operate in such a mode since the ICT layer was added later for automatic control of the resources and optimizing the overall performance of the infrastructure. The drawback is the non-optimal control of the infrastructure, which, however, is advantageous when compared to the catastrophic consequences that an integrity attack may cause.
The rest of this article is organized as follows:
Section 2 formalizes the problem while
Section 3 explains Linear Time Invariant (LTI) and GMM modeling, and the clustering process. The experimental set-up and results are provided in
Section 4 while
Section 5 concludes this work.
2. Problem Definition
We consider a network of interdependent infrastructures composed by
N nodes which can produce either
homogeneous measurements, i.e., of the same physical quantity (e.g., only voltages), or
heterogeneous meaning that they are associated with different physical quantities (e.g., voltage phasor, frequency, and rotor angle measurements). The underlying assumption in this work is that the produced measurements are related to some extent since altogether they form a framework providing a particular service, e.g., an electrical distribution network. Thus, the data coming from the nodes are indirectly related to each other. The proposed method does not assume the existence of an analytical model of the specific relationship [
22], it rather aims at learning the dynamics of the system solely by inspecting the data. In addition, the method is independent of network topology or routing/synchronization protocol.
Let be the scalar-in-time datastream produced by the i-th node. At an unknown time instant , an abnormal situation, i.e., an integrity attack, affects node i. No assumptions are made with respect to the magnitude or the time profile of the incident influencing the data generation process. The ultimate goal is to detect promptly and identify correctly the nature of the occurred incident.
3. Probabilistic Modeling
This section describes the way the dataset is modeled for optimizing the detection of malicious events. The basic idea behind the proposed method is to create points in the probabilistic space, where each one describes a case of the normal operation. The larger the dataset, the more the respective points and thus the more accurate the mathematical description of the normal operating modality. The specific points comprise an abstract representation of the system while working under nominal conditions. When we need to test novel data coming from the network for potential abnormalities, we measure the distance between the respective point and the ones describing the normal network state. If the distance is over a threshold, the specific data is associated with an abnormality; otherwise, it is considered that the system is within the normal operating limits. The threshold is set equal to the maximum distance existing among the training points. In the following subsections, we explain the proposed modeling type and algorithm.
3.1. Gaussian Mixture Modeling of LTI Coefficients
The various normal system states are represented by Gaussian mixture models, an important characteristic of which is their ability to approximate with high accuracy every possible distribution as long as a sufficient amount of data is available [
23]. A weighted sum of Gaussian functions is fit to the available data while the associated parameters are learned using the Expectation-Maximization (EM) algorithm.
A GMM composed of M Gaussian components is given by the next equation: , where x is a continuous-valued data vector, the weight of the i-th component (), and g denotes the Gaussian component. In our case, x represents the coefficients of linear time-invariant models approximating the relationship between the datastreams of the power grid nodes.
The LTI model is described by the general
discrete-time linear Multiple-Input Single-Output structure [
24]:
where
is an independent and identically distributed random variable accounting for the noise,
m is the number of inputs,
z is the time-shift operator, while
and
represent z-transfer functions, whose parameter vectors are
and
, respectively. Consequently an element
in the approximating model family
is fully described with a
, which comprises the above parameter vectors, i.e.,
. Following the logic of [
25], we create an ensemble of dynamic models (e.g., Autoregressive with Exogenous Input, Autoregressive Moving Average with Exogenous Input, Output Error, etc.) with various orders and select the one which best fits the datastreams (i.e., lowest reconstruction error) while low-order models are preferred. The model search algorithm minimizes a robustified quadratic prediction error criterion [
26]. It should be mentioned that the methodology is independent of the model type selection and can be applied using another type without any modifications.
Moving on, it should be mentioned that each density has the following form:
where
D denotes the size of
x,
the mean vector and
the covariance matrix.
A GMM may be completely defined by the mean vectors
μ, the covariance matrices
σ and the mixture weights
w with respect to every component density. These parameters are typically assembled as
while the covariance matrices can belong to a variety of forms, e.g., full, constrained, etc. This choice depends on the requirements of the application and here we employ Gaussian functions of diagonal covariance because they can potentially be equally effective to the full ones [
27,
28] at a much lower computational cost due to their simplicity. Moreover, by combining Gaussians with diagonal covariance bases, one is able to capture the correlations existing between the elements of the feature vector.
3.2. k-Nearest Neighbor Clustering Using Kullback–Leibler Divergence
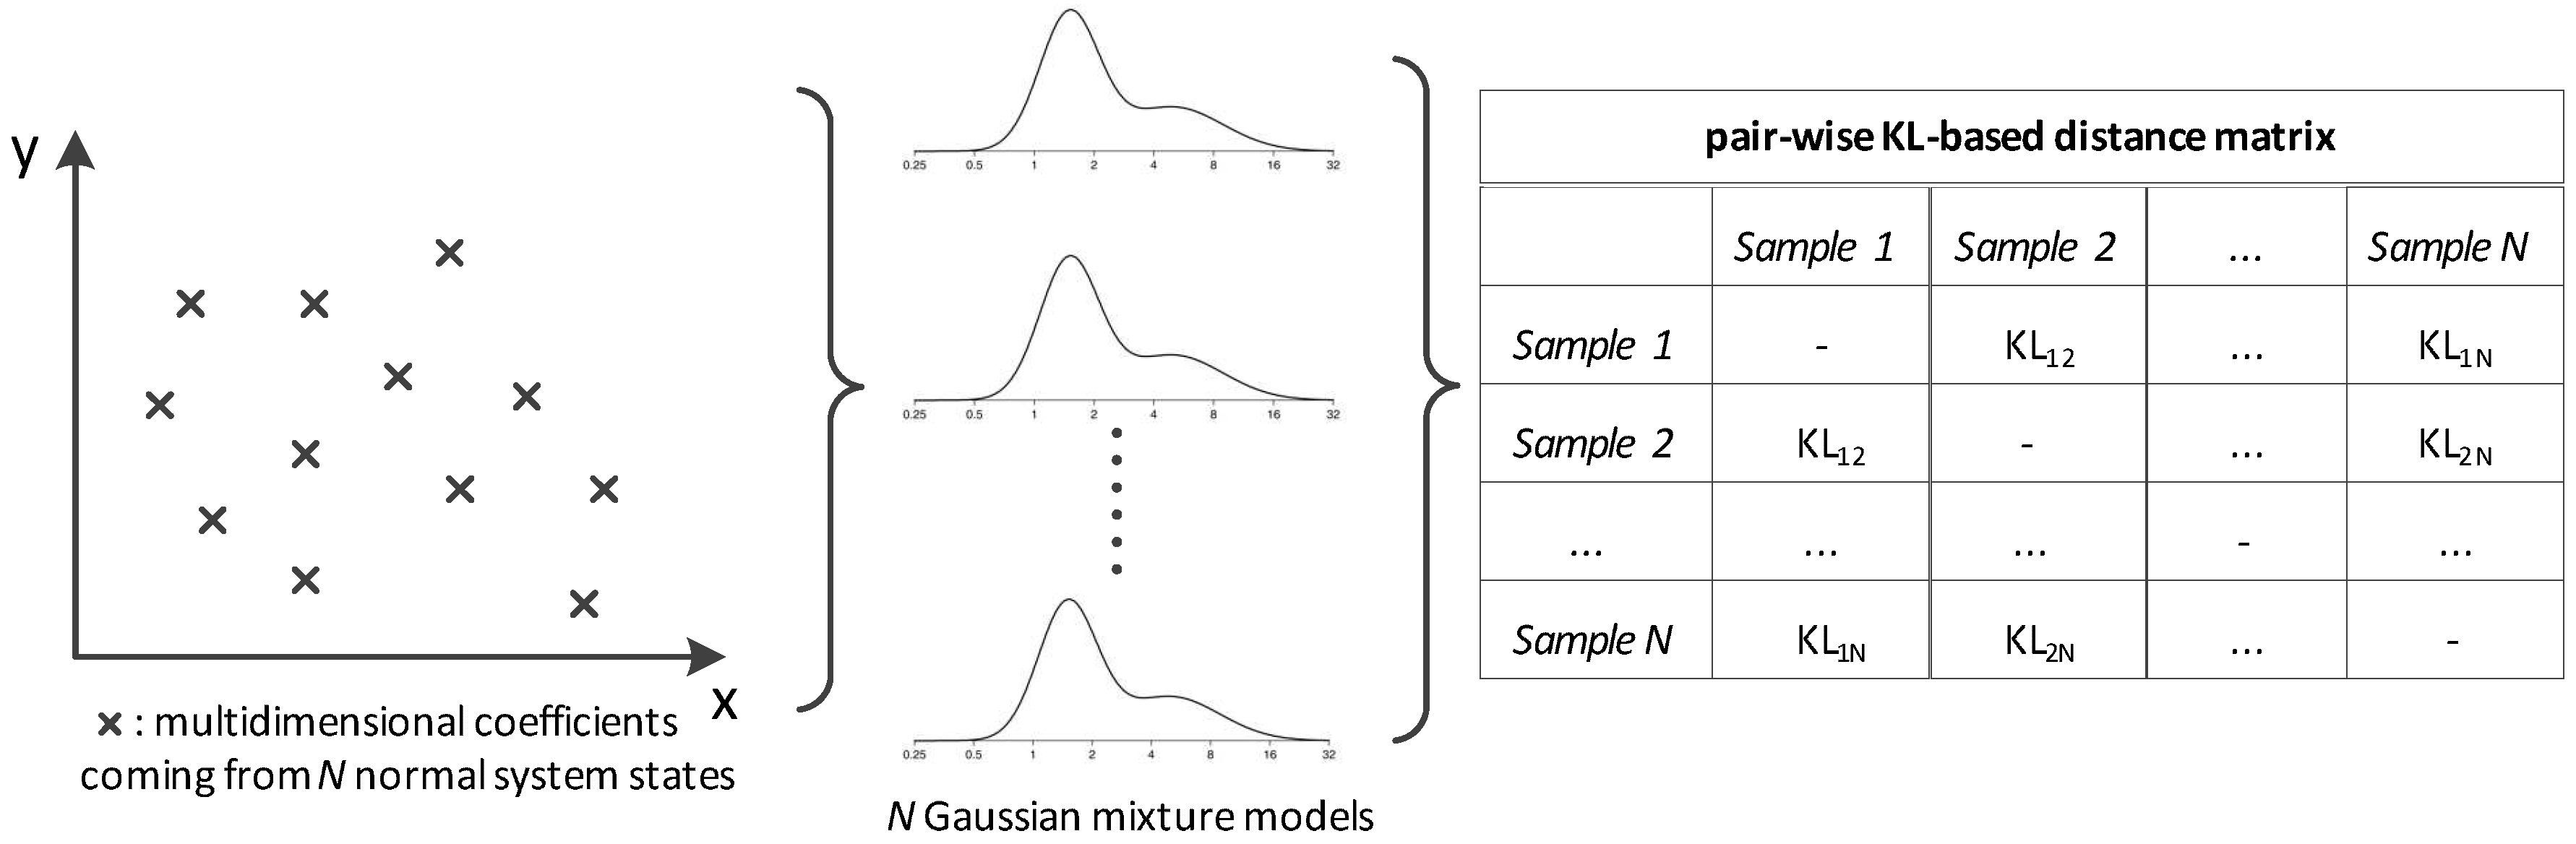
This subsection details the way the LTI coefficients are represented in the stochastic plane for achieving clustering. Here, the aim is to assess the similarity, denoted as
, between the data under investigation and ones coming from the nominal state which were processed during the training of the system. This work proposes that
can be estimated via Kullback–Leibler (KL) distances computed in the probabilistic space (see
Figure 1). Thus, the normal state is decomposed into a group of GMMs rather than using only one universal model.
More precisely, each data sequence is transformed to LTI parameters, the distribution of which is then estimated by means of a GMM, i.e.,
where
denotes the voltage datastream of the
i-th bus up to time
,
x the respective sequence of LTI parameters and
p its distribution in a Gaussian form.
The next step of the proposed methodology is the computation of the pairwise distances between every GMM pair in the set. For the computation of each distance, a Monte Carlo approximation of the KL divergence is employed, the outcome of which is inversely analogous to the proximity among the involved distributions. For two distributions denoted as
and
, the KL distance is defined as follows:
Due to the absence of a closed-form solution, the above formula is approximated by the empirical mean [
29]:
This metric represents the distance quite accurately given that t is sufficiently large. In the experiments included in this work, the number of Monte Carlo draws is . An important detail here is the fact that divergence is used as a distance metric, and thus symmetricity is required. However, in general, the quantity defined above is not symmetric, i.e., the distance may be different than . In order to satisfy this requirement, the following symmetrized form was inferred: .
Thus, the distance matrix
is derived with respect to every nominal system state as depicted in
Figure 1. This scheme can be parallelized to a
logic where the distance metric is the KL divergence.
is summed column-wise and the maximum value comprises the threshold
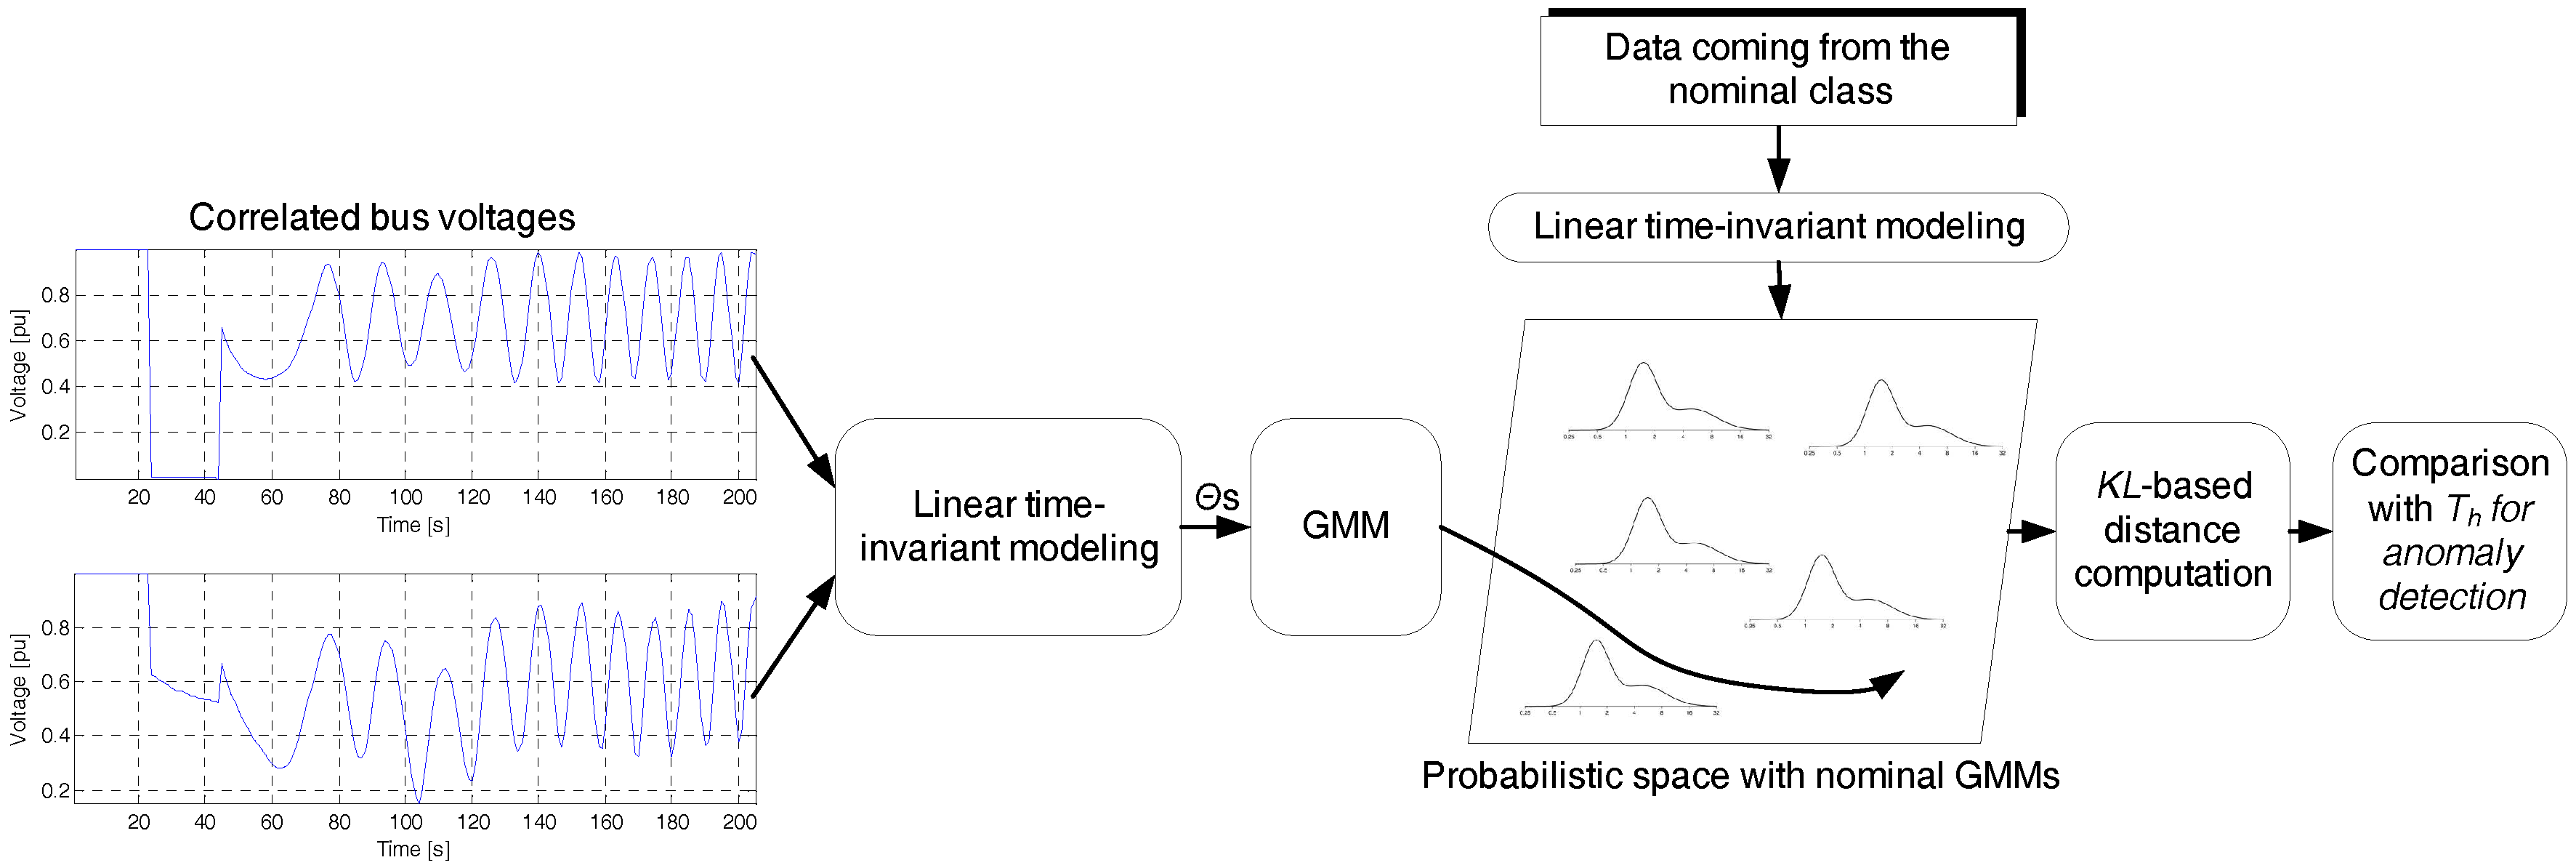
which discriminates between the normal vs. the rest of the data samples. Algorithm 1 demonstrates the process leading to integrity attack detection while a representative paradigm is depicted in
Figure 2. The following section describes the experimental set-up and analyses the results.
| Algorithm 1: The algorithm for detecting integrity attacks by receiving data from the physical layer of the interdependent CIs and modeling them by means of GMMs operating on the parameter space of LTI models. |
![Electronics 05 00082 i001]() |
4. Experimental Set-Up and Results
This section contains information regarding the experimental platform which was employed in this work along with the presentation and analysis of the experimental protocol and results.
4.1. The Platform
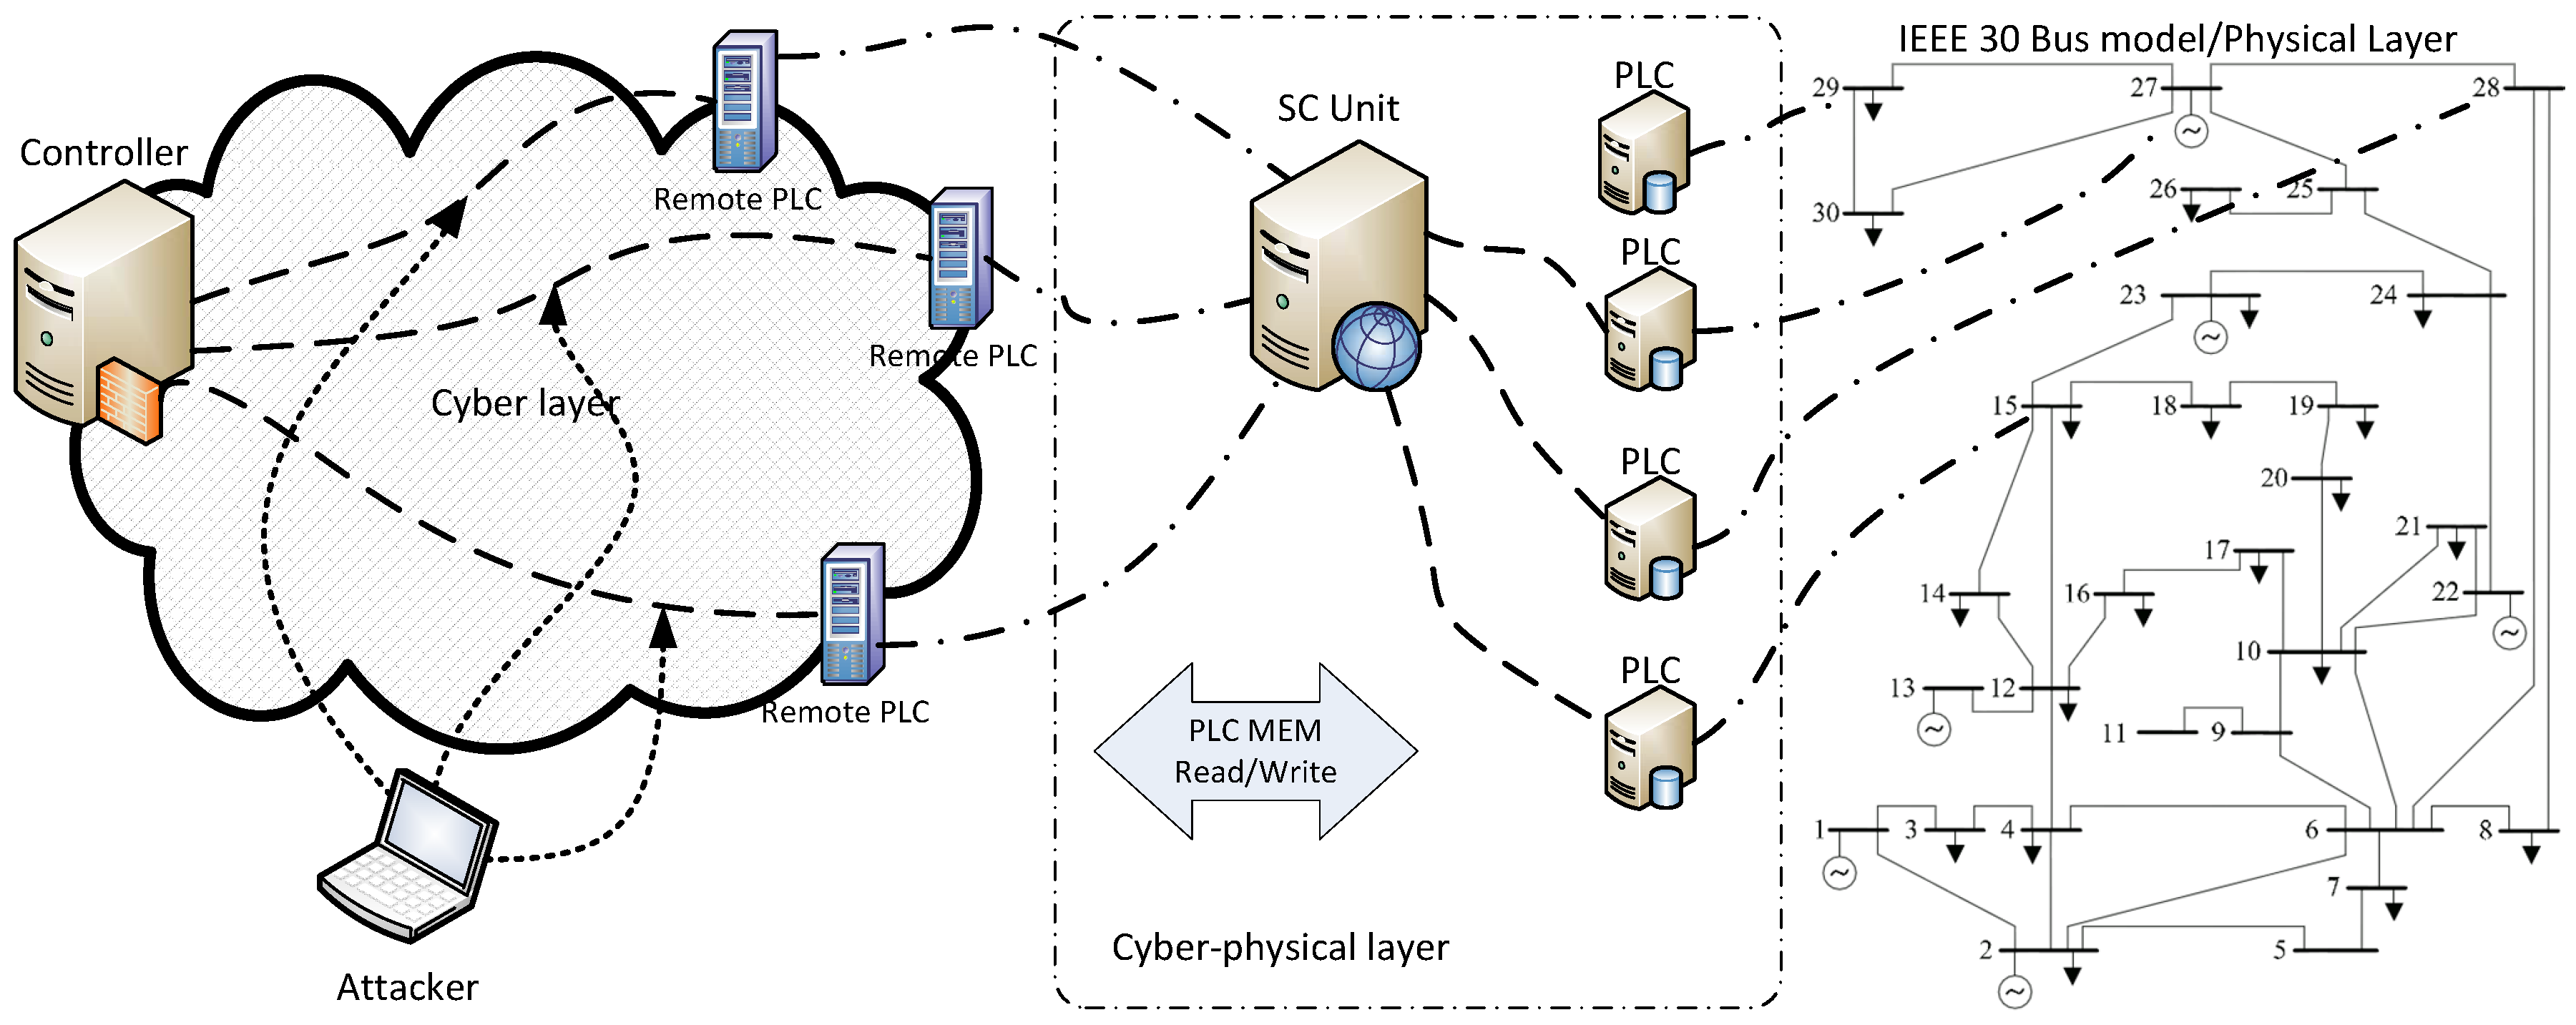
The experimental framework is shown in
Figure 3 and includes simulation of border gateway routing protocol, SCADA servers, and the corporate network. The specific representation enables studying of the failures appearing on each component of the cyber layer while simplifying the energy network due to the existence of accurate models. MATPOWER [
30] and Matdyn [
31] were employed at this phase while the simulation step was carefully chosen so as to realize the real-world process as accurately as possible. To this end, the simulation step was set equal to 20 ms after verifying that the output of real-time simulation reproduces as accurately as possible the real-world process. The case of IEEE 30 Model Bus was used which is considered to be representative of a portion of the American Electric Power System (in the Midwestern US) as of December, 1961 [
32]. The equivalent system has 15 buses, two generators, and three synchronous condensers, while it is worth mentioning that the 30-bus test case does not have line limits. The dynamic data of the model were used by the Matdyn software while the optimal power flow problematic was addressed by Matpower. The integrity attacks were performed on the real values of the bus voltages at randomly chosen time intervals as well as buses. It should be mentioned that, during the nominal state, the load fluctuates between margins predefined by the IEEE model while the sampling period is 20 ms.
A relatively recently developed platform is called the Assessment platform for Multiple Interdependent Critical Infrastructures (AMICI) [
33]. Here, the physical components are simulated while the cyber layer is emulated for obtaining a more realistic representation of the part where the cyber attacks take place. Emulab [
34,
35] includes the border gateway routing protocol, SCADA servers, and the corporate network. The specific representation (
Figure 3) enables studying of the failures appearing on each component of the cyber layer while simplifying the energy network due to the existence of accurate models.
One of the most important issues of the specific set-up is achieving synchronization between the simulated parts. In order to ensure that the simulated model runs at the same rate as the actual physical system, we employed PCs with multitasking OSs for execution. There are five Dell PCs with AMD 2GHz Athlon processor and 2GB RAM, running FreeBSD 10.1 . Simulink graphical programming was used here along with [
30] and Matdyn [
31] while the simulation step was carefully chosen so as to realize the real-world process as accurately as possible.
AMICI framework facilitates the simulation of Programmable Logic Controllers (PLCs) including their interaction with software models by transforming model values to measured voltage [
34] was employed in this work. More specifically, the messages from Remote Procedure Calls (RPC) are sent to Modbus and vice versa in the form of measured voltage. It should be emphasized that the implementation of client-side calls may offer realization of the interactions with other simulation units. The merit of the specific approach is that the data exchange is realized by an emulated network, thus closing the gap between real world conditions and the experimental platform.
4.2. Cyber-Attacks
The problem description considered in this paper assumes that the attacker has full access to the infrastructure, i.e., he may hijack node data according to his best interest, and thus perform a full-extent man-in-the-middle attack. In addition, the attacker may have the network under surveillance over an extended time interval so as to understand its dynamic behaviour and monitor any of the provided functionalities including component states, connectivity statuses, other type of measurements, etc.
During an attack, the control inputs are altered by the party implementing it, thus the information gathered by the controller is incorrect and the system becomes an open-loop, i.e., operator side control is lost. In such cases, the problem can only be tackled by prompt detection of the attack.
Based on the above described logic and the kinds of attacks considered in the literature (see
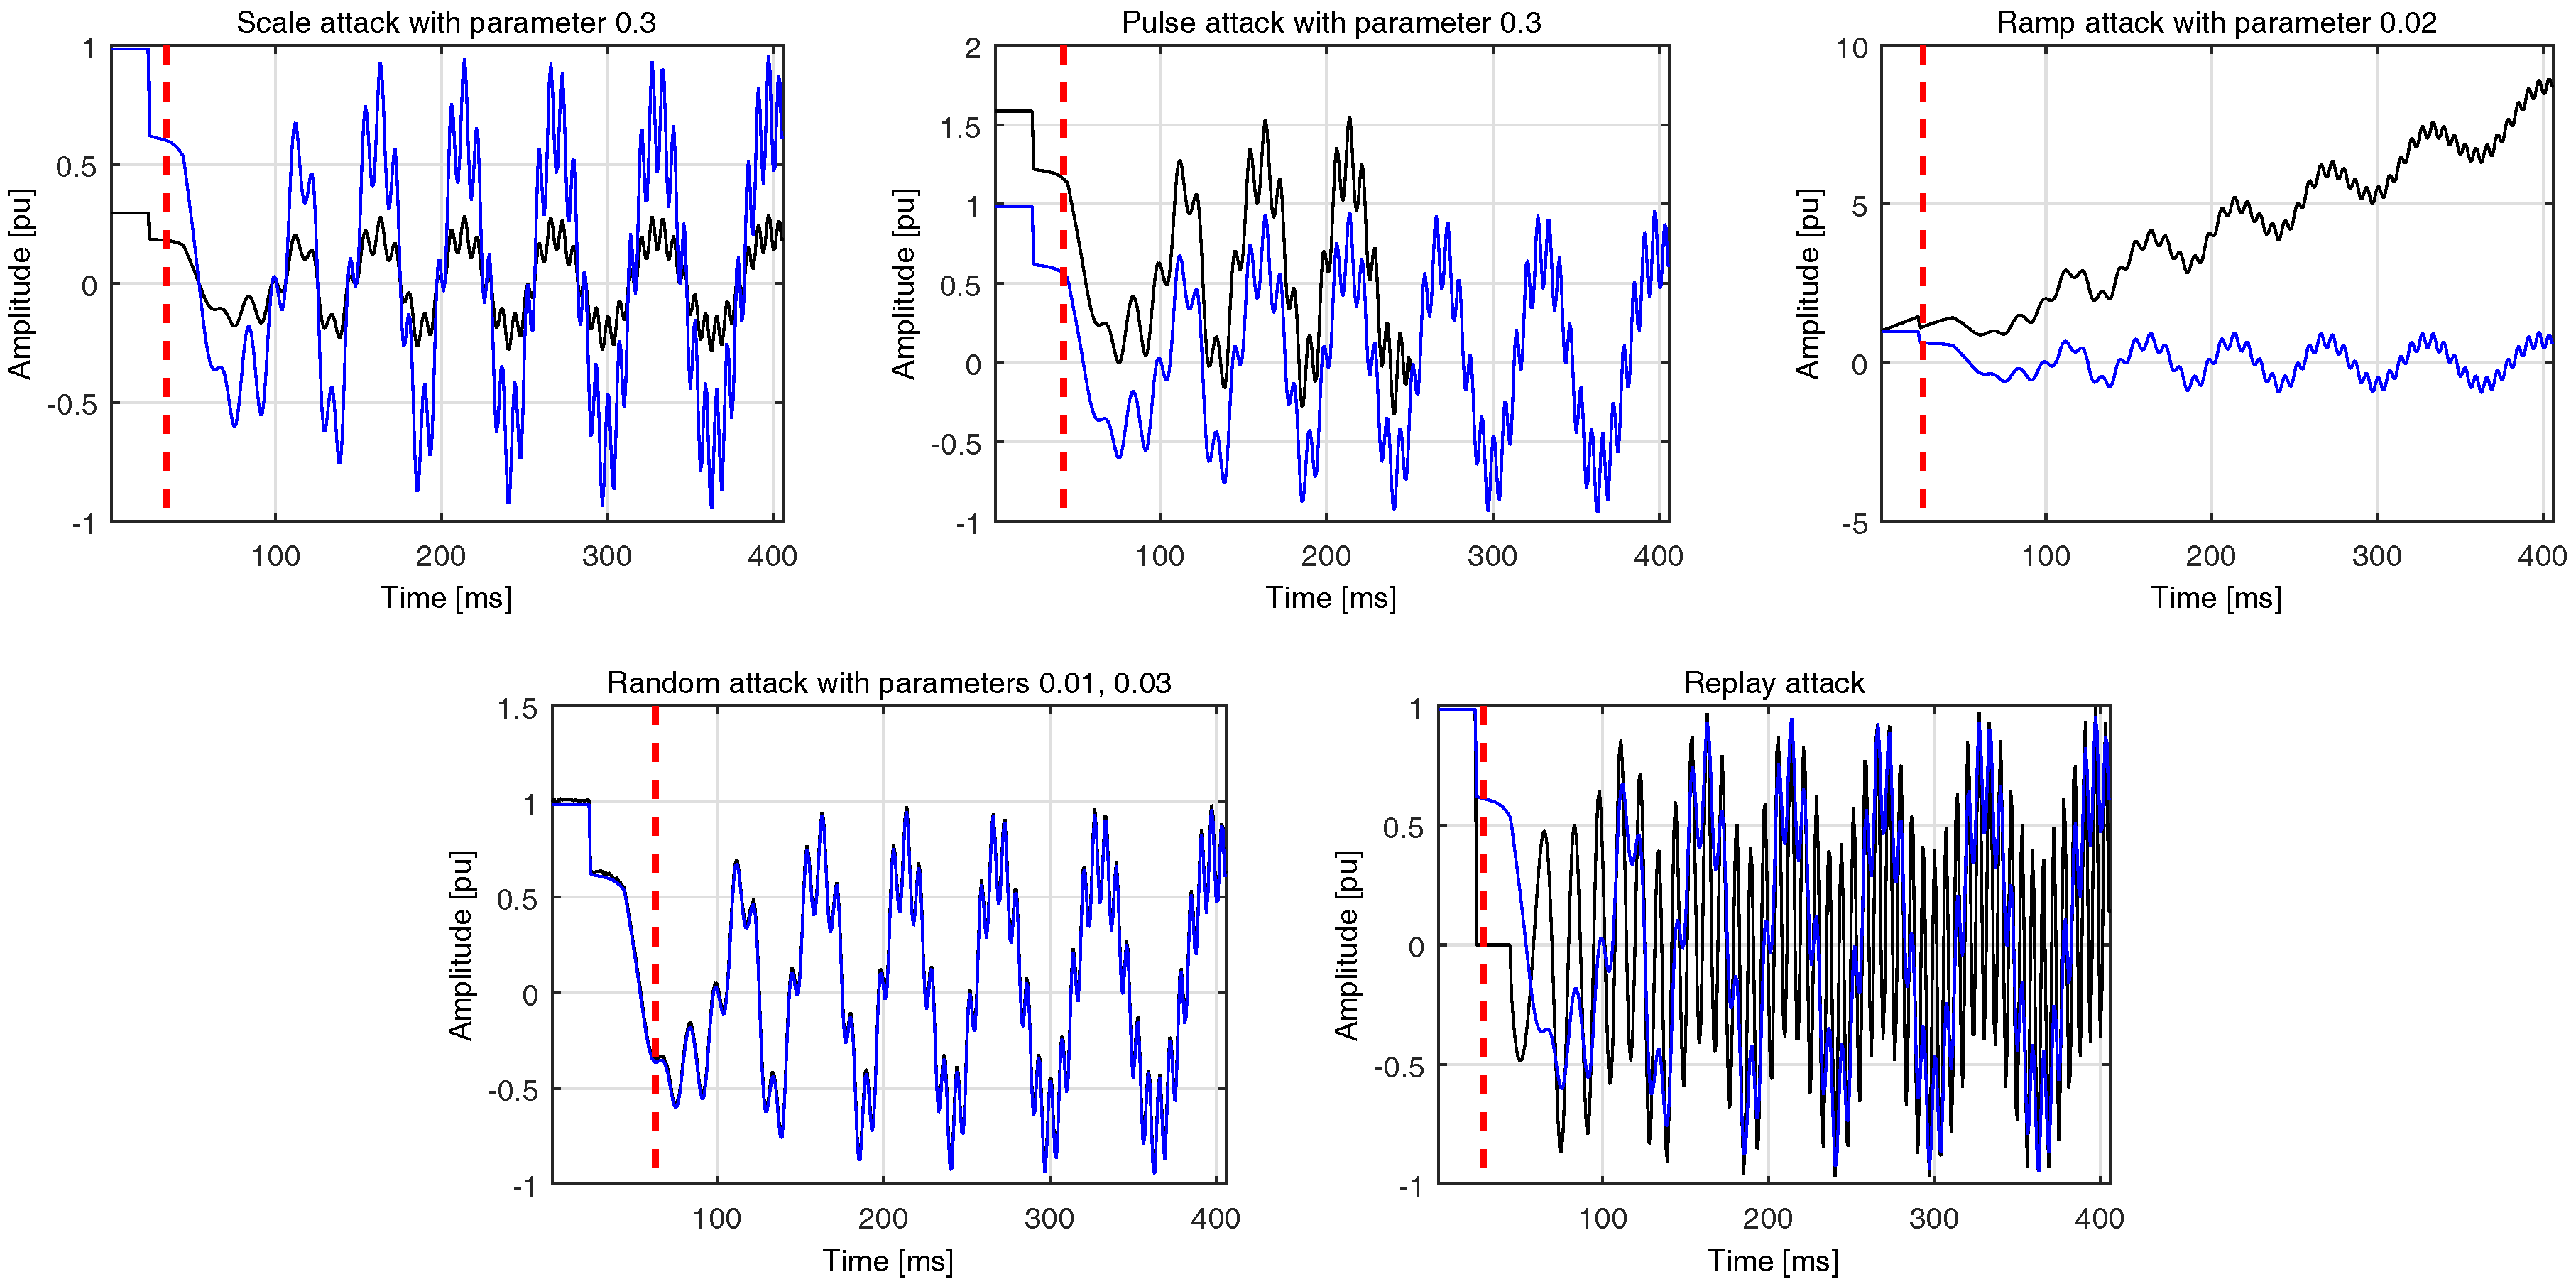
Section 1) in this paper, we encompass a generic set of integrity attacks representing a wide range of scenarios. More specifically:
Pulse: In this case, the datastream is altered according to an additive pulse :
, where
is the compromised data,
the data coming from the nominal network state as recorded by the attacker, and
where
is the attack parameter.
Scaling: Here the recorded measurements are scaled on the basis of the parameter : .
Ramp: During this attack type the recorded measurements are gradually modified by adding a ramp function with parameter : , where .
Random: This type of attack suggests summing the recorded datastream with a uniform random distribution from the interval : .
Replay: The final type of attack which is usually found in the literature with the descriptive name replay merely involves the identical repetition of a priori recorded data.
An important note is that the attacker may compromise the network using the same or a different attack type in time, e.g., he may initialize with a Replay attack and continue with a Random one.
4.3. Parametrization and Results
Due to the nature of the proposed solution, the parametrization needs to take place on two sides: (a) each LTI model was of an autoregressive type (this choice can be conveniently altered thanks to the modularity of the proposed framework) while the order was the one with the highest reconstruction capabilities on a validation set
taken out of the {3, 4, 5, 6, 7} set; and (b) for the Gaussian modelling part, the number of components was chosen from the set
, where the step is 1. Torch framework [
36] was employed for learning the model and during validation. The final number of Gaussian functions was selected after early experimentation while the upper bounds for
k-means and EM iterations were 50 and 100, respectively, with a threshold of 0.001 between subsequent iterations.
Special care is needed during the parametrization of the integrity attacks since the attacker knows that the data belonging to the entire network are regularly passing quality checks (see, for example, [
37]). As a consequence, the attack should be smart enough not to initialize the respective alarm type. The goal of the attacker is to have an impact on the overall network without compromising its stability in order to remain undetected. This facilitates information theft, usage of the network components according to his/her interests or any other action favouring the attacker. Based on this requirement, initial experimentations were conducted on the framework of
Figure 3 for coming up with a feasible set of integrity attack parameters. The attacks were implemented using the following set of parameters:
,
,
and random
. Replay attacks merely involve repetition of previously recorded data, thus there is no parameter to set.
The experimental data included a continuous operation of the system for 40,000 samples. The integrity attacks were affecting a randomly chosen bus at various time instances, i.e., at 10,000, 17,000, 23,000, 30,000, and 36,000. The attacks could be of the same or of a different type. The first 5000 samples coming from the nominal system state were employed for learning the probabilistic space shown in
Figure 2. The validation set
was comprised of the 2000 samples which follow the training ones. The performance of the proposed system was assessed on the rest of the data. The final results are averaged across all types of integrity attacks. Here, it should be noted that each attack scenario, i.e., a case with a specific parameter was executed 50 times. A representative set of integrity attacks is shown in
Figure 4.
The proposed generative modelling approach was contrasted to a discriminative one, i.e., the support vector machine (SVM) technique, which is appropriate for binary classification problems. The fundamental assumption behind the creation of an SVM is that there exists a high-dimensional hyperplane able to separate the two classes. A one-class SVM was trained (using the implementation provided by [
38]) on the nominal data using the radial basis function while the LTI parameters were scaled to
in a linear way.
The SVM kernel function is a Gaussian radial basis
one, while the soft margin parameter and
γ were determined though a grid search guided by cross- validation on the training set.
The LTI processing layer is based on linear ARX models with orders (2,2,1),and the resulting parameters are used for GMM and SVM learning. The orders were chosen as the ones providing the lowest reconstruction error on the validation set .
Since we deal with a detection task [
39], we employed the following three typical figures of merit to measure the capabilities of the proposed framework:
False positive (FP): it comprises the number of times that the proposed algorithm detects an integrity attack even though it is not present.
True positive (TP): it comprises the number of times that the proposed algorithm detects an integrity attack which is present.
False negative (FN): it comprises the number of times that the proposed algorithm does not detect an attack which is present.
True negative (TN): it comprises the number of times that the proposed algorithm does not detect an attack which is not present.
Detection Delay (DD): it measures the time delay for a correct detection by the proposed algorithm.
Comparative results are tabulated in
Table 1 with respect to the proposed GMM clustering approach and the one employing SVM. They were trained and tested on identical datasets in order to achieve a fair comparison. As we can see, the proposed approach reaches a higher performance level than the SVM with respect to every type of integrity attack. It achieves lower FP and FN rates along with smaller DDs. Some representative detection examples of the proposed method are demonstrated in
Figure 4. The complementary results of TP and TN rates confirm the superiority of the proposed approach over the contrasted one.
The attack which is detected faster by the proposed method is the pulse one, while the one with the highest latency is the ramp attack. We can observe that all the metrics are kept within very low values, which demonstrates the strength of the proposed approach, especially while considering the non linear characteristics of the specific application.
The merits of generative modelling are evident here since the distribution followed by the nominal state of the system is better captured and subsequently identified. The dependencies existing in the dataset are exploited by means of the parameter space where the differences between the normal operating conditions vs. operation under attack are highlighted. We can safely assume that the main goal of this work, i.e., very fast detection of integrity attacks, is achieved, at least to some extent.


