Adaptive Wind Generation Modeling by Fuzzy Clustering of Experimental Data


Department of Engineering, University of Sannio, Piazza Roma 21, 82100 Benevento, Italy
*
Author to whom correspondence should be addressed.
Electronics 2018, 7(4), 47; https://doi.org/10.3390/electronics7040047
Submission received: 12 February 2018
/
Revised: 20 March 2018
/
Accepted: 29 March 2018
/
Published: 31 March 2018
Abstract
:The massive penetration of wind generators in existing electrical grids is causing several critical issues, which are pushing system operators to enhance their operation functions in order to mitigate the effects produced by the intermittent and non-programmable generation profiles. In this context, the integration of wind forecasting and reliability models based on experimental data represents a strategic tool for assessing the impact of generators and grid operation state on the available power profiles. Unfortunately, field data acquired by Supervisory Control and Data Acquisition systems can be characterized by outliers and incoherent data, which need to be properly detected and filtered in order to avoid large modeling errors. To deal with this challenging issue, in this paper a novel methodology fusing Fuzzy clustering techniques, and probabilistic-based anomaly detection algorithms are proposed for wind data filtering and data-driven generator modeling
1. Introduction
Wind energy is recognized as one of the most promising technology for the effective implementation of modern sustainable energy policies. Unfortunately, the massive penetration of wind generators in existing electric grids caused several side-effects, which determines the need for improving the robustness of system control and protection functions, mitigating the impacts of the large uncertainties induced by the intermittent and not-programmable nature of the wind power profiles [1]. To address this issue, the combination of effective wind forecasting tools and reliable generator models, implemented by knowledge discovering from experimental data streaming, represents one of the most promising enabling methodology, especially in assessing the impacts of wind power profiles on power system security and spinning reserve optimization [2,3], and in enhancing asset maintenance [3] and optimal bidding in electrical markets [4,5].
The simplest solution methodology that could be adopted to solve these problems is based on the deployment of average models, which can be identified by curve-fitting of experimental data according to the procedure described in the IEC-61400-12 standard [6]. These first-order models allow the assessment of wind power production as a function of a limited number of observable variables, mainly the wind speed, and are characterized by a low level of accuracy, since they are not able to take into account several important features characterizing the real generator operation. Hence, their application is typically restricted to a limited number of applications, which only require rough wind estimations, such as optimal sizing of wind farms and long-term wind energy assessment analysis [7].
To improve the estimation accuracy, more sophisticated data-driven techniques, including deterministic, parametric, and probabilistic models, could be employed. Deterministic models subdivide the power curve of a wind generator in a proper number of wind speed classes, identifying, for each of them, a regressive model relating the measured power output and the corresponding wind speed. In particular, cubic regressive models parametrized on four wind speed classes, are typically employed for the analysis of large wind generators [8]. Although these modeling approaches allows improving the modeling accuracy, they lack in describing the influence of several variables on the wind power profiles, such as air density and wind direction. These second-order effects can be taken into account by using parametric models, which are aimed at describing the impacts of a finite set of environmental variables on the generated power profiles by means of empirical equations, whose parameters are calibrated on the basis of measured data [9]. Despite this adaptive feature, parametric models are not able to manage the intrinsic uncertainties affecting the measured variables, which can sensibly compromise the model performances, especially in the presence of severe environmental conditions.
To address this issue, probabilistic models, which aim at characterizing the stochastic nature of the measured data, can be adopted [10,11]. These modeling techniques, if integrated with multivariate regression algorithms relating the generated power to the wind turbine parameters [9], could effectively support several important operation functions, such as on-line condition monitoring which allows monitoring the wind generators performances by detecting under-performance or faults [12] and identifying the corresponding driving factors [13].
Anyway, it is worth nothing that the modeling accuracy of data-driven techniques strictly depends by the consistency of the experimental data adopted to tune the models, which are collected by Supervisory Control And Data Acquisition systems, and could be affected by strong uncertainties, especially in harsh environmental condition [7]. These uncertainties could sensibly compromise the model performances by generating incoherent or anomalous data, which mainly derive from sensor faults, measurement errors and electronic noise. In particular, the latter needs dedicates procedures for reducing the transmission error, such as done by authors of [14] where intelligent segmentation techniques for reducing big data and reexamination of transmission protocols have been proposed.
Hence, in these operation scenarios, the probability of acquiring incorrect or anomalous data is notable and the development of advanced tools for removing these data from the ‘valid’ training set is strictly required.
To address this problem, the authors of [15] propose an iterative technique for validity check, data scaling, missing data processing and lag removal steps of experimental wind data, which are then adopted to train an artificial neural network for on-line condition monitoring. Anyway, the application of this deterministic approach has been applied only to specific generator components data, i.e., relating to shaft and bearing, and its effectiveness in filtering other kinds of data, i.e., wind speed and power output, needs to be comprehensively assessed. This issue has been addressed in [16], which proposes a deterministic filter technique for outliers detection in wind speed data, employing the obtained data for designing a wind power forecasting module based on a probabilistic neural network. Similarly, the detection of outliers can be addressed by using the ontology approach for managing information in big data as proposed by [17], where this method allows management of the off shore wind farm data by building a hierarchical classification, from which it is possible to compute several derived quantities in order to make a comparison with the measured outliers by starting from the others available measured data through applying known mathematical relations.
Starting from these results, in [18] an empirical methodology aimed at detecting anomalies in aggregate wind speed data has been proposed. Although this technique allows the detection and classification of local outlier factors, showing interesting results in several case studies [19], its application is typically restricted to wind power forecasting since it does not allow to model the operation states of both the electrical grid (i.e., network congestions) and the wind turbine (i.e., derated/fault), which are required in on-line condition monitoring applications.
In trying to address this issue, the most promising enabling methodologies recently explored in the literature are based on probabilistic-based techniques, which aim at effectively detecting bad-data [20], and data clustering analysis, which allows the exploration of data correlations by defining proper similarity measures [21], confirm the well proved effectiveness of the applications clustering-based in wide and complex systems, such as the smart grids for acting policies of dynamic energy management as well summarized in [22].
Although the application of these methodologies has been tested on several case studies, their large-scale deployment in real operation scenarios is still at its infancy, and more works should be done in order to improve their integration, and extensively validate their performance on real and complex case studies.
This paper intends to fill this gap by proposing a novel processing paradigm based on the integration of bad-data detection techniques and unsupervised clustering analysis for on-line detection of incoherent and anomalous data from a large database of wind data, and identification of a set of multivariate regression models relating the generated power to the measured variables. The main idea is to combine the robustness of adaptive filtering algorithms, which have proved their effectiveness in power system state estimation, with the data classification capability of fuzzy data clustering, which has been extensively applied in the task of solving complex multivariate modeling problems.
Detailed experimental results obtained on a real case study is presented and discussed in order to demonstrate the effectiveness of the proposed technique for on-line wind generators modeling.
2. Proposed Methodology
This paper proposes a processing technique for filtering experimental data by combining bad-data detection techniques with fuzzy cluster analysis, according to the processing architecture schematically depicted in Figure 1.
By analyzing this figure it is worth nothing that the first module aims at identifying the set of data that are coherent with the properties of the rated power curve, described by the matrix , with dimensions , where I is the number of recorded measurements. Then, a polynomial regressive model is identified by fitting the rated wind generator data. This benchmark model is formalized in Equation (1), where , , are the cut-in, rated and cut-off speeds, respectively
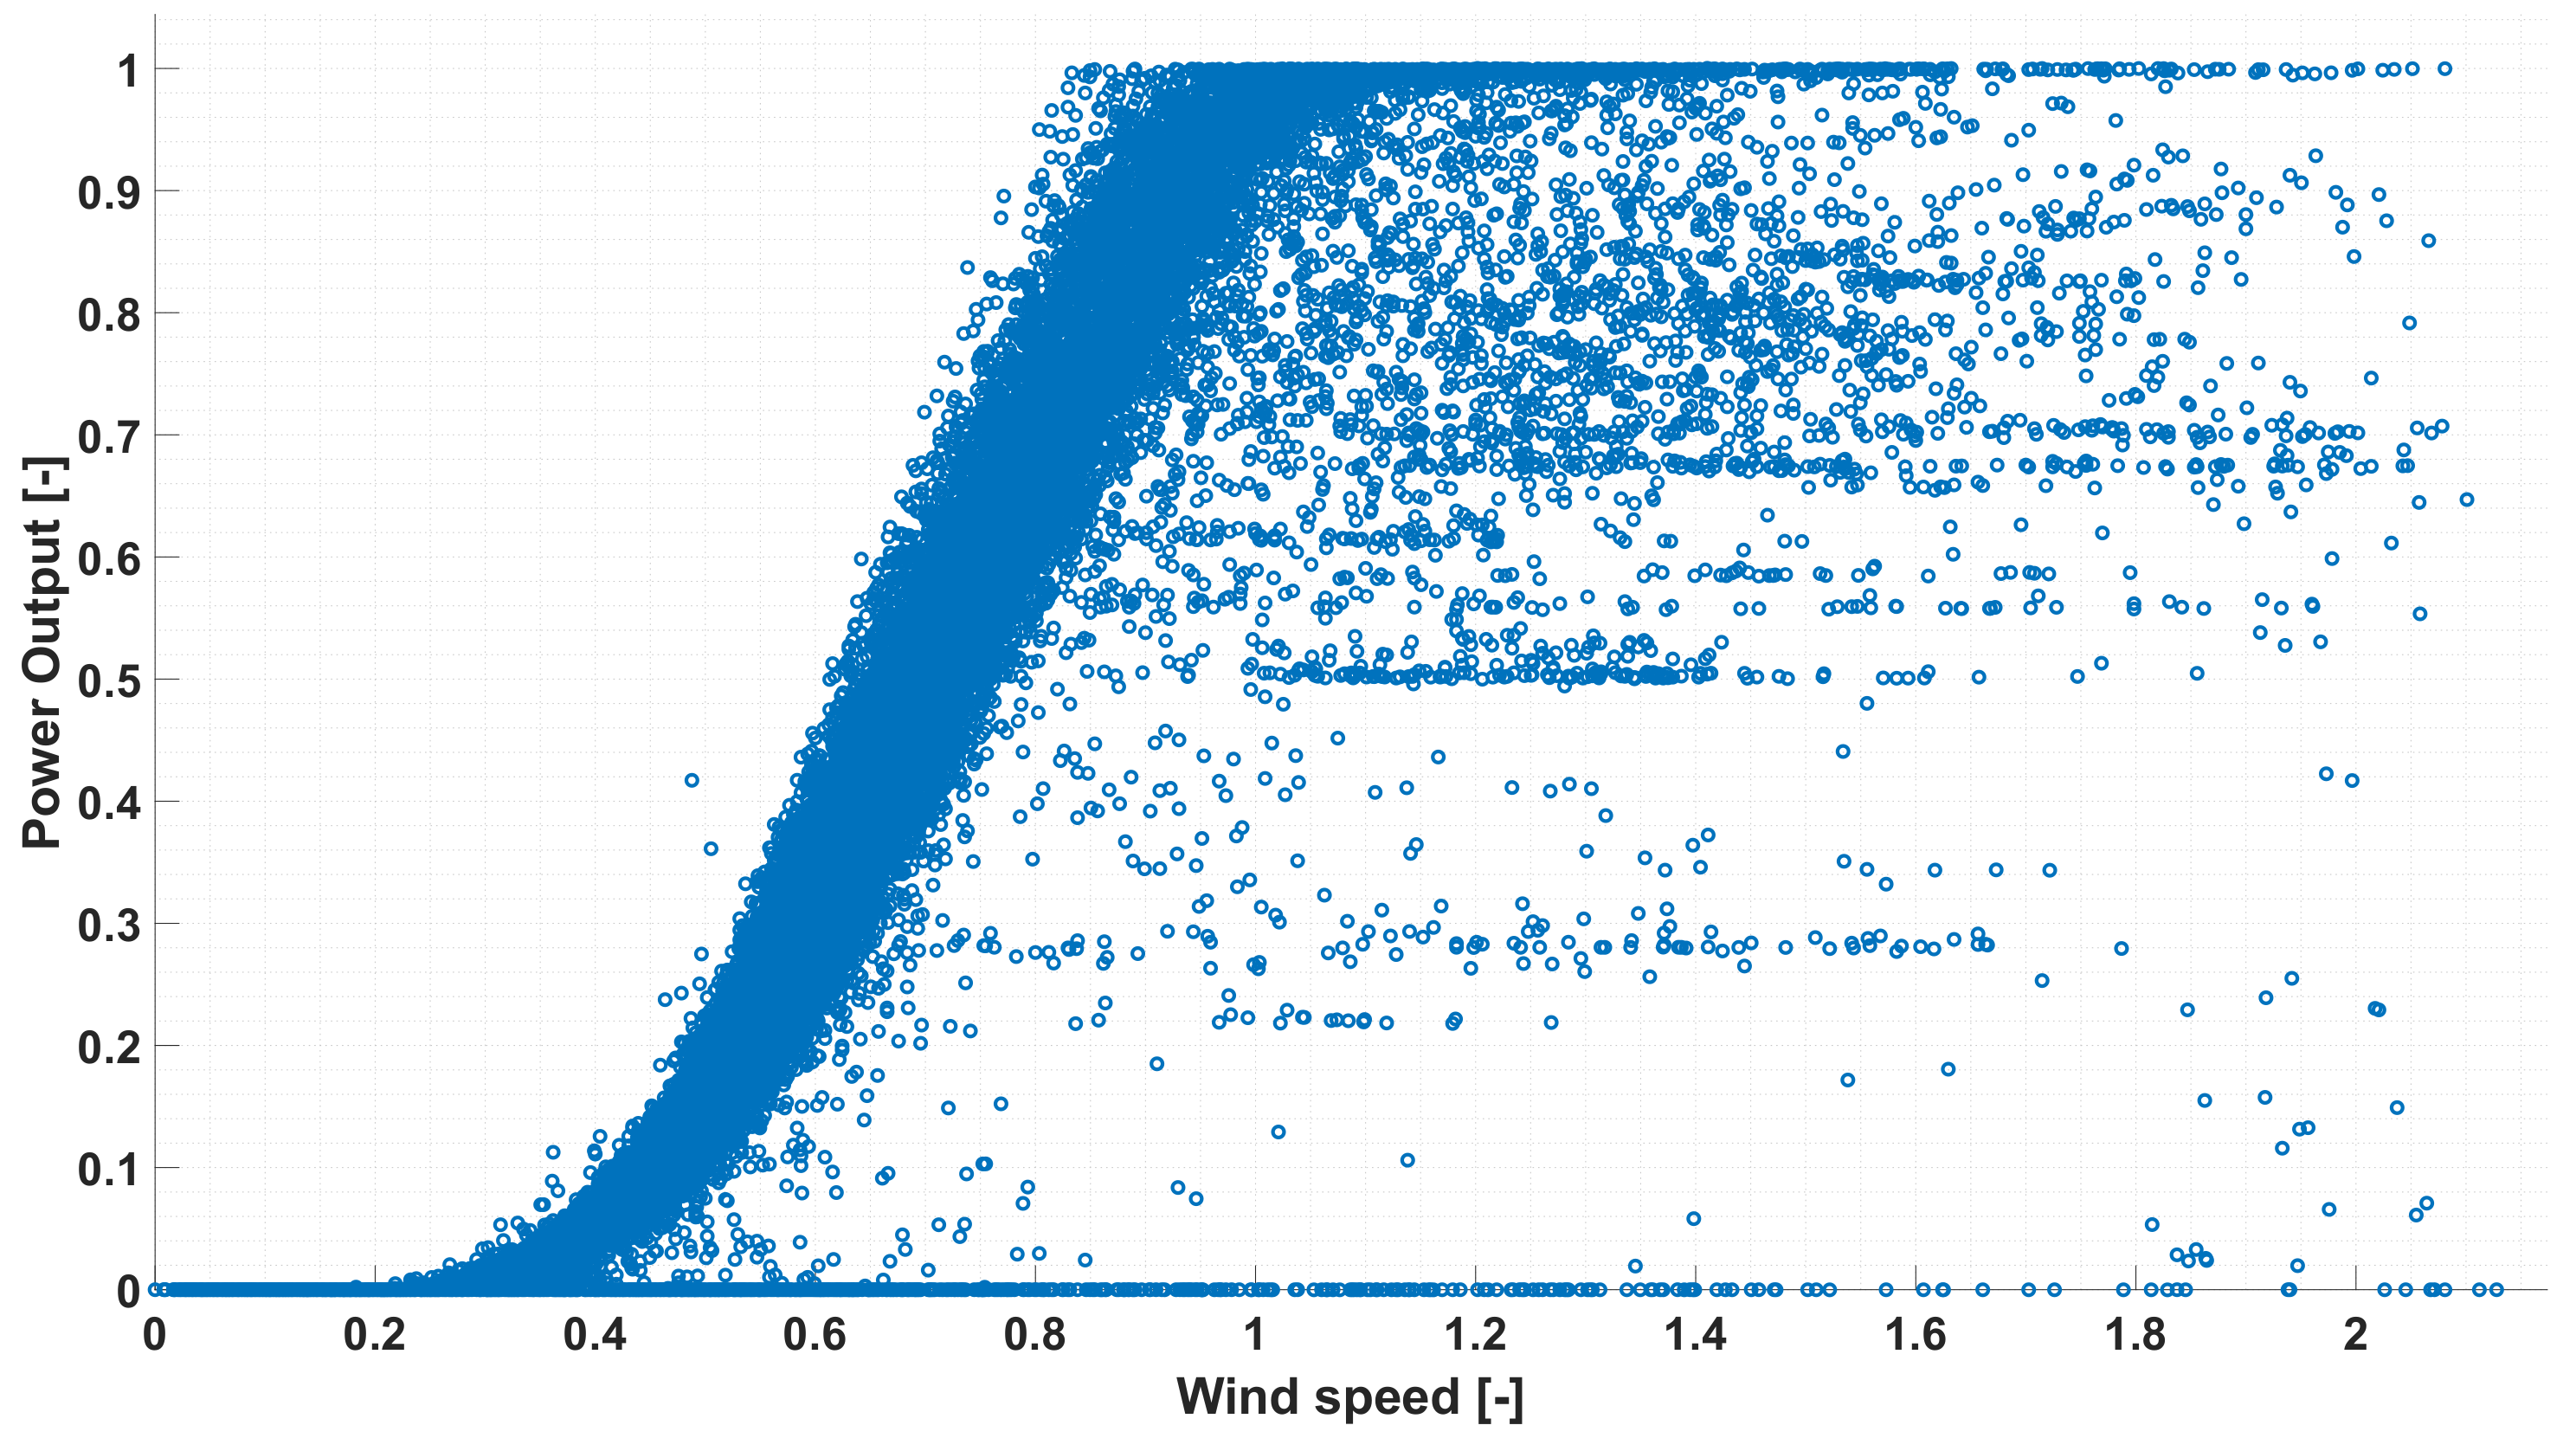
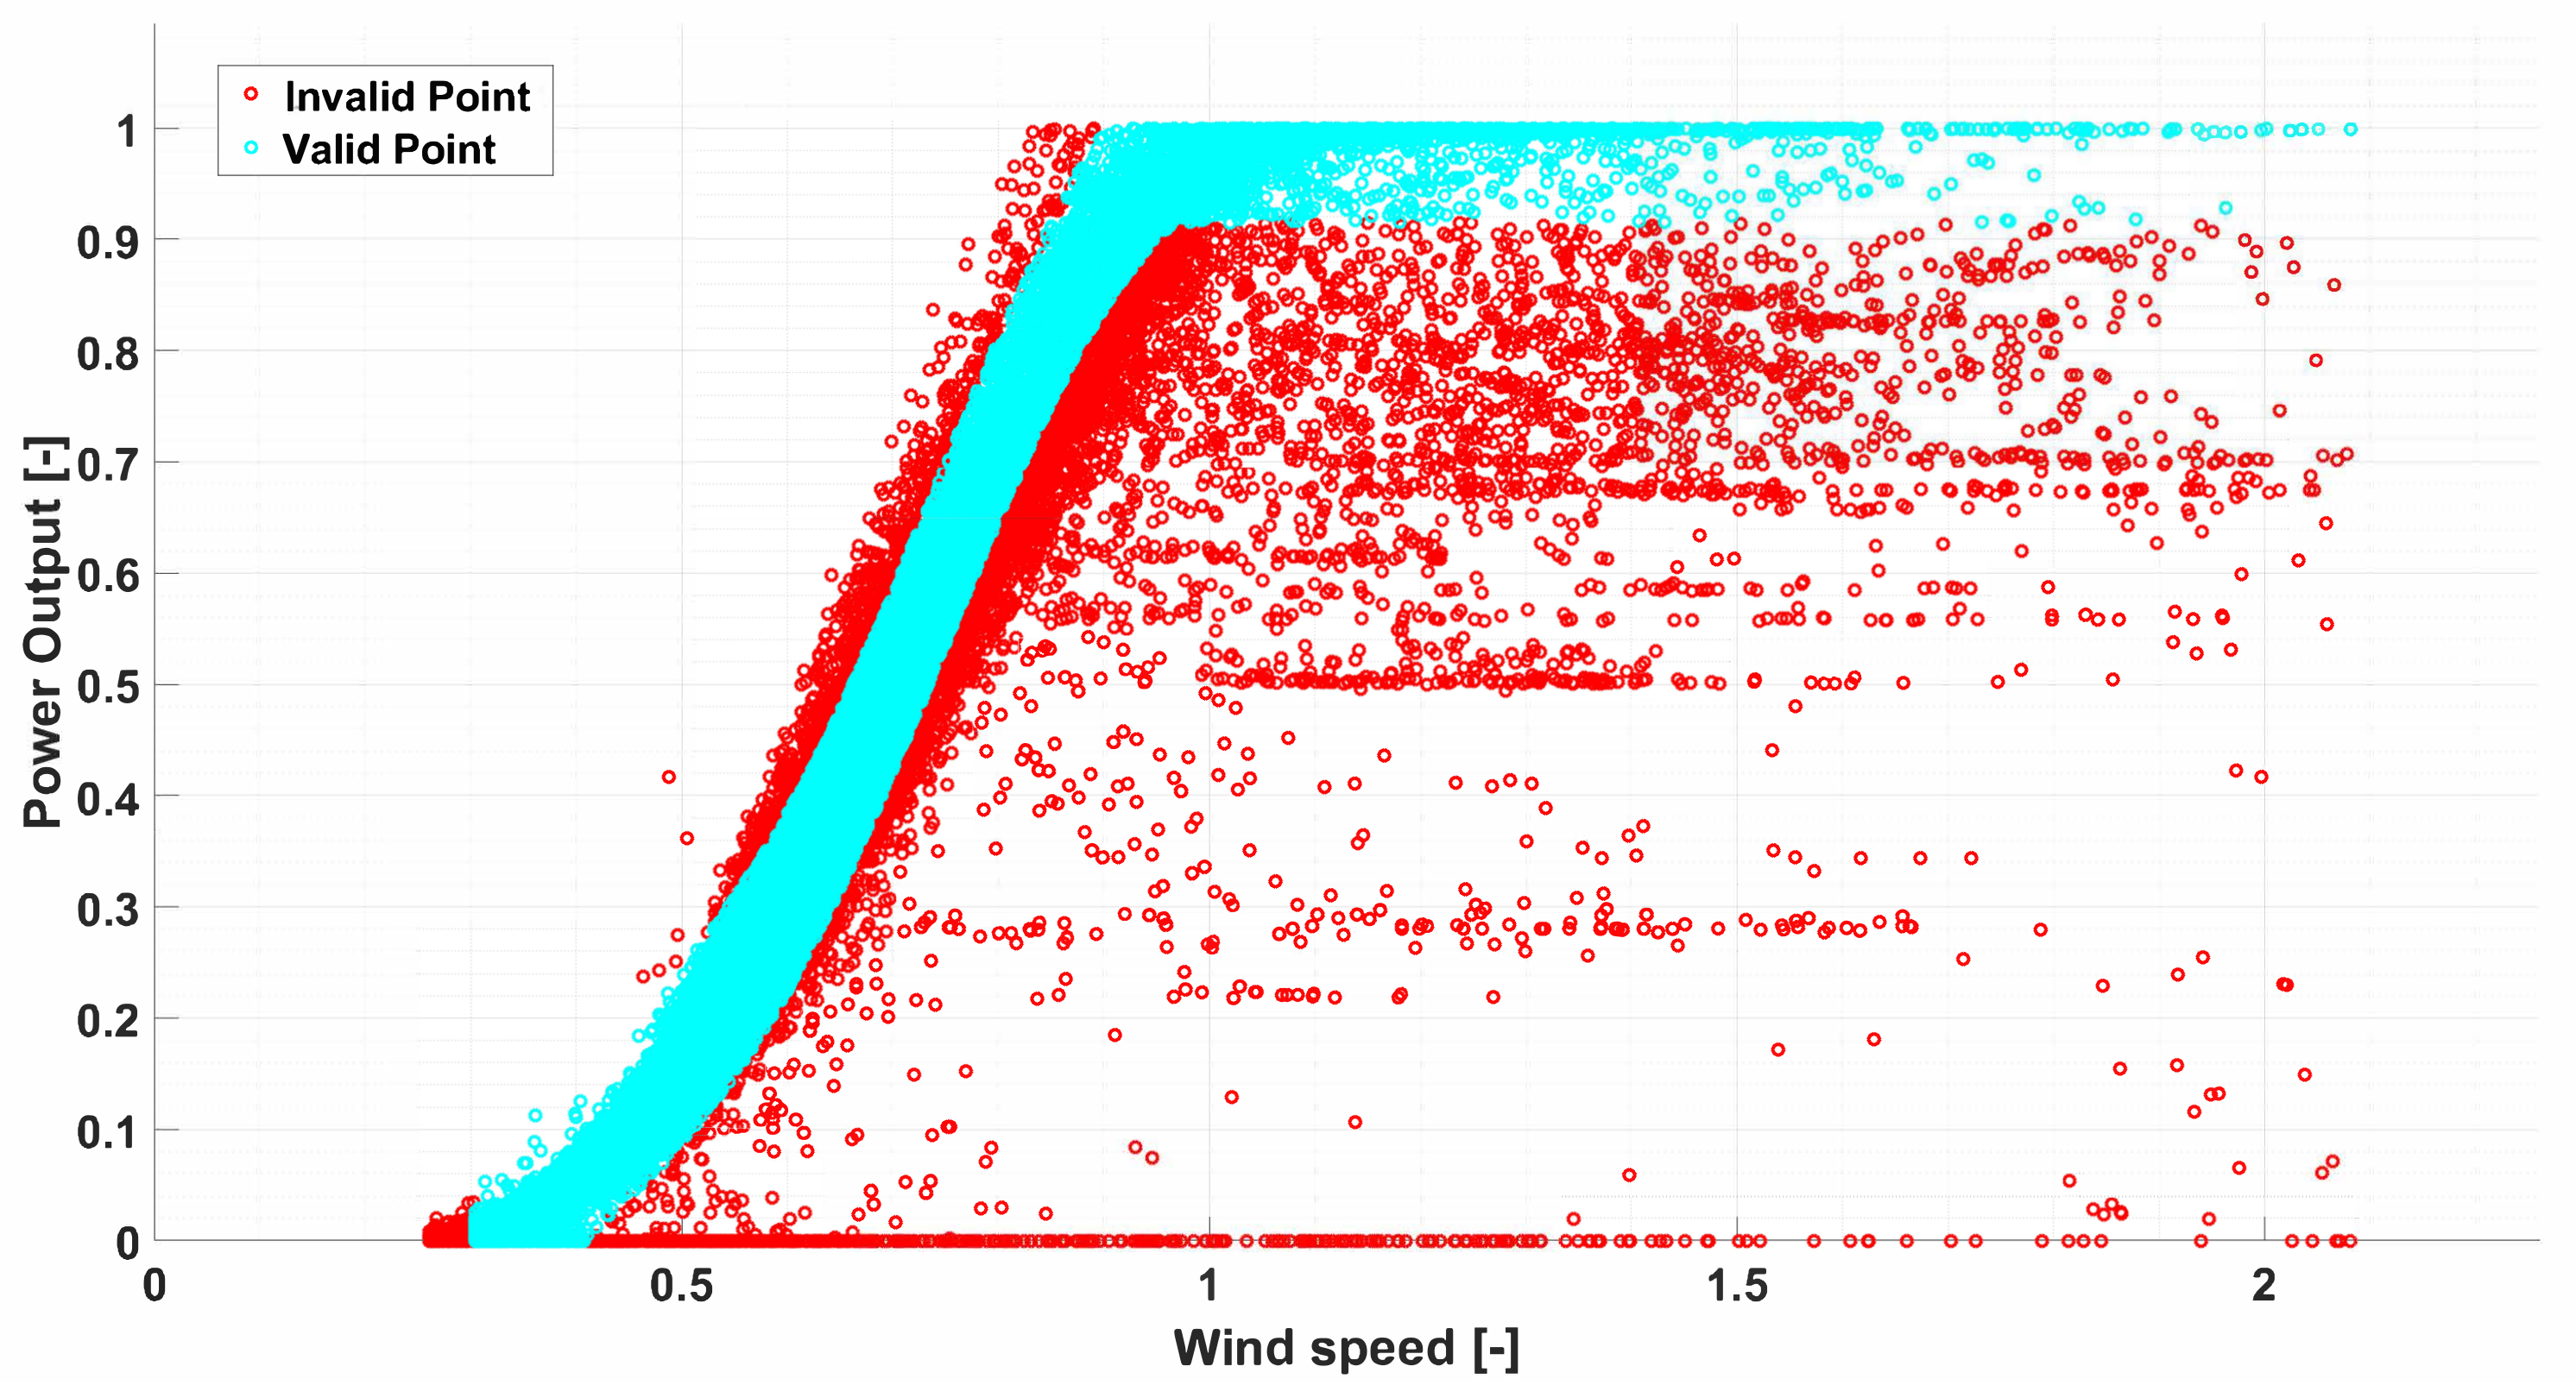
This regressive model allows filtering the elements of the matrix , which are shown in Figure 2, by detecting the measured data exceeding a fixed confidence interval. This interval has been identified by estimating, for each wind speed value included in the matrix, the power computed by the model 1, considering the corresponding ratio between the rated and the estimated power, as shown in Equation (2), where is a heuristic coefficient identified by sensitivity analysis. After this process, the matrix can be filtered as shown in Algorithm 1, hence obtaining the matrices , whose dimensions are with , and , whose dimensions are with , which represent the matrices of the valid and invalid data, respectively, as shown in Figure 3.
| Algorithm 1 Adding valid objects to | ||
| 1: | for , R do | |
| 2: | if then | |
| 3: | ▹ is joined to | |
| 4: | else | |
| 5: | ▹ is joined to | |
After this filtering process, the invalid data set is analyzed in order to detect operation data potentially referring to power derating states. This is obtained by deploying a fuzzy clustering technique [23], which aims at classifying the data on the basis of their level of similarity.
More specifically, in order to identify the operation points corresponding to partial load operation, a Fuzzy C-Means (FCM) method-based has been employed to classify the matrix , with dimensions and a function of the measured wind speed and generated power. The main feature of FCM, which is particularly useful in solving this problem, is that it does not uniquely assign a member to a group, but a membership degree to each member for every groups between 0 and 1, which represents the corresponding probability to belong to each cluster.
Unfortunately, the technique does not compute the number of clusters, but this has been fixed by the Analyst. In this study the optimal number of partitions, whom number will be defined as , has been calculated by applying the Calinski-Harabasz Criterion [24] to the matrix. According to this method, the optimal cluster numbers is identified by iteratively partitioning the elements of minimizing the following objective function:
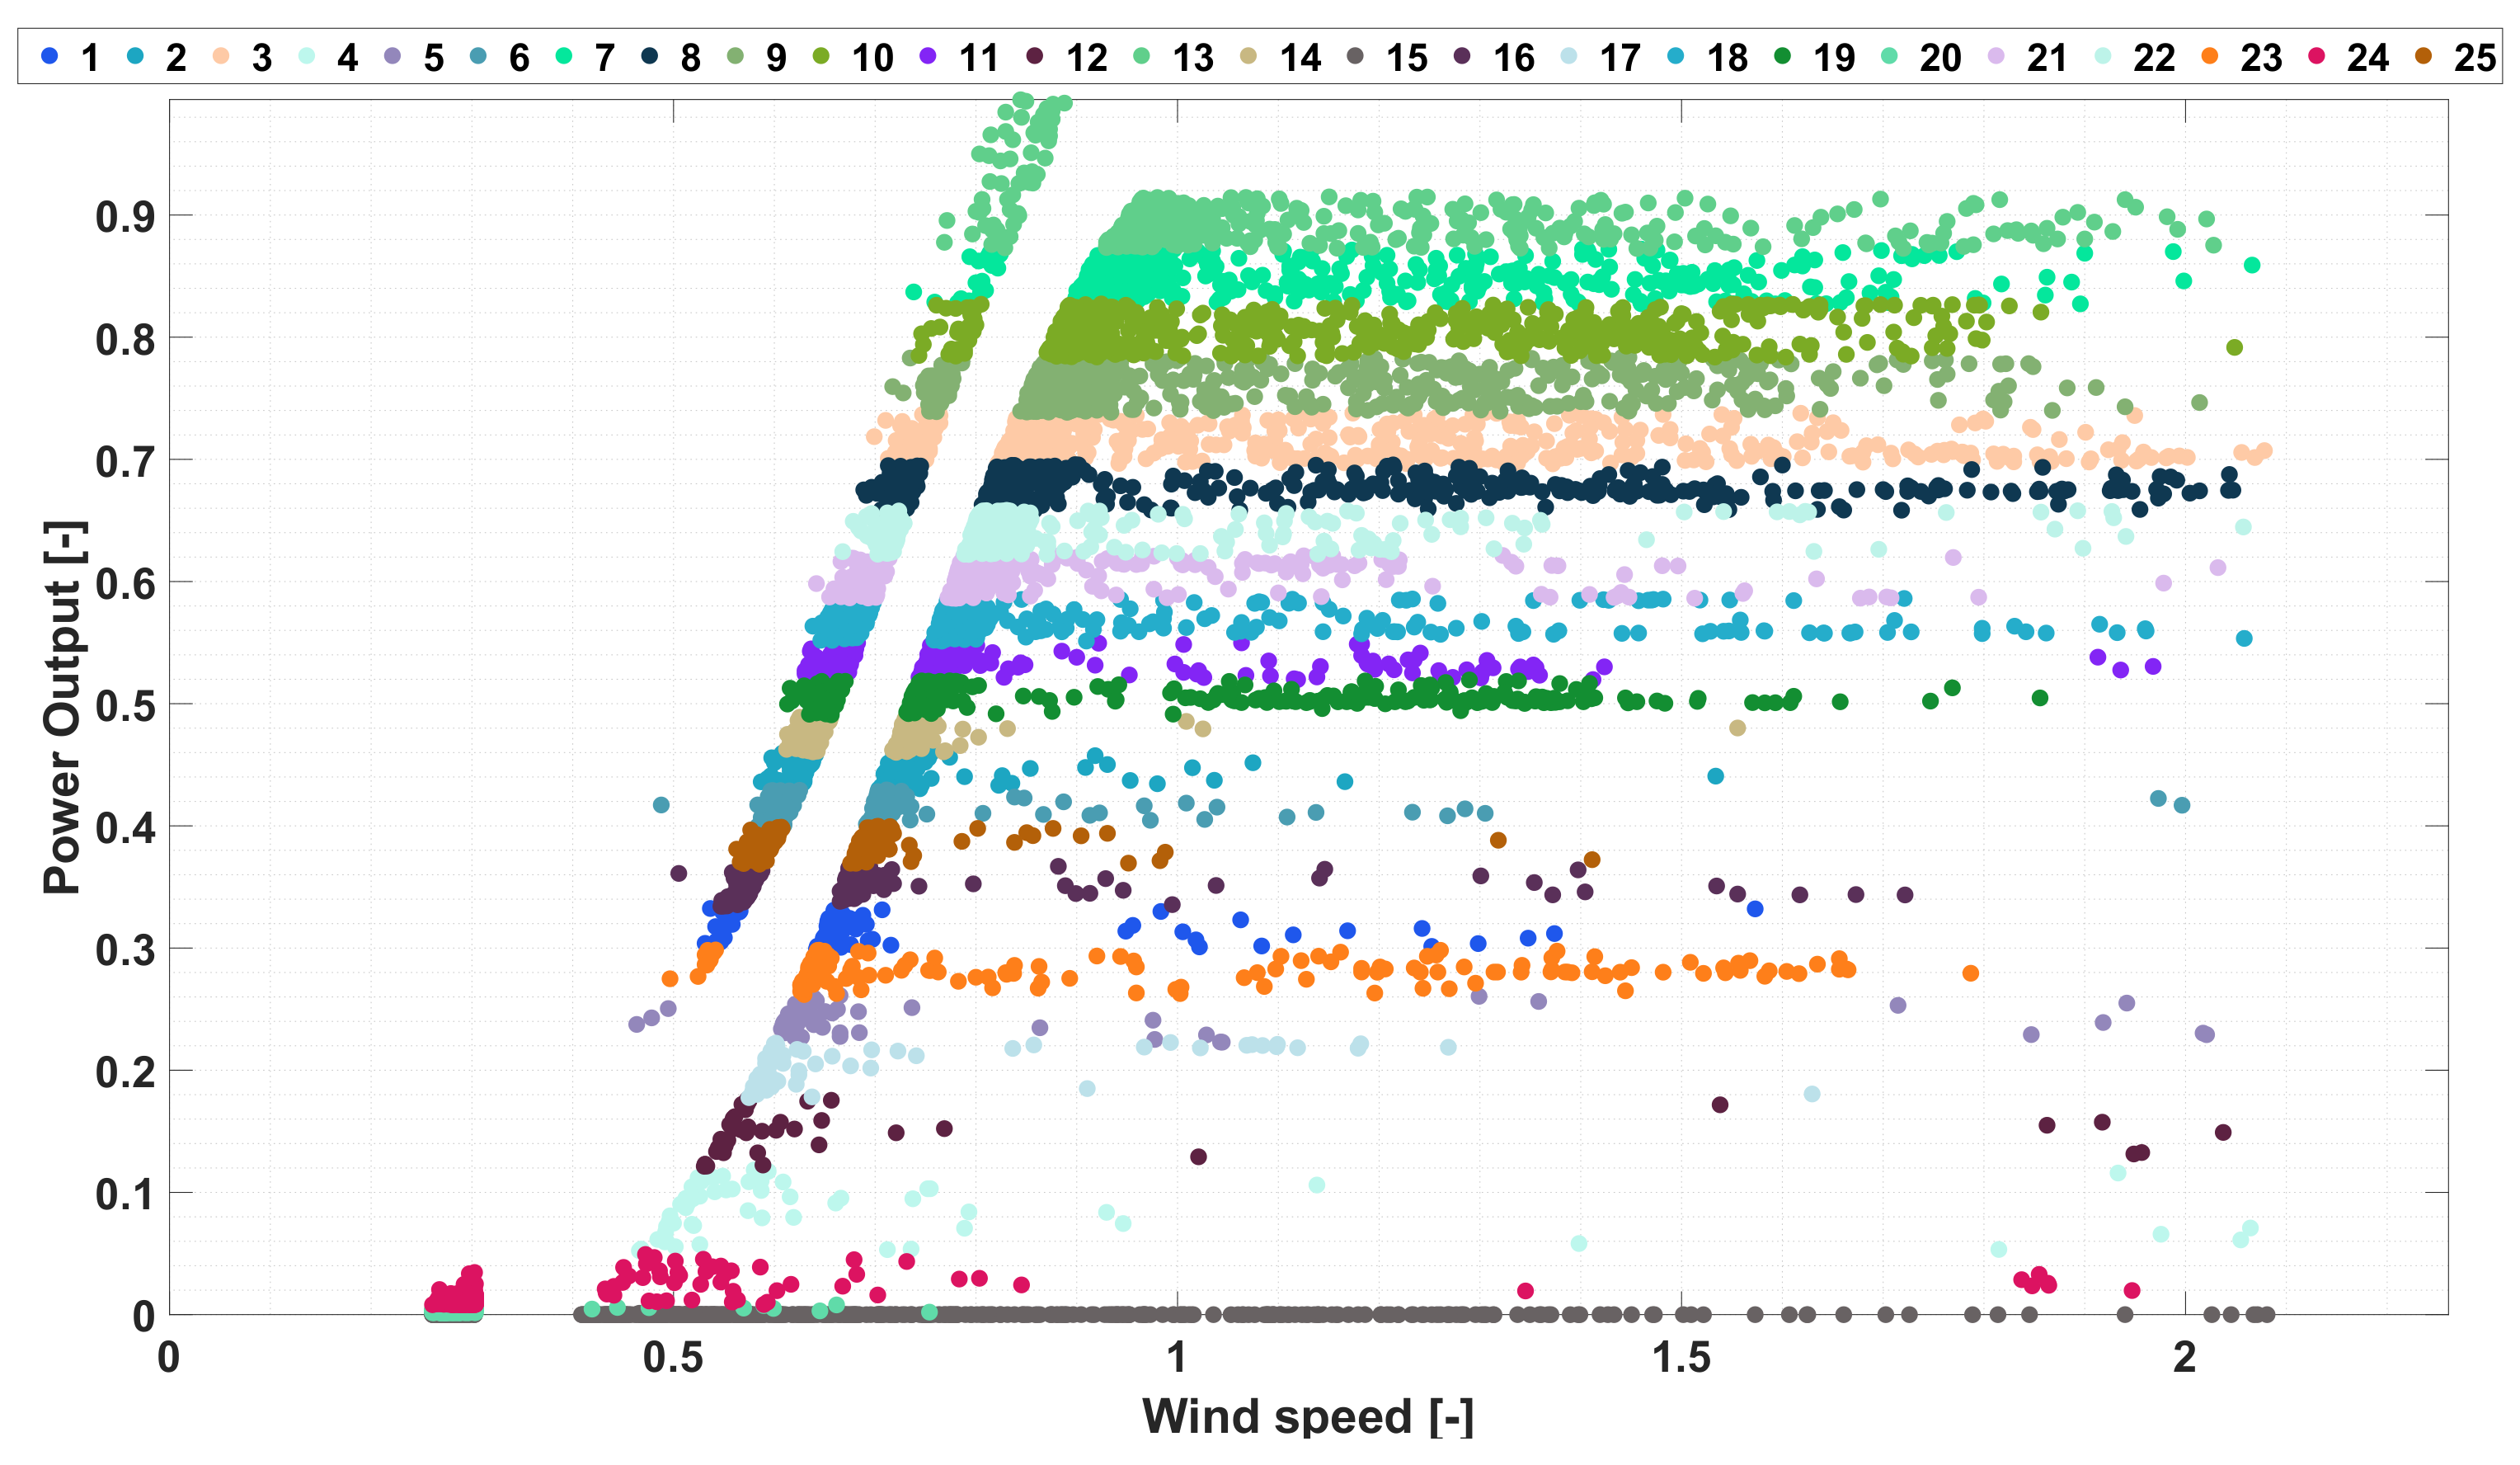
where is the sum of squared error, and are the membership and cluster centers matrices, respectively, and is the norm between the point , which has components and the center of sth cluster and is the generic element of matrix . Hence, the results of the application of the Fuzzy C-means method are the matrices , where s is the a sth cluster of the assigned as shown in Figure 4 .
By observing the partitioning of the matrix , and the distribution of the clustered points, several hidden properties can be identified as shown in Figure 4, where an ensemble of a non-negligible number of points characterized by constant power output is observable in several regions of the identified classes. It is clear that these points can be classified as working points in derating operation conditions, which occur when the power output of the wind turbine is deliberately reduced by the system operator. Hence, to automatically detect these points an adaptive statistical algorithm has been designed. This algorithm allows the update of the set of the valid point , and to identify a family of regressive models describing the generator power curve for different derating levels.
To address this issue, the first step is to identify, for each cluster, the set of operation points that are characterized by a constant power at different wind speed. This can be done by employing the following iteratuve algorithm:
where is the power limit for the sth cluster represented by the matrix , whose dimensions depend on the number of elements of which have been added to each cluster. The obtained represents the limit of the derated power curve, and it allows to find the maximum power value at a certain derating level. This value can be used to select the elements of the valid data matrix to adopt in identifying the corresponding regressive model, as described in Algorithm 2.
| Algorithm 2 | ||
| 1: | for , do | |
| 2: | for , k do | |
| 3: | if then | |
| 4: | ▹ , is joined to matrix. | |
| 5: | ||
In this algorithm the element of , whose power output is lower than , are added to sth cluster. Then, for each cluster, a derated power curve is identified by applying a 3th order least square regression method, as shown in Figure 7, where is the lowest wind speed value for each sth cluster, corresponding to the value.
Finally, after identifying the power curves for each derating condition, proper acceptability bounds have been computed, and the elements of the matrix have been processed in order to verify if they are coherent with these bounds, according to Algorithm 3. During this process not all derating power curves have been considered, but only those corresponding to statistically relevant sets, according to the number of elements of each s-th cluster included in before and after the algorithm application. The overall process is described in the following:
| Algorithm 3 Adding valid objects to | |
| 1: | for , do |
| 2: | if then |
| 3: | for , do |
| 4: | if then |
| 5: | ↦ |
| 6: | |
Hence, the elements of that respect these conditions are added to , adjourning the matrix , where is the object of and is:
and where , , are coefficients that have been determined on the base of sensitive analysis, and contains the number of elements for each cluster that has been obtained by the application of Fuzzy C-Means technique.
In particular, the optimal values of , and have been here identified in order to improve the expected classification accuracy of the proposed model. This is a complex issue, which is still an open problem in applying data clustering techniques because, if the filtering level is too high, a lack of information could be obtained, while, with lower filtering, the filtered data will contain too much invalid data, canceling out the effects of the proposed filtering data method. Then, the chosen of extreme parameters can in both cases reduce the accuracy of the developed model, causing the need to find the optimal compromise between these extreme cases.
3. Case Study
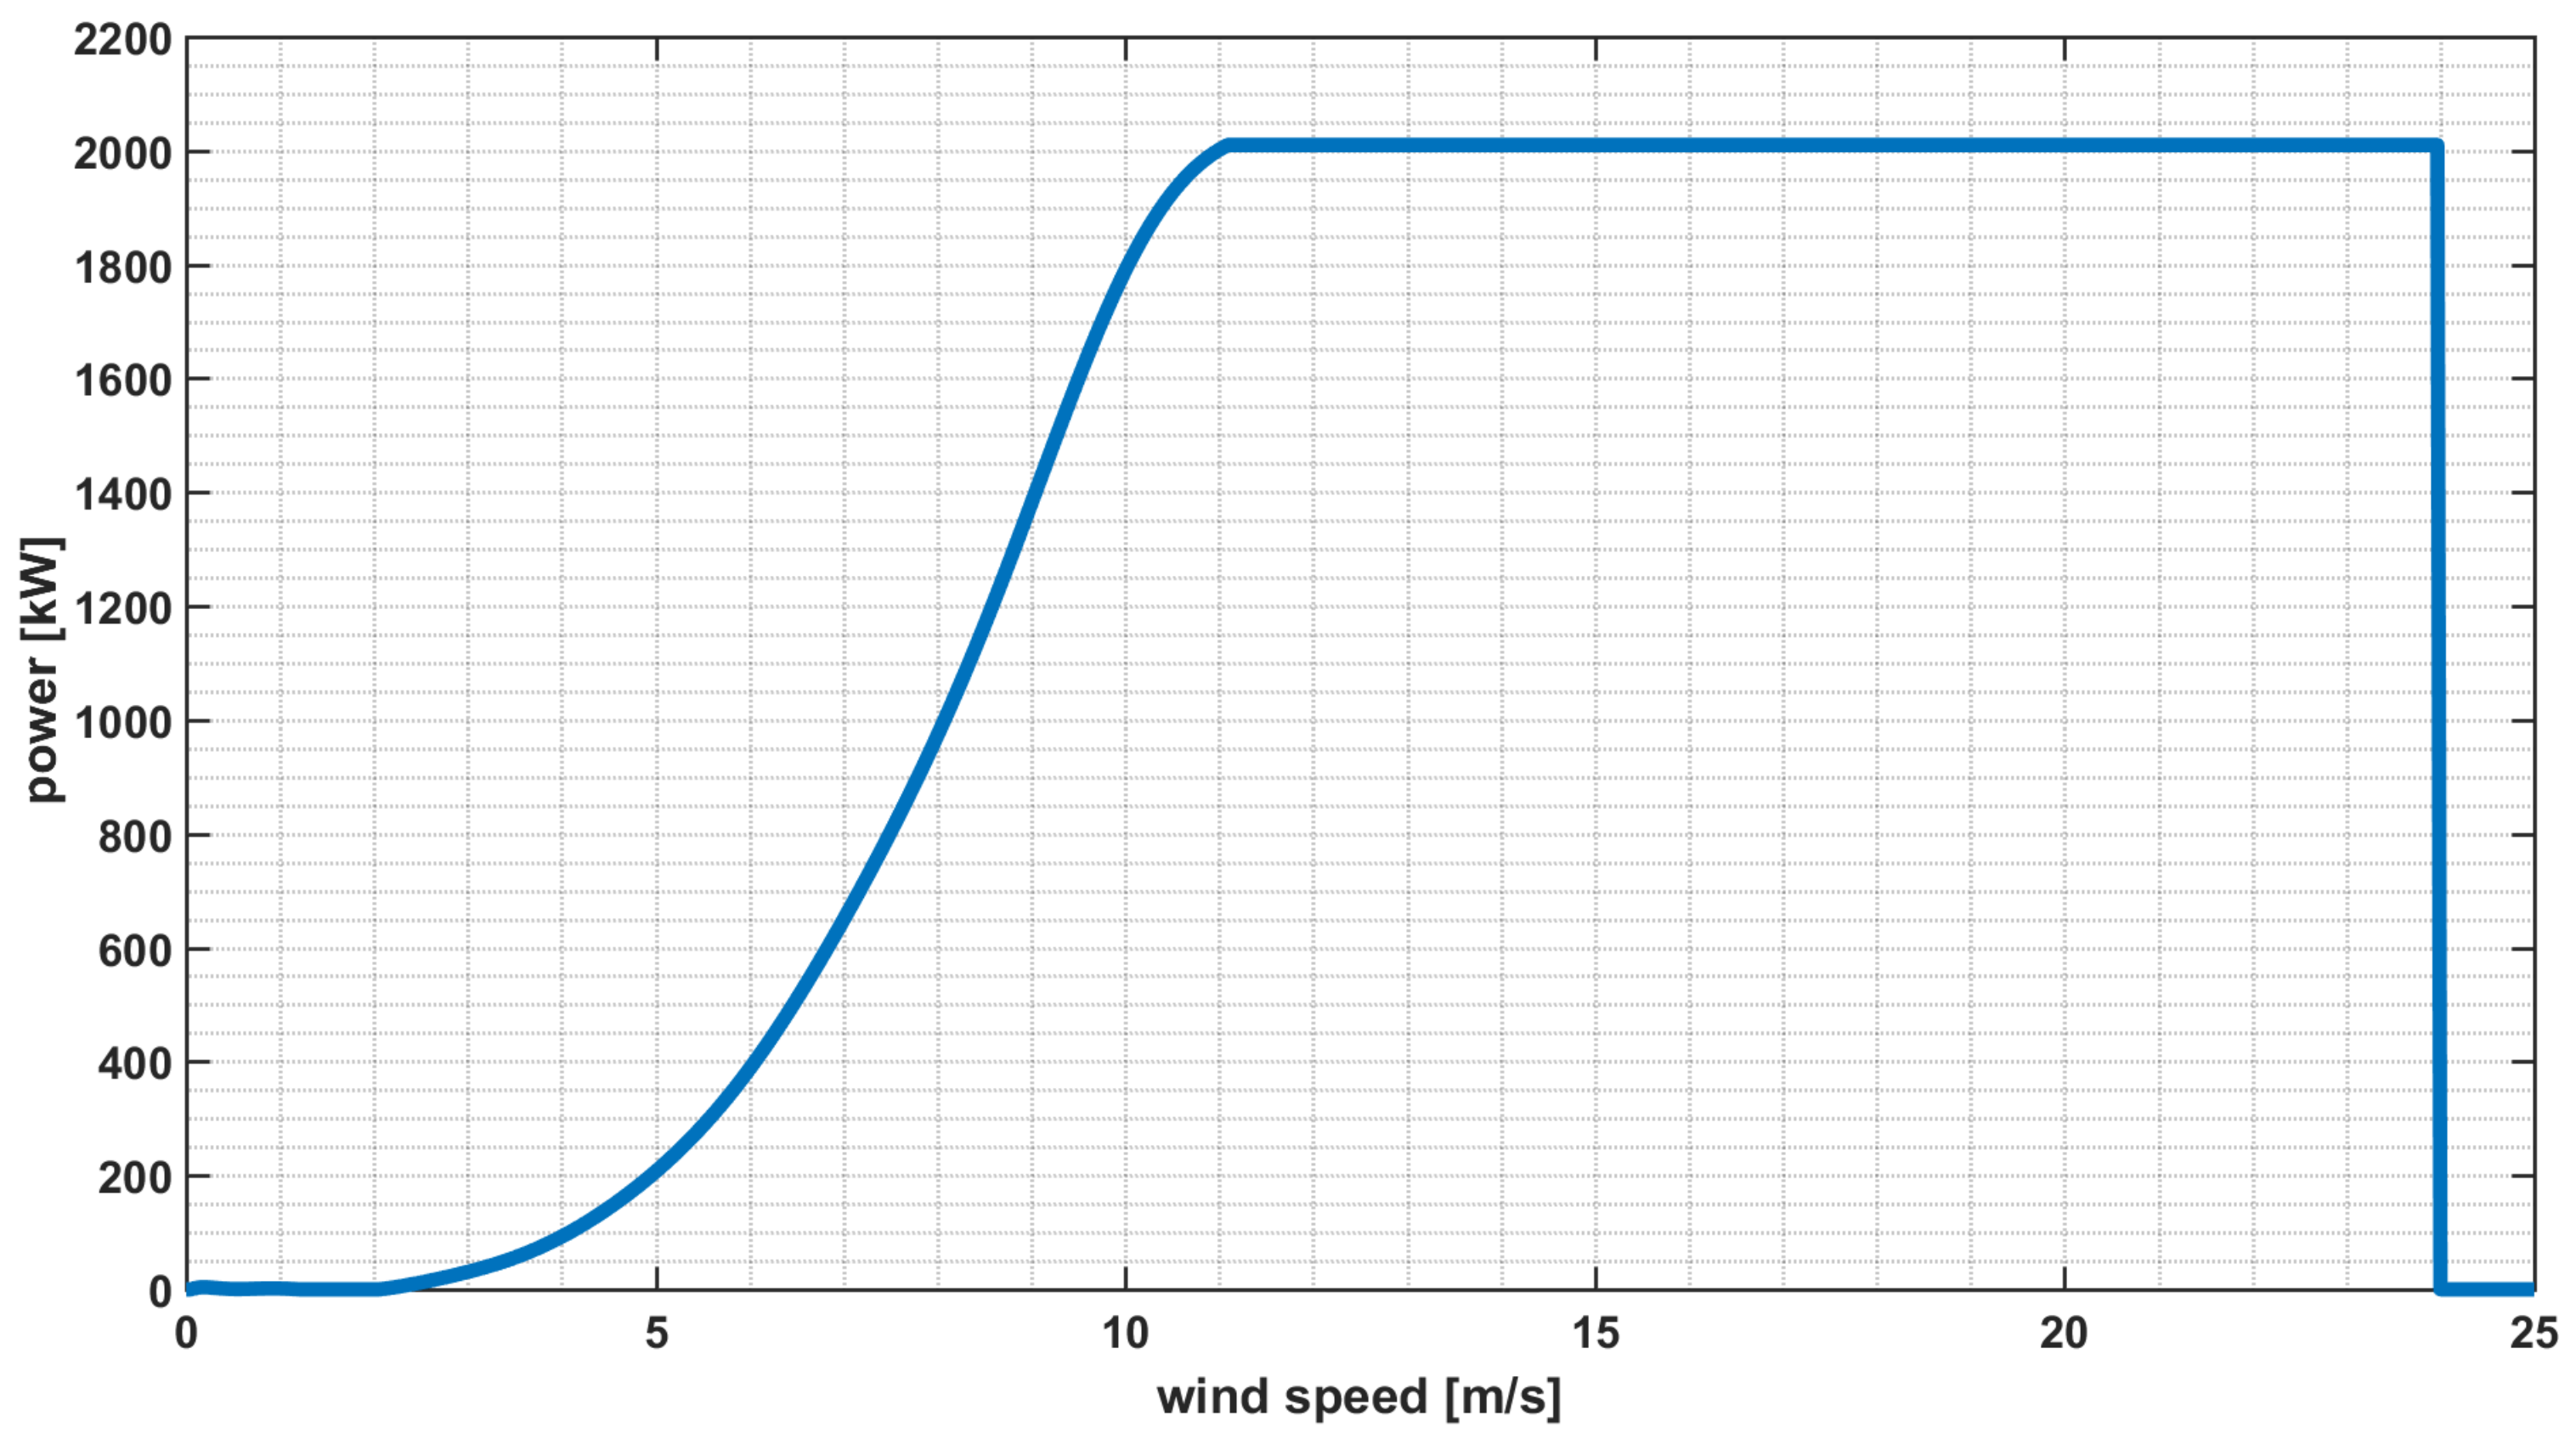
The described methodology has been applied to a real case study, which is based on a 38 MVA Wind Farm, composed by 19 generators characterized by the features shown in Table 1 and in Figure 5, where the corresponding power curve is reported. This wind farm is located in the South of Italy in an area characterized by a high penetration of wind generators, which is frequently congested in the transmission network. Consequently, the transmission system operator frequently imposes wind power curtailments, which result in derating power conditions for the analyzed generators.
The real data adopted in the experiments have been acquired from the SCADA system; they covered a time period of two years, include the wind speed, power output and pitch angle averaged on 10 min.
The input data are organized in the matrix , which has dimensions , where the first value is the number of measurements of wind speed and corresponding power output available, see Figure 2. Assigning at the values shown in Table 2, the has been partitioned in two matrices and by employing the Algorithm 1. The obtained matrices, which are depicted in Figure 3, have dimensions of and , respectively.
After this preliminary phase, has been processed by the Fuzzy C-means method, obtaining the results shown in Figure 4, where the optimal number of partitions has been calculated using the Calinski-Harabasz criteria.
Hence, the effected consideration are obviously mathematically defined as follows by using Algorithm 2, which is able to catch the constant part of the derated power curves also without a so evident shape of as shown in Figure 6.
As it is shown in this figure, the application of CFM allows to define several groups of points, which are characterized by a horizontal stripe shape, where for the most part of the defined clusters the constant part of the derating power curves has been very clear highlighted, in particular for clusters 23, 18, 7, 8, 21, 10 and 20.
It is important remarking how the selection of the optimal number of clusters is a critical issue in applying data clustering techniques. In this study, FCM is applied in the task of subdividing the invalid data in many groups, triggering the identification procedure of the derating working points. Hence, the number of clusters is expected to influence the number of derating curves, requiring the adoption of a suitable tool for optimal selecting the class number. Moreover, other than searching the optimal number of clusters, there is the need of highlighting the desired features of data classified.
To address this complex issue, in this paper, after a comparative analysis of the most used solution techniques, the Calinsky-Harabasz criterion has been adopted. The application of this technique allows definition of groups of points characterized by a large span of wind speed while the corresponding power span is lower, hence obtaining a dense and well separated group, which are the best conditions for applying this method.
Furthermore, by considering the iterative nature of how this kind of criteria works, the Calinsky-Harabasz criterion allows the fast supply of the score, which is supplied for each trial in the searching of optimal number of clusters. Despite these benefits, a rigorous method for solving this problem is still an open problem, which needs more research efforts.
The obtained data classification is the prerequisite to detect the elements in that correspond to derating operation points of the wind generators. To this aim, the clustering method first classifies the points of in power bands, then a subgroup of points characterized by constant power value for different wind speeds is identified for the defined clusters. This class of points represents the constant part of the derated power curves, where the corresponding values has been calculated using Equation (6). Hence, by processing these data by the Algorithm 2, it is possible to obtain the derated power curves in Figure 7, which have been employed to filter the points of according to the procedure 3.
Hence, by observing this figure, the generated number of derated power curves is lower than the total number of defined clusters—this is caused by how the Algorithm 2 works. Indeed, the latter considers both the weight of each cluster population compared with the total number of points by statistical way and the percentage level of derated power to the rated one as filtering procedure.
In particular, assuming the values reported in Table 2 for the coefficients , and , the fitted curves shown in Figure 6 have been obtained. In this figure, the elements of the matrix classified as ’valid’ are represented by black dots. The described filtering algorithms rule their distribution as well shown, indeed the great part is distributed on the power curve at rate power, where points with too a large power deflection have been removed both for over and underestimation. In addition, the points that have been considered as derated power working points are distributed around the derated power curves, which have been used for filtering them. Furthermore, the proposed method allows the complete removal of the outliers that are characterized by too large uncorrelation between wind speed and the corresponding measured power value, such as in the bound included between x axis and power curve 19 and at the right of the straight line that is parallel to y axis passing for the cut-in speed value.
The valid data sets obtained have been adopted to identify a family of regressive models relating the wind speed, power output and the pitch angle for each derating condition. This is obtained by identifying the parameters of the following bi-variate polynomial function:
where w is the wind speed, and is the pitch angle.
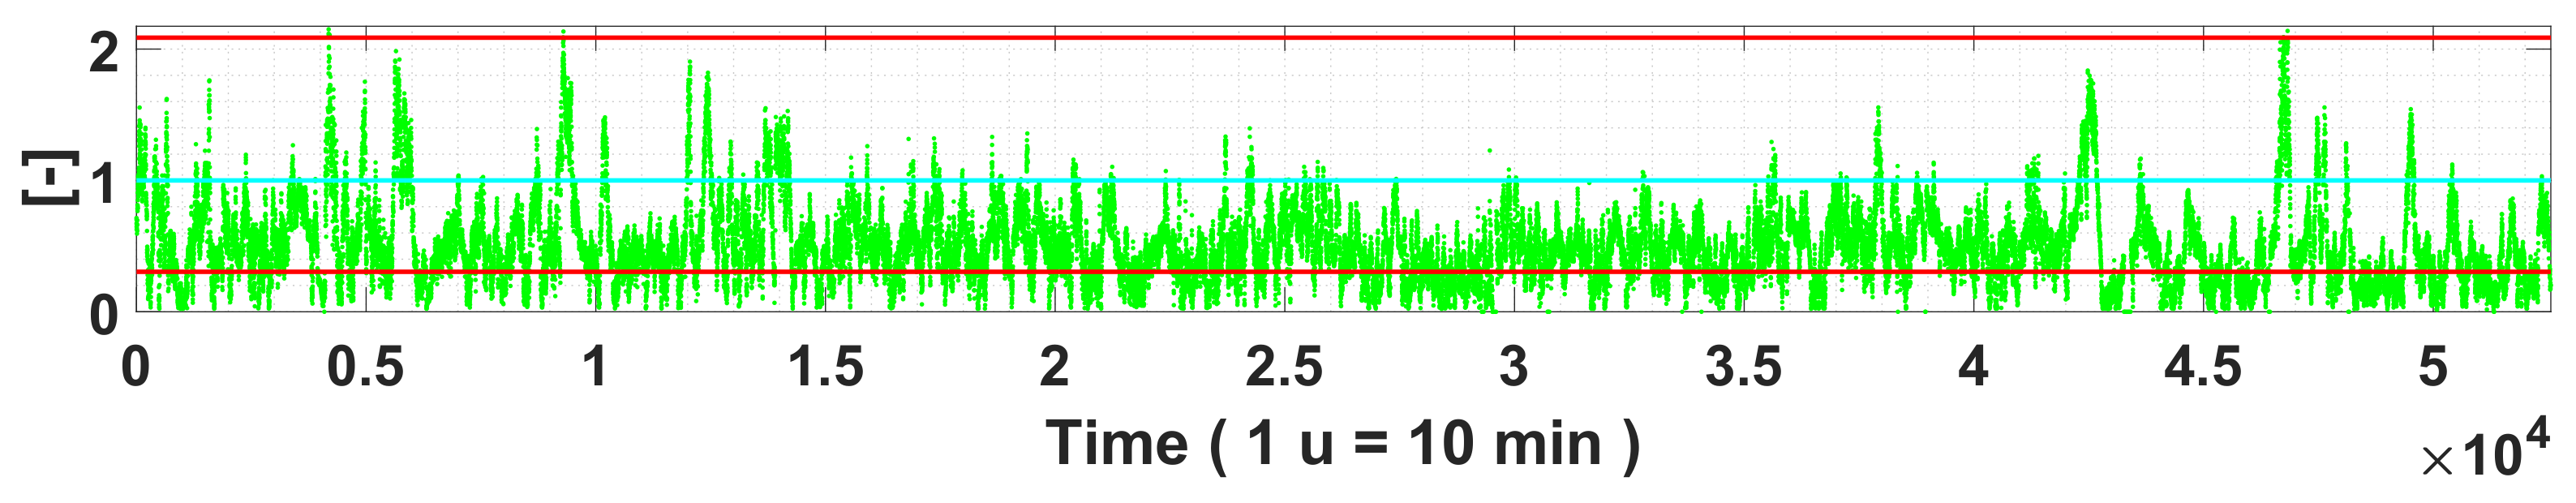
In order to rigorously validate the accuracy of the obtained regressive models, the results obtained by applying different modeling techniques, including those based on the manufacturer data and those identified by applying local outliers factors, have been compared. The performances of the analyzed models have been evaluated over a one-year time horizon, which is characterized by the wind profile shown in Figure 7.
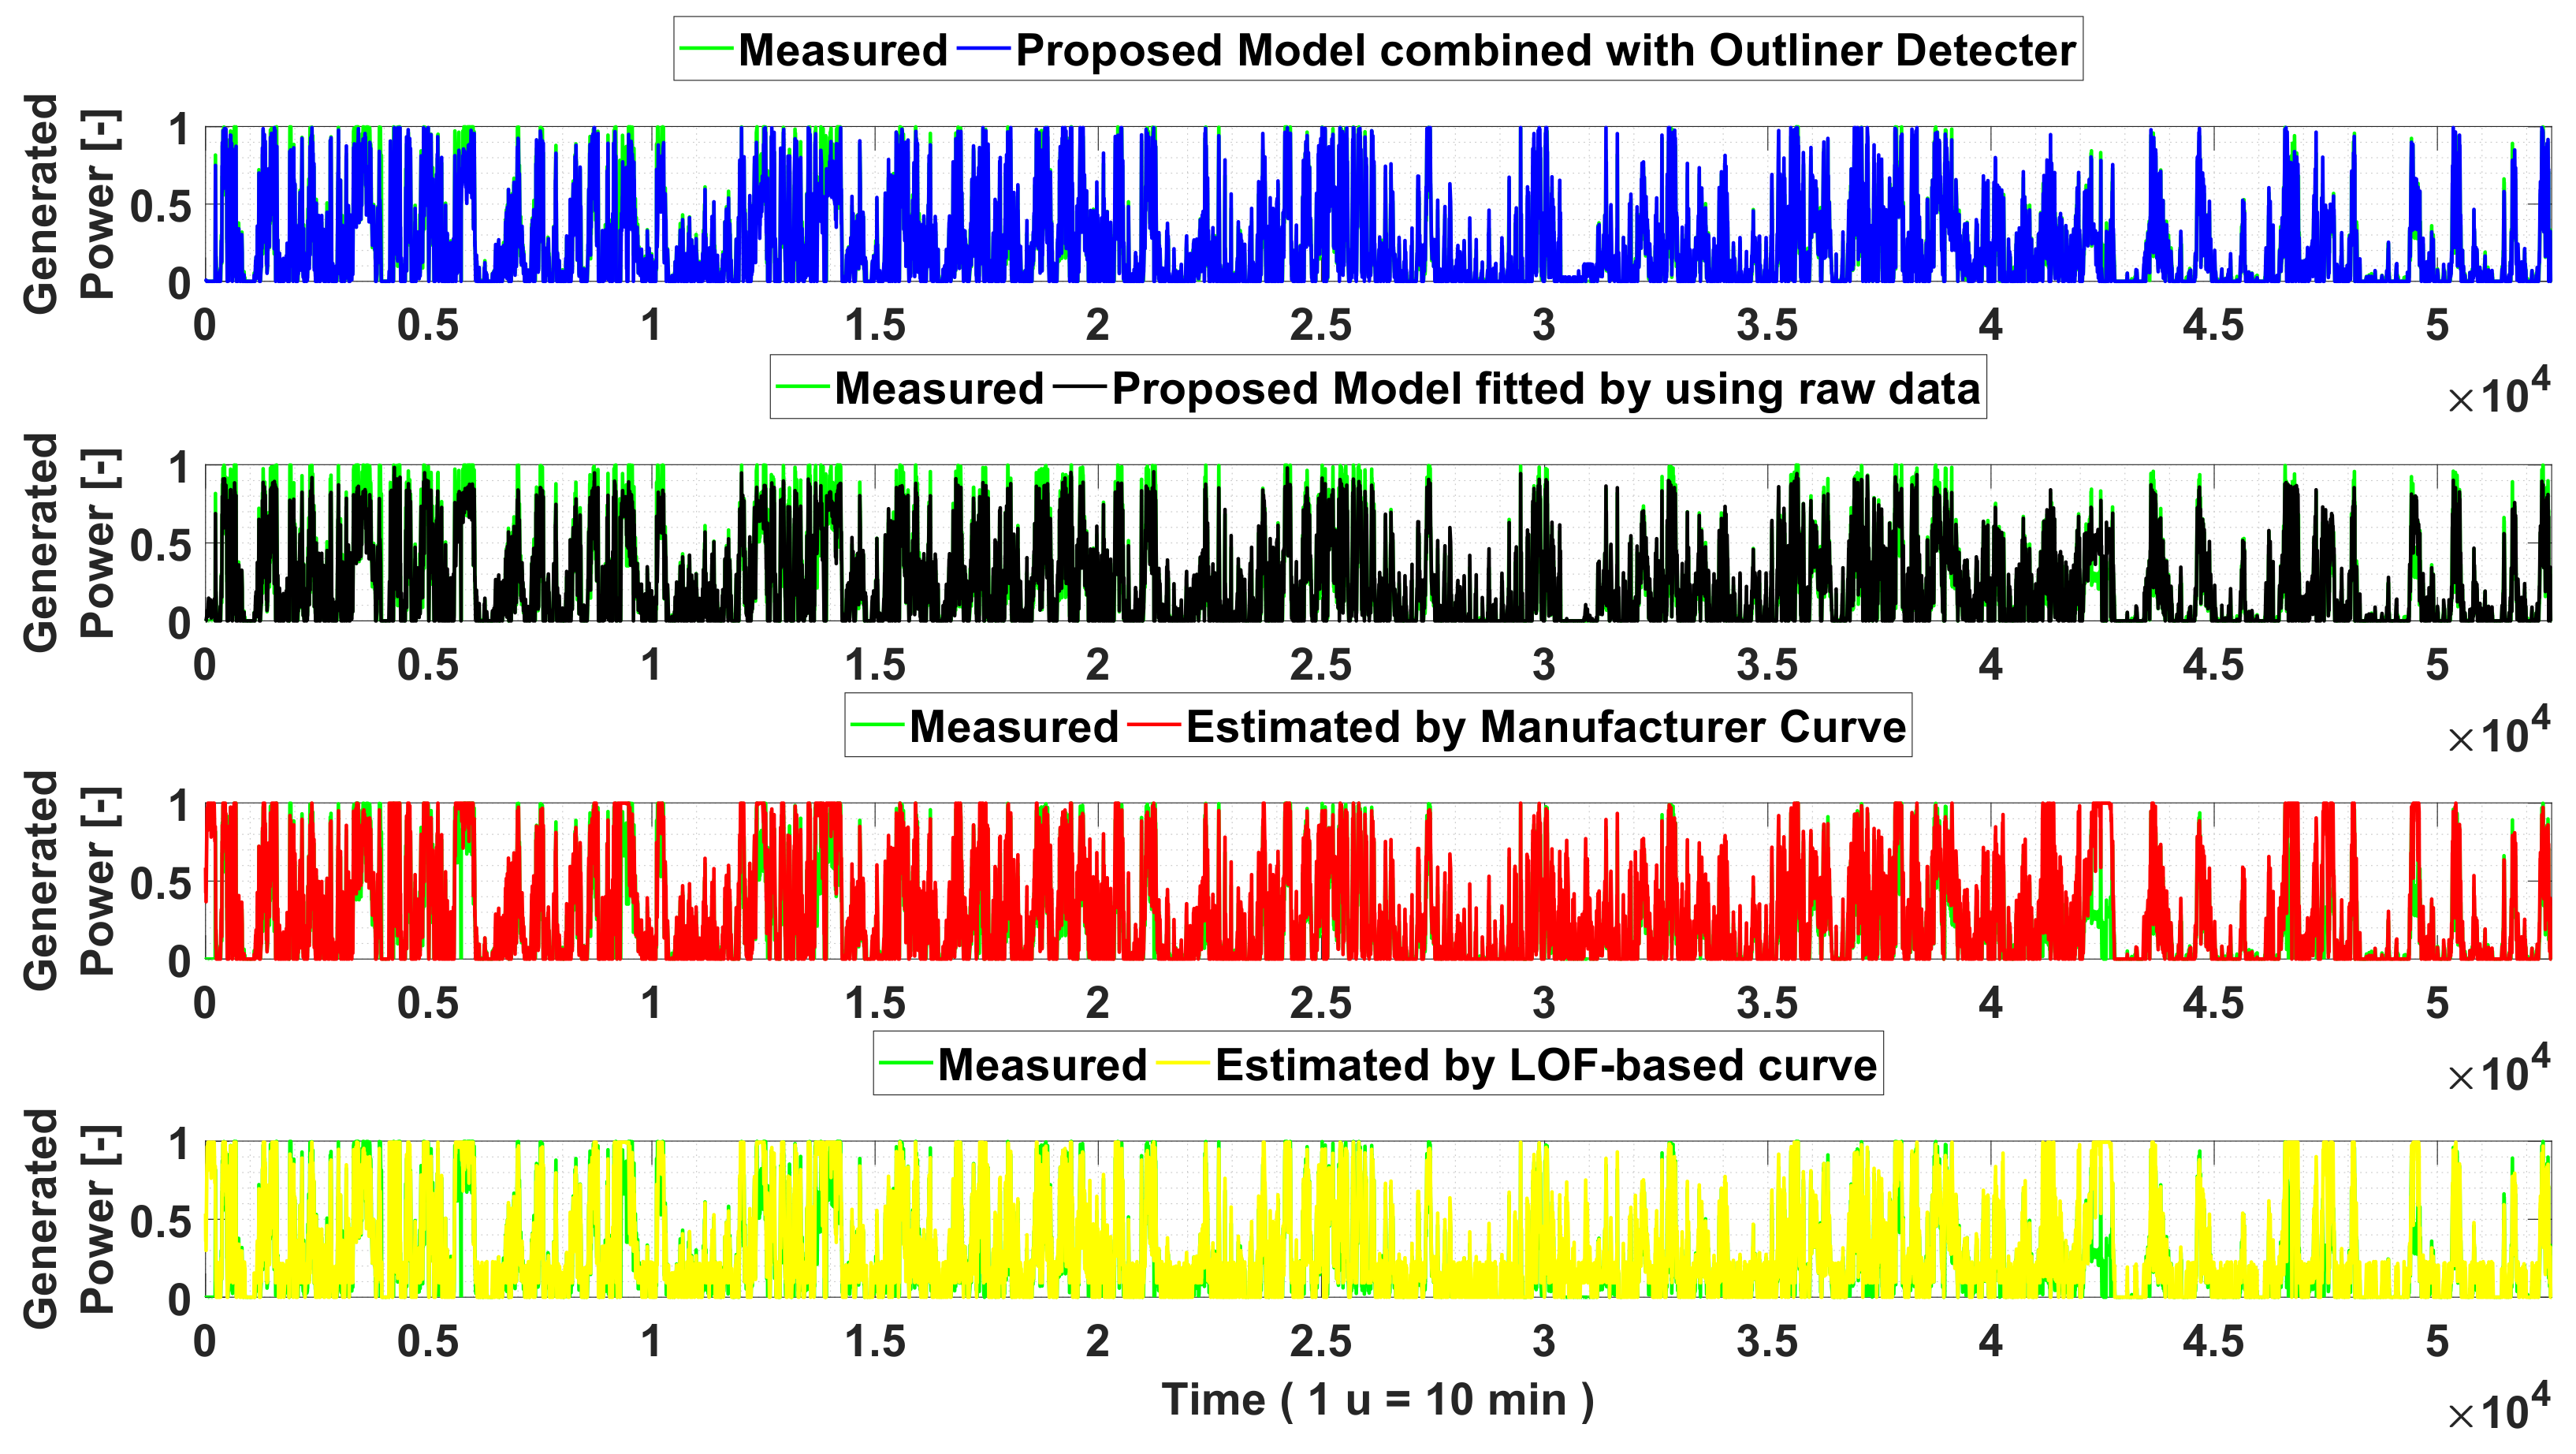
Starting from this data, the estimated generated power has been calculated for each of the analyzed method, obtaining the power profiles shown in Figure 8.
By applying the described methodology and fitting the proposed models on both filtered and raw data the most relevant results are here discussed in order to prove the effectiveness of the proposal of the authors to increase the accuracy of the wind generators models addressed on-line monitoring or electric network control. Furthermore, in order to complete the analysis, the other model has been compared with the proposed ones, in particular the models have been compared with a model developed on the manufacturer data and applying the local outliner factor.
The performances of the models have been evaluated on a period of one year, whom wind profile is shown in Figure 7, where is also possible appreciating the highlighted two central bounds that correspond to the areas where is possible producing wind power.
Then, by defining the following figure of merit:
where is the measured power value, the corresponding error profiles have been computed, obtaining the profiles shown in Figure 9.
By analyzing this figure, it appears clearly the benefits deriving by the application of the proposed filtering and classification algorithm, which is able to accurately assess the actual power profile, also in the presence of extremely changing operation scenario.
In particular, in Figure 8 is shown the filtered data-based model that well characterize the behavior of the wind generator in the case of high wind speeds, which is included between the rate and cut-off values where the different values of pitch angles greatly influence the curtail of power, with respect to the other compared method.
Indeed, the power profile obtained by the raw data-based model has shown the worst accuracy for high power generation, which is caused by the huge number of miscorrelation between wind and the corresponding power values. This is evident when the raw data-based model estimates power for high speed values, observable with reference to the time window for the interval defined by units of time.
In addition, by observing power generation profiles of both manufacturer and LOF-based models it is evident their reduced ability to describe critical operation scenarios, which are characterized by derating operations where is clear the influence of pitch angle. All this finds evidence in Figure 9, where for the considered time window is highlighted and this difference is expressed in per unit terms, and where the base value is the nominal active power of the wind generator.
All this is underlined in Figure 9, which shows the worst accuracy of the latter two models for the large part of operation scenarios in characterizing wind generator behavior. Obviously, all these graphical considerations are mathematically summarized by using Equations (11) and (12).
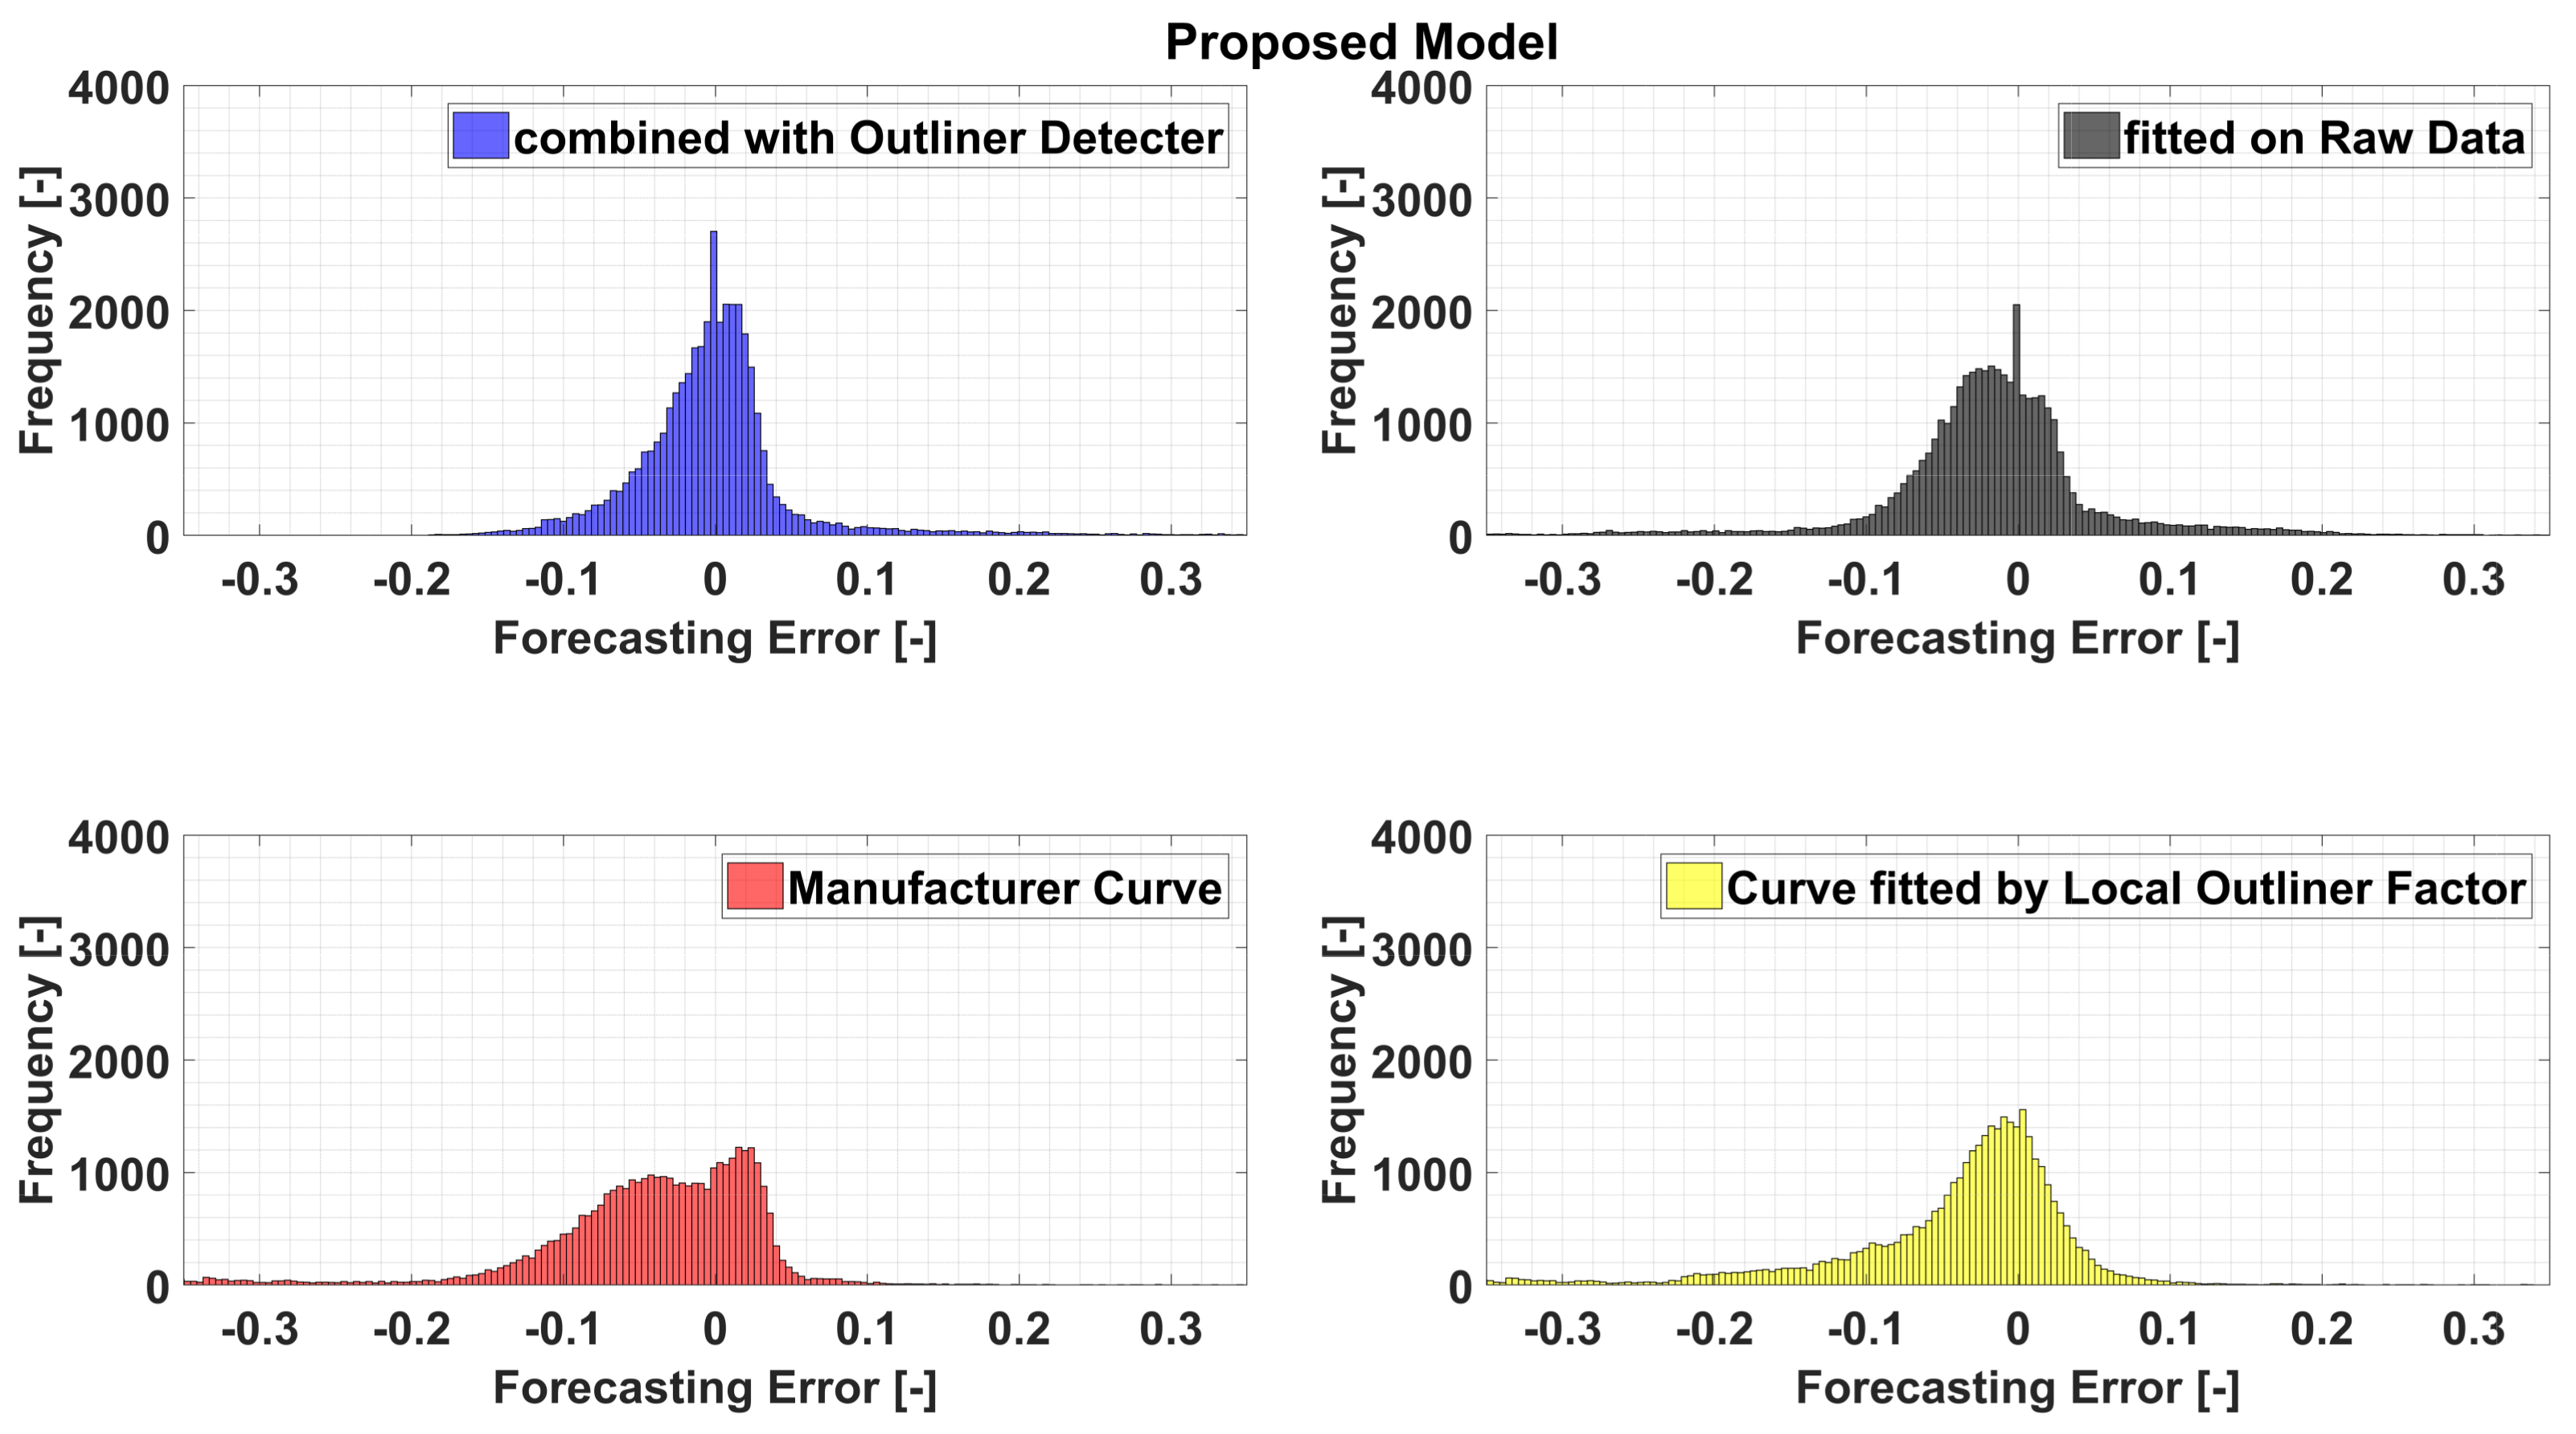
Furthermore, these features are confirmed by the distribution of the Root Mean Square Error depicted in Figure 10, and the Normalized Root Mean Square error and the Normalized Mean Absolute error reported in Table 3. The latter parameters have been computed as follows:
The model performances can be summarized in Figure 10, where the higher stability of the filtered data-based model appears clear, while the raw data-based model shows a wider width of the error. As natural consequence of all this and as the manufacturer and LOF-based model shows, there is a clear lower accuracy as proved by their corresponding error distributions, where their widths is much greater than the first twice.
Hence, in order to assess the robustness of the proposed method, the obtained power curves have been applied in the task of modeling all the wind generators of the analyzed wind farm. The obtained results, which have been reported in Table 4, confirmed the effectiveness of the proposed model in improving the modeling performance for all the wind generators.
Finally, the computational times required by the proposed methodology are shown in Table 5, where the SCADA data extraction routine has shown to be the most time consuming process in the proposed methodology.
4. Conclusions
The high penetration of wind generators in modern electrical grids is pushing transmission system operators and energy producers to enhance critical operation functions with accurate and reliable wind generators models, designed and updated by processing experimental data. To deal with the anomalies and incoherence affecting measured data, this paper proposed a classification method based on bad-data detection and unsupervised clustering analysis for wind data filtering and data-driven generator modeling. The main idea was to combine the robustness of adaptive filtering algorithms with the data classification capability of fuzzy data clustering for on-line detection of a valid data-set, and identifying a set of multivariate regression models relating the generated power to the measured variables.
The experimental results obtained on a complex case study demonstrated the effectiveness of the proposed method in enhancing the generation modeling accuracy compared to other traditional solution algorithms.
In particular, power system operators frequently integrate simple and reliable models of wind generators in solving power system operation problems. Hence, the possibility of enhancing these models with advanced tools aimed at relating the actual derated power capability to the pitch angle represents a strategic tool for reducing renewable power curtailments and power system congestions.
Indeed, the proposed method allows managing huge data-sets by processing a large matrix of measured data with computational times compatible with the time constraints imposed by power system operation. Moreover, the developed wind generator model has shown to be highly adaptive, since it allows correctly describing the behavior of all the available generators.
Another important feature characterizing the proposed method is its capability in on-line detection of potential miscorrelation between the measured and the estimated power output, as a function of the available SCADA data. Thanks to this feature, the system operator can define effective policies for optimal reserve management, by taking into account the expected operating state of the available wind generators.
Finally, the proposed model, by explicitly taking into account the pitch angle, is particularly suitable for supporting condition monitoring applications, since it allows detection if a reduction of the generated power is related to a failure or due a voluntary power reduction imposed by the system operator for congestion management. This feature is particularly useful in accurately quantifying the wind power curtails that should be imposed in order to mitigate expected network congestion.
Author Contributions
F.D.C. and A.V. conceived and designed the experiments; F.D.C. performed the experiments; F.D.C. and A.V., analyzed the data; F.D.C., A.V., D.V. wrote the paper.
Conflicts of Interest
The authors declare no conflict of interest.
Abbreviations
The following abbreviations are used in this manuscript:
| matrix of raw data | |
| R | number of elements wind speed corresponding power output contained in |
| matrix of valid data | |
| j | number of elements of matrix |
| matrix of invalid data | |
| k | number of elements of matrix |
| w | generic value of wind speed |
| power output of the manufacturer model assigned a generic wind speed value w | |
| cut in, rate and cut off wind speeds, respectively | |
| polynimial coefficients in the manufacturer curve model | |
| rate power value | |
| rth | element (row vector) of matrix |
| estimated power output for rth object using manufacturer power curve | |
| measured power output for element | |
| vector of half width values of the acceptability bound | |
| wind speed value for rth object | |
| sum of squared error in Fuzzy C-Means method | |
| membership matrix in FCM | |
| clusters center matrix in FCM | |
| m | index referred to the iteration number in FCM |
| Optimal number of clusters | |
| number of objects contained for each cluster | |
| sth cluster of | |
| vector of the max derated power output for each considered cluster | |
| sth expanded cluster of with the elements of that respect the described condition in the Algorithm 2 | |
| sensitive coefficients | |
| polynomial function of sth derated power curve | |
| estimated power for fth element of using the sth derated power curve | |
| value of wind speed for sth limit (beyond which for any wind speed value lower than cut-off limit the power output is a constant value) | |
| vectors of half width value of acceptability bound for sth derated power curve | |
| final matrix of valid objects obtained with the proposed data extraction methodology | |
| n | number of elements of matrix |
| pitch angle value , where for each element of the corresponds a pitch angle | |
| measured power vector for the validation period | |
| generic estimated power valued using one of the discussed model in this paper | |
| vector of the forecasting error for the validation period | |
| Normalized Normal Root Square Mean Error and Normalized Mean Absolute Error |
References
- Lerner, J.; Grundmeyer, M.; Garvert, M. The role of wind forecasting in the successful integration and management of an intermittent energy source. Energy Central Wind Power 2009, 3, 1–6. [Google Scholar]
- González-Aparicio, I.; Zucker, A. Impact of wind power uncertainty forecasting on the market integration of wind energy in Spain. Appl. Energy 2015, 159, 334–349. [Google Scholar] [CrossRef]
- Faias, S.; de Sousa, J.; Reis, F.S.; Castro, R. Assessment and optimization of wind energy integration into the power systems: Application to the portuguese system. IEEE Trans. Sustain. Energy 2012, 3, 627–635. [Google Scholar] [CrossRef]
- Schlechtingen, M.; Santos, I.F.; Achiche, S. Using data-mining approaches for wind turbine power curve monitoring: a comparative study. IEEE Trans. Sustain. Energy 2013, 4, 671–679. [Google Scholar] [CrossRef]
- Makarov, Y.V.; Etingov, P.V.; Ma, J.; Huang, Z.; Subbarao, K. Incorporating uncertainty of wind power generation forecast into power system operation, dispatch, and unit commitment procedures. IEEE Trans. Sustain. Energy 2011, 2, 433–442. [Google Scholar] [CrossRef]
- Commission, I.E. IEC 61-400-12—Wind Energy Generation Systems—Part 12-1: Power Performance Measurements of Electricity Producing Wind Turbines; IEC: Geneva, The Switzerland, 2015; pp. 1–558. [Google Scholar]
- Lydia, M.; Kumar, S.S.; Selvakumar, A.I.; Kumar, G.E.P. A comprehensive review on wind turbine power curve modeling techniques. Renew. Sustain. Energy Rev. 2014, 30, 452–460. [Google Scholar] [CrossRef]
- Diaf, S.; Notton, G.; Belhamel, M.; Haddadi, M.; Louche, A. Design and techno-economical optimization for hybrid PV/wind system under various meteorological conditions. Appl. Energy 2008, 85, 968–987. [Google Scholar] [CrossRef]
- Lydia, M.; Selvakumar, A.I.; Kumar, S.S.; Kumar, G.E.P. Advanced algorithms for wind turbine power curve modeling. IEEE Trans. Sustain. Energy 2013, 4, 827–835. [Google Scholar] [CrossRef]
- Jin, T.; Tian, Z. Uncertainty analysis for wind energy production with dynamic power curves. In Proceedings of the 2010 IEEE 11th International Conference on Probabilistic Methods Applied to Power Systems (PMAPS), Singapore, 14–17 June 2010; pp. 745–750. [Google Scholar]
- Kusiak, A.; Zheng, H.; Song, Z. Models for monitoring wind farm power. Renew. Energy 2009, 34, 583–590. [Google Scholar] [CrossRef]
- Kusiak, A.; Zheng, H.; Song, Z. On-line monitoring of power curves. Renew. Energy 2009, 34, 1487–1493. [Google Scholar] [CrossRef]
- Ackermann, T. Wind Power in Power Systems, 2nd ed.; John Wiley & Sons: Darmstadt, Germany, 2012. [Google Scholar]
- Ukil, A.; Zivanovic, R. Automated analysis of power systems disturbance records: Smart grid big data perspective. In Proceedings of the 2014 IEEE Innovative Smart Grid Technologies-Asia (ISGT Asia), Kuala Lumpur, Malaysia, 20–23 May 2014; pp. 126–131. [Google Scholar]
- Schlechtingen, M.; Santos, I.F. Comparative analysis of neural network and regression based condition monitoring approaches for wind turbine fault detection. Mech. Syst. Signal Process. 2011, 25, 1849–1875. [Google Scholar] [CrossRef] [Green Version]
- Liu, Z.; Gao, W.; Wan, Y.H.; Muljadi, E. Wind power plant prediction by using neural networks. In Proceedings of the 2012 IEEE Energy Conversion Congress and Exposition (ECCE), Raleigh, NC, USA, 15–20 September 2012; pp. 3154–3160. [Google Scholar]
- Nguyen, T.H.; Nunavath, V.; Prinz, A. Big data metadata management in smart grids. In Big Data and Internet of Things: A Roadmap for Smart Environments; Springer: Cham, Switzerland, 2014; pp. 189–214. [Google Scholar]
- Zheng, L.; Hu, W.; Min, Y. Raw wind data preprocessing: a data-mining approach. IEEE Trans. Sustain. Energy 2015, 6, 11–19. [Google Scholar] [CrossRef]
- Breunig, M.M.; Kriegel, H.P.; Ng, R.T.; Sander, J. LOF: Identifying density-based local outliers. In Proceedings of the ACM International Conference on Management of Data and Symposium on Principles of Database Systems, Dallas, TX, USA, 15–18 May 2000; Volume 29, pp. 93–104. [Google Scholar]
- Khan, Z.; Razali, R.B.; Daud, H.; Nor, N.M.; Fotuhi-Firuzabad, M.; Krebs, K.L. Bad data detection in power system state estimation based on generalized likelihood ratio test. Int. J. Energy Stat. 2016, 4, 1650016. [Google Scholar] [CrossRef]
- Ren, M.; Liu, P.; Wang, Z.; Yi, J. A Self-Adaptive Fuzzy c-Means Algorithm for Determining the Optimal Number of Clusters. Comput. Intell. Neurosci. 2016, 2016, 2647389. [Google Scholar] [CrossRef] [PubMed]
- Diamantoulakis, P.D.; Kapinas, V.M.; Karagiannidis, G.K. Big data analytics for dynamic energy management in smart grids. Big Data Res. 2015, 2, 94–101. [Google Scholar] [CrossRef]
- Bezdek, J.C. Pattern Recognition with Fuzzy Objective Function Algorithms; Springer Science & Business Media: Boston, USA, 1981. [Google Scholar]
- Caliński, T.; Harabasz, J. A dendrite method for cluster analysis. Commun. Stat.-Theory Methods 1974, 3, 1–27. [Google Scholar] [CrossRef]
Figure 1.
Proposed Methodology Scheme.

Figure 2.
Raw Data contained in

Figure 3.
Partitioning of data between Valid and Invalid classes.

Figure 4.
The Invalid Data Partitioning where the optimal number of classes computed is 25.

Figure 5.
Manufacturer Curve.

Figure 6.
Final Extracted Points from raw data by applying the proposed methodology.
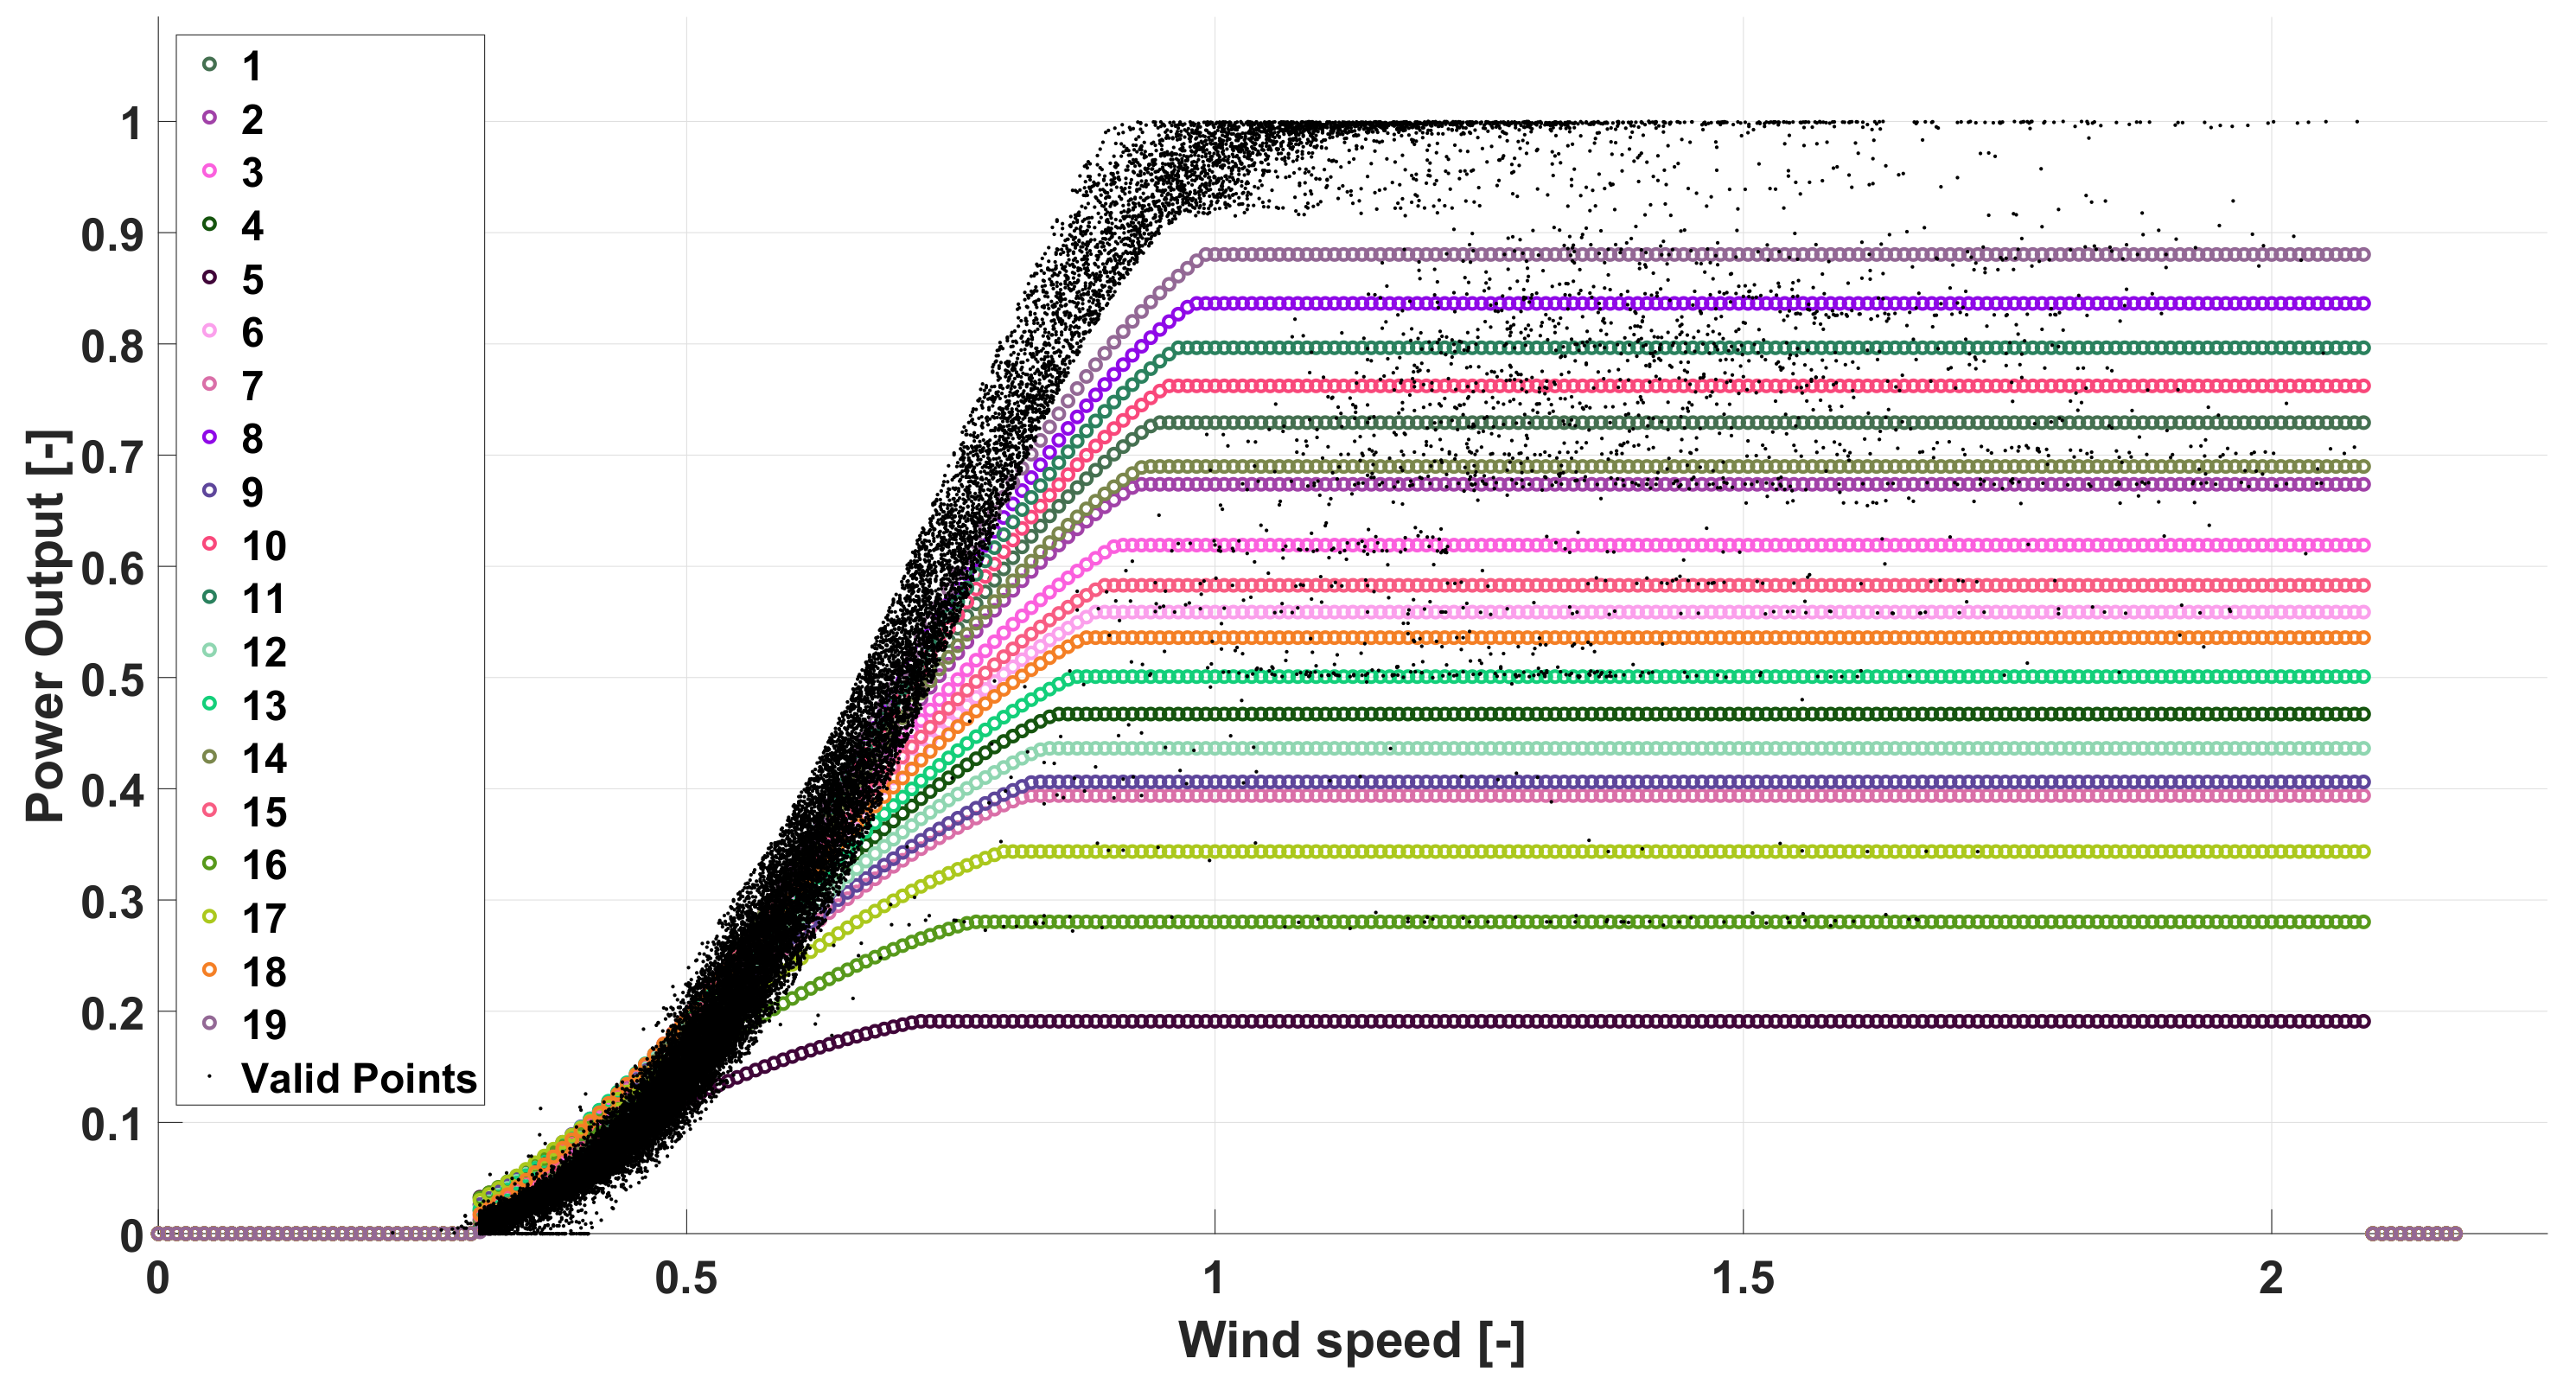
Figure 7.
Wind Speed annual profile of the validation period and bounds of theoretical generated power.
Figure 7.
Wind Speed annual profile of the validation period and bounds of theoretical generated power.

Figure 8.
Annual estimated generated power profiles for each method and related comparison to measured one (green).
Figure 8.
Annual estimated generated power profiles for each method and related comparison to measured one (green).

Figure 9.
Annual error profile of the estimated power for each discussed method.
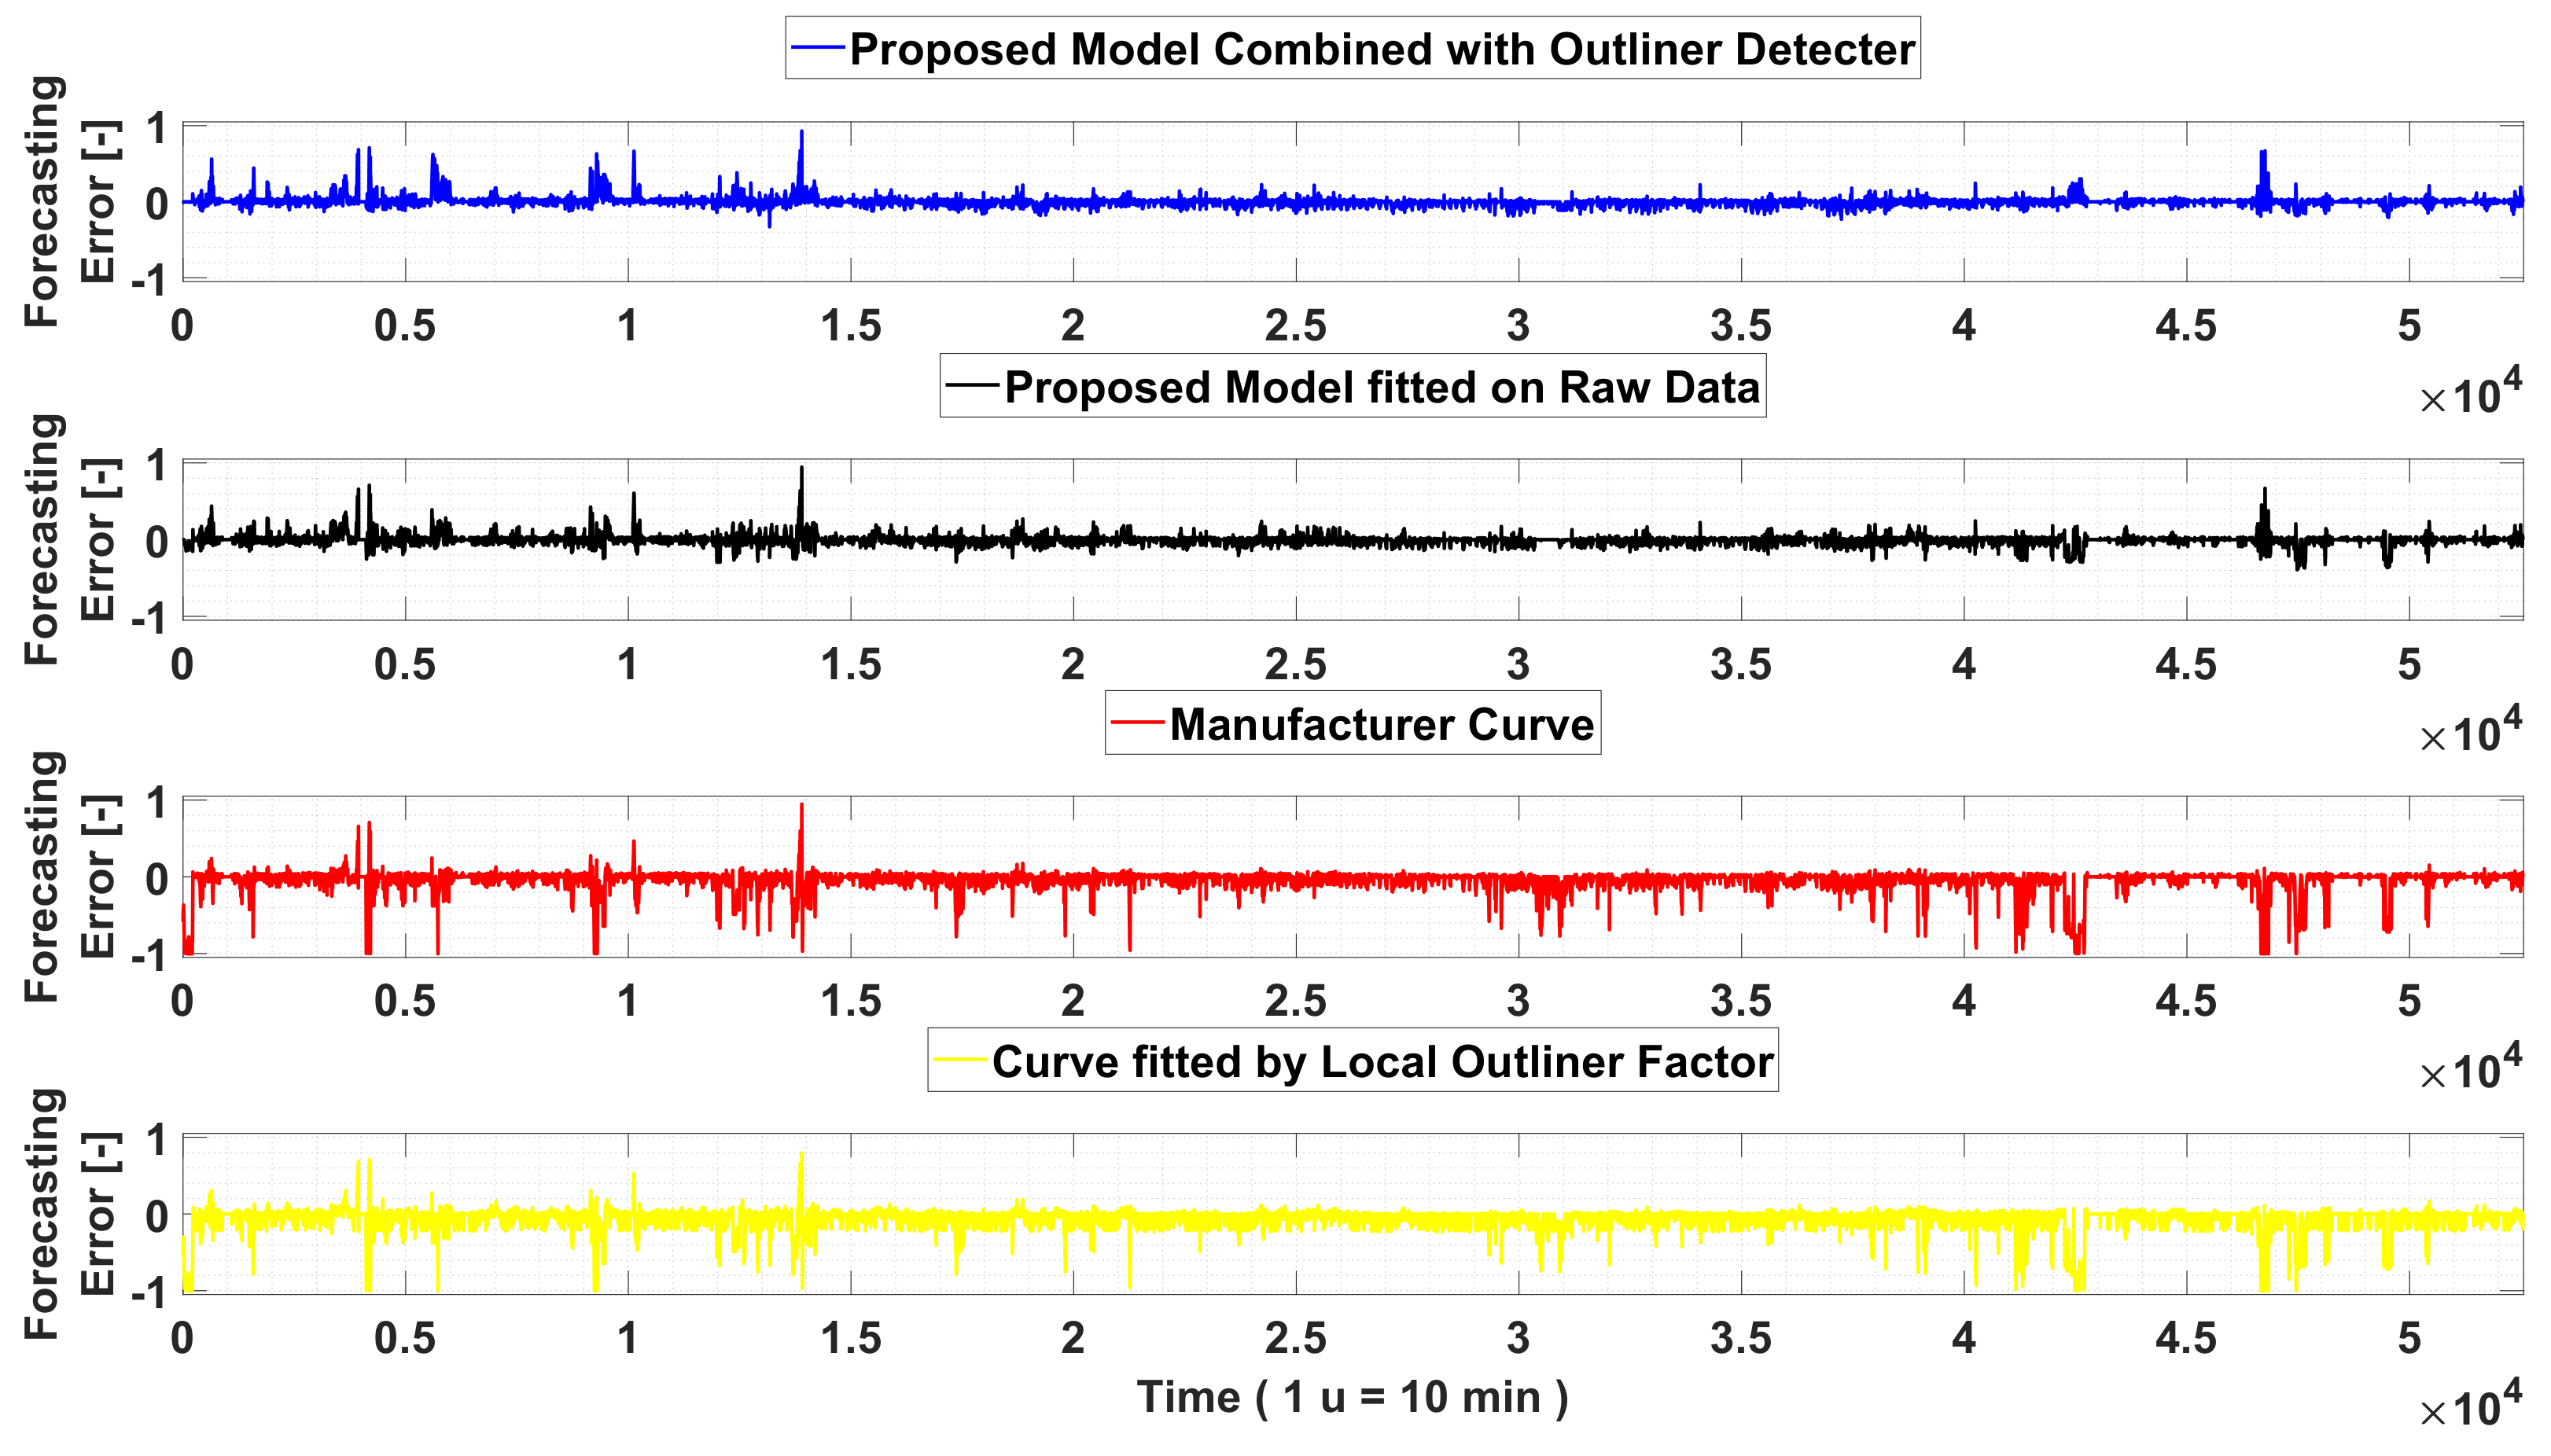
Figure 10.
Frequency distribution of the forecasted power error.


Table 1.
Manufacturer Data of the Wind Generator model employed in the analyzed wind farm.
| Technical Characteristic | ||
|---|---|---|
| Rated Power | 2010 | kW |
| Cut-in wind speed | 3 | m/s |
| Rated wind speed | 11.5 | m/s |
| Cut-out wind speed | 24.0 | m/s |
| Diameter | 92.5 | m |
| Area | 6.7201 | m2 |
| Rotor Speed | 7.5–15 | 1/min |
| Power Control | Electrical Pitch | |
Table 2.
Tables of the employed coefficients for setting the level of filtering in the proposed model.
Table 2.
Tables of the employed coefficients for setting the level of filtering in the proposed model.
| Coefficient | Value |
|---|---|
| 0.08 | |
| 0.05 | |
| 0.01 | |
| 0.10 |
Table 3.
Performance Index of Accuracy, WTG 1.
| Normalized Root Means Square Error [%] | Normalized Mean Absolute Error [%] | |
|---|---|---|
| Proposed Model Combined with cleaner data | 5.285 | 2.675 |
| Proposed Model fitted on raw data | 6.360 | 3.572 |
| Model fitted on manufacturer data | 15.954 | 6.934 |
| Model fitted on data filtered by using the LOF technique | 15.935 | 6.756 |
Table 4.
Synthesis results on the corresponding obtained improvements.
| Proposed Method Combined with Cleaner Data | Proposed Method Fitted on Raw Data | Improvements Introduced by the Adoption of the Cleaner Data | ||||
|---|---|---|---|---|---|---|
| NRSME [%] | NMAE [%] | NRSME [%] | NMAE [%] | NRSME [%] | NMAE [%] | |
| WTG 1 | 5.29 | 2.68 | 6.36 | 3.57 | 16.90 | 25.11 |
| WTG 2 | 4.24 | 2.22 | 6.05 | 3.18 | 29.86 | 30.26 |
| WTG 3 | 4.76 | 2.46 | 5.99 | 3.20 | 20.47 | 23.17 |
| WTG 4 | 3.74 | 1.99 | 5.27 | 2.57 | 29.05 | 22.62 |
| WTG 5 | 4.53 | 2.41 | 5.67 | 3.09 | 20.12 | 21.86 |
| WTG 6 | 5.17 | 2.48 | 6.08 | 3.11 | 14.94 | 20.22 |
| WTG 7 | 4.62 | 2.52 | 6.23 | 3.29 | 25.86 | 23.29 |
| WTG 8 | 2.35 | 1.01 | 3.69 | 1.21 | 36.17 | 16.28 |
| WTG 9 | 1.00 | 0.35 | 2.63 | 0.69 | 62.00 | 49.49 |
| WTG 10 | 1.74 | 0.61 | 3.04 | 0.89 | 42.98 | 31.61 |
| WTG 11 | 5.16 | 2.31 | 5.61 | 2.99 | 7.95 | 22.69 |
| WTG 12 | 3.80 | 1.96 | 5.53 | 2.78 | 31.24 | 29.34 |
| WTG 13 | 3.70 | 1.85 | 5.21 | 2.53 | 28.89 | 26.70 |
| WTG 14 | 3.45 | 1.70 | 5.01 | 2.40 | 31.16 | 28.99 |
| WTG 15 | 4.52 | 1.82 | 5.40 | 2.45 | 16.33 | 25.78 |
| WTG 16 | 3.29 | 1.61 | 4.26 | 2.20 | 22.58 | 26.93 |
| WTG 17 | 2.70 | 1.32 | 3.71 | 1.75 | 27.12 | 24.42 |
| WTG 18 | 3.82 | 1.95 | 4.93 | 2.54 | 22.60 | 23.25 |
| WTG 19 | 4.11 | 2.19 | 6.27 | 3.17 | 34.39 | 30.88 |
| Overall Wind Farm | 3.79 | 1.87 | 5.10 | 2.51 | 25.72 | 25.54 |
Table 5.
Computational times required.
| time (min) | |
|---|---|
| data extraction | 3–4 |
| data filtering | 2–3 |
| fitting model | 1–2 |
© 2018 by the authors. Licensee MDPI, Basel, Switzerland. This article is an open access article distributed under the terms and conditions of the Creative Commons Attribution (CC BY) license (http://creativecommons.org/licenses/by/4.0/).
Share and Cite
MDPI and ACS Style
De Caro, F.; Vaccaro, A.; Villacci, D. Adaptive Wind Generation Modeling by Fuzzy Clustering of Experimental Data. Electronics 2018, 7, 47. https://doi.org/10.3390/electronics7040047
AMA Style
De Caro F, Vaccaro A, Villacci D. Adaptive Wind Generation Modeling by Fuzzy Clustering of Experimental Data. Electronics. 2018; 7(4):47. https://doi.org/10.3390/electronics7040047
Chicago/Turabian StyleDe Caro, Fabrizio, Alfredo Vaccaro, and Domenico Villacci. 2018. "Adaptive Wind Generation Modeling by Fuzzy Clustering of Experimental Data" Electronics 7, no. 4: 47. https://doi.org/10.3390/electronics7040047
Note that from the first issue of 2016, this journal uses article numbers instead of page numbers. See further details here.