Methane Gas Density Monitoring and Predicting Based on RFID Sensor Tag and CNN Algorithm

1
School of Resource and Environmental Engineering, Jiangxi University of Science and Technology, Ganzhou 341000, China
2
College of Applied Science, Jiangxi University of Science and Technology, Ganzhou 341000, China
3
School of Electrical and Automation Engineering, East China Jiaotong University, Nanchang 330013, China
*
Authors to whom correspondence should be addressed.
Electronics 2018, 7(5), 69; https://doi.org/10.3390/electronics7050069
Submission received: 9 April 2018
/
Revised: 4 May 2018
/
Accepted: 10 May 2018
/
Published: 12 May 2018
(This article belongs to the Special Issue Unconventional RFID Systems)
Abstract
:According to the advantages of integrating wireless sensors networks (WSN) and radio frequency identification (RFID), this paper proposes a novel method for methane gas density monitoring and predicting based on a passive RFID sensor tag and a convolutional neural networks (CNN) algorithm. The proposed wireless sensor is based on electronic product code (EPC) generation2 (G2) protocol and the sensor data is embedded into the identification (ID) information of the RFID chip. The wireless sensor consists of a communication section, radio-frequency (RF) front-end section, and digital section. The communication section is used to perform the transmission and reception of wireless signals, modulation, and demodulation. The RF front-end section is adopted to provide the stable supply voltage for other parts. The digital section is employed to achieve sensor data and control the overall operation of the wireless sensor based on EPC protocol. Because the miscellaneous noises will decrease the accuracy during the process of data wireless transmission, the CNN algorithm is adopted to extract the robust feature from raw data. The measurement results show that the exploited RFID sensor can realize a maximum communication distance of 10.3 m and can accurately measure and predict the methane gas density in an underground mine. The RFID sensor technology is a beneficial supplement to the current underground WSN monitoring system.
1. Introduction
Because of the existence of methane and other toxic gases, underground mines have proved to be dangerous [1,2,3]. For example, 33.8% of accidents in underground mines are caused by methane gas density exceeding the normal range [4]. Generally speaking, these underground mine accidents are difficult to eliminate because human beings always work underground. In all accidents, methane exposure is the most common and the most serious [5,6]. The minimum explosion percentage of methane gas is 5%. However, when exposed to low methane gas density for a long time, the human body will still be severely damaged [7,8,9].
The methane gas density is traditionally measured by human beings [1,3]; however, this method is not only time-consuming and laborious, but dangerous to these people in underground mines. A search-and-rescue robot system was introduced for the remote sensing of the underground coal mine environment [10]. It can achieve environment sensing and rescue automatically. However, it is still not a real-time monitoring system. In the past few decades, the cable monitoring system (CMS) has been widely employed in underground mines for real-time environment monitoring [2]. Still, due to the complex situation of underground mines, the CMS requires high installation and maintenance costs. Therefore, the environmental monitoring of underground mines urgently needs a flexible and economic method.
In recent years, due to their advantages of fast deployment and low cost, wireless sensor network (WSN) technologies have been wildly applied in industry [11,12,13]. In particular, ZigBee technology has become the mainstream technology for underground environment monitoring [14,15,16]. Nevertheless, the WSN network does not care about the location of the sensor node; so, when an abnormal situation happens, the abnormal node cannot be identified quickly. Hence, the research on integrating WSN with radio frequency identification (RFID) arouses great interest [17,18,19]. Each RFID tag has a unique identification (ID) number. The integration of these two technologies is beneficial for the WSN network to concentrate on the data transmission. When the information of a specific node is considered, this node can be quickly located by using the RFID function. Furthermore, because the RFID sensor employs a backscattering communication scheme, it can work in passive mode for long-term application. Hence, RFID sensor technology is a beneficial supplement to the current WSN technology. While there are always several research projects focusing on the combination of RFID and WSN technology [20,21,22], this paper studied the feasibility of monitoring methane gas density in an underground mine environment by using a wireless sensor based on RFID technology for the first time.
RFID sensors can be classified into two categories, the chipless group [17,23] and chip-based group. Chipless RFID sensors adopt a sensor’s signal to directly modulate the backscattering performances of the antenna. They have the advantage of being ultra-low cost; however, they are not suitable for composing the sensor network due to the lack of digital blocks. Chip-based RFID sensors can also be divided into two groups, integrated circuit (IC)-based RFID sensors [18,19] and printed circuit board (PCB)-based RFID sensors [24,25]. IC-based RFID sensors integrate the sensors with an RFID tag chip, resulting in small circuit area and high stability. However, these sensors require a long design period. Moreover, only several kinds of sensor can be fabricated by the complementary metal oxide semiconductor (CMOS) process. PCB-based RFID sensors incorporate an RFID chip, sensors, and digital blocks on the same board. These sensors show the advantages of short design period, high extension capability, and low cost.
Besides real-time monitoring, gas density prediction is also important for mine safety. Due to the harsh underground environment, the data measured by the passive wireless sensor contains miscellaneous noises, which makes it difficult to extract robust features from the raw signal by using traditional methods [26,27,28]. In recent years, deep learning technology with autonomous learning ability has been widely researched and has made surprising progress in feature learning [29,30,31,32]. Deep belief networks (DBNs) [33], stacked denoising auto-encoders (SDAs) [32], and convolutional neural networks (CNNs) [34] are three widely employed deep learning approaches. CNN shows priority in feature extraction and data compression [35]. Therefore, in this paper CNN is employed for feature extraction.
This paper presents a novel wireless sensor based on RFID technology for methane gas monitoring in the long term. It is a beneficial supplement to the current underground WSN monitoring system. Considering the environment interruption on data wireless transmission, CNN is adopted to extract robust and discriminative features from the raw signal.
2. RFID Sensor Design
2.1. Communication Mechanism
The RFID system generally consists of an RFID tag and an RFID reader. Figure 1 shows the basic communication flow based on the electronic product code (EPC) generation2 (G2) protocol [36]. Within the communication distance, the reader first sends the Select instruction by carrier wave (CW) to the tag to change the tag’s status. The reader then sends the Query instruction to the tag and the tag responds with its RN16. After that, the reader sends the ACK instruction to obtain the ID information and CRC code of the tag. Finally, Req_RN is sent by reader to acquire the Handle response of the tag.
From the information discussed above, we found that there is no direct instruction for processing sensor information; hence, we have to adjust this communication flow. In general, the sensor data are stored in the non-volatile memory of the tag chip, but it exhibits long response time and high power consumption during the read/write process [20]. Thus, in this paper the sensor data is embedded into the identification (ID) information of the RFID tag. In this way, the time for reading and writing the sensor data into the non-volatile memory can be avoided, resulting in lower power consumption and response time compared with the traditional method. Figure 2 shows the comparison of the ID information between the traditional method and the proposed method.
Anti-collision technology is common in the field of RFID systems. However, in the field of environment monitoring of underground mines, the position of the RFID sensor tag is fixed. The number of the RFID sensor tag and the density of the RFID reader are not as much as in the field of supply chain or health monitoring. Hence the anti-collision problem is not a serious issue in the application of underground mine monitoring. As for our design, we propose the Q algorithm in EPC Gen2 protocol [36] for RFID tag anti-collision and the reader-coverage collision avoidance arrangement (RCCAA) method [37,38] for RFID reader anti-collision.
2.2. Wireless Sensor Design
The block diagram of the proposed wireless sensor is illustrated in Figure 3a. It consists of three parts: a communication section, an RF front-end section, and a digital section. The communication section contains the antenna and RFID tag chip, which are employed to perform the transmission and reception of wireless signals, modulation, and demodulation. The RF front-end section, composed of a matching network, a four-stage rectifier, and a low dropout (LDO) voltage regulator, is adopted to provide the stable supply voltage for other parts. The matching network, containing an RF inductor (Lm) and an adjustable ceramic trimmer capacitor (Cm), is employed to realize the maximum energy transferring efficiency. The power harvested by the antenna is an ultra-high frequency signal, which cannot be used to power the remaining part of the RFID sensor directly. Therefore, as shown in Figure 3b, a four-stage rectifier is introduced to rectify and boost the harvested power to the required direct current (DC) voltage. The LDO voltage regulator is then used to generate a stable DC voltage for other parts. The digital section, consisting of a micro-controller unit (MCU) and a methane gas density sensor, is employed to achieve sensor data and control the overall operation of the wireless sensor based on EPC G2 protocol.
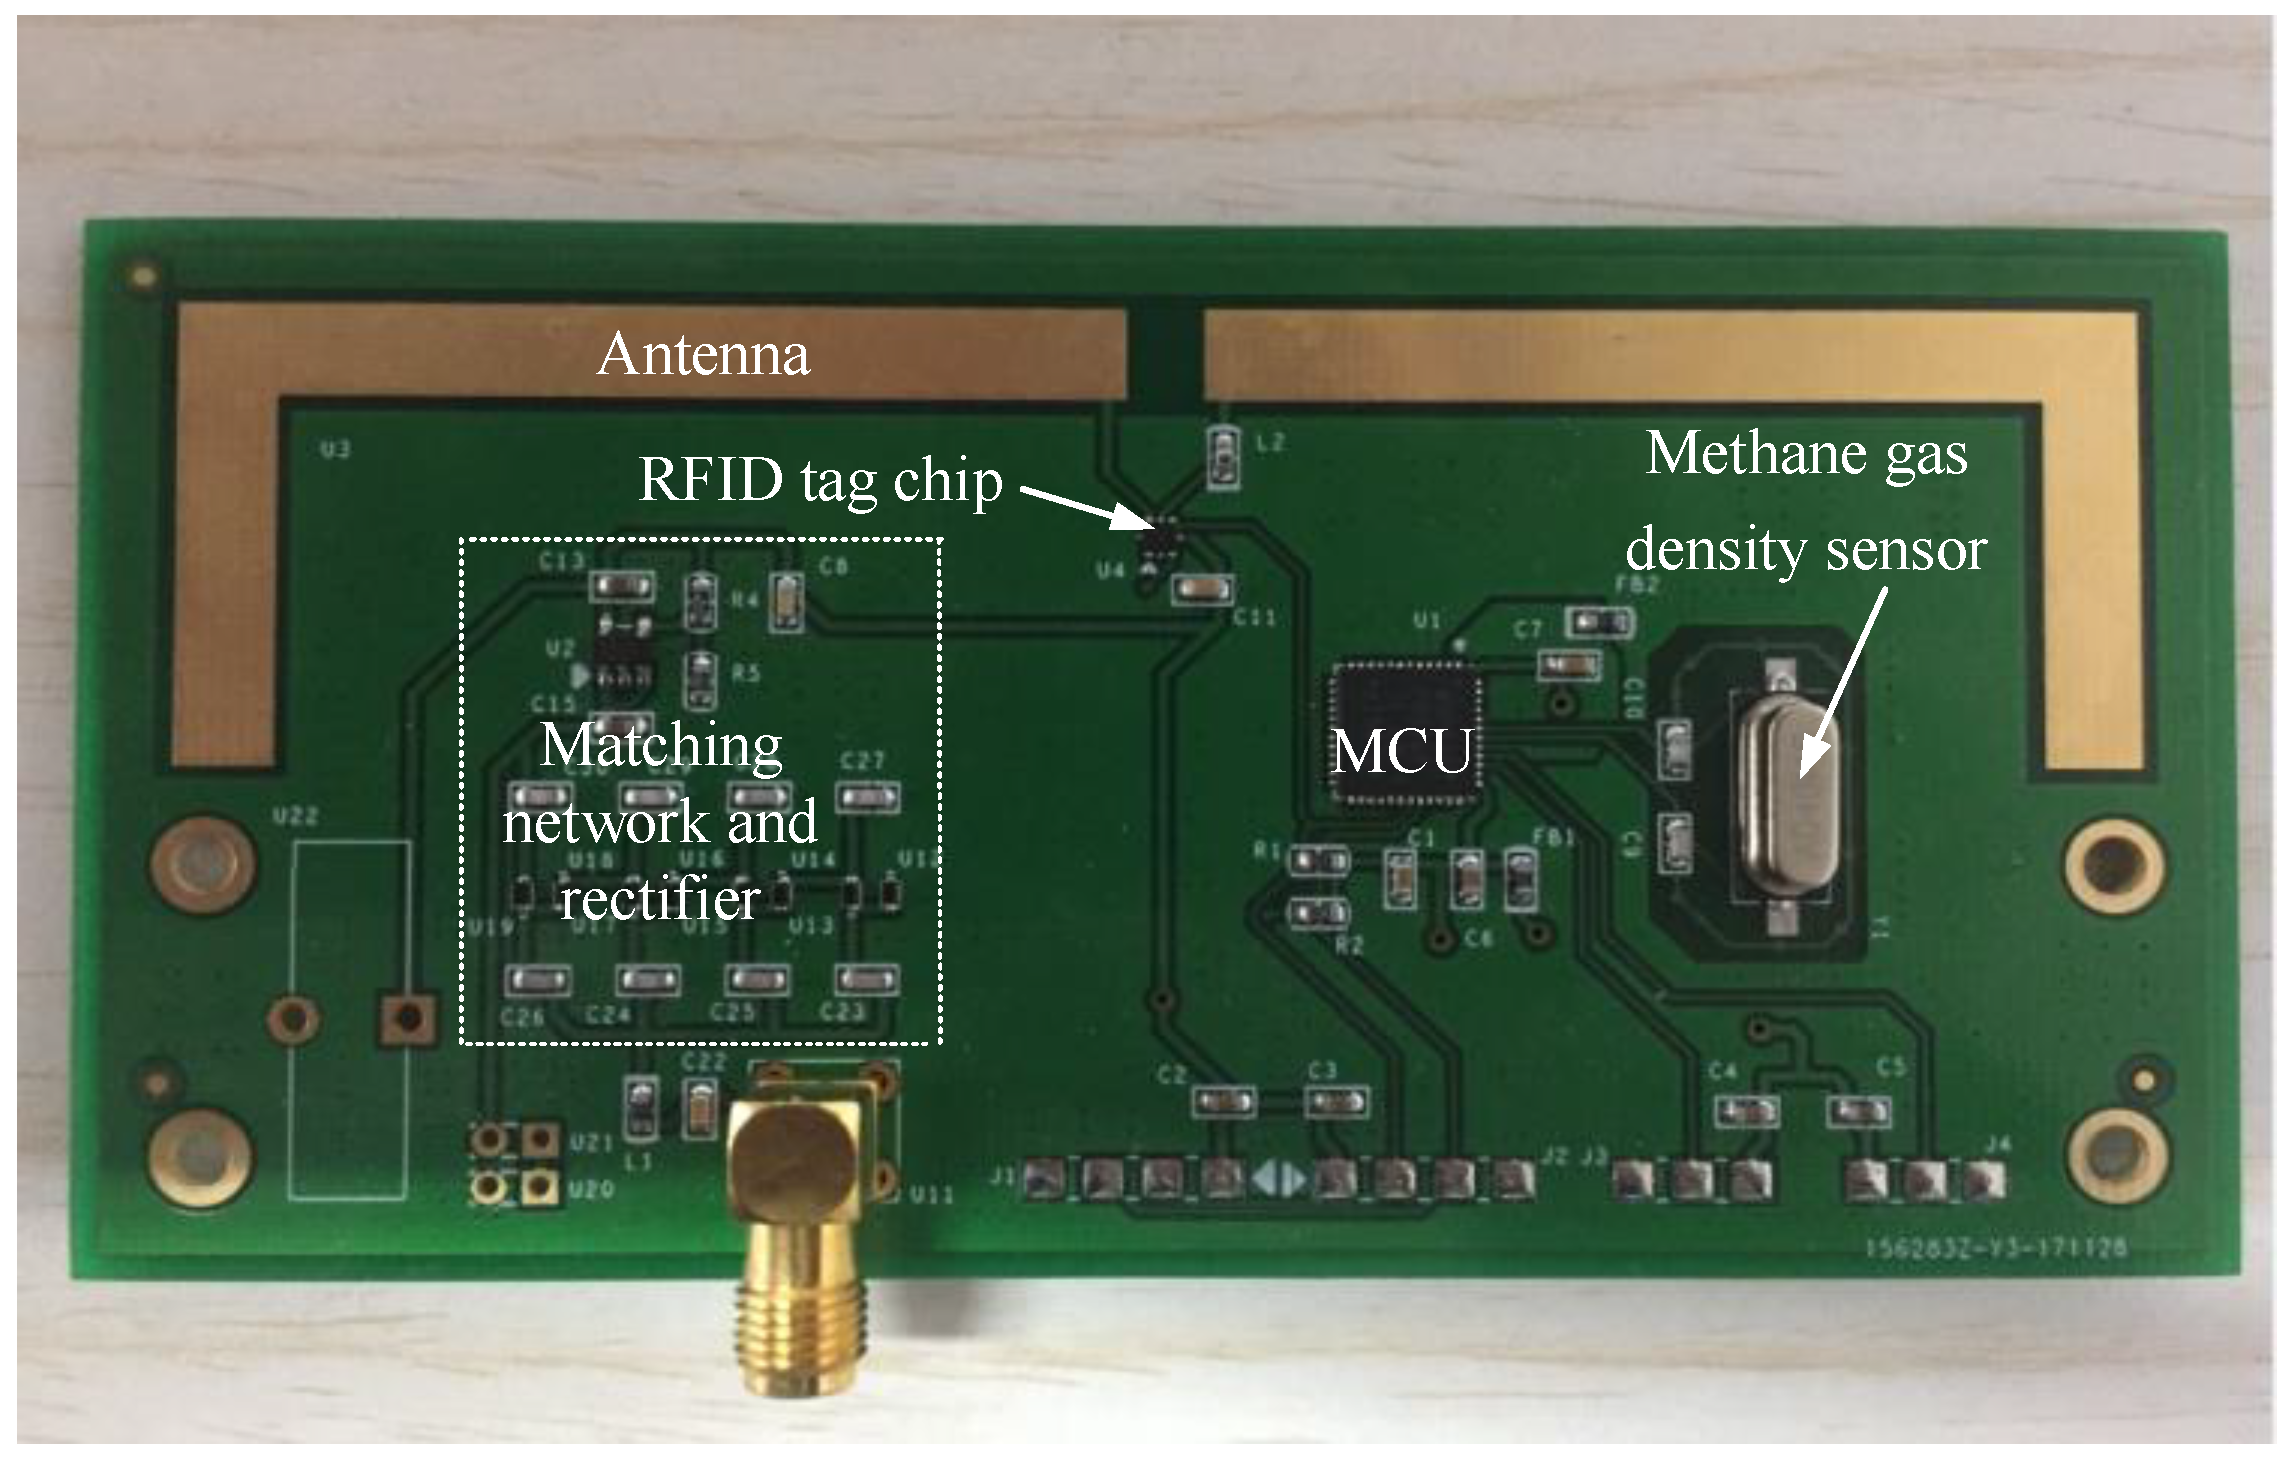
Figure 4 shows the prototype of the exploited RFID sensor tag. Aiming at the low-cost application, a dipole antenna is adopted for both communicating and energy harvesting. The antenna is etched on the FR4 substrate, the dielectric constant and thickness of which are 4.5 and 1.5 mm, respectively. The RFID chip chosen is Monza X-8K, with an impedance at 915 MHz of 19–172 Ω. The rectifier adopts a zero-bias Schottky diode SMS7630 as the switch diode for high rectifying efficiency. The NCP583 is selected as the LDO voltage regulator, which can generate 1.8 V output voltage within the input range from 1.65 to 1.83 V. The MCU adopts MSP430FR6964, which can provide 2526 kB FRAM and a 12-bit 200-ksps Analog-to-Digital Converter (ADC). This MCU only consumes 118 μA/MHz at 1.8 V supply voltage in the measurement mode. The employed methane gas density sensor is MQ-4, which can detect the methane gas density within the range of 300–10,000 ppm.
Figure 5 shows the whole procedure of monitoring and predicting methane gas density. The proposed RFID sensor tag is adopted to collect the methane gas density data, and the CNN is employed to extract robust features from the raw data. After that, the least squares support vector regression (LS-SVR) is established based on the extracted features. Then, the established LS-SVR is used to predict the methane gas density.
3. Proposed Algorithm
3.1. Convolutional Neural Network
The basic structure of the CNN is shown in Figure 6. Each sample data is input in two-dimensional form, and then the hidden layer is input by kernel function. The hidden layer is mainly composed of alternately repeated convolution layer and pool layer, and the output of this layer is sampled as the next layer. The structure has a higher fault tolerance to the input samples, and can realize the hierarchical expression of data more accurately. The convolution layer is used to extract the local features of input data and consists of multiple feature matrices. Each characteristic matrix can be regarded as a plane (the same convolution kernel on the same plane), so it has the characteristics of parallel computation and greatly reduces the number of free parameters. Different planes correspond to different convolution kernels so that the extracted features are more fully demonstrated.
The calculation process of the convolution layer is shown in Figure 7a. The calculation method is as follows:
In the formula, l represents the number of layers, f is the activation function, K is the convolution kernel, B is the bias, X is the input value, and Y is the output value.
The pool layer is used to compress data on the results of the stacked layer to reduce data dimensions. The feature extracted by the pool layer has no deformation at scale and prevents over fitting. The pooling process is shown in Figure 7b, and the calculation is as follows:
A fully-connected layer is connected after the combination of some convolutional and pooling layers. The fully-connected layer shows similar function to the traditional multilayer neural network and can be applied through different classification models. The softmax regression, which can achieve fast computation and an accurate result, is the most popular output layer. The output of the softmax regression can be obtained as follows:
In the learning process, the back-propagation algorithm is adopted, that is, the weight matrix is adjusted by reducing the mean square error (MSE) of the ideal output and the actual output. The MSE is calculated as follows:
Here, yj is the actual output and oj is the ideal output.
The essence of the convolution neural network is to learn a number of filters that can extract the characteristics of the input data, extract the topological features hidden in the data through layer-by-layer convolution and pooling, and finally obtain the input data with translation, rotation, and scaling, the characteristics of the nature of change. This method can learn the features implicitly from the data, avoid explicit feature extraction, and achieve higher accuracy and efficiency than traditional neural networks.
3.2. Least Squares Support Vector Regression
For a training dataset {(xi, yi)|i = 1, 2, …, n}, , , (n is the elements number in the data set and N is the dimension of x), the LS-SVR model is defined as [39]:
where w is the coefficient matrix, b is the bias term, and φ(x) is employed to project the data x into a higher dimensional space. The LS-SVR is determined by w and b, so the target is to search for the parameters which can acquire a satisfactory generalization performance. This target can be achieved by minimizing:
where ei is used to minimize the deviations of the regression function, and C is used to control the compromise between the complexity and the fitness to the data. The Lagrange multiplier approach is employed to solve the optimization problem:
where 1 = [1, 1, …, 1], α = [α1, α2, …, αn]T, y = [y1, y2, …, yn]T, and K = k(xi, xj) is the kernel function. It can be obtained by the kernel trick: k(xi, xj) = φ(xi)× (xj).
Finally, the LS-SVR model is equivalent to [36]:
The kernel function significantly influences the performance of the LS-SVR model. Since the raw signal is characterized as non-linear and non-stationary, the radial basis function (RBF) is used as the kernel function [40]:
where σ is the bandwidth of the kernel.
For a series of observations Xt = [xt−(n−1)s, xt−(n−2)s, …, xt], s is the interval of measurement and n is the series length. The goal of prediction is to estimate xt+r based on Xt. The estimated value can be calculated by:
where is the estimated value, and f(x) is the trained LS-SVR.
4. Experimental Results and Discussion
In this paper, compared with the conventional sensor data stored in non-volatile memory (NVM), the identification (ID) organization is optimized to achieve less communication time delay and longer communication distance. Therefore, the time delay and maximum communication distance of both the traditional method and the proposed method were experimentally measured. The exploited wireless sensor operates at 915 MHz, and the radiation power of the reader is 4 W. The operating distance between the wireless sensor and the reader was set to 1.5 m. The measured results are listed in Table 1.
Since the supply voltage to the sensor tag is fixed at 1.8 V, the whole power consumption of the RFID sensor tag is determined by the consumed current. The proposed sensor is powered by a DC power supply PMX-35A (Kikusui, Yokohama, Japan), and the consumed current is measured by a digital multimeter Keithley 2010 (Tektronix, Shanghai, China). The developed sensor tag is activated every 30 ms by an RFID reader. Figure 8 illustrates the current waves of the RFID sensor, employing these two different sensor data storage methods. The measured currents of the proposed method and the traditional method are 207 μA and 478 μA, respectively. The proposed sensor tag still has a current consumption of 4.2 μA in sleep mode.
The intensity of the received signal strength indication (RSSI) is one aspect with which to evaluate the performance of the proposed wireless sensor. The RSSI can be calculated by:
where YR is the RSSI (dBm) and X is the received signal power (mW). As shown in Figure 9a, the RSSI performance of the proposed wireless sensor was performed in the underground mine. The experiment results are illustrated in Figure 9b. It can be seen that within the distance of 10.3 m, the RSSI is higher than −60 dBm. We know from Reference [41] that this result is acceptable.
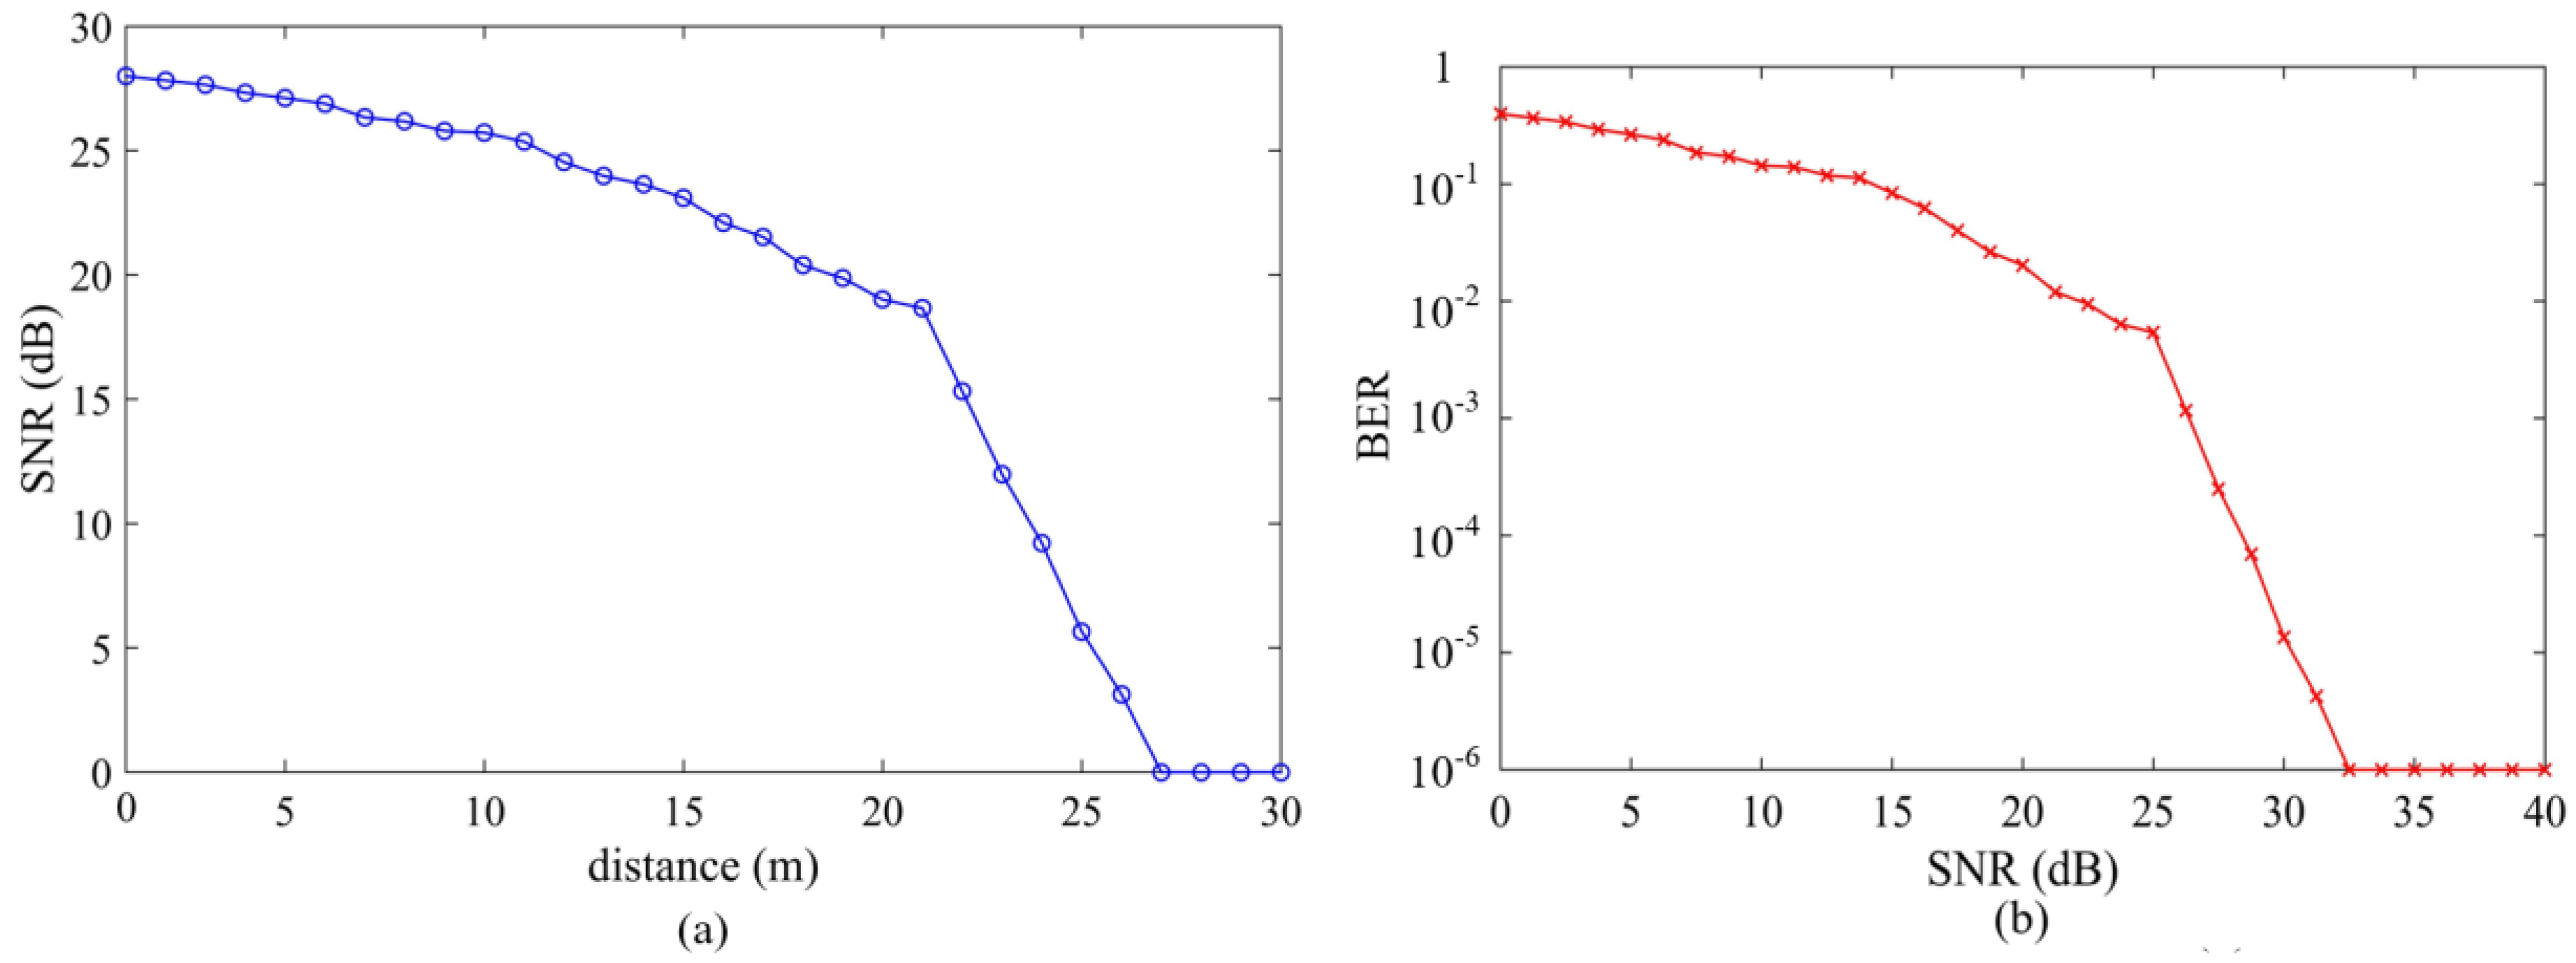
The proposed RFID communication protocol requires a bit error rate (BER) less than 0.001 and signal to noise ratio (SNR) higher than 25 dB [36]. The BER performance is determined by the communication environment and SNR, therefore the SNR over distance and the BER under different SNRs should be measured. Figure 10a shows the measured SNR under different distances; it can be seen that within the communication distance of 10.3 m, the measured SNR is higher than 26 dB. Figure 10b shows the measured BER under different SNR. As seen in the figure, when the SNR is higher than 25 dB, the measured BER is less than 0.001. Therefore, the proposed wireless sensor works well in the test scenario.
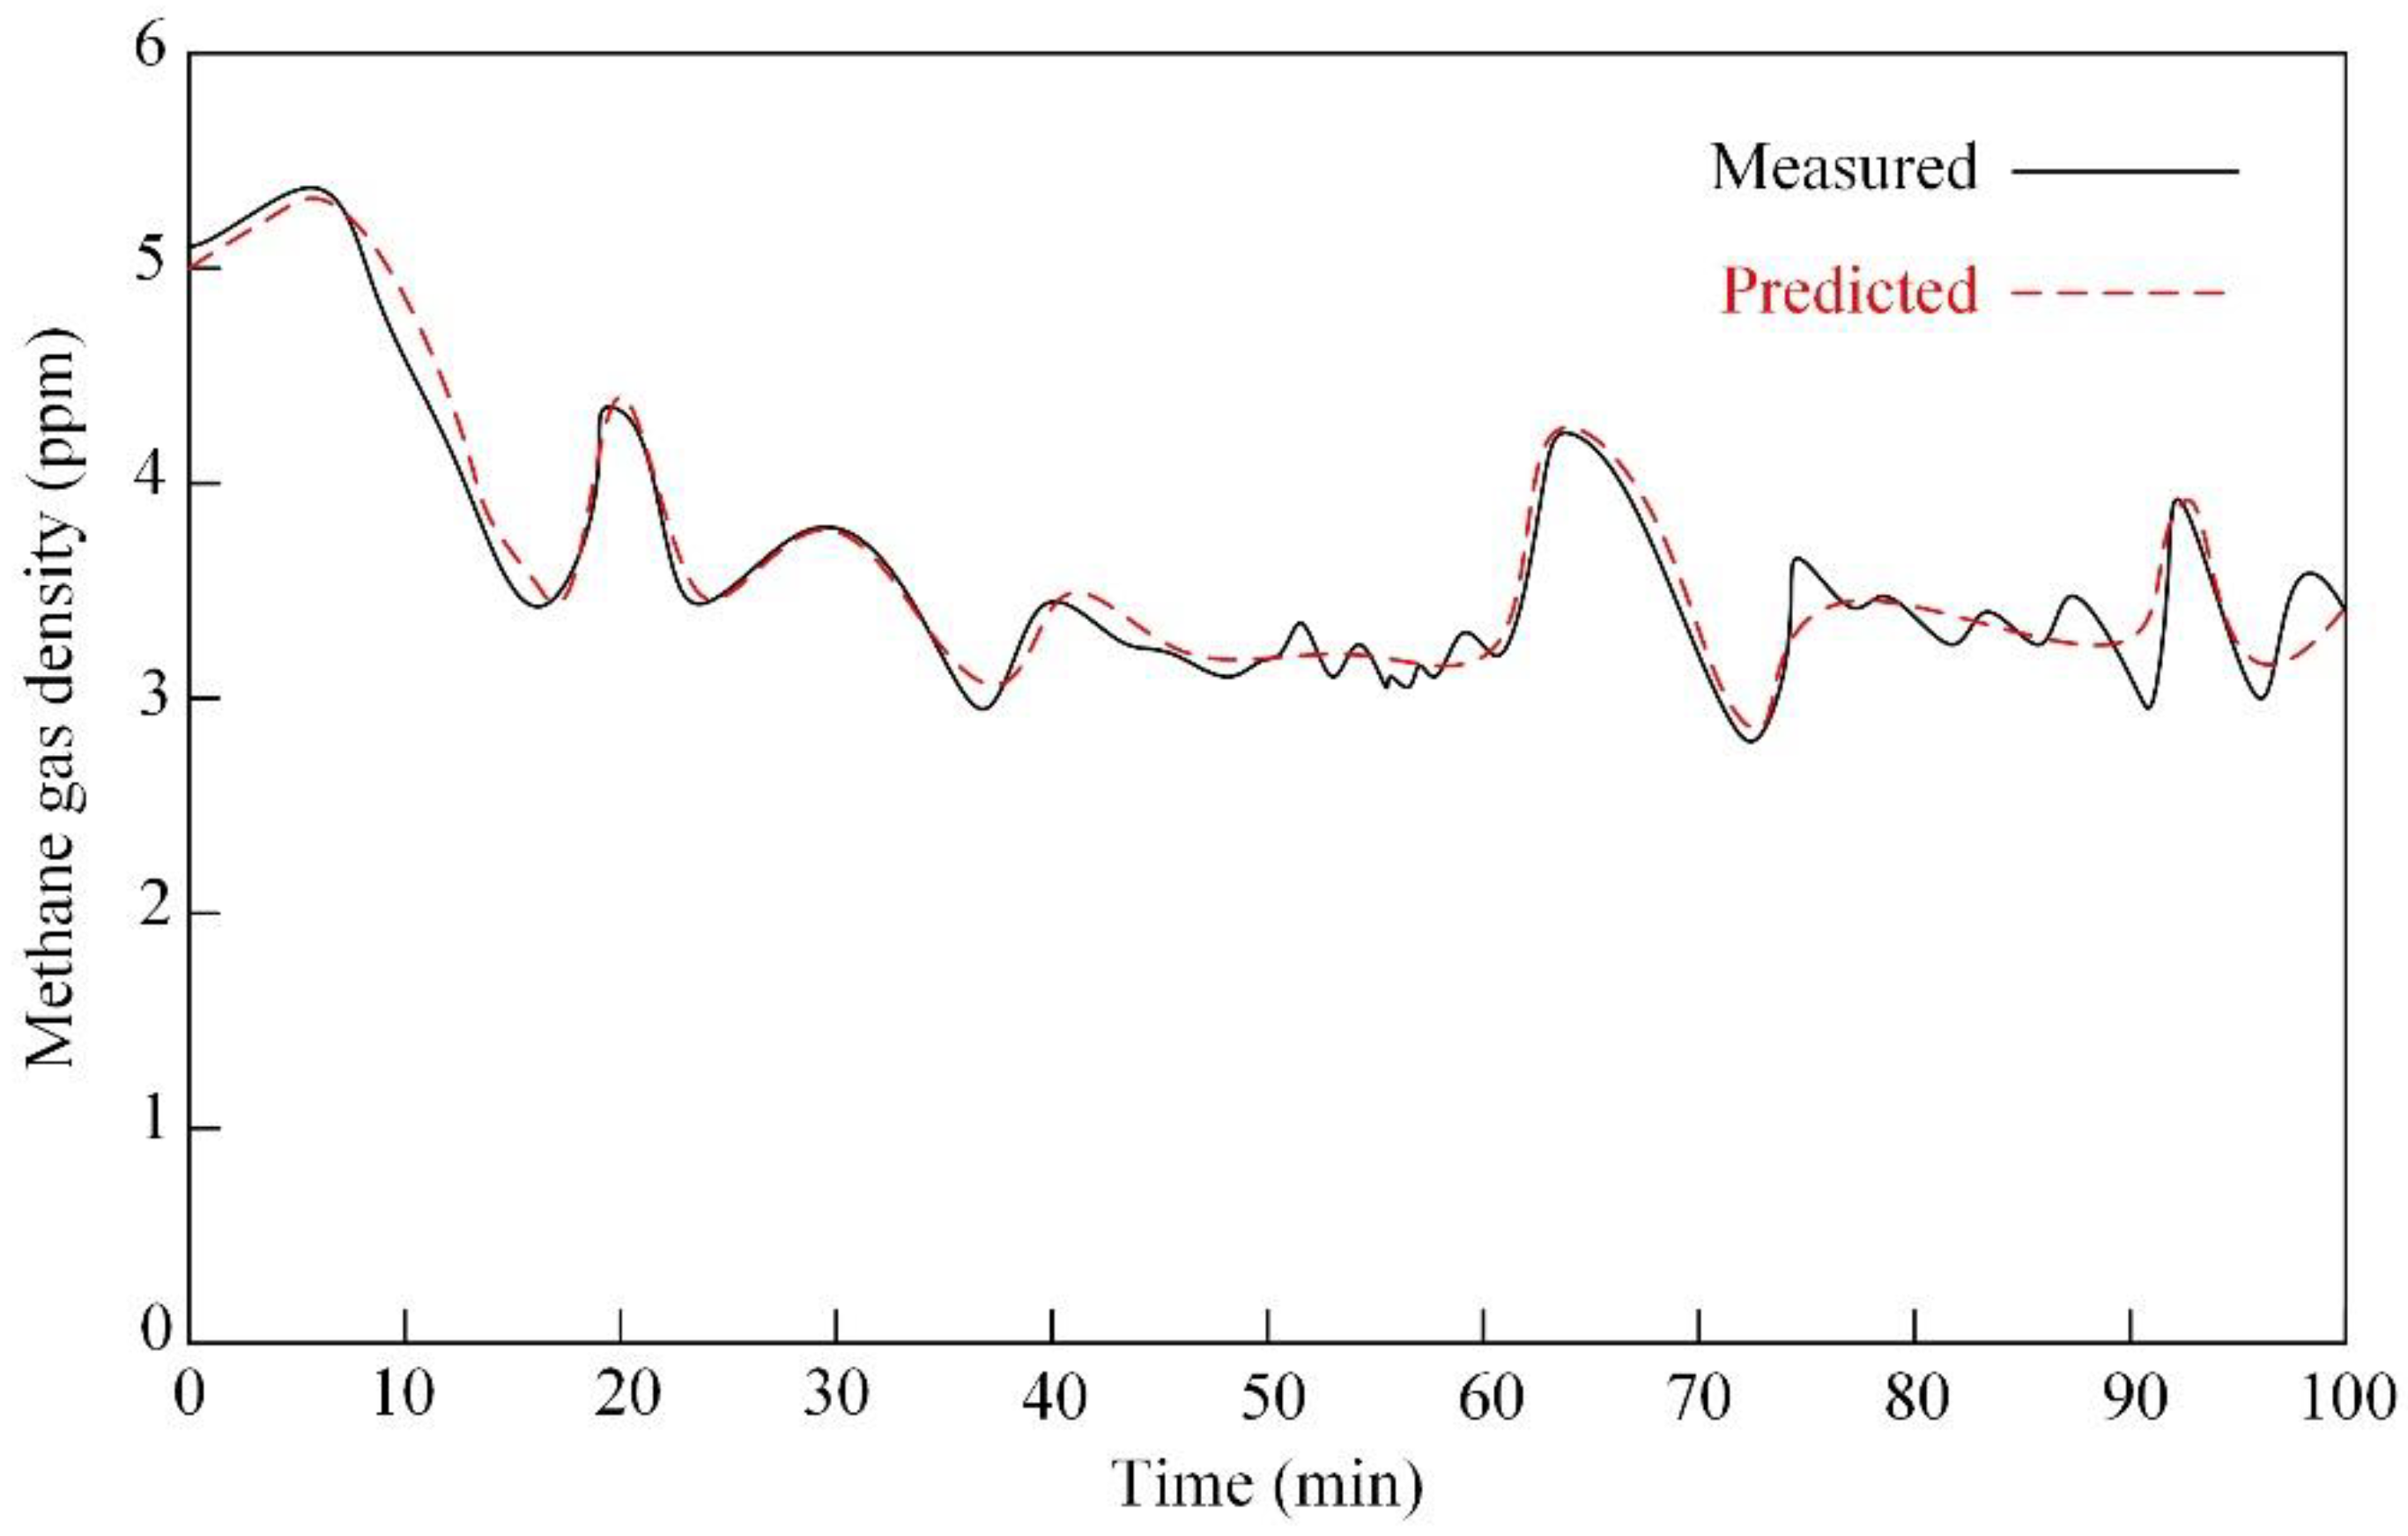
In order to verify the estimated performances of the proposed method, we tested the wireless sensor at the underground mine site. Meanwhile, a commercial gas concentration detector was put in the same spot as a reference. The proposed approach was employed to predict the methane gas density, and the measurement results are shown in Figure 11. As can be seen, the predicted results are consistent with the measured results and the maximum error is 0.42 ppm within 100 min.
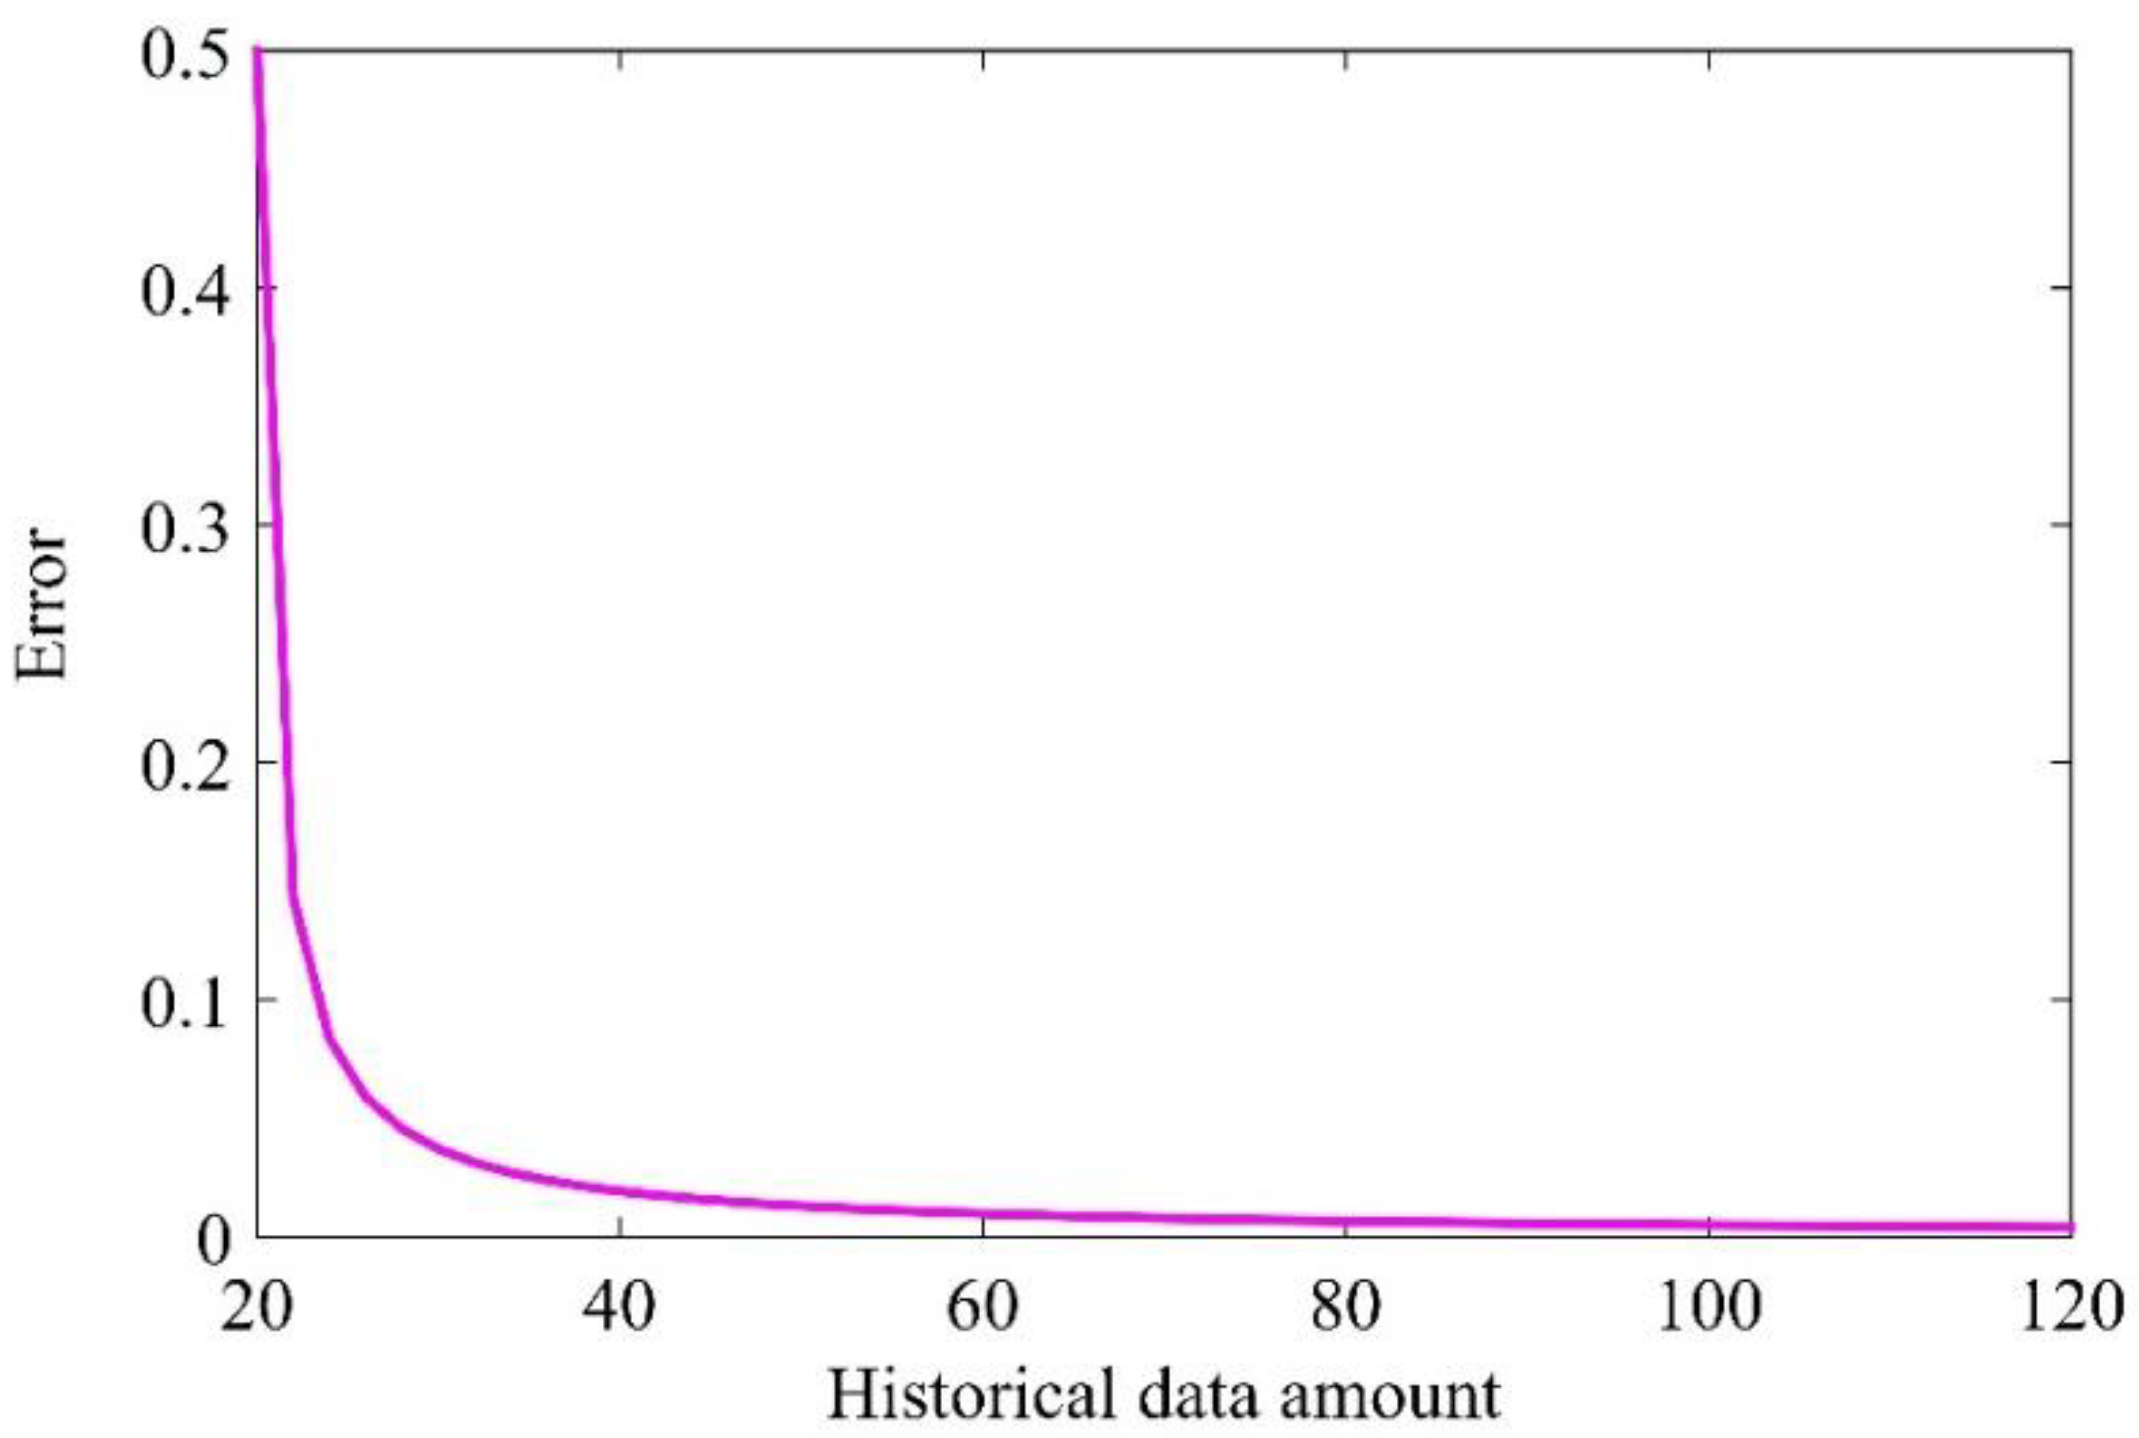
In general, the available historical data is also one of the factors that affect the prediction accuracy. Therefore, we measured the prediction error under different available historical data and the measured results are shown in Figure 12. At the beginning of prediction, the LS-SVR model is trained by little historical data, which leads to big prediction error. With the increase of available historical data, the error is quickly decreased to 0.00012. Thus, it can be deduced that the proposed method can achieve high prediction accuracy with sufficient historical data.
To better verify the priorities of the proposed method, its performance is compared with several wireless sensors which are introduced for methane gas density measurement. Table 2 shows the comparison results. As can be seen, the exploited wireless sensor shows the advantages including low cost, additional ID information, additional predicting ability, longer communication distance, and higher accuracy compared with the other reported wireless sensors.
5. Conclusions
Considering the advantages of integrating RFID and WSN, a novel monitoring and predicting method for underground methane gas density is introduced in this paper. The proposed wireless sensor is based on passive RFID technology and consists of a communication section, RF front-end section, and digital section. The data transmitted by the wireless sensor contains miscellaneous noises, which makes it difficult to realize accurate monitoring and prediction. Hence, a deep learning approach is employ to extract robust features from the raw data. The experimental results demonstrate that the introduced wireless sensor achieves a maximum communication distance of 10.3 m and can accurately measure and predict the underground methane gas density.
Author Contributions
C.Z. and Y.F. are responsible for the algorithm design. F.D. and X.W. are responsible for the design of the RFID sensor tag. All authors provided help in the revision of this manuscript.
Acknowledgments
This work was supported by Natural Science Foundation of China (51767006, 51464015), Natural Science Foundation of Jiangxi Province (20171BAB206045), and Science and Technology Project of Education Department of Jiangxi Province (GJJ160491, GJJ170378).
Conflicts of Interest
The authors declare no conflict of interest.
References
- Zhang, Y.; Yang, W.; Han, D.; Kim, Y.-I. An integrated environment monitoring system for underground coal mines—Wireless Sensor Network subsystem with multi-parameter monitoring. Sensors 2014, 14, 13149–13170. [Google Scholar] [CrossRef] [PubMed]
- Ni, L.M.; Liu, Y.; Zhu, Y. China’s National Research Project on Wireless Sensor Networks. IEEE Wirel. Commun. 2011, 14, 78–83. [Google Scholar] [CrossRef]
- Li, M.; Liu, Y. Underground Coal Mine Monitoring with Wireless Sensor Networks. ACM Trans. Sens. Netw. 2012, 5, 1–29. [Google Scholar] [CrossRef]
- Gao, Y.; Fu, G.; Nieto, A. A comparative study of gas explosion occurrences and causes in China and the United States. Int. J. Min. Reclam. Environ. 2015, 30, 269–278. [Google Scholar] [CrossRef]
- Wang, H.; Cheng, Y.; Yuan, L. Gas outburst disasters and the mining technology of key protective seam in coal seam group in the huainan coalfield. Nat. Hazards 2013, 67, 763. [Google Scholar] [CrossRef]
- Joy, G.J. Evaluation of the approach to respirable quartz exposure control in us coal mines. J. Occup. Environ. Hyg. 2012, 9, 65–68. [Google Scholar] [CrossRef] [PubMed]
- CDC. Center for Disease Control and Prevention Mining Facilities. Available online: http://www.cdc.gov/niosh/mining/statistics/allmining.html (accessed on 6 September 2017).
- Jo, B.W.; Khan, R.M.A. An Event Reporting and Early-Warning Safety System Based on the Internet of Things for Underground Coal Mines: A. Case Study. Appl. Sci. 2017, 7, 925. [Google Scholar]
- Osunmakinde, I.O. Towards safety from toxic gases in underground mines using wireless sensor networks and ambient intelligence. Int. J. Distrib. Sens. Netw. 2013, 9. [Google Scholar] [CrossRef]
- Zhao, J.; Gao, J.; Zhao, F.; Liu, Y. A Search-and-Rescue Robot System for Remotely Sensing the Underground Coal Mine Environment. Sensors 2017, 17, 2426. [Google Scholar] [CrossRef] [PubMed]
- Byun, J.; Jeon, B.; Noh, J.; Kim, Y.; Park, S. An intelligent self-adjusting sensor for smart home services based on ZigBee communications. IEEE Trans. Consum. Electron. 2012, 58, 794–802. [Google Scholar] [CrossRef]
- Kumar, A.; Hancke, G.P. Energy efficient environment monitoring system based on the IEEE 802.15.4 standard for low cost requirements. IEEE Sens. J. 2014, 14, 2557–2566. [Google Scholar] [CrossRef]
- Kovačić, M.; Vražić, M.; Gasparac, I. Bluetooth wireless communication and 1-wire digital temperature sensors in synchronous machine rotor temperature measurement. In Proceedings of the 14th International Power Electronics Motion Control Conference, Ohrid, Makedonija, 6–8 September 2010; pp. T7-25–T7-28. [Google Scholar]
- Chehri, A.; Farjow, W.; Mouftah, H.T.; Fernando, X. Design of wireless sensor network for mine safety monitoring. In Proceedings of the 2011 24th Canadian Conference on Electrical and Computer Engineering, Niagara Falls, ON, Canada, 8–11 May 2011. [Google Scholar]
- Moridi, M.A.; Kawamura, Y.; Sharifzadeh, M.; Chanda, E.K.; Jang, H. An investigation of underground monitoring and communication system based on radio waves attenuation using ZigBee. Tunn. Undergr. Space Technol. 2014, 43, 362–369. [Google Scholar] [CrossRef]
- Bhattacharjee, S.; Roy, P.; Ghosh, S.; Misra, S.; Obaidat, M.S. Wireless sensor network-based fire detection, alarming, monitoring and prevention system for Bord-and-Pillar coal mines. J. Syst. Softw. 2012, 85, 571–581. [Google Scholar] [CrossRef]
- Deng, F.; He, Y.; Li, B.; Song, Y.; Wu, X. Design of a Slotted Chipless RFID Humidity Sensor Tag. Sens. Act. B Chem. 2018, 264, 255–262. [Google Scholar] [CrossRef]
- Deng, F.; He, Y.; Li, B.; Zuo, L.; Wu, X.; Fu, Z. A CMOS pressure sensor tag chip for passive wireless applications. Sensors 2015, 15, 6872–6884. [Google Scholar] [CrossRef] [PubMed]
- Deng, F.; He, Y.; Li, B.; Zhang, L.; Wu, X.; Fu, Z.; Zuo, L. Design of an Embedded CMOS Temperature Sensor for Passive RFID Tag Chips. Sensors 2015, 15, 11442–11453. [Google Scholar] [CrossRef] [PubMed]
- Catarinucci, L.; Donno, D.D.; Mainetti, L.; Palano, L.; Patrono, L.; Stefanizzi, M.L.; Tarricone, L. An IoT-Aware Architecture for Smart Healthcare Systems. IEEE Int. Things J. 2015, 2, 515–526. [Google Scholar] [CrossRef]
- Mainetti, L.; Palano, L.; Patrono, L.; Vergallo, R.; Stefanizzi, M.L. Integration of RFID and WSN technologies in a Smart Parking System. In Proceedings of the 2014 22nd International Conference on Software, Telecommunications and Computer Networks, Split, Croatia, 17–19 September 2014; pp. 104–110. [Google Scholar]
- Mirshahi, S.; Uysal, S.; Akbari, A. Integration of RFID and WSN for supply chain intelligence system. In Proceedings of the 2013 International Conference on Electronics, Computers and Artificial Intelligence, Pitesti, Romania, 27–29 June 2013; pp. 1–6. [Google Scholar]
- Amin, E.M.; Saha, J.K.; Karmakar, N.C. Smart Sensing Materials for Low-Cost Chipless RFID Sensor. IEEE Sens. J. 2014, 14, 2198–2207. [Google Scholar] [CrossRef]
- Donno, D.D.; Catarinucci, L.; Tarricone, L. RAMSES: RFID Augmented Module for Smart Environmental Sensing. IEEE Trans. Instrum. Meas. 2014, 63, 1701–1708. [Google Scholar] [CrossRef]
- Zhou, S.; Sheng, W.; Deng, F.; Wu, X.; Fu, Z. A Novel Passive Wireless Sensing Method for Concrete Chloride Ion Concentration Monitoring. Sensors 2017, 17, 2871. [Google Scholar] [CrossRef] [PubMed]
- Wang, J.; He, Q. Wavelet packet envelope manifold for fault diagnosis of rolling element bearings. IEEE Trans. Instrum. Meas. 2016, 65, 2515–2526. [Google Scholar] [CrossRef]
- He, Q.; Song, H.; Ding, X. Sparse signal reconstruction based on time–frequency manifold for rolling element bearing fault signature enhancement. IEEE Trans. Instrum. Meas. 2016, 65, 482–491. [Google Scholar] [CrossRef]
- Ren, L.; Lv, W.; Jiang, S.; Xiao, Y. Fault diagnosis using a joint model based on sparse representation and SVM. IEEE Trans. Instrum. Meas. 2016, 65, 2313–2320. [Google Scholar] [CrossRef]
- Wang, Y.; Wang, X.; Liu, W. Unsupervised local deep feature for image recognition. Inf. Sci. 2016, 351, 67–75. [Google Scholar] [CrossRef]
- Zhan, S.; Tao, Q.-Q.; Li, X.-H. Face detection using representation learning. Neurocomputing 2016, 187, 19–26. [Google Scholar] [CrossRef]
- Siniscalchi, S.M.; Yu, D.; Deng, L.; Lee, C.-H. Exploiting deep neural networks for detection-based speech recognition. Neurocomputing 2013, 106, 148–157. [Google Scholar] [CrossRef]
- Jiang, G.; He, H.; Xie, P.; Tang, Y. Stacked Multilevel-Denoising Autoencoders: A New Representation Learning Approach for Wind Turbine Gearbox Fault Diagnosis. IEEE Trans. Instrum. Meas. 2017, 99, 1–12. [Google Scholar] [CrossRef]
- Hu, Y.; Zhao, H.F.; Wang, Z.G. Sign Language Fingerspelling Recognition Using Depth Information and Deep Belief Networks. Int. J. Pattern Recognit. Artif. Intell. 2018, 32, 1850018. [Google Scholar] [CrossRef]
- Jing, L.; Zhao, M.; Li, P.; Xu, X. A convolutional neural network based feature learning and fault diagnosis method for the condition monitoring of gearbox. Measurement 2017, 111, 1–10. [Google Scholar] [CrossRef]
- Cha, Y.J.; Choi, W.; Büyüköztürk, O. Deep Learning-Based Crack Damage Detection Using Convolutional Neural Networks. Comput. Aided Civil Infrastr. Eng. 2017, 32, 361–378. [Google Scholar] [CrossRef]
- EPCglobal Inc. EPC Radio-Frequency Identity Protocols Generation-2 UHF RFID. 2008. Available online: https://www.gs1.org/sites/default/files/docs/epc/Gen2_Protocol_Standard.pdf (accessed on 12 May 2018).
- Liu, B.H.; Nguyen, N.T.; Pham, V.T.; Yeh, Y.H. A Maximum-Weight-Independent-Set-Based Algorithm for Reader-Coverage Collision Avoidance Arrangement in RFID Networks. IEEE Sens. J. 2016, 16, 1342–1350. [Google Scholar] [CrossRef]
- Nguyen, N.T.; Liu, B.H.; Pham, V.T. A dynamic-range-based algorithm for reader-tag collision avoidance deployment in RFID networks. In Proceedings of the 2016 International Conference on Electronics, Information, and Communications, Da Nang, Vietnam, 27–30 January 2016; pp. 1–4. [Google Scholar]
- Gu, B.; Sheng, V.S.; Tay, K.Y.; Romano, W.; Li, S. Incremental Support Vector Learning for Ordinal Regression. IEEE Trans. Neural Netw. Learn. Syst. 2015, 26, 1403. [Google Scholar] [CrossRef] [PubMed]
- Gu, B.; Sheng, V.S. A Robust Regularization Path Algorithm for ν-Support Vector Classification. IEEE Trans. Neural Netw. Learn. Syst. 2016, 99, 1–8. [Google Scholar] [CrossRef] [PubMed]
- Wang, T.; He, Y.; Luo, Q.; Deng, F.; Zhang, C. Self-Powered RFID Sensor Tag for Fault Diagnosis and Prognosis of Transformer Winding. IEEE Sens. J. 2017, 17, 6418–6430. [Google Scholar] [CrossRef]
Figure 1.
Schematic diagram of radio frequency communication.
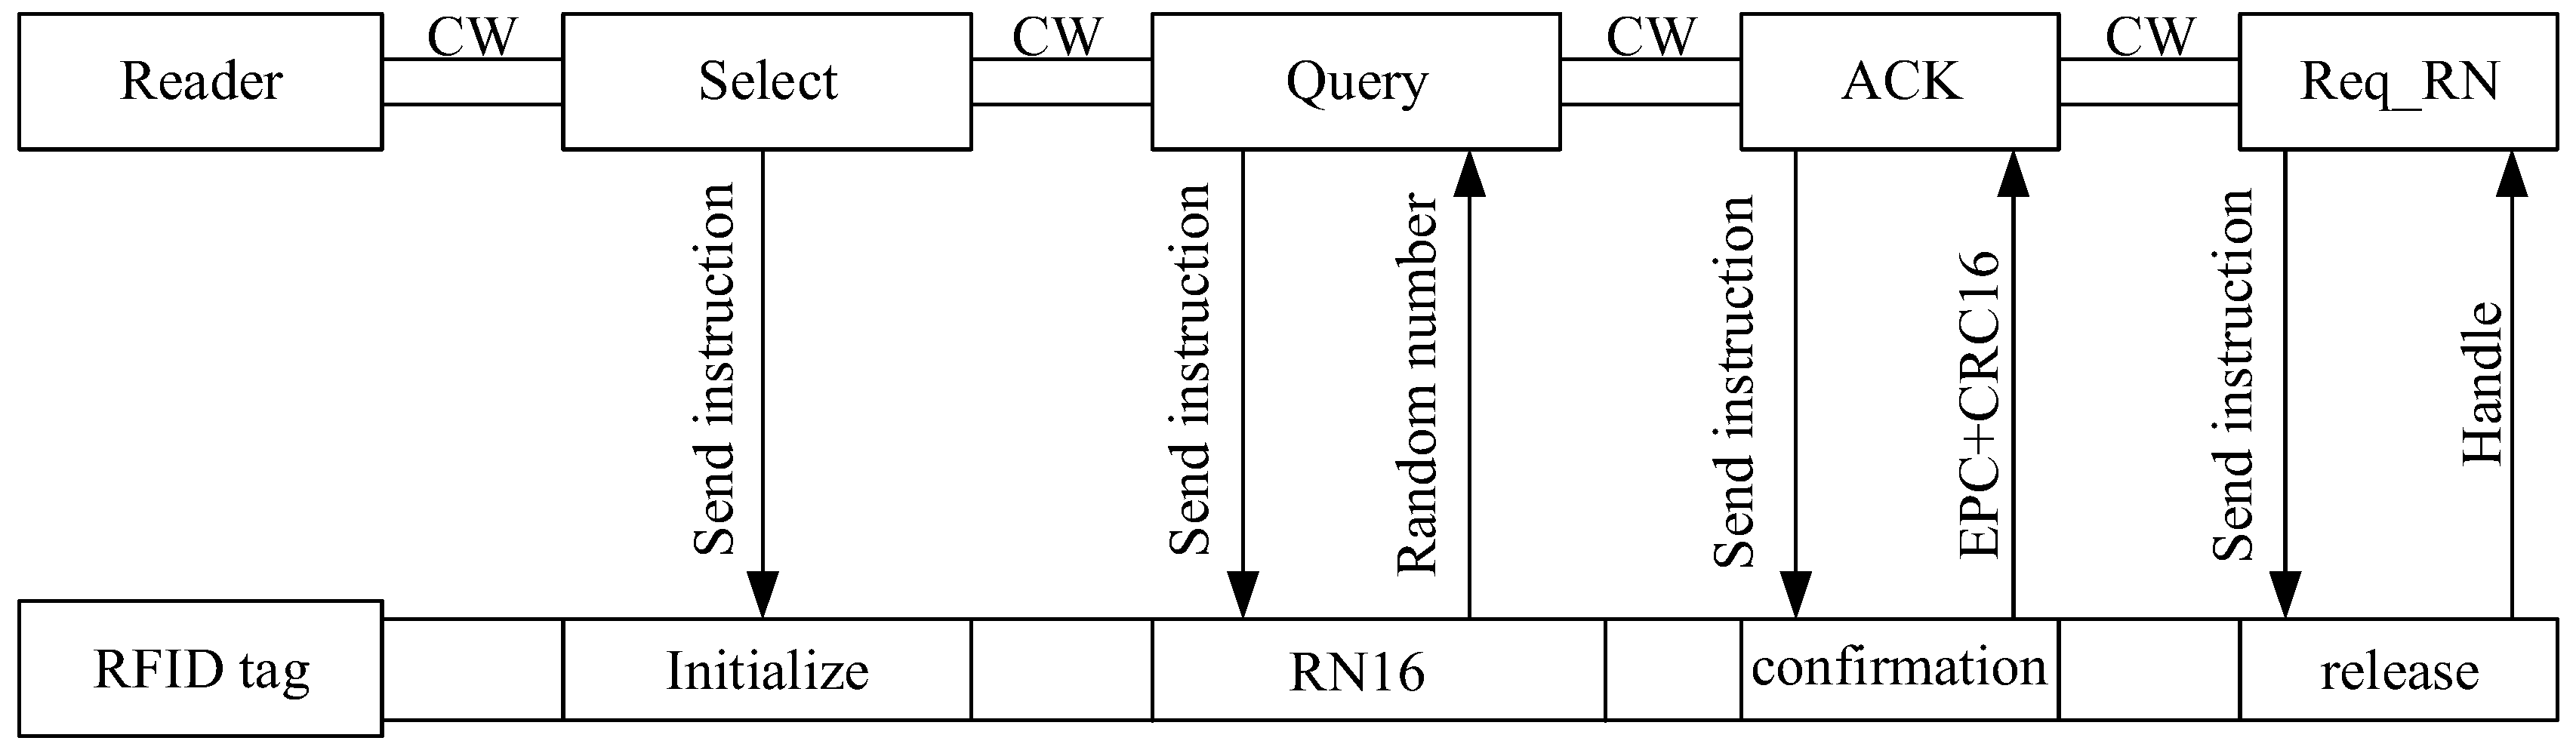
Figure 2.
Comparison of sensor data storage method; (a) traditional method; (b) proposed method.
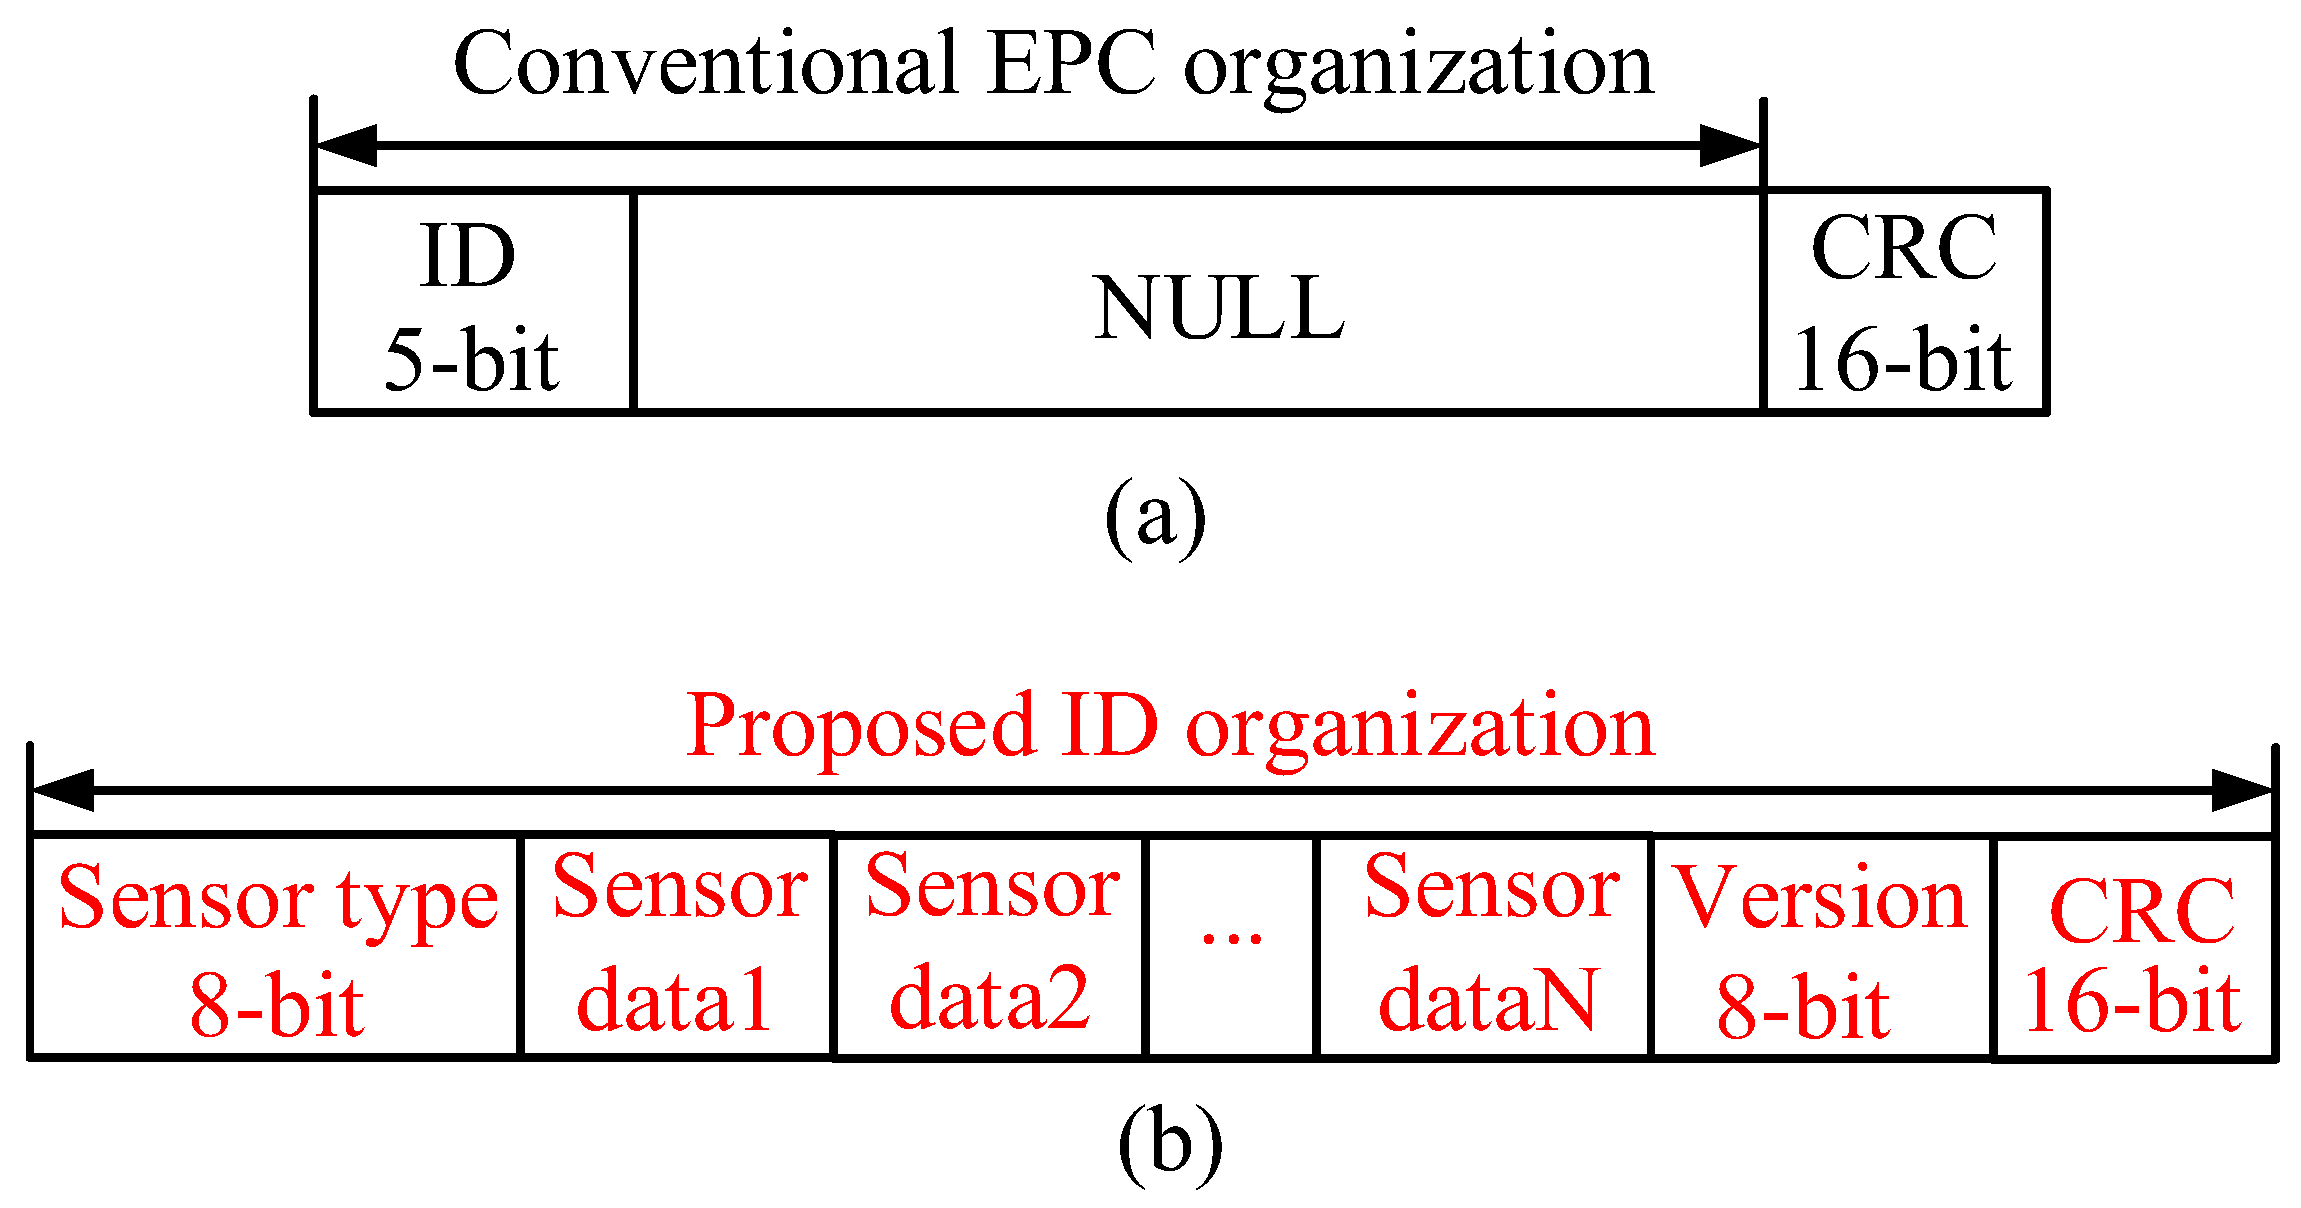
Figure 3.
Proposed radio frequency identification (RFID) sensor tag: (a) architecture of the RFID sensor tag; (b) proposed four-stage rectifier.
Figure 3.
Proposed radio frequency identification (RFID) sensor tag: (a) architecture of the RFID sensor tag; (b) proposed four-stage rectifier.
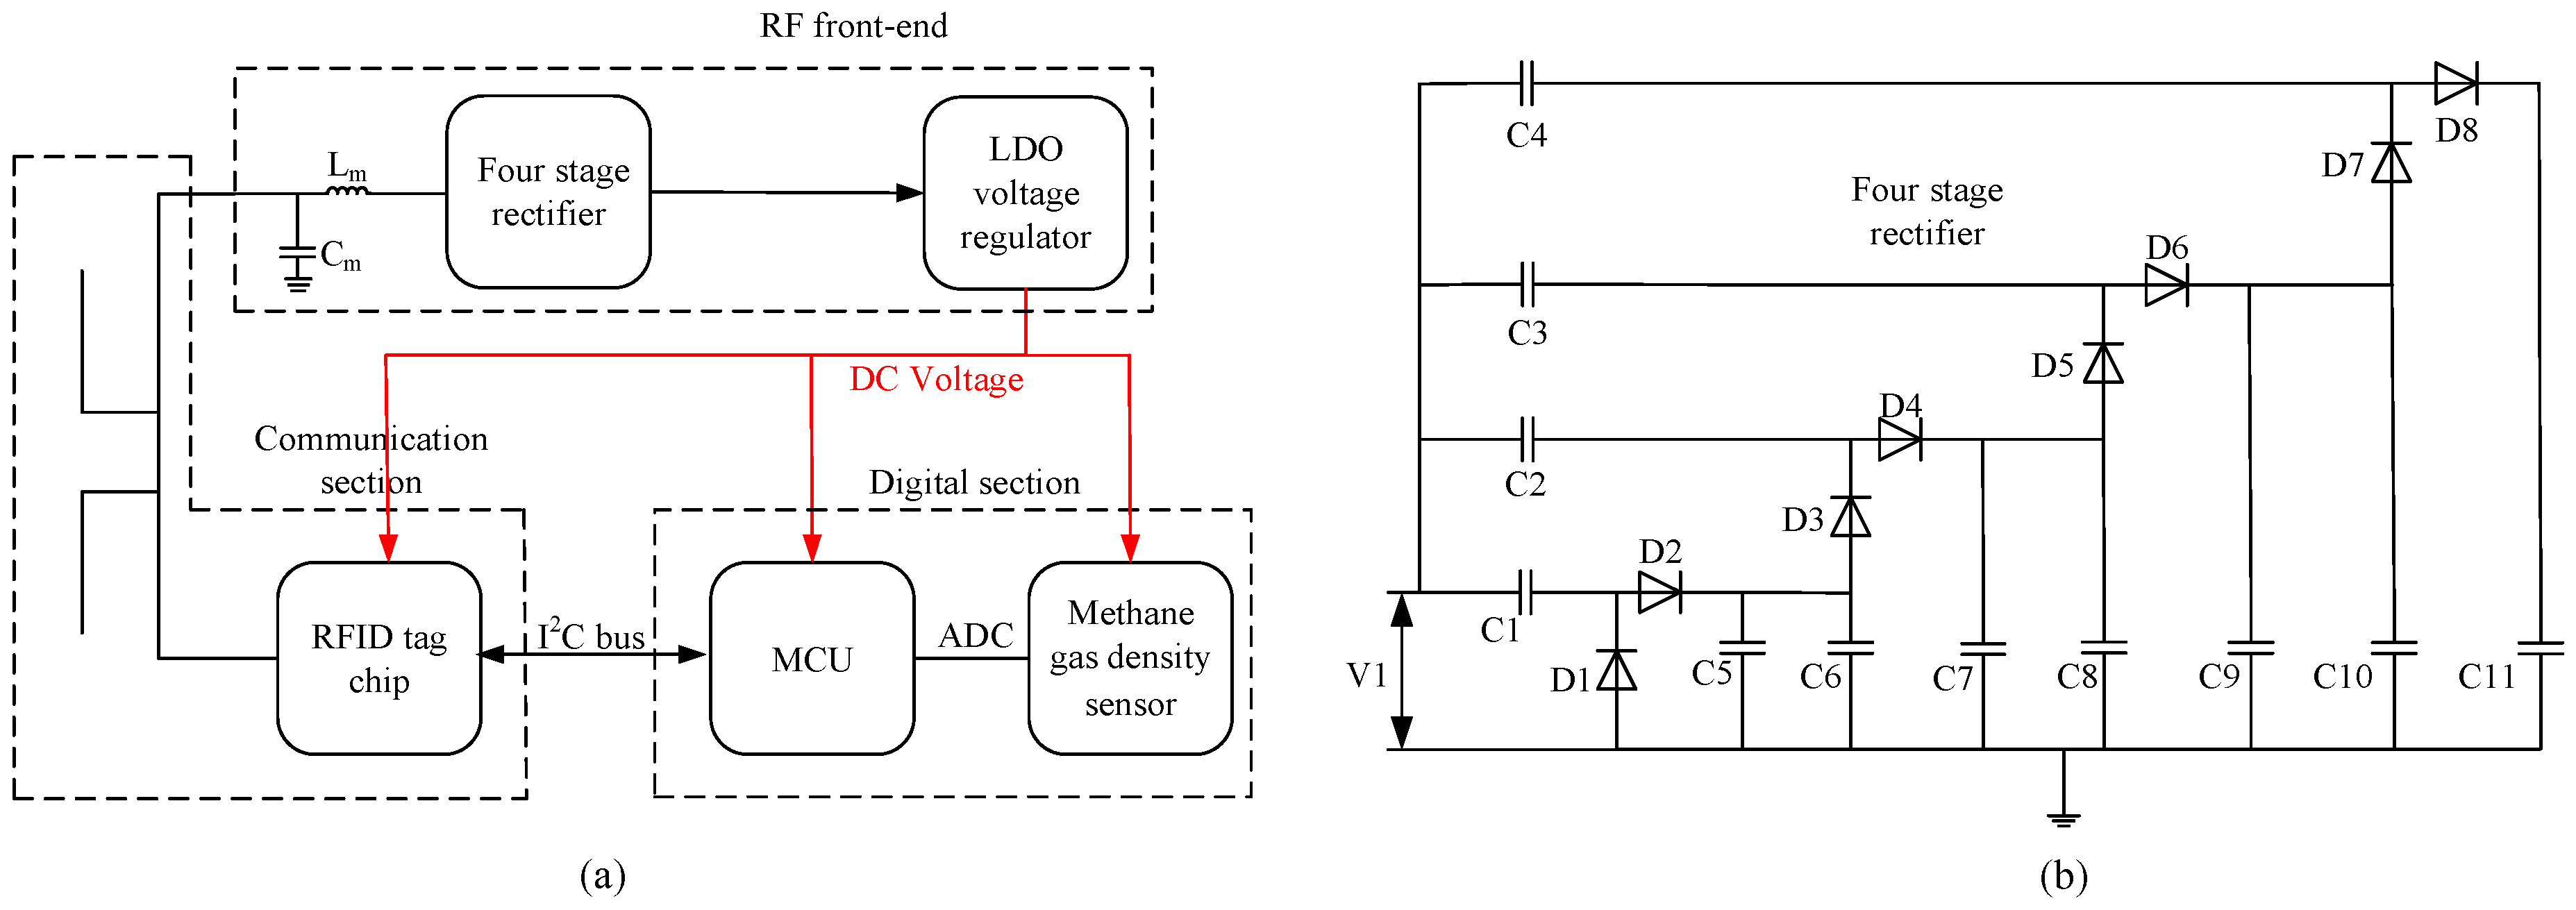
Figure 4.
The introduced four-stage rectifier.
Figure 5.
The whole procedure of monitoring and predicting the methane gas density.
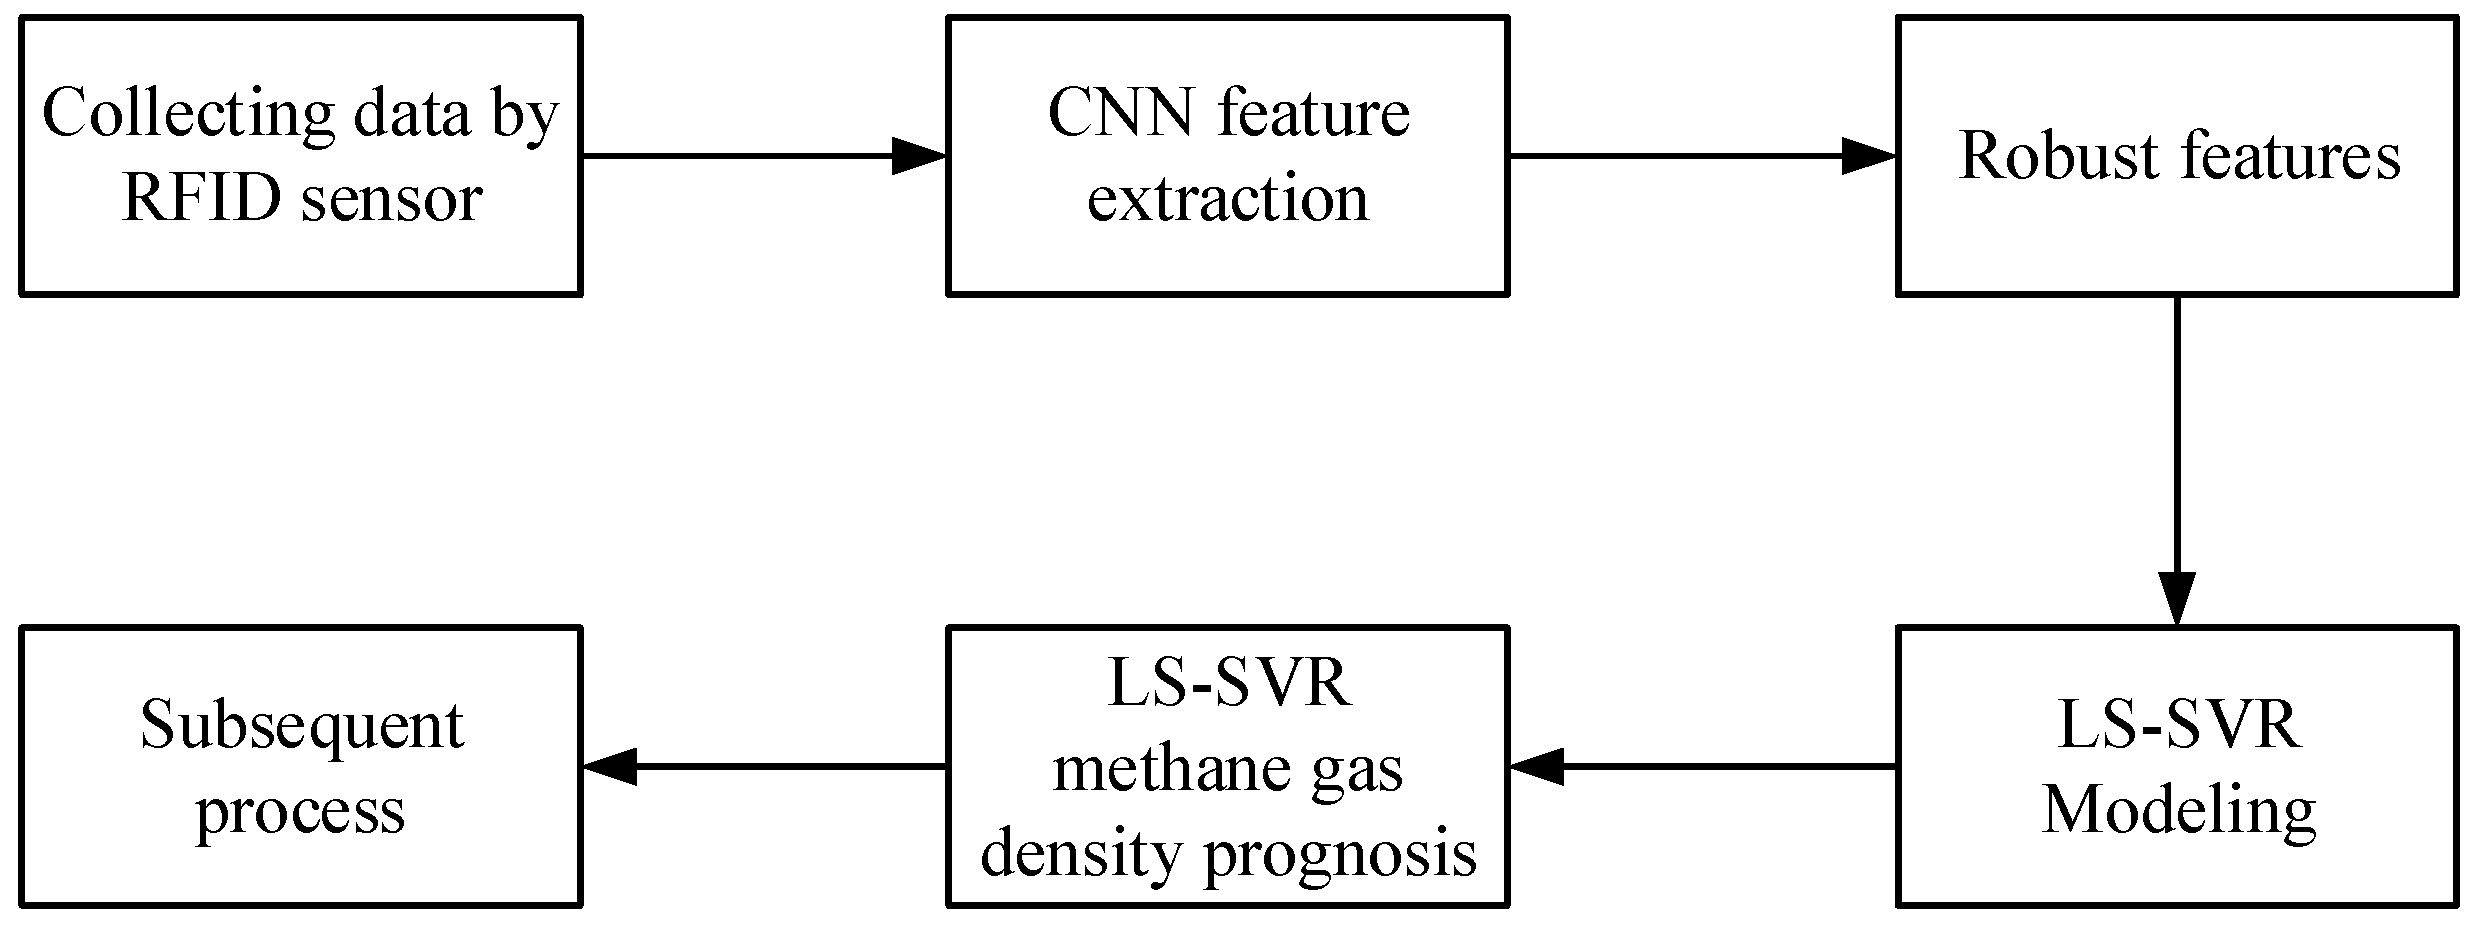
Figure 6.
Basic structure of the convolution neural network.
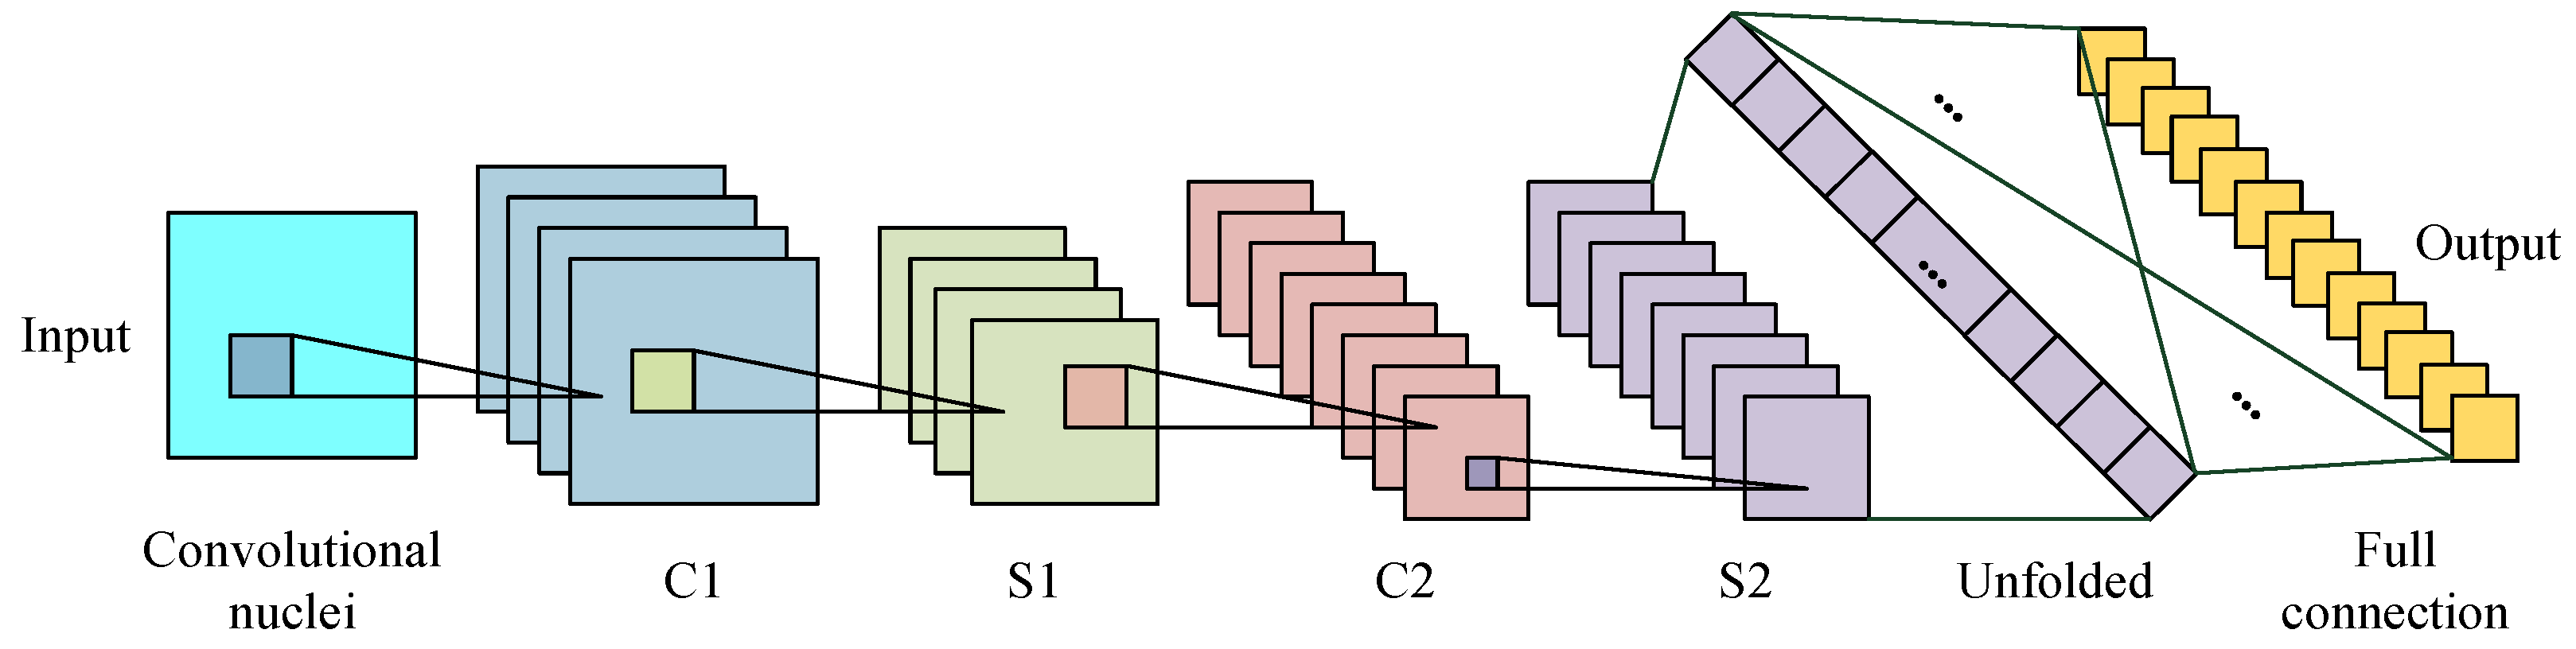
Figure 7.
Schematic diagram of the convolution and pooling process: (a) convolutional process schematic; (b) pooling process schematic.
Figure 7.
Schematic diagram of the convolution and pooling process: (a) convolutional process schematic; (b) pooling process schematic.
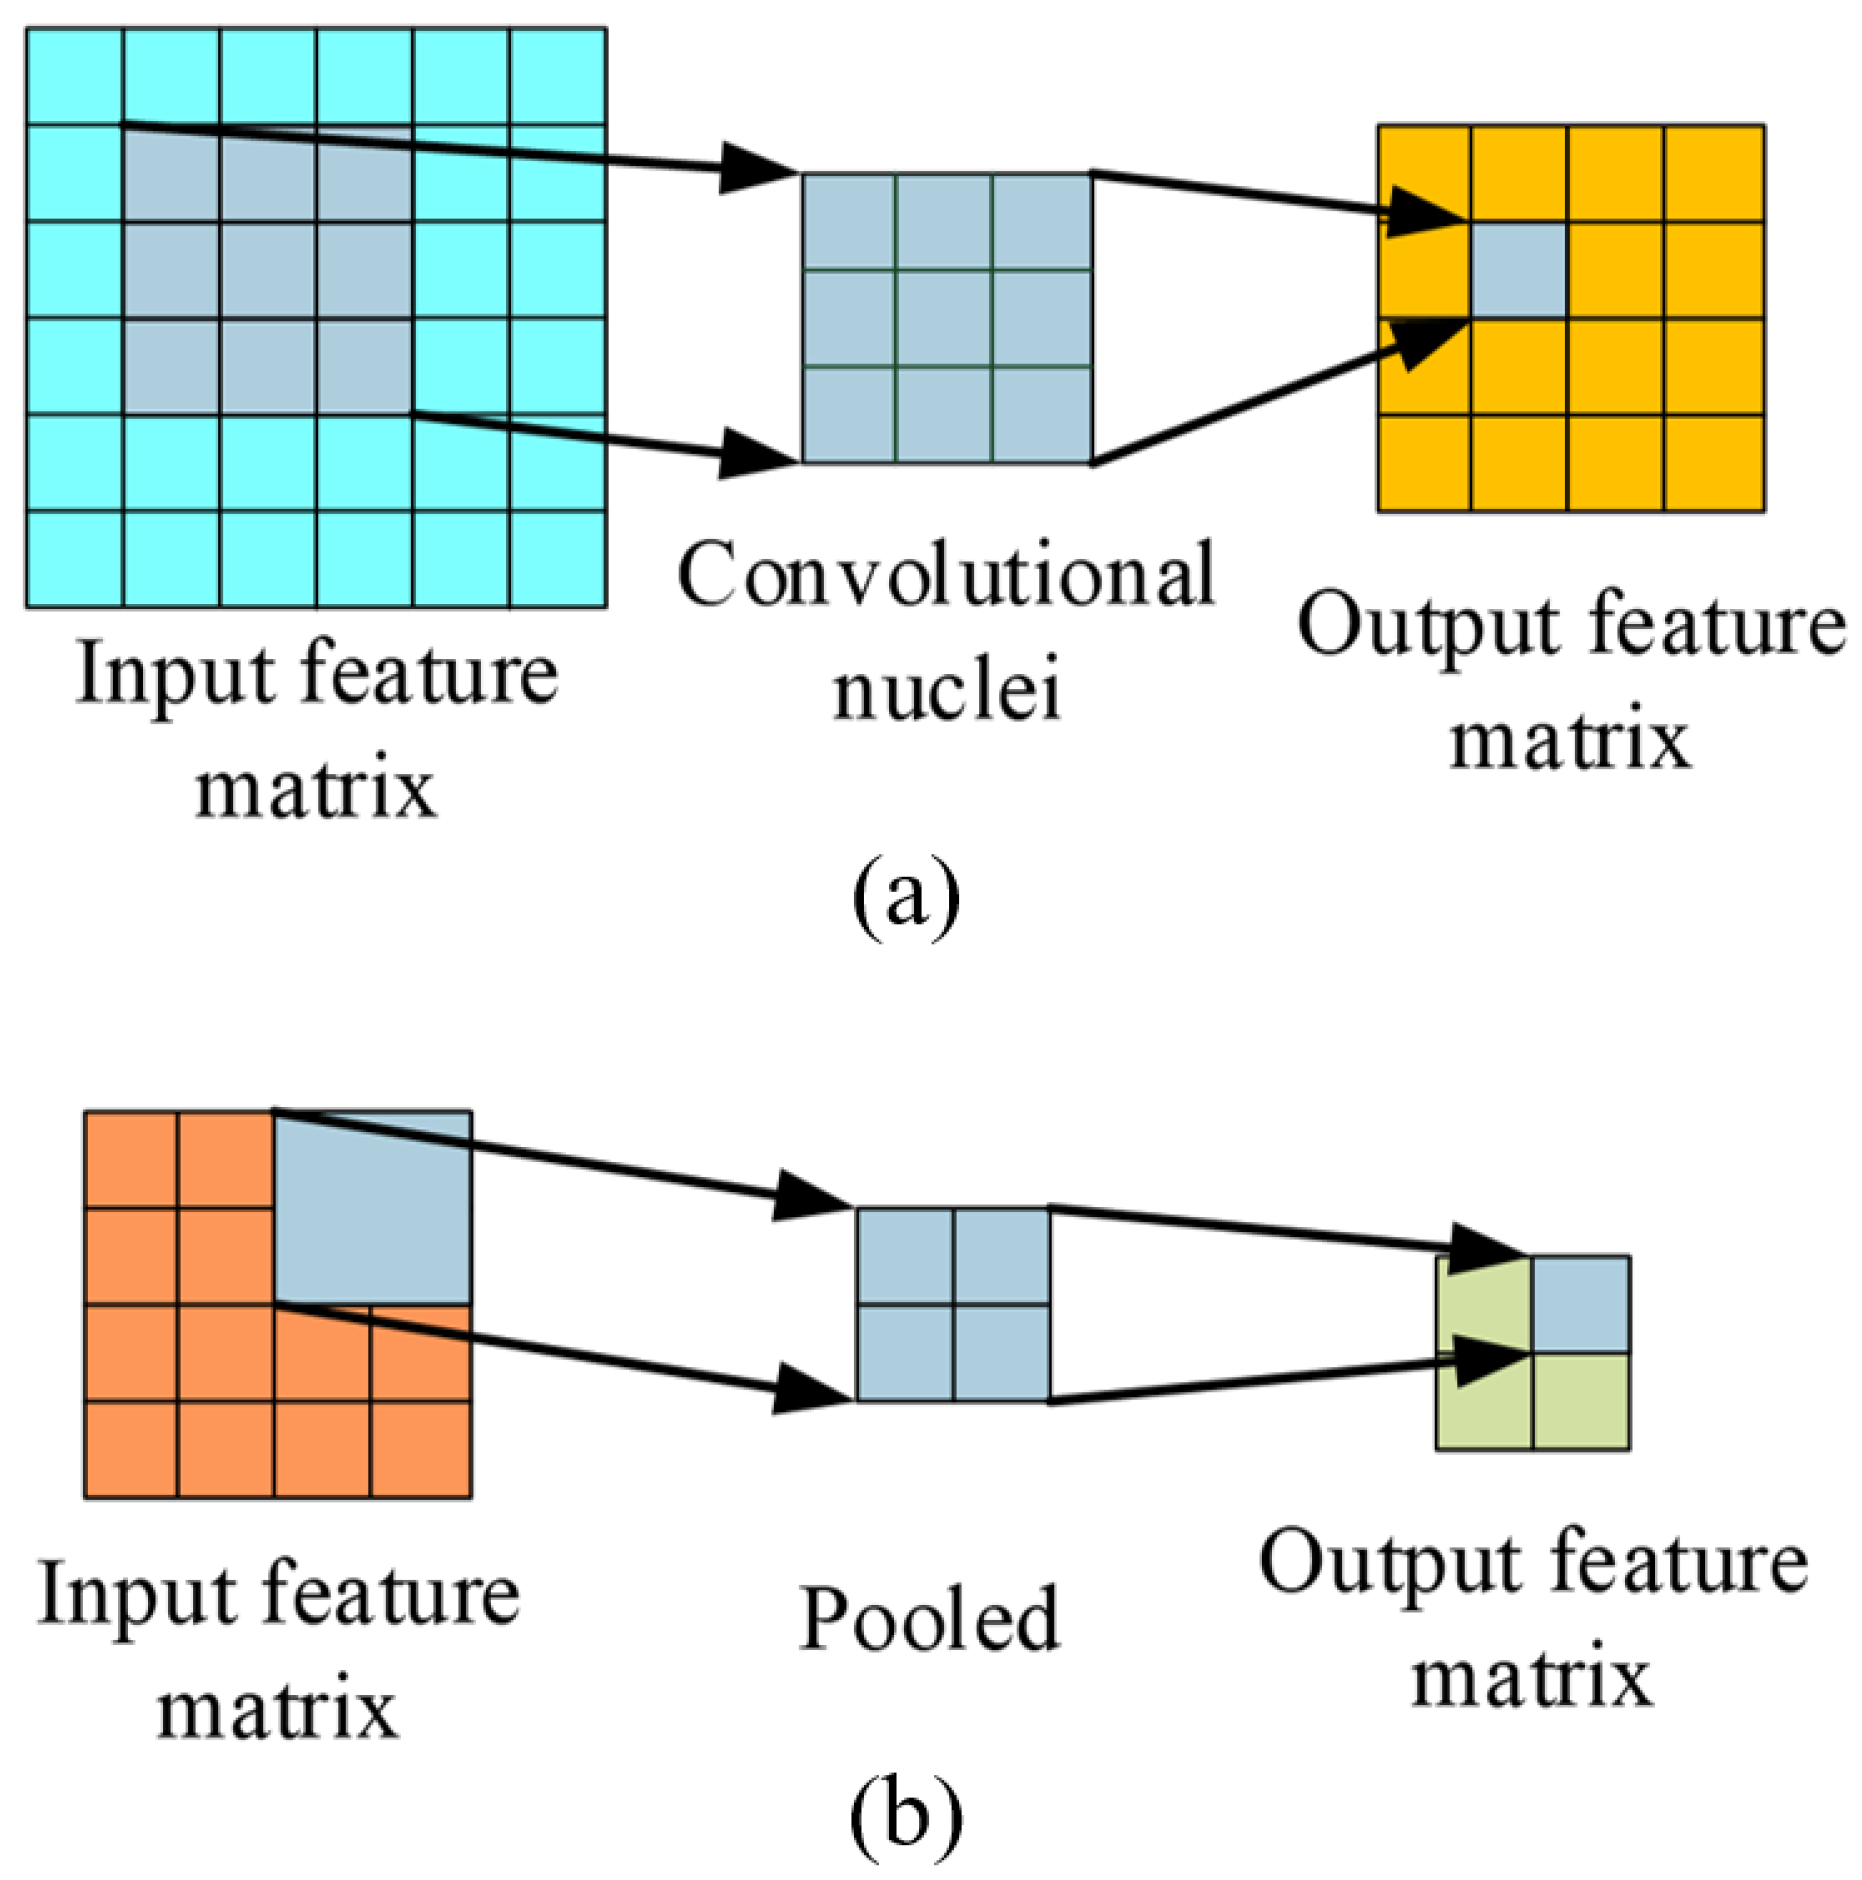
Figure 8.
Comparison of the power consumption under two different sensor data storage mechanisms.
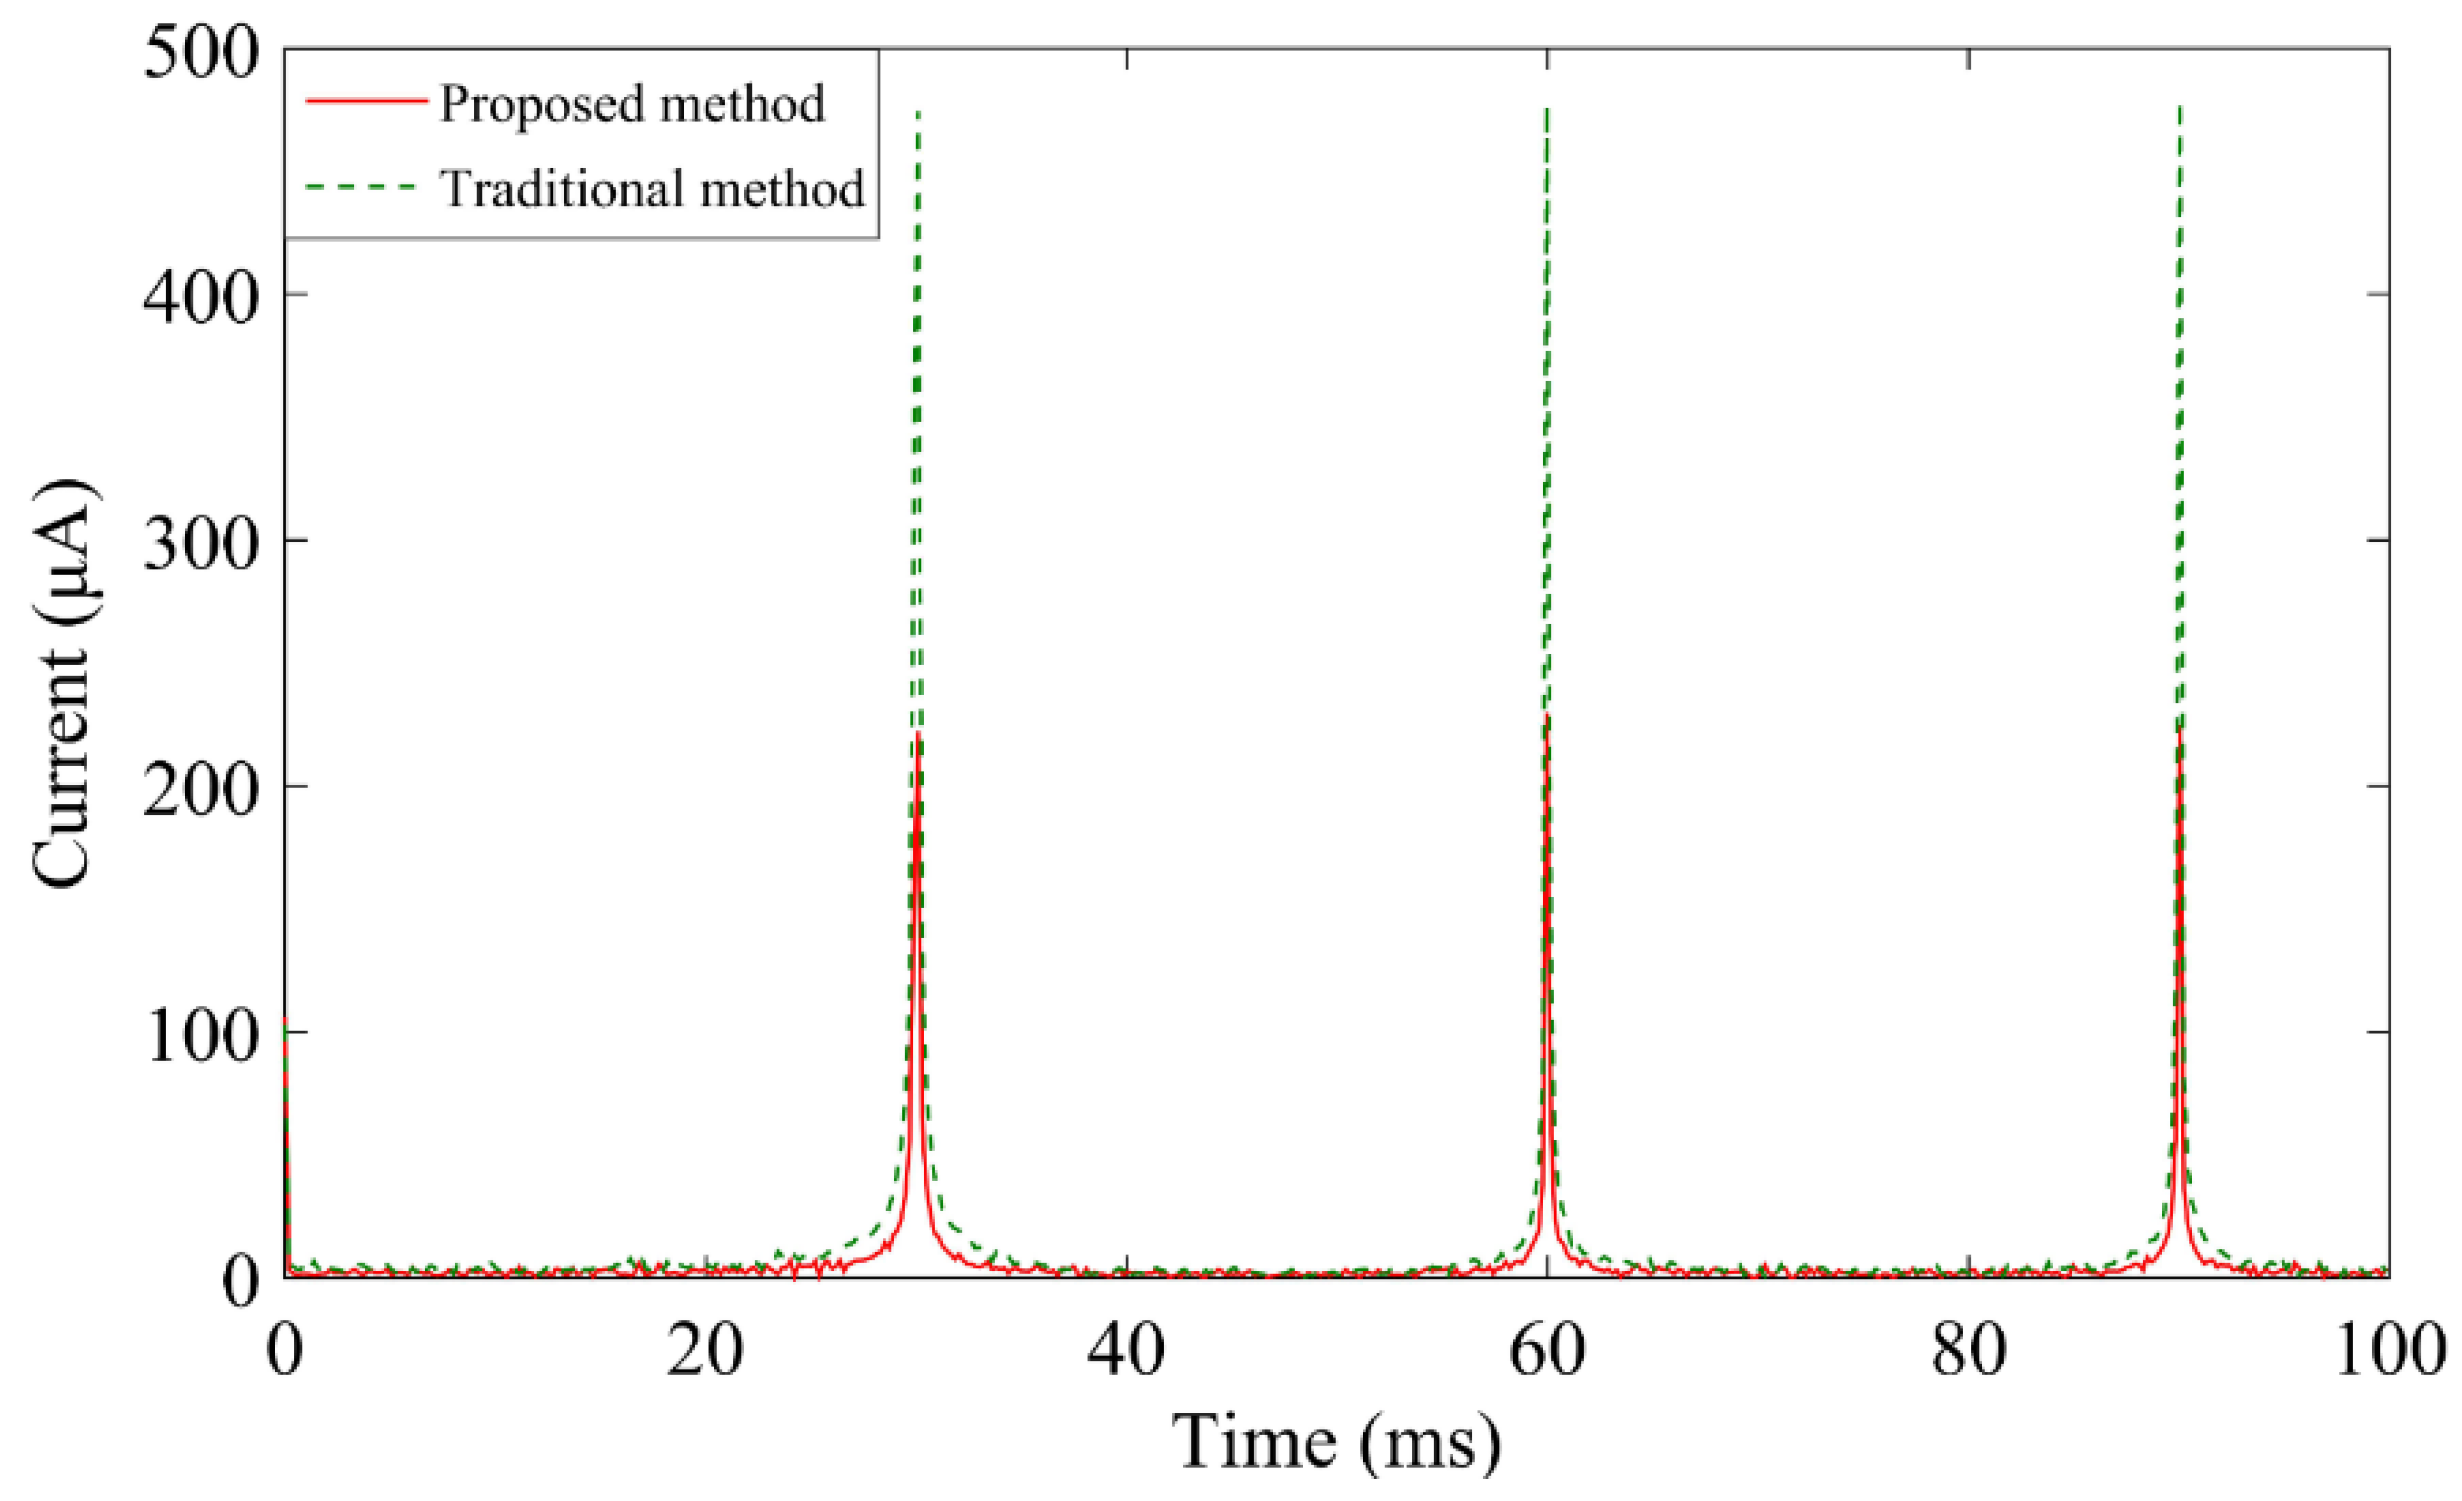
Figure 9.
(a) Received signal strength indication (RSSI) measurement environment; (b) measurement results.
Figure 9.
(a) Received signal strength indication (RSSI) measurement environment; (b) measurement results.
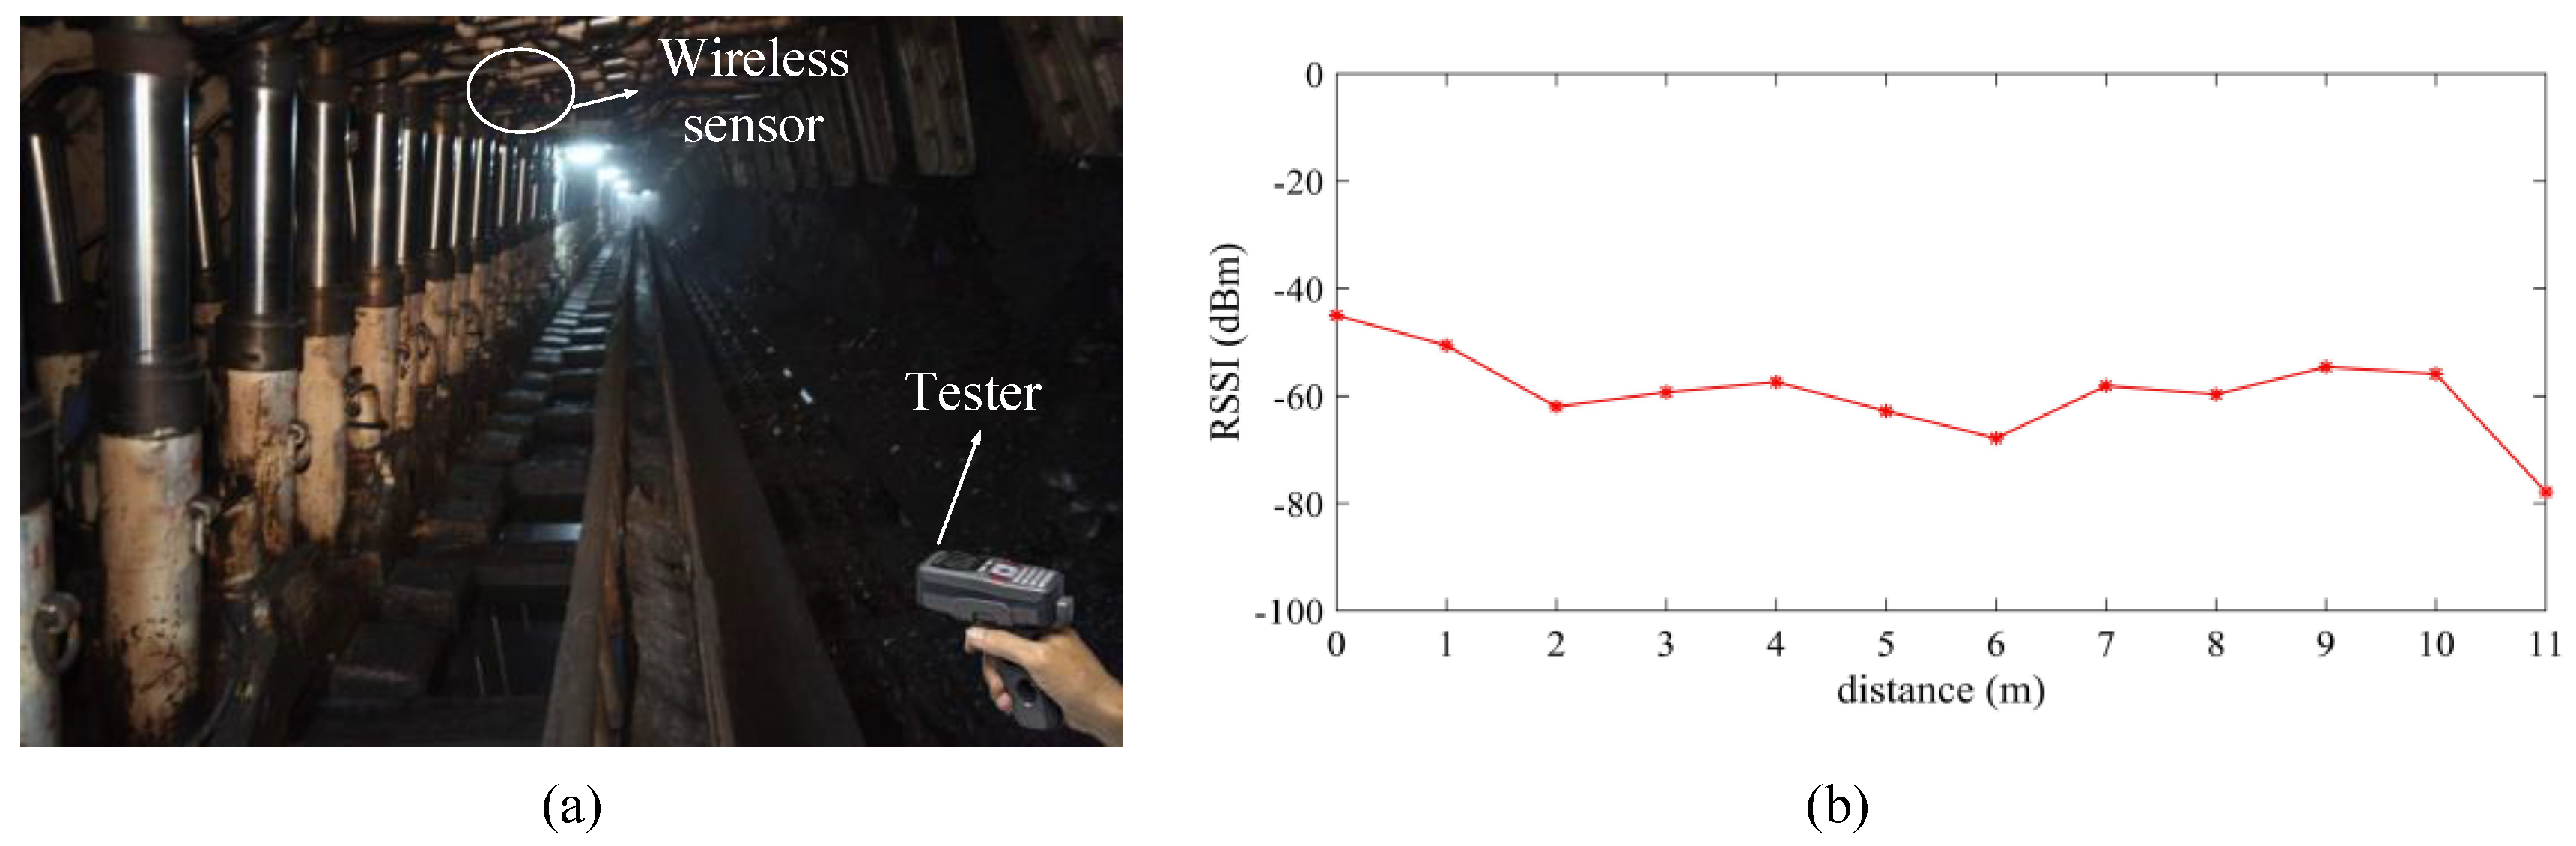
Figure 10.
(a) Measured signal to noise ratio (SNR) under different distances; (b) measured bit error rate (BER) under different SNRs.
Figure 10.
(a) Measured signal to noise ratio (SNR) under different distances; (b) measured bit error rate (BER) under different SNRs.

Figure 11.
Comparison of measured results and predicted results.

Figure 12.
Prediction error of least squares support vector regression (LS-SVR).

Table 1.
Time delay comparison.
| Method | Data Location | Operation | Time (ms) |
|---|---|---|---|
| Traditional | NVM | Inventory and Read | 7.45 ± 3.92 |
| Proposed | ID | Inventory | 22.13 ± 3.31 |
Table 2.
Performances comparison of different wireless sensors.
| Reported Method | Cost | Memory | Function | Range (m) | Accuracy |
|---|---|---|---|---|---|
| [8] | high | methane gas density | monitoring | / | high |
| [9] | high | methane gas density | monitoring | / | medium |
| [15] | high | methane gas density | monitoring | / | high |
| This work | low | methane gas density and ID message | monitoring and predicting | 17 | high |
© 2018 by the authors. Licensee MDPI, Basel, Switzerland. This article is an open access article distributed under the terms and conditions of the Creative Commons Attribution (CC BY) license (http://creativecommons.org/licenses/by/4.0/).
Share and Cite
MDPI and ACS Style
Zhang, C.; Fu, Y.; Deng, F.; Wei, B.; Wu, X. Methane Gas Density Monitoring and Predicting Based on RFID Sensor Tag and CNN Algorithm. Electronics 2018, 7, 69. https://doi.org/10.3390/electronics7050069
AMA Style
Zhang C, Fu Y, Deng F, Wei B, Wu X. Methane Gas Density Monitoring and Predicting Based on RFID Sensor Tag and CNN Algorithm. Electronics. 2018; 7(5):69. https://doi.org/10.3390/electronics7050069
Chicago/Turabian StyleZhang, Chunlei, Yuhua Fu, Fangming Deng, Baoquan Wei, and Xiang Wu. 2018. "Methane Gas Density Monitoring and Predicting Based on RFID Sensor Tag and CNN Algorithm" Electronics 7, no. 5: 69. https://doi.org/10.3390/electronics7050069
Note that from the first issue of 2016, this journal uses article numbers instead of page numbers. See further details here.