A Performance Study of Massive MIMO Heterogeneous Networks with Ricean/Rayleigh Fading


School of Electronics and Information Engineering, Northwestern Polytechnical University, Xi’an 710072, China
*
Author to whom correspondence should be addressed.
Electronics 2018, 7(6), 79; https://doi.org/10.3390/electronics7060079
Submission received: 2 May 2018
/
Revised: 18 May 2018
/
Accepted: 18 May 2018
/
Published: 23 May 2018
Abstract
:Massive multiple-input and multiple-out (massive MIMO) systems and heterogeneous networks (HetNet) are envisioned to meet the new performance objectives of evolving networks. Now, the main challenge of massive MIMO with HetNet in two-tier networks is how to alleviate interference generated by the randomly deployed femtocells to the macro cells. In this paper, we investigate massive MIMO with HetNet, where the intended macro base station (MBS) transmission follows Ricean fading and interfering femto BS transmissions follow Rayleigh fading. Then, by exploiting matrix and stochastic geometric tools, we derive tight approximations for the intended signal power and aggregated interfering power signal. And derive the signal-to-interference (SIR) with the convolution of the two power signals. Then, we obtain the performance objectives: coverage and outage probabilities, and area spectral efficiency. Further, to reduce the cell edge effects and improve the SIR, we study the role of massive MIMO beamforming coordination with the high-powered MBSs. Thus, we develop maxi-min optimization to control the MBS transmit power. Numerical results show that the coverage and outage performance converge for different user locations, pathloss and Ricean factor. The monotonic increase in Ricean factor improves the SIR of a user located within coverage region. Optimal values of macro BS antenna and transmit power guarantee rate-fairness between the coordinating MBSs, and avoid strong Ricean channel correlation. Also, the performance gain is dependent on the user location, but independent of the cell size.
1. Introduction
The next generation wireless networks are to support the growing demands for high data rate especially over the coverage area; these require efficient network modeling and design. Traditionally, cellular networks assume hexagonal, circular and square shape topologies, with the base station (BS) at the center of the cell. Recent network design in urban and suburban areas require random clustering [1]; this has necessitated the redesigning of the traditional cellular networks.
A wireless network is heterogeneous, such that the small cells are offloading the macrocell, thereby improving the cell-center, cell-edge and indoor performance. The HetNets are envisioned to provide the solution with fast, flexible, cost efficient, fine tuned design and network expansion for the traditional cellular network architecture [2]. The base stations (BSs) in HetNets are characterized by the transmit power: different low-power BSs (Pico, Femto Access Points, micro) in addition with traditional high-power MBS to meliorate the coverage. The tiers consisting of BSs are ordered with the transmit power such that the served tier provides the highest signal power [3,4]. Thus, the tier’s BSs transmit power, fading, path loss and resource allocation. Consequently, the neighboring tier’s BSs generate severe interference which is a limiting factor for the signal-to-interference (SIR) in achieving the network throughput [5,6]. This requires new approach to reduce the interference.
1.1. Related Works
Massive MIMO with HetNet takes into account the placement of BSs, user terminals and propagation model (In practical perspective, occurrence of random fading due to scattering and LoS signals depend on the environmental factors such as distance, geographical structure and clutter). Recently, Random matrix theory and stochastic geometry are used to study the SIR distribution and the performance gain of massive MIMO HetNet systems [7,8]. But the coexistence of the multiple and different BSs generate interference signals. User-centric analysis of the interference with massive MIMO HetNet is comprehensively discussed in [5,6,9,10], where the SINR is modeled over the locations of the users, BSs and characterized by multi-path fading. Incorporating multi-path fading into the point process model [11], the path loss with the fading can be geometrically characterized, then the coverage performance is conditioned on the user locations [12]. The trade-off between the link reliability and area spectral efficiency (ASE) in multiuser MIMO HetNet is discussed in [10], this primarily requires efficient analysis of the channel fading.
Then, performance of massive MIMO HetNet can be analyzed in the uncorrelated Rayleigh channel and uncorrelated Ricean MIMO channel. In [13,14], massive MIMO HetNet have been studied for uplink and downlink deployment, respectively, under Rayleigh channel fading. Also, the average rate performance over generalized fading channels are analyzed in [15,16], where desired and interfering signals are separately derived with different fading models such as Rayleigh and Nakagami fading. And in [3,13], the channels are modeled with Rayleigh fading, these works analyzed both the desired and interfering signals of the downlink SINR with Rayleigh fading model. But the assumption that all the channel fading are dominated with non line of sight (NLoS) transmissions is practically unrealistic. Therefore, the authors in [17,18] studied the general performance gain with the path loss of the LoS and NLoS signal. Then, massive MIMO channel can propagate jointly with both NLoS and LoS channel, where the phases and power are combined, thus, the mean power determines the Ricean channel gain. An analytical approach for evaluating the coverage probability of HetNet with the desired propagation signals modeled with Ricean fading and interfering propagation signals modeled with Rayleigh fading, has recently been introduced in [19]. This is due to the fact that the signal strength deteriorates at the cell edge as propagation enters the shadowed region, where dominate LoS is difficult to exist. As such, the interfering signals at the location of a typical user are dominated with scattering signals [1]. Consequently, owing to the complexity in analyzing Ricean distribution, especially the difficulty in approximating the Bessel function, the majority of present contributions in literature [9,10,14,15,16,20,21] have focused on Rayleigh distribution for the coverage and outage probabilities. In [19], the authors analyzed coverage probability with Ricean and Rayleigh distributions for desired and interfering signals, respectively, while the authors in [22,23] investigated the performance Device-to-Device under-laid network and determined the effect of the channel propagation parameters of the Ricean Channel.
However, for MBSs equipped with multiple antennas, precoding and beamforming can be exploited, and thus, support multiplexing gain, diversity gain, and interference avoidance and Reduction. With massive MIMO Beamforming, the transmitted signal energy can be directed toward the intended user in order to avoid and reduce interference to other users. Such that the beam is set in a particular direction to avoid interference [24]. Through massive MIMO beamforming coordination, transmission power is controlled to maintain user-fairness in certain QoS threshold, this maximizes the overall SIR [25,26,27], and the BSs allocate the resources according to user selection criteria. Resource allocation in massive MIMO HetNet deployment involves bandwidth (frequency/time) management to mitigate interference, the user is allocated a portion of the spectrum in a sub-frame which indicates the entire spectrum in some time slots. Now, fractional frequency reuse (FFR) is designed to classify the scheduled users into the cell-center and cell-edge depending on the user-to-BS distance, thus accomplishes the power control, FFR is studied in [20,28]. All these related works under reasonable assumptions and objectives reduced the theoretical results to simple close-form expressions to satisfy the future wireless networks.
1.2. Problem Statement
Many works (in Table 1) have studied the performance of HetNet with Rayleigh fading, as it is easier to analyze the fading distribution. Realistically, mounting MBS antennas on high height for wider coverage, strong LoS and NLoS links can be realized, thus, the Ricean link is accomplished. Whereas the low-powered femto BSs have small coverage, and hence, generate strong scattering (interfering) signals within the macro cell coverage region. From [1,19], this work develops a HetNet model and analytically characterizes the SIR with Ricean and Rayleigh fading distributions. That is, we evaluate the SIR with the convolution of the desired signal (from MBS) with Ricean distribution and interfering signals (from femto BSs) with Rayleigh distribution. Also, a massive MIMO is considered for the channel fading modeling, this is a novel contribution in this work. Further, we propose transmit power control technique with the MBSs for the downlink beamforming coordination.
1.3. Contributions of the Paper
This work studies a downlink massive MIMO HetNet with two-tier Networks. Thus, below are major contributions:
- We use fading distributions to evaluate the intended signal with Ricean fading and interfering signals with Rayleigh fading
- We provide a tractable expression of the typical user SIR and evaluate the probability of coverage, outage probability and area spectral efficiency (ASE).
- To further improve on the location-dependent user’s QoS, we introduce the FFR scheme for interference coordination which is used to analyze cell-edge users performance. Then, to avoid spill-over of power by the high power MBSs, we investigate massive MIMO beamforming coordination among MBSs through power control.
- Finally, we obtain optimal values for MBS antenna, transmit power and Ricean factor that alleviate strong LoS channel correlation.
2. System Design
2.1. General Description
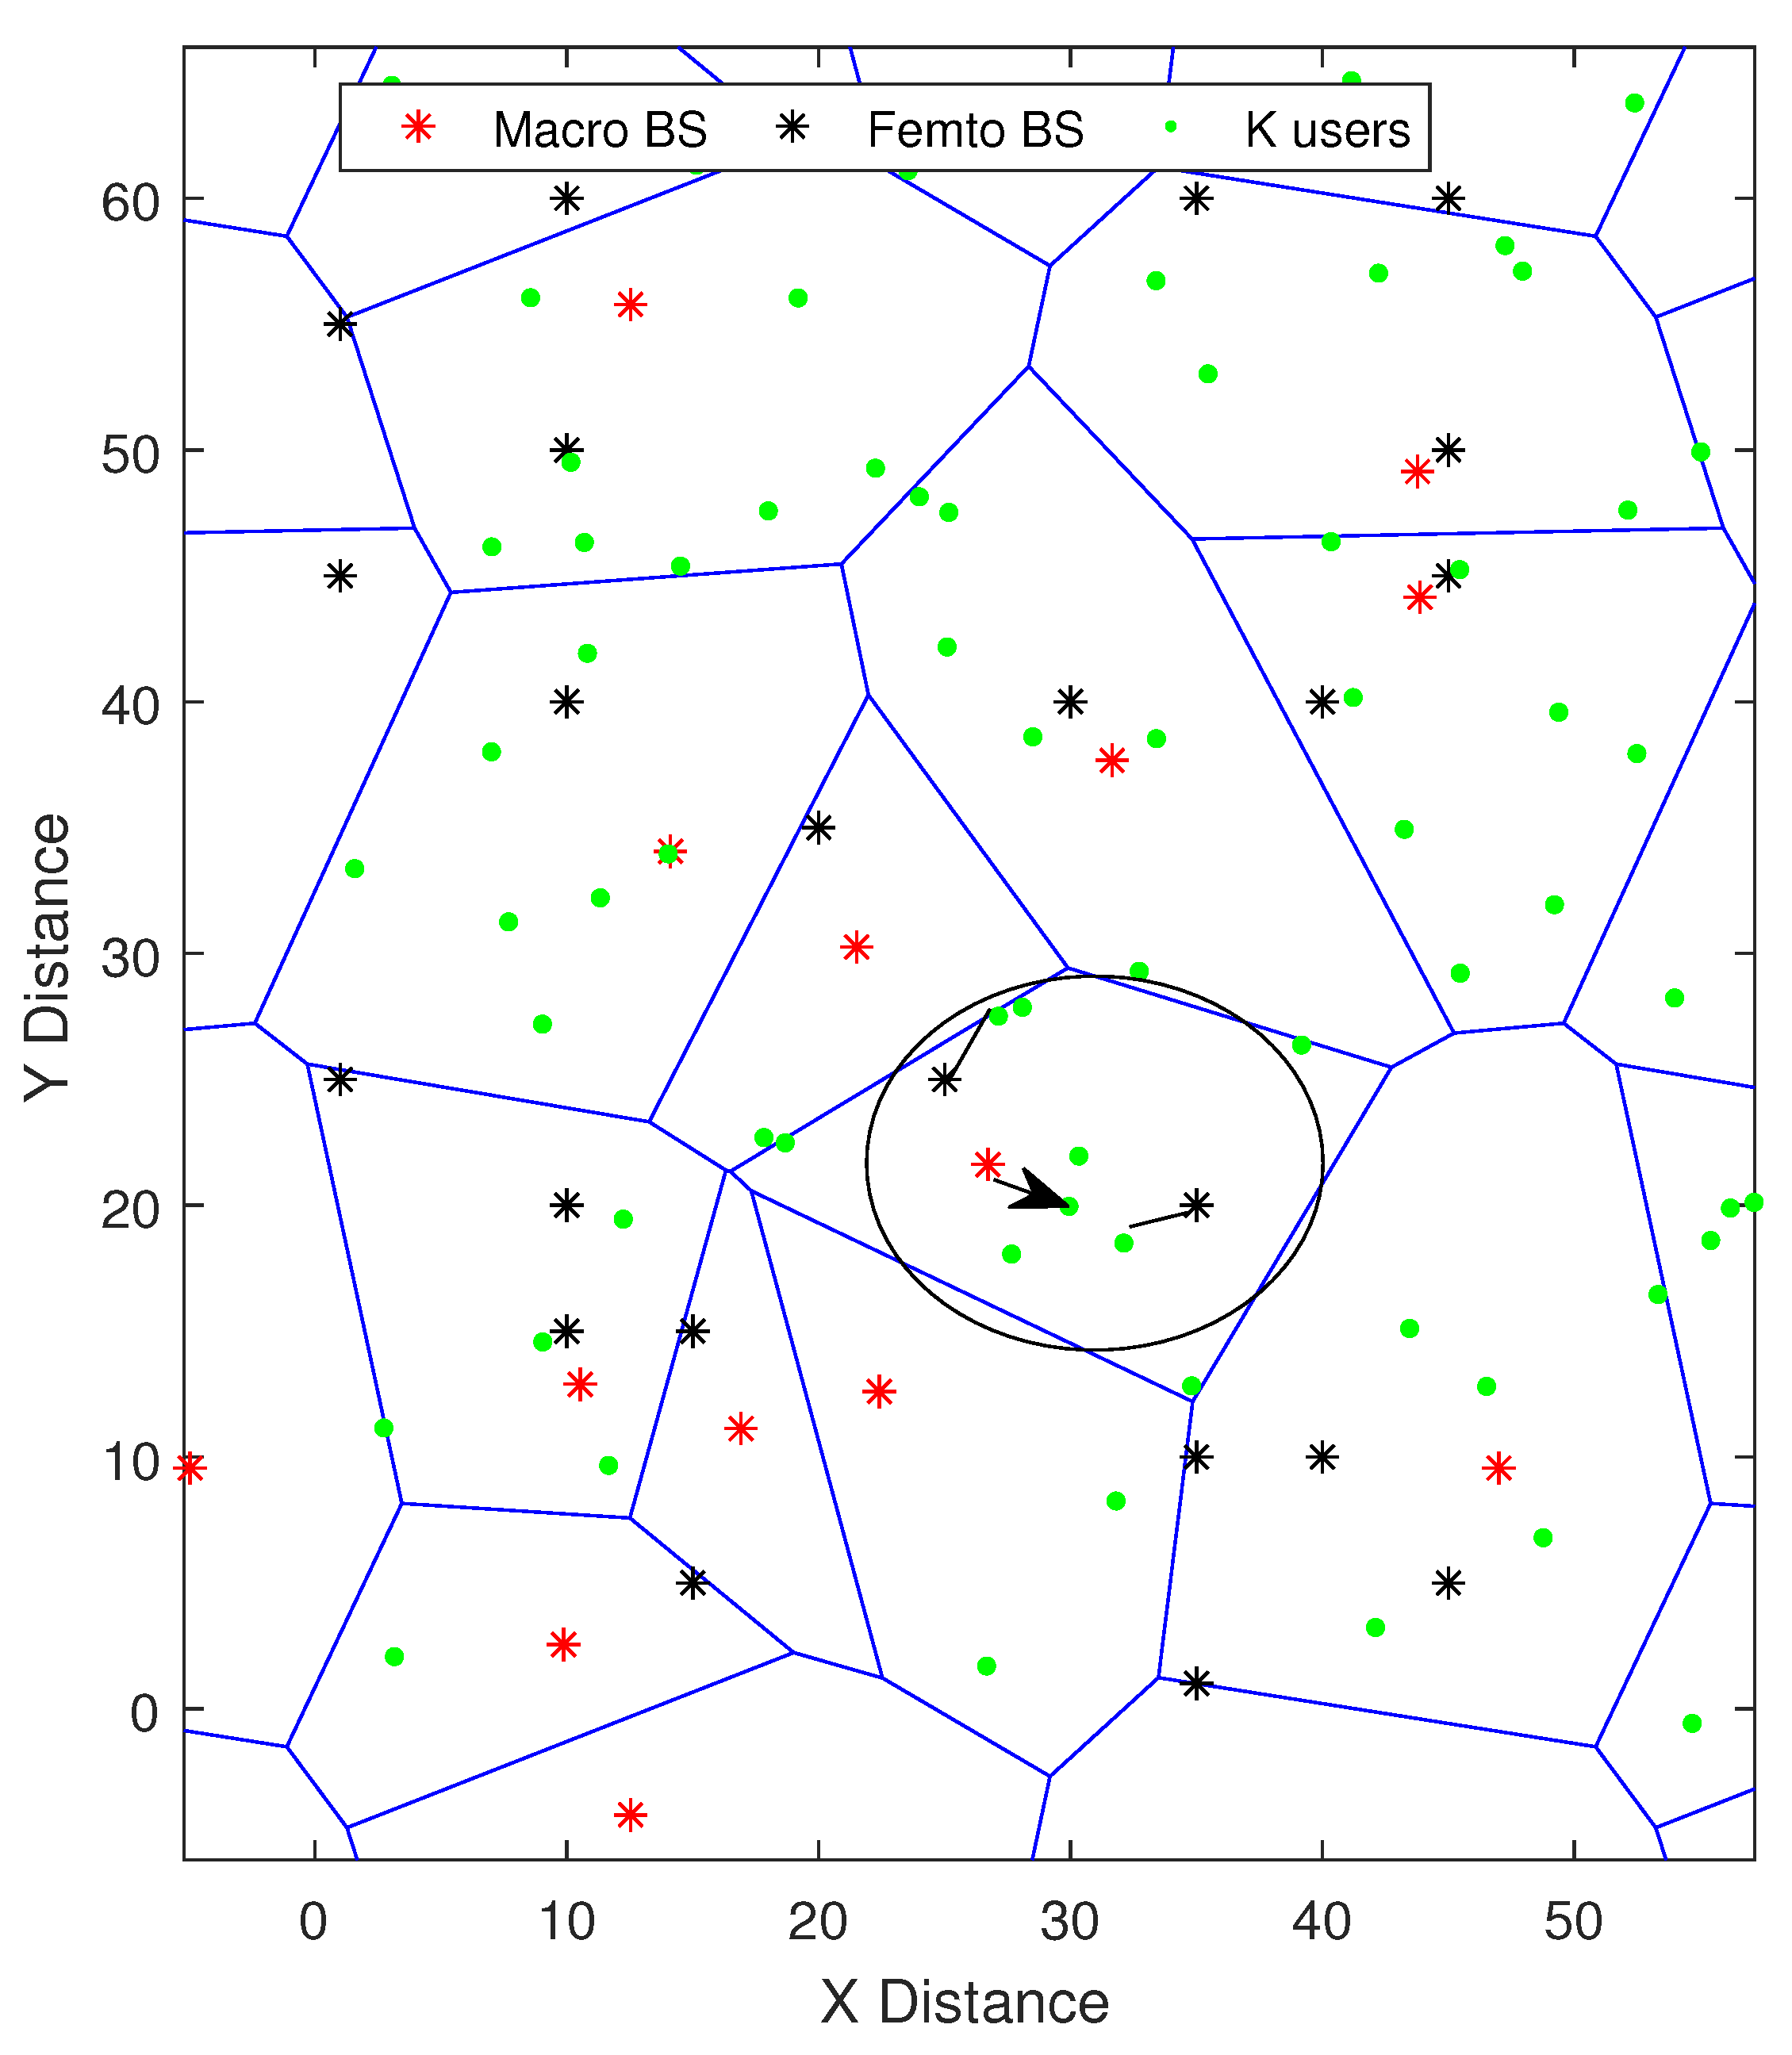
In this section, the users and BSs are associated in the Voronoi cell with the coverage areas comprising of Voronoi tessellation. Here, we assume open access network, where users are served by the nearest BS and can access any tier’s BSs in the service area. Also, assuming all the BSs are transmitting, a macrocell user receives interference induced by the femto cells. Now, by spatial stochastic process with Poisson point model, the femto cells are irregularly setup while the macrocell BSs are regularly setup (cf. Figure 1). Further, we assume all the BSs share a common frequency band for communications. Adopting orthogonal frequency in the downlink LTE system, the available frequency per tier are partitioned into sub-bands of the sub-carrier. Thus the users that connect to the under study tier BSs have no intra-tier interference since intra-tier interference occurs from co-channel neighboring BSs, hence we assume coordination among the MBSs. Whereas no coordination with the femtocells, since the femtocell deployments are randomly and uncontrollably installed by users. Again, we assume no coordination between MBS and femto BS, then inter-tier interference is in the from of femto BS to the macro cell user. However, in dense networks, the macrocell user experiences both dominant LoS and scattering signal (NLoS) transmissions from MBS, while transmissions from femtocell BS are likely to be only scattering. By this transmission assumption, the network is designed such that user to BS association and received power weakness strive on the user location.
Assumption 1.
In this analysis, we assume the intended signal follows Ricean fading distribution whilst the interfering signals follow Rayleigh fading distribution with sufficient scattering.
2.2. Poisson Point Process Model
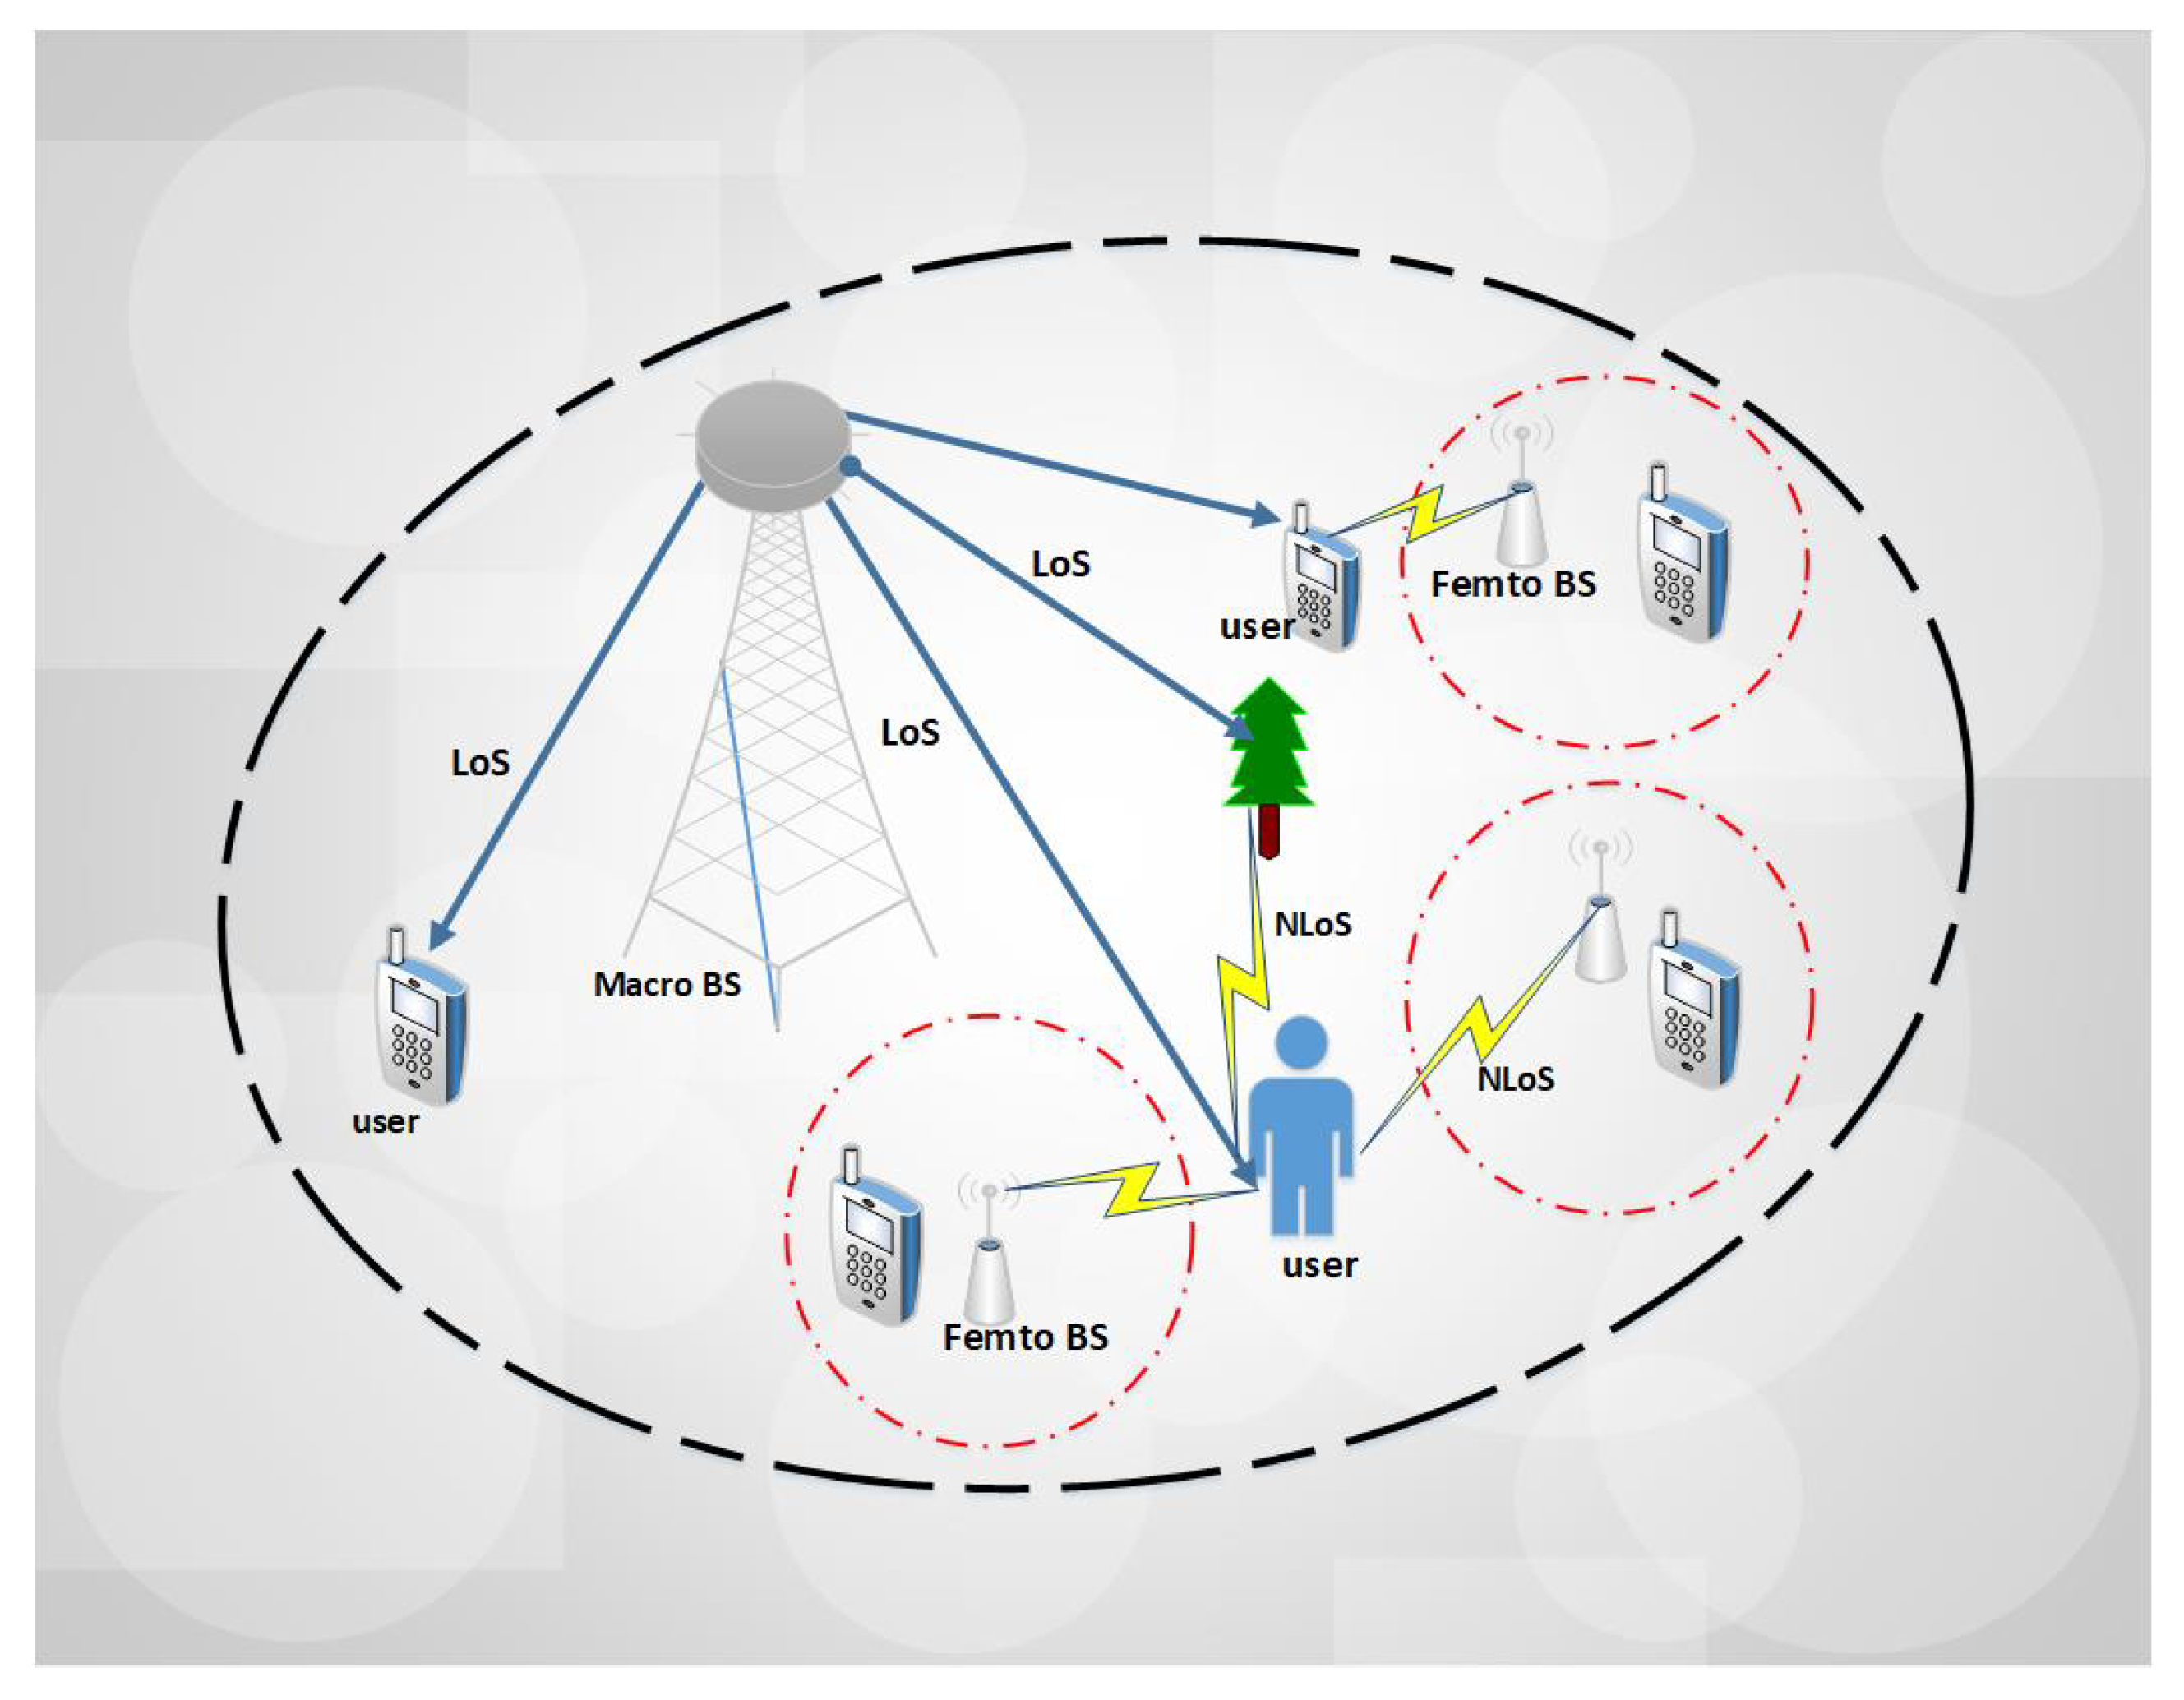
We consider downlink massive MIMO HetNet consisting of two-tier HetNet (cf. Figure 1 and Figure 2), that is nth and jth tiers are macro and femto cells respectively. In the nth tier, the BSs are spatially distributed according to independent homogeneous Poisson point Process (PPP) with density , bounded in area , as . Each BS in the n tier has equal transmit power , M transmit antennas and K single antenna users spatially distributed over in a homogeneous PPP .
2.3. Channel Model and Beamforming Design
Consider a massive MIMO HetNet with the intended signal from the nth tier (MBSs), then typical user receives interference from BSs of the jth tier (femto BSs). The small-scale fading of the desired and interference signals are given in Ricean fading and Rayleigh fading , respectively. Now, massive MIMO beamforming is used in this model to surmount signal propagation loss, so the MBS transmitted signal is , where and are the beamforming vector and information signal for the kth user respectively. Then, for simplicity we employ the MR transmit beamforming with perfect CSI at transmitter, and columns of beamforming matrix , with , for is the normalized channel direction to the user. The intended channel power for user located at is , here the channel power follows Gamma distribution which is given as [1]. In the interfering marks, the beamforming matrices have unit-norm orthogonal columns, the interfering channel vector and interfering vector are independent unit-norm random vectors. So, interfering channel power is gamma random variable with unit shape and scale parameter as , since beamforming vectors have no clear angular directions, then the channel vectors are estimated from independent . The is modeled as Gaussian with zero mean and unit variance, this depends on the channel fading and user locations.
2.4. The Fading Distribution
The elements of the channel fading are i.i.d complex Gaussian with two independent random variables. Now, focusing on the averaged received power rather than the magnitude of the elements, the PDF of average received power with Rayleigh fading is given as
where is the averaged received power. Consequentially, if LoS channel is present between the BS and the user, the total channel power is shared between the LoS and the scattering channels. We define Ricean factor as , where , and channel power is [29]
where denotes the real and imaginary parts of the fading signal which are statistically independent zero-mean Gaussian variable with variance. And, the average received channel power becomes
Then, the PDF of average received channel power with Ricean fading is formulated as
where is the modified zero-th order Bessel function of the first kind. Note that z is independent of the Ricean factor , so for , then the Laplace transform is given as
thus (5) decreases with for any s. On the other hand, increasing the can also increase any average metric that obeys the completely monotonic function [11].
3. The SIR Distribution
Now in massive MIMO HetNet system, the received signal from nth tier BS at the typical user located at the origin o is given as
where and denote the intended signal and interfering signal pathloss exponents, respectively, is the Euclidean norm and is the average transmit power per BS. And, the received power of the typical user at the origin from the association metric [5] is given as
where models distance path-loss effect in the standard power law. But in interference limited system, the thermal noise power is negligible with respect to the interference power. Then, the resulting SIR of the user served by MBS at location in the nth tier is given as
With (8), the typical user connects to the BS that provides the strongest instantaneous received power, and accesses the optimum transmit BS antennas. For MBS equipped with M antennas, each user receives M SISO subchannels. So, the Ricean channel follows specific pdf, where the mean of the non-central distribution is equivalent to M antennas. Because the largest eigenvalue in the non-central case grows unbounded along the rank of the channel matrix [30]. Then, Ricean channel have deterministic mean known for beamforming, hence we write (2) as . Therefore in (7), is the average power received of the Ricean signal. Then, we can rewrite received power of the Ricean PDF (4) with the QoS threshold , for as
Further, following the Bessel function transformation , we reformulate (9) as
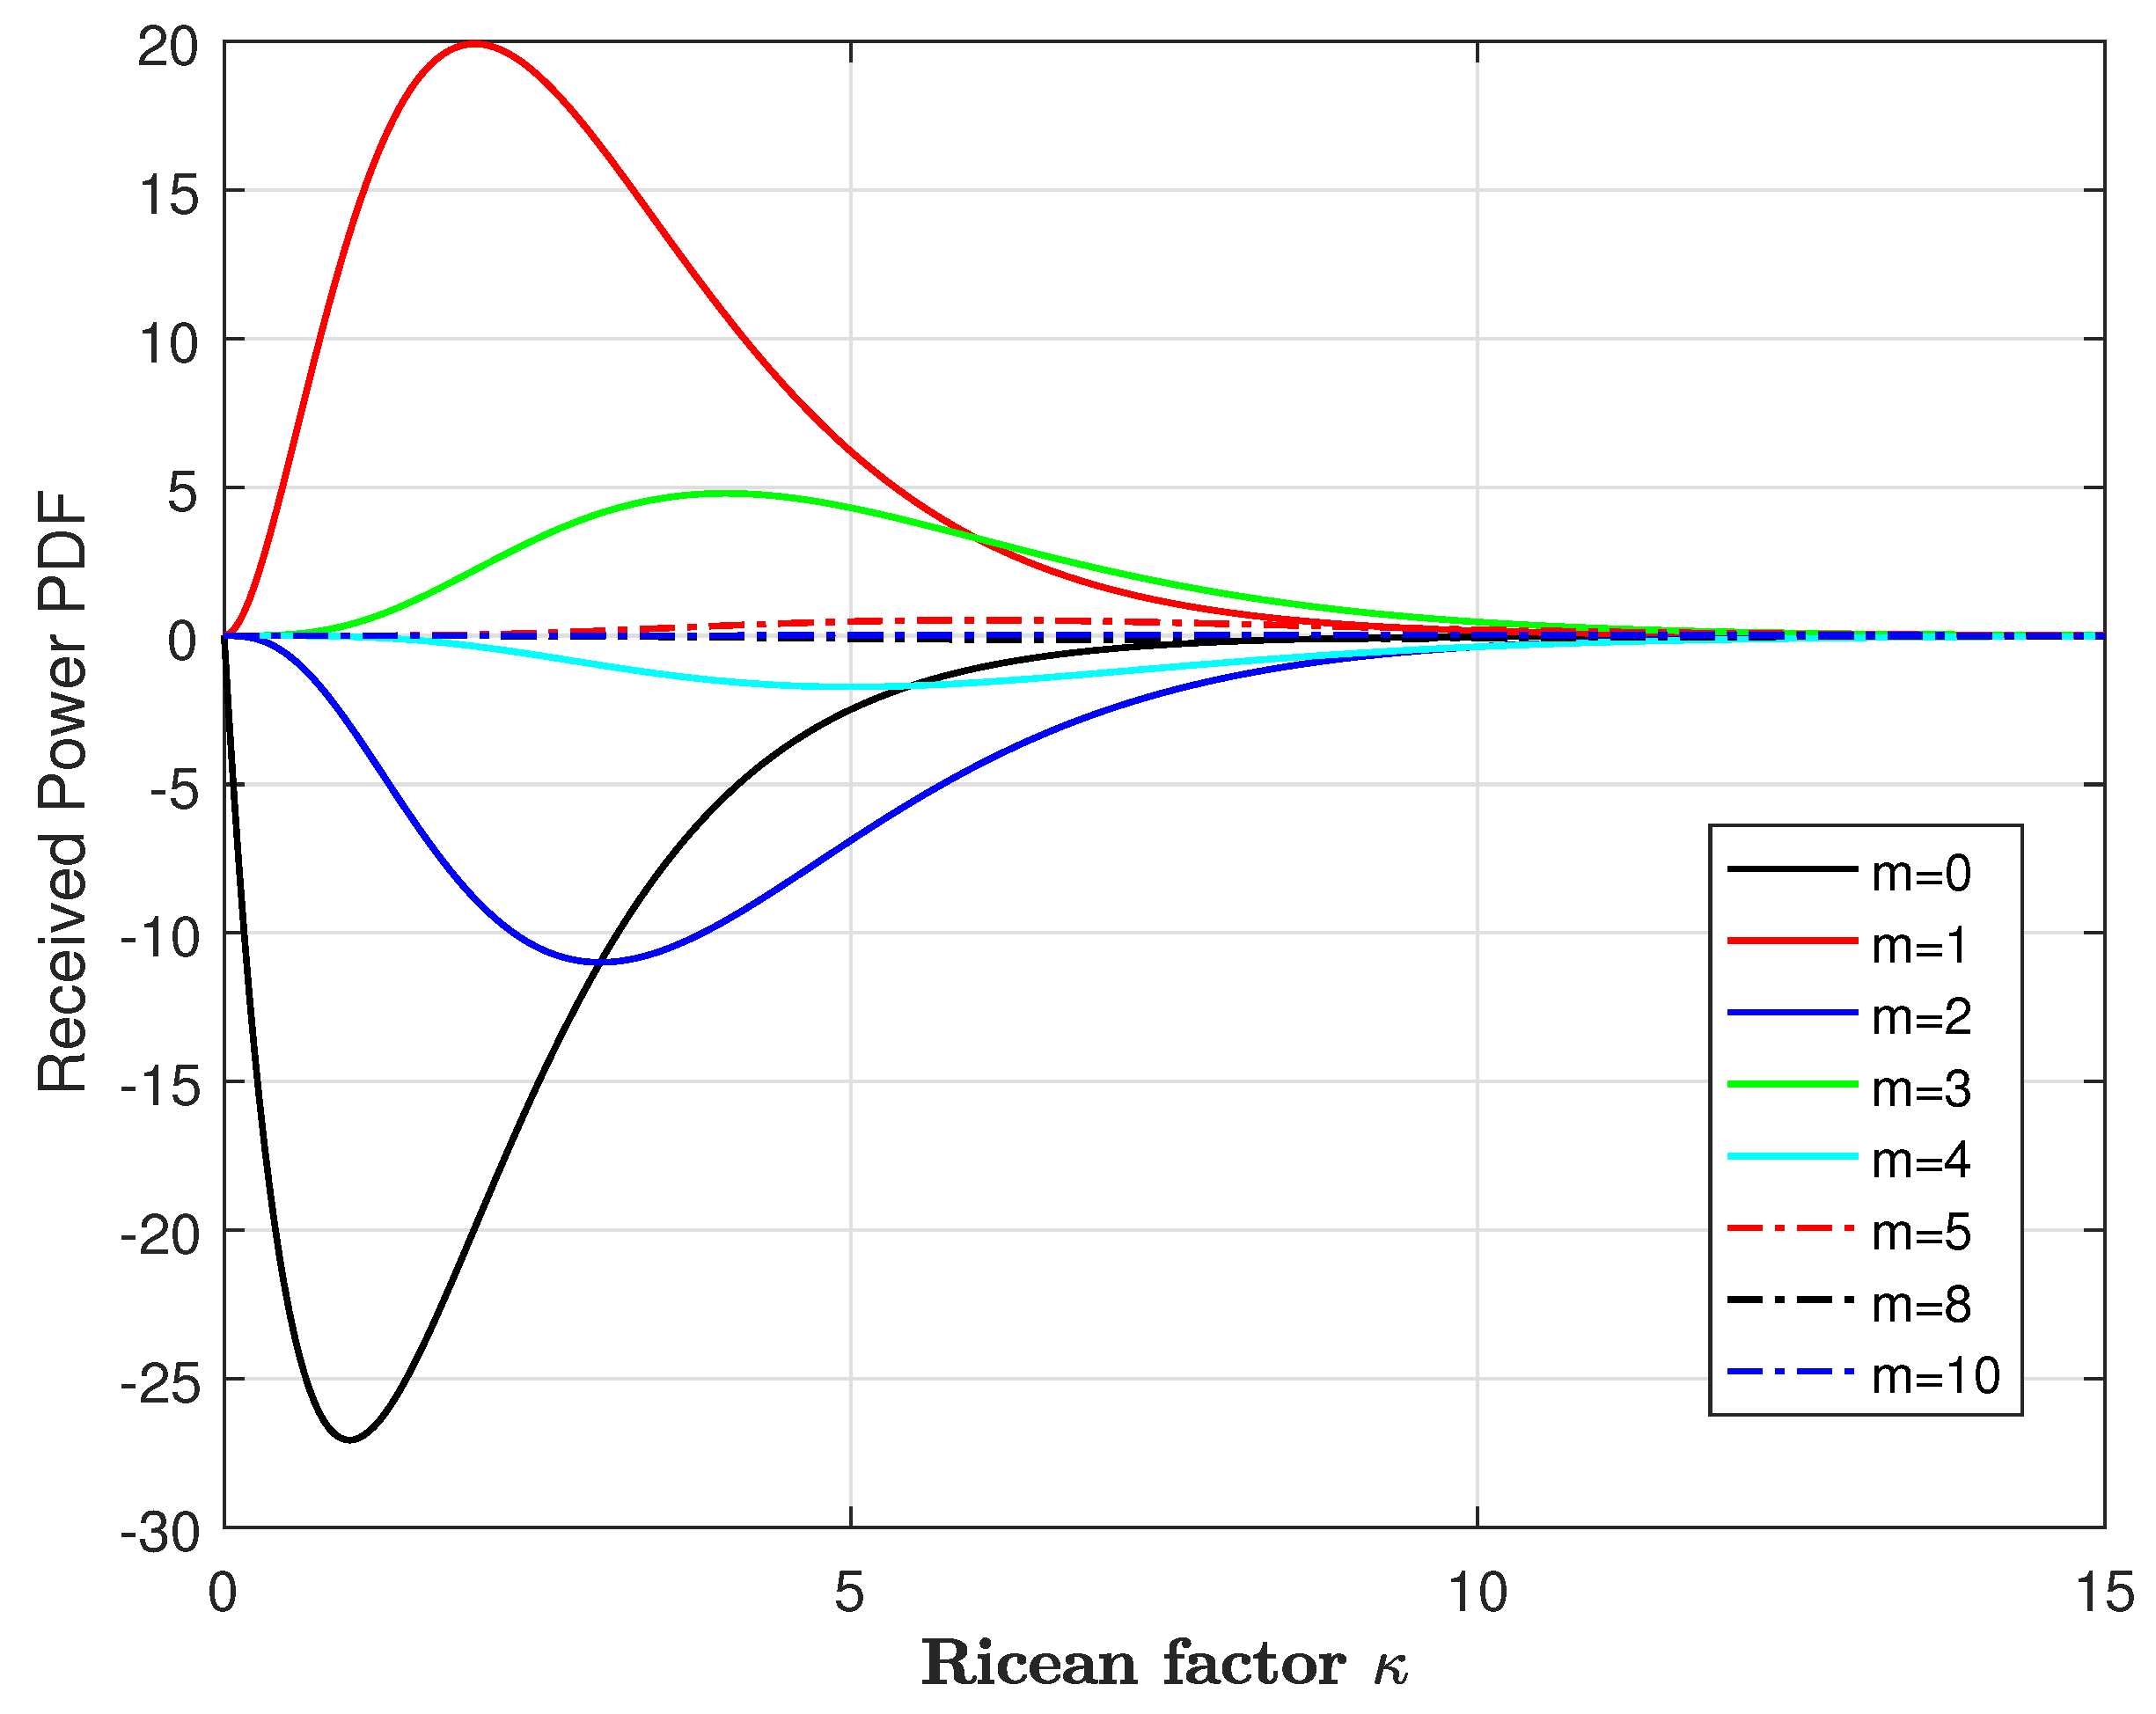
where the positive integer order m gives the factional moments of the received power, and for , the Ricean received power reduces to for the Rayleigh received power. Note that the m infinite series of the (i.i.d) Ricean channel entries have same Ricean factor in the non-central chi-square PDF’s. Figure 3 verifies some values of m with the Ricean factor. The m infinite series expression in (10) converges when m becomes large, the convergence is dependent. Therefore for large Ricean factor , the PDF turns to be more narrow and reduces to approach a Dirac impulse, which corresponds to no fading condition.
3.1. Intended Signal Power
The macro cell users are uniformly distributed over a infinite range of R in a PPP, where the null probability of the user locations follow [21]. Then, we obtain the PDF of the distance for a user to serving MBS as [13]
Next, we derive the probabilistic received power for the intended user connected to the serving macro BS within the supported distance. The convolution of (10) and (11) determines the distribution of received power for the intended user with Ricean fading at location , and this is derived as
where step (d) follows from a lower incomplete Gamma function with the integral function ([31], eqn. 3.381 8), is the lower incomplete gamma function given in step (e) as ([31], eqn. 8.350 1) and step (f) follows from the relation ([31], eqn. 8.355 9). Then setting , and adopting ([31], eqn. 8.350 4), with we arrive at step (f). Furthermore, the cumulative distribution function (CDF) of the intended received power (12) is also derived as
where step (a) follows from ([31], eqn. 2321 2). In (13), performance of specific user depends on the mobility and pathloss, with fulfilling practical network design.
3.2. Interference Signal Power
Here, the interfering signals are from the jth tier BSs i.e., femto BSs, we define as the average received pathloss power from all interferers. So, interfering signals power over Rayleigh distribution (1) is written as
Considering independent and identically distributed interfering signals, the CDF of the interfering powers can be computed in closed form with Laplace transform. Thus the aggregated interfering power (14) in the jth tier BSs is given as
where step (a) follows from the independence of the exponential Rayleigh fading. Further, locations of the interferers are evaluated by the probability generating functional (PGFL) of PPP [21], that is , this simplifies the Laplace transform in closed form. But, the total interfering signals are conditioned by the typical user at location to the serving BS. Therefore, setting Laplace parameter into (15), we get [16,21]
where step (a) follows from the standard pathloss model. The aggregated interfering power is received by the typical user at location to a serving BS which is associated to nth tier. This implies that, user association with BS depends on the cell selection and favorable path gain.
4. Performance Metrics
A typical user is within coverage when the received SIR from the set of serving BSs is greater than the QoS threshold. Hence, the probability of outage is formulated as
where is instantaneous SIR for user located at and is the probability of coverage that ensures SIR is above the QoS threshold, this helps to evaluate the spectral efficiency at the cell edge. And, the second performance metric is based on the Shannon throughput , we formulate the downlink average area spectral efficiency (ASE) as
For simplicity of this analysis, we assume all the tiers have the same QoS threshold.
4.1. Coverage Probability
The coverage probability is achieved by evaluating the complementary CDF (CCDF) of the intended received power , in relation with specific knowledge of the aggregated interfering power [23] in accomplishing the user SIR target.
Theorem 1.
For a typical user conditioned at to a MBS associated with nth tier, the probability of coverage in relation to the intended signal and interfering signals is expressed as
Proof.
By expression, probability of coverage associated with the SIR is obtained from the convolution of the intended and interfering signals. This approach differs from existing approach in [1,2,13,21]. From (13) and (16), We formulate the convolution as cov [19], then the coverage probability is derived as
where step (a) follows from Laplace transformation derivatives with piecewise continuous function of exponential order, which takes the form . According to the completely monotonic function [11], then is the nth order differential. Hence , this completes the proof. ☐
4.2. Area Spectral Efficiency (ASE)
Now, we consider CSI available at both BS and user terminal, then the spectral efficiency is lower bounded on the average capacity for small asymptotic probability of error over the user location. From (17) and (18), ASE is defined over the SIR distribution in relation with user location as
where is the coverage probability which is herein considered for analytical and simulation comparison. Since (21) is non-negative variable, we determine the average rate by the equivalent combination over the user location and fading distribution as
where step (a) follows from as the envelope of fading distribution w.r.t SIR, step (b) follows from the CDF of as cov. And, applying integration by parts as , with , step (c) follows by setting . Then plugging (22) into (21), we arrive at
where step (a) follows from substituting (19) and rearranging the terms, then the integral is taken over non-negative integer t, and the equivalent solution is provided in [16]. Now in (23), ASE is evaluated with channel gain and received power in (7) and (8) at the user location. So, to further improve the overall performance, we design MBSs cooperation to jointly control power in (7). This meliorates cell edge user performance. The next section focuses on developing beamforming coordination approach.
5. Macro-Cell Coordination and Optimization
In massive MIMO HetNet, the high power MBS enhances the edge effects between adjacent macrocell. The finite range (11) of MBS creates a process with macrocell users at cell-center receiving stronger channel power than at cell-edge. This calls for user association for cell center or cell edge by considering the fractional frequency reuse (FFR) [20,32]. To guarantee QoS for the macrocell user, a downlink massive MIMO beamforming coordination is proposed. This involves individual power constraints through exploiting CSI to control the QoS requirements of the user [26,33]. As such, most favorable macrocell with channel gain and power serves the user. Then, transmission power constraint provides the max-min optimality for the SIR and user fairness (maximum worst-user SIR).
Herein, we let the set of users served by n tier macro BSs be , and is the index of user k served by the MBS at the origin , with transmit power and beamforming vector . And the distance to the nearest macro BS as r, then the received SIR of user k is written as
where is the MBSs coordination region and is different for different users, and is the channel vector from MBS o to user k. Also and diag are the transmit power and massive MIMO beamforming, respectively, for the cluster of MBS. The objective of the MBS coordination is to jointly optimize the beamforming and transmit power, the maxi-min optimization problem under weighted SIR (The weighted SIR ensures the macro BSs form coordinated beamforming and power control so as to achieve the required fairness level for users) is as
where ensures QoS priority with SIR for the kth user, for large values of ensure higher SIR for that macrocell user. Now the optimization problem in (25) is non-convex, but base on optimality of the beamforming [34], the feasible test can be cast as second-order cone programming (SOCP) problem [35] and implemented on MATLAB. The global optimal solution is achieved by convex optimization method. Next, we formulate the power minimization problem as
Now, uplink and downlink duality [36,37] is explored for CSI exchange to control the transmit power. Thus, we define the uplink power , such that the uplink beamforming are decoupled [38]. Then optimal downlink massive MIMO beamforming is realized from uplink estimation as
And, from the optimization problem (25), we develop the maximization problem for as
where all the SIRs are kept above the slack variable . So, optimization is solved by searching for suitable , such that the optimal transmit power has at least one active power constraint. Hence produce same optimal beamforming , so retrieve the Ricean channel gain ( and M). The MBS beamforming coordination is solved when design criteria attains certain point on the optimization.
5.1. Algorithm Computational Analysis
The channel matrix operations determine the complexity of the algorithm. Here we assume K users, N number of MBSs and I iterations. The algorithm (in Table 2) in each iteration updates the MBS with the transmit power and beamforming vector by exploiting own local CSI with channel . Importantly, the MBS exploits only the local CSI and have limited CSI exchange with other MBSs. The algorithm is first implemented by solving the uplink estimation and then converting it to downlink solution. This conversion is implemented once, afterwards the solution is realized. Hence in each iteration, K users transmit power vector has to be shared among MBSs. Then, the number of CSI exchange is , and is the uplink-downlink estimation shared among MBSs, thus the total exchange for algorithm operation is (irrespective of M MBS antennas). And by comparison with the intra-tier beamforming with global CSI design [39], the algorithm requires all the other users transmit powers which are obtained by CSI exchange among all MBSs. Then the required signaling is proportional to the number of iterations, K users for the CSI exchange and M MBS antennas, thus the algorithm operation requires . Then the computational complexity of the proposed algorithm is low, efficient and converges faster than intra-tier beamforming with global CSI design.
5.2. Interference Coordination
In this subsection, the coordination is facilitated by transmit power control and exerting control over the spatial reuse of resources. The power ratio is controlled between kth and rth MBSs to facilitate reuse of resources. First, from the power control, the optimal power relation is controlled by the BS antenna. Second, by resource reuse, proper allocation of resource can be reserved for each BS transmits power over the total bandwidth B, but the location of the user impacts the frequency reuse scheme. Now, by employing fractional frequency reuse FFR (for simplicity and tractability), the bandwidth is partitioned into orthogonal sub-bands with fixed number of consecutive sub-carrier C, the subchannel is given as . Then, users at cell-center with low inter-cell interference employ full frequency reuse whilst cell-edge users employ partial frequency reuse to avoid interference with neighboring MBS [32]. We adopt the soft FFR (SFR) based on resource allocation and BS power control for the cell-center and cell edge users (herein we refer to [20,28]). The SFR subchannel has frequency sub-bands, where integer is frequency reuse factor [39], here all the sub-bands area allocated to each macrocell. And, to reduce the cell-edge interference and enhance the SIR performance, BSs require power control to transmit with higher power to cell-edge users. Thus, the BS transmits more power to edge region users than center region users according to , this improves the SIR and reduces interference at the edge boundary.
6. Numerical Results and Discussions
This section presents the numerical results of the analysis, we use simulations to discuss the theoretical study. Ricean factor is selected based on the conclusions in Figure 3, and simulation parameters follow:
6.1. Coverage Performance with Two-Tier Massive MIMO HetNet
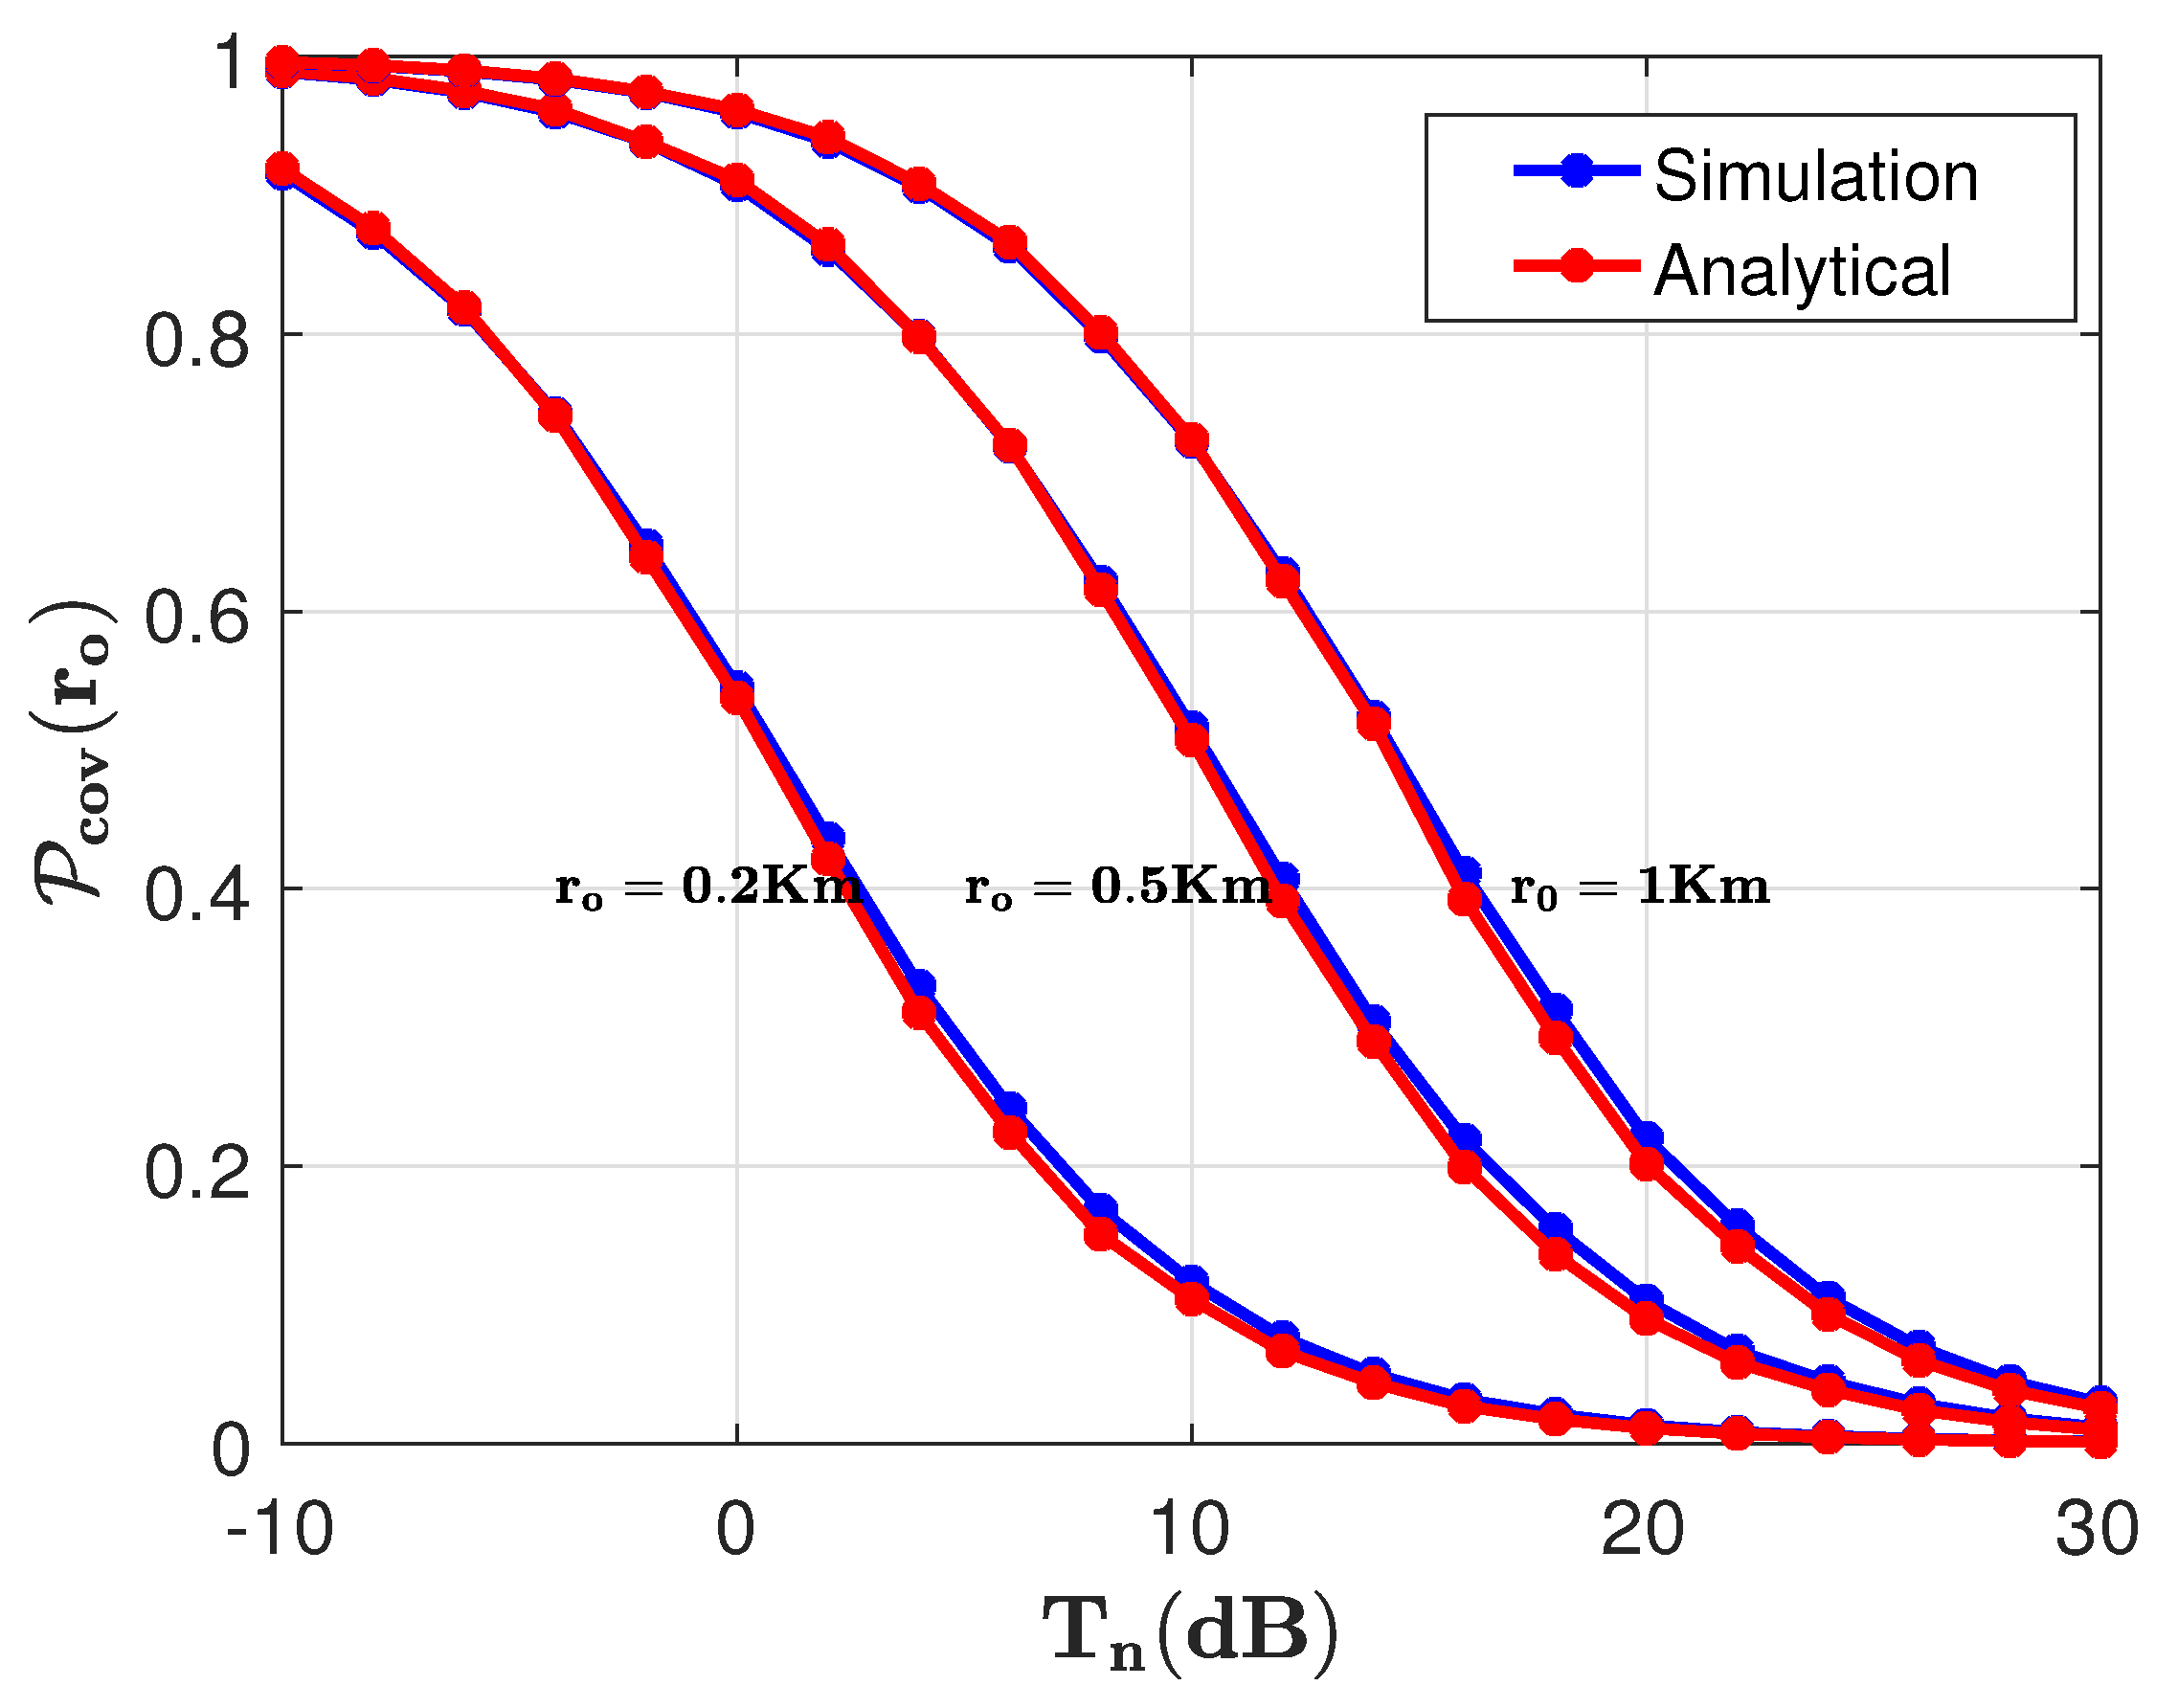
Now, Figure 4 shows the distribution of the SIR function with the coverage probability for different values of macro cell user location. We validate the result with the SIR, it is noticeable that the user location increases with lower performance. Thus coverage probability increases and converge for all user locations at high SIR, confirming that as macro cell users move towards the femto cells, the received signal is error-prone. The convergence suggests the user is at the cell center, where the femtocell interference is dominate. In contrast, macrocell interference is also dominant at the cell edge. Indicating probability of coverage always converges at cell edge. This ensures that to satisfy the macrocell QoS requirement at distance (i.e., user location exceeds ), or otherwise the user is within femtocell coverage. Since the low-powered BSs are placed almost throughout the coverage, the SIR is improved at any distance.
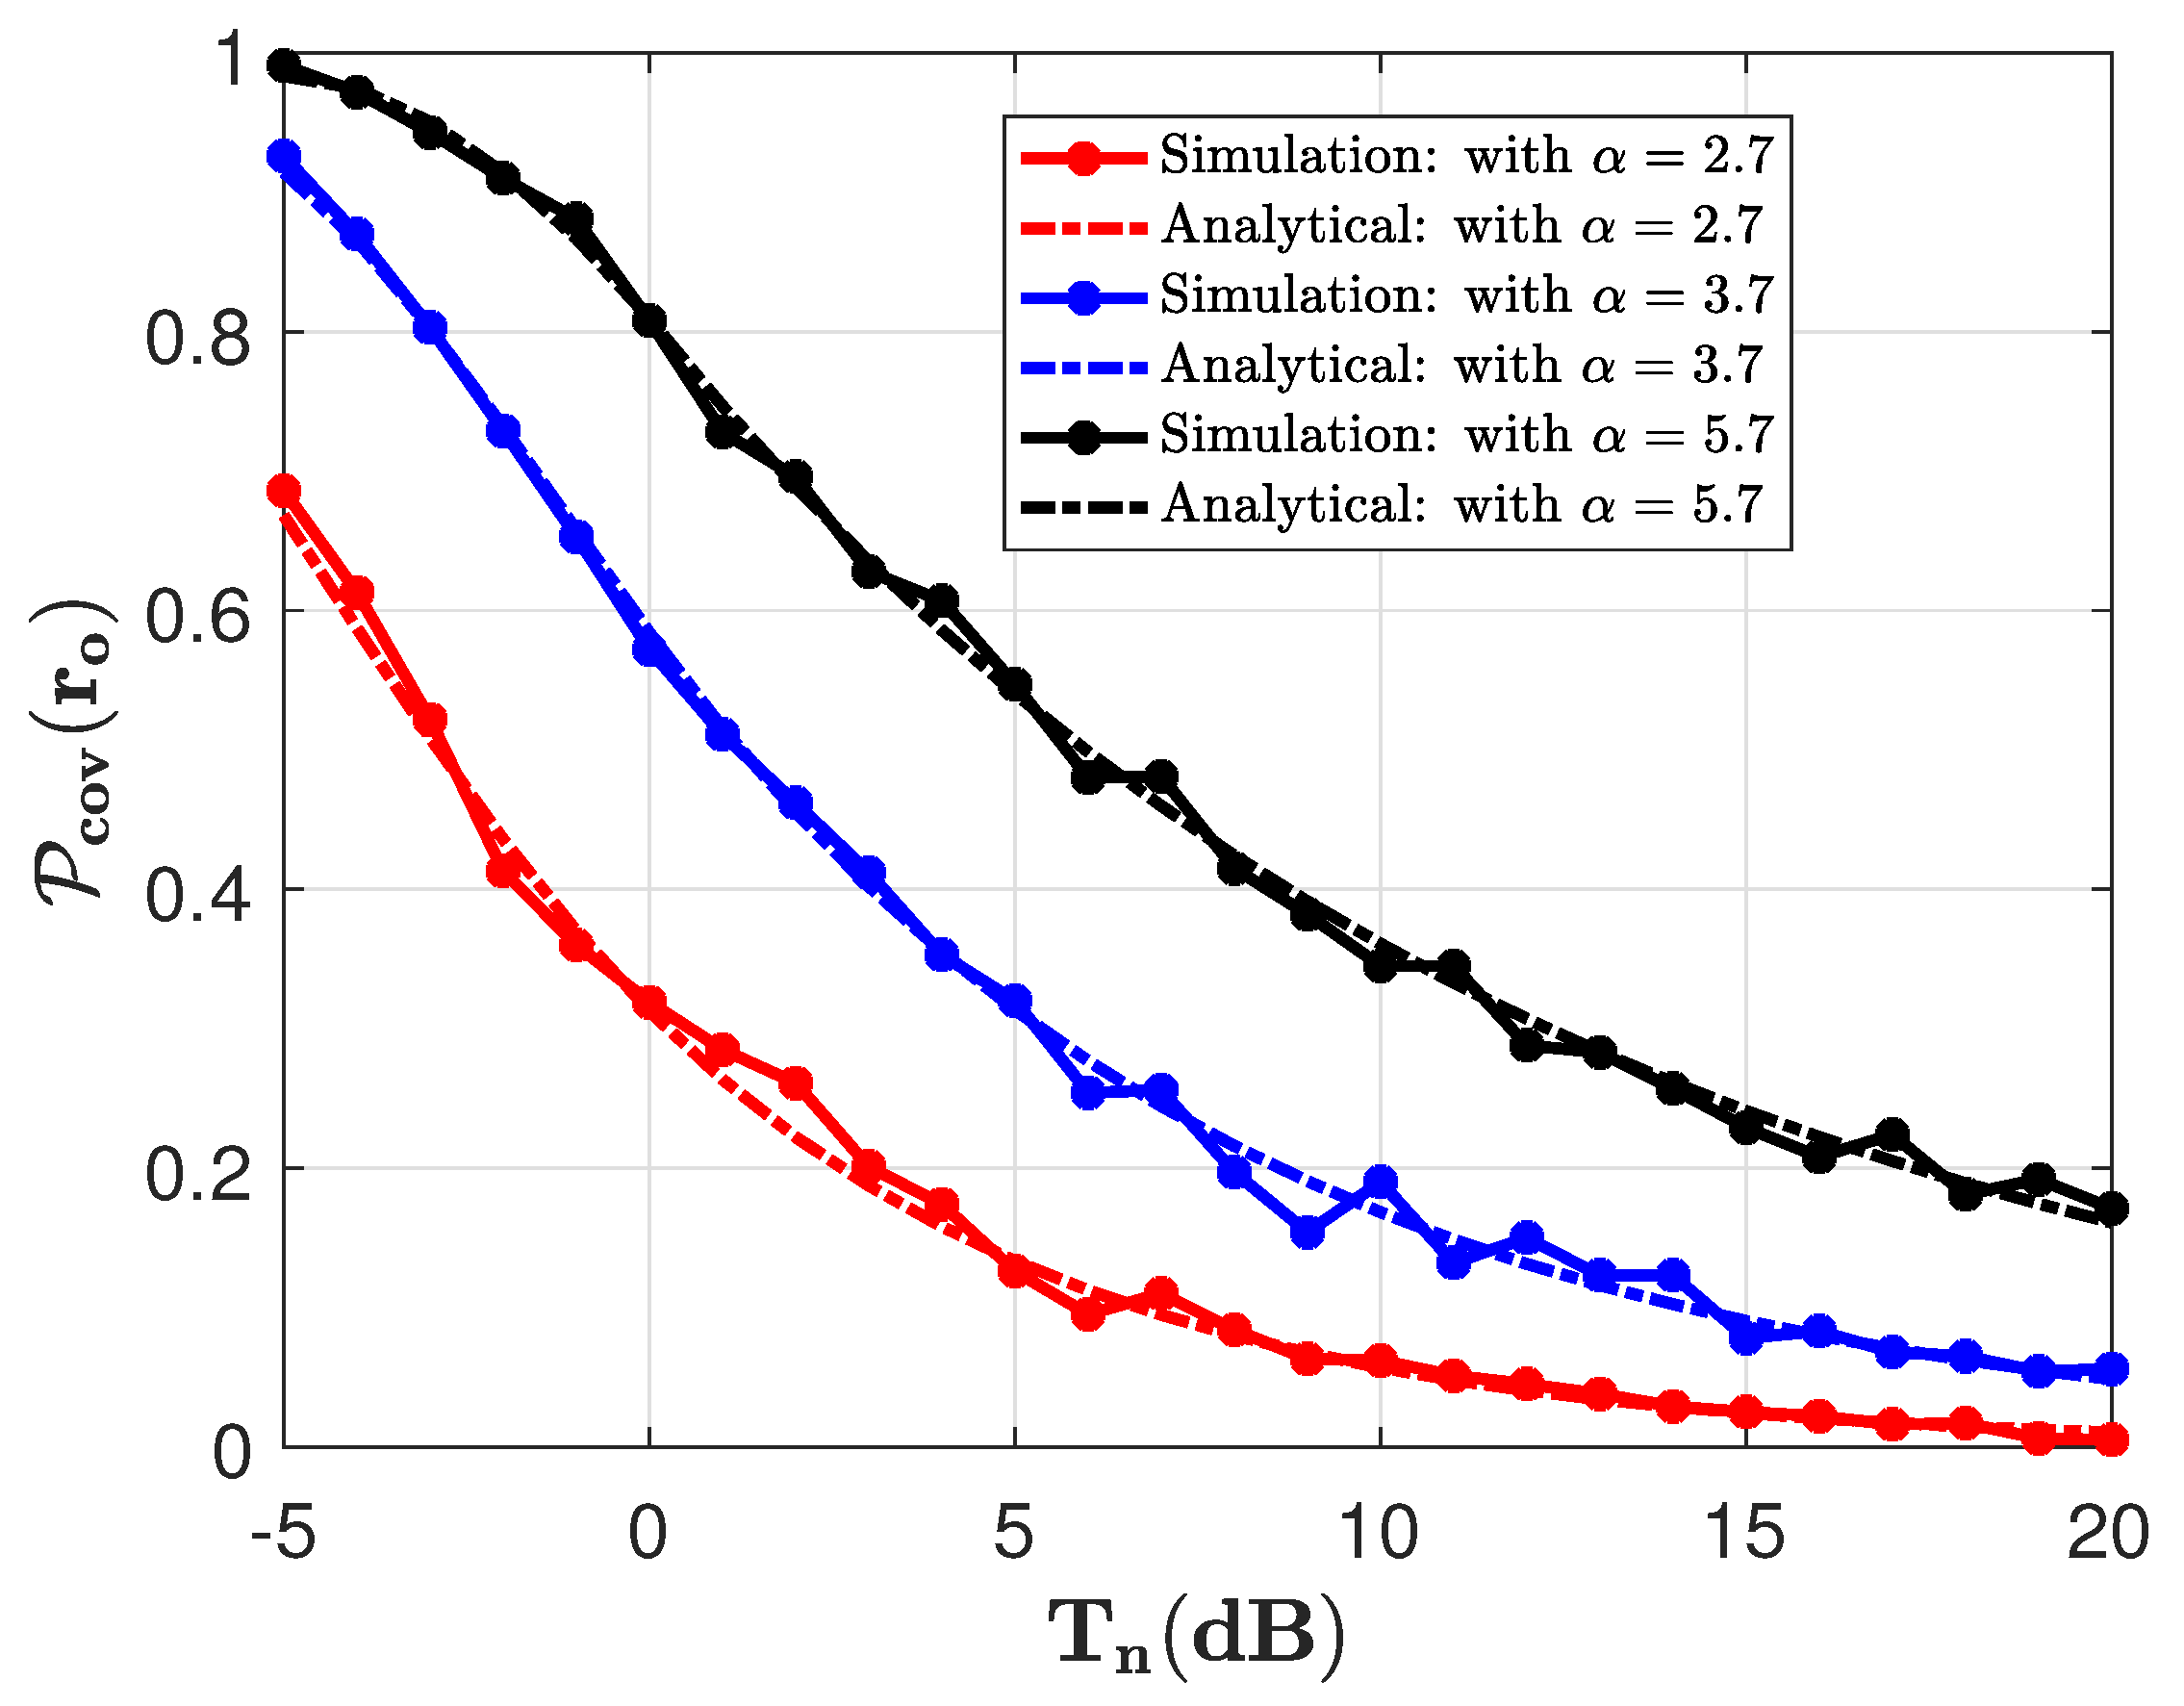
And, Figure 5 shows the distribution of the SIR function with the coverage probability for different values of the pathloss exponent (in Table 3). We observe that the pathloss exponent increases with weaken signals thus coverage probability decreases, and coincide for all pathloss exponents . Indicating that the network is interference limited as discussed in the analysis. The performance with lower pathloss exponents suggest the coverage is distributed and users are associated with the BSs at closer distance, thus the coverage probability converge at cell edge.
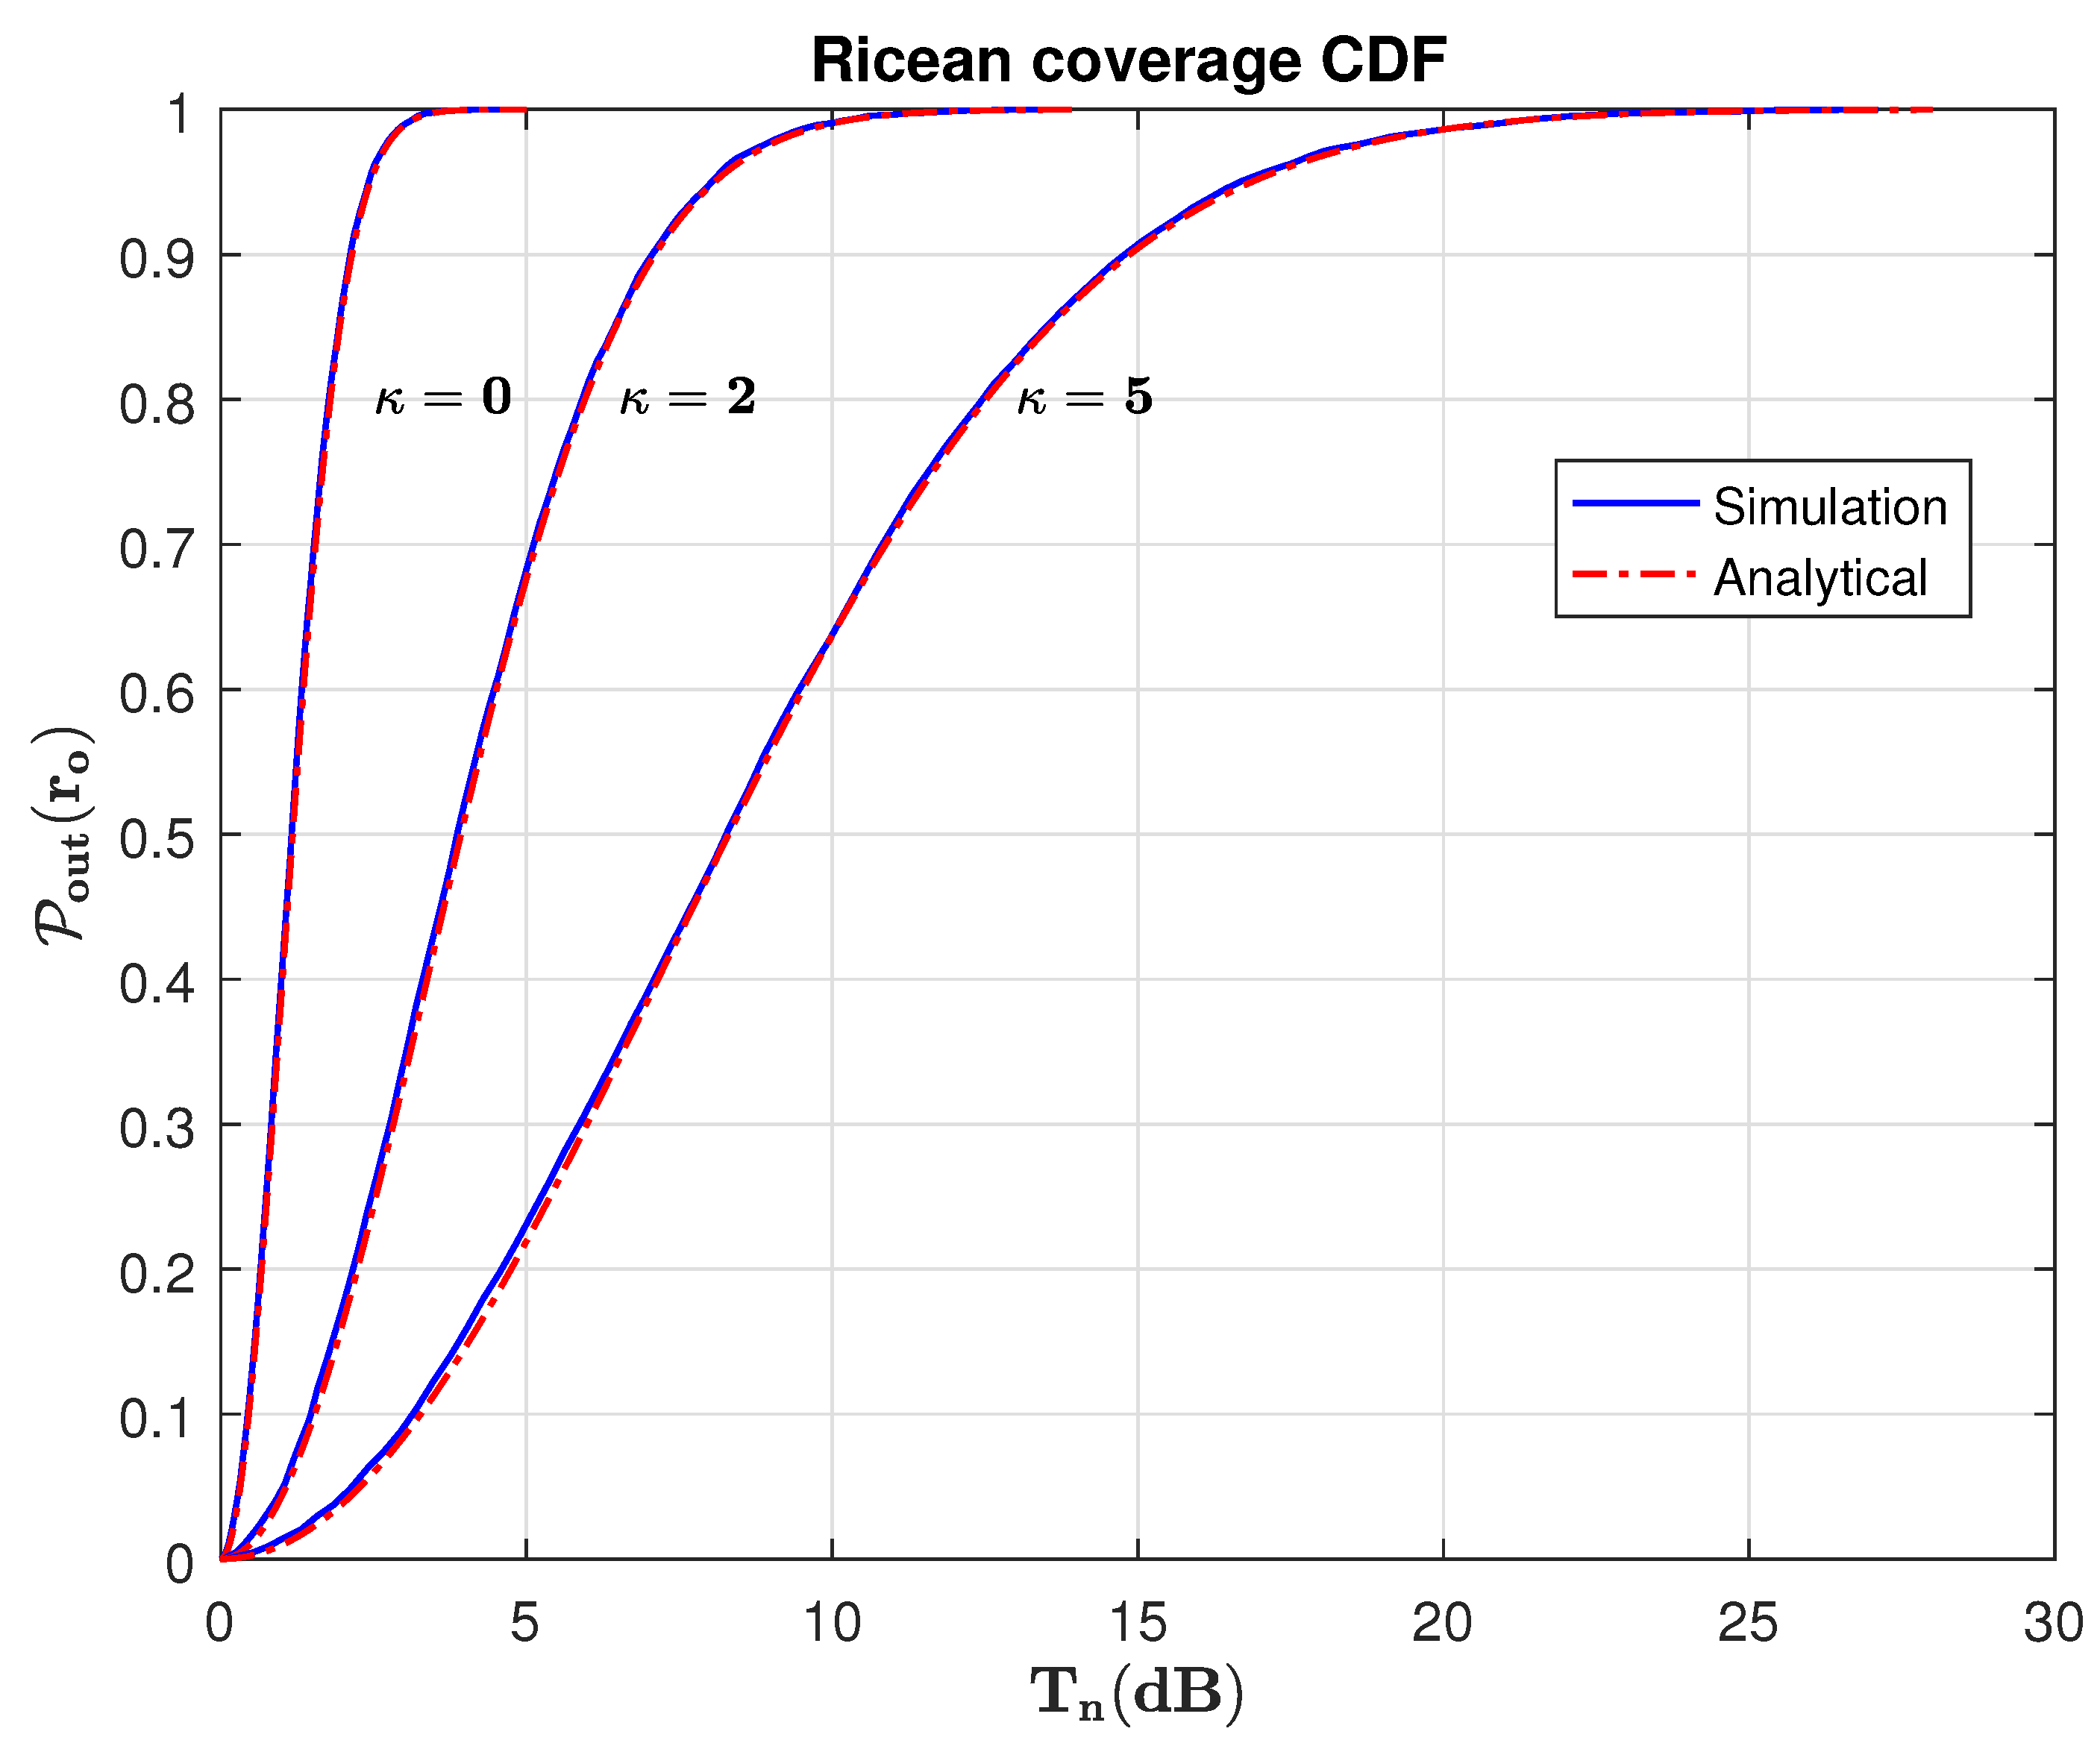
Then, Figure 6 plots the outage probability with the SIR, and compares various cases of Ricean factors (in Table 3). Base on the assumption that interference is scattering signals, the Ricean channel with dominate LoS has at least one eigenvalue pre-dominating. Thus, the MIMO channel behaves as a SISO channel for the largest eigenvalue in achieving the necessary SIR. In addition, from (20) the monotonic increase in Ricean factor improves the SIR of a user located within macrocell coverage. But since have same behavior as scattered signal from femtocell hence the low SIR performance. This shows that the approximation of the interfering channel from the independent homogeneous PPP is accurate. Consequently, it is difficult to model SISO channel correlation of the interfering channels for higher order of the Laplce transform derivative, hence can be ignored [38]. However, this suggests that the user is in outage at location outside the disk radius , if there is no strong MBS signal.
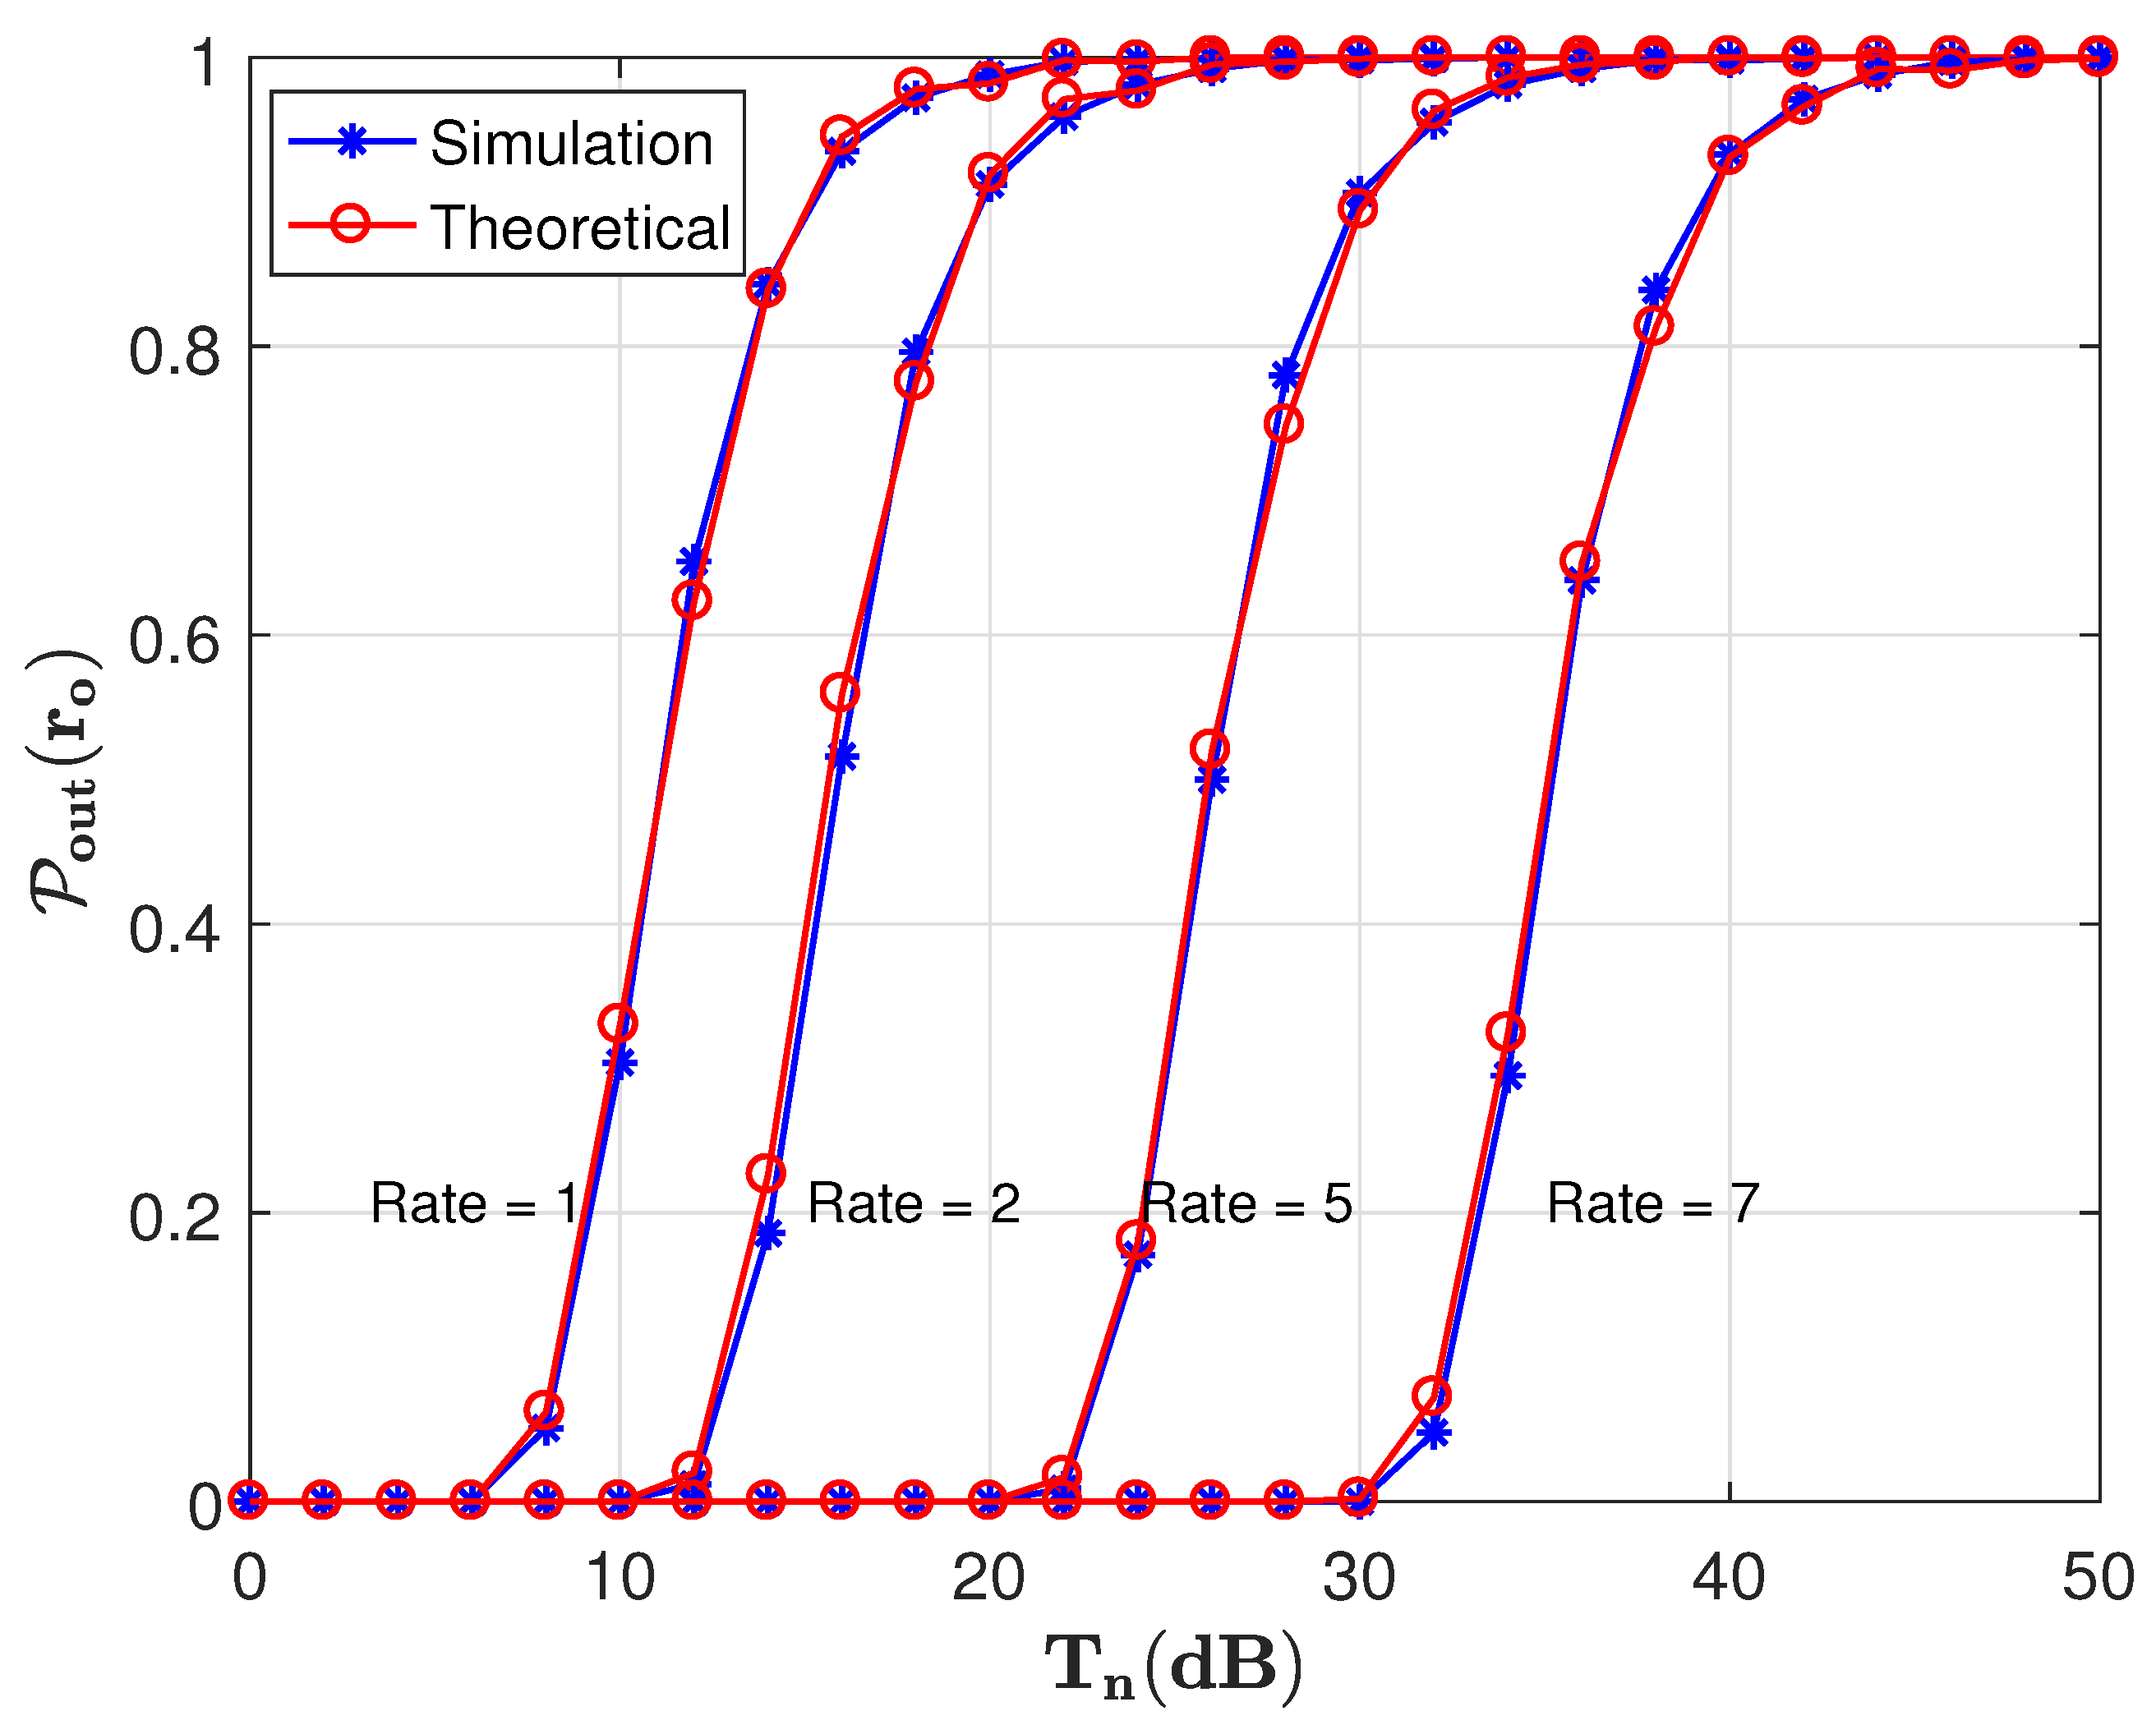
Also, Figure 7 presents the distribution of the SIR function with the outage probability, here we assume BSs transmit at maximum power. The Rate parameters in the figure is derived from Shannon instantaneous rate, which takes the form: , where . Note that since the neighboring BSs i.e., macro and femto BSs are assigned different instantaneous effective channel distributions, interference is minimized when the user is within macrocell. This helps to improve the instantaneous SIR and the ergodic channel rates, and we can always get average channel capacity with 5 dB. We also observe the impact of massive MIMO fading channel with is non-negligible, as such the randomness of the channel affects the SIR, the evidence is seen from the analytical and simulation results. The pre-dominated LoS in the Ricean channel has at least one eigenvalue which corresponds to the MIMO channel behaving like SISO channel, where the largest eigenvalue achieves the maximum gain.
6.2. Performance with MBS Beamforming Coordination
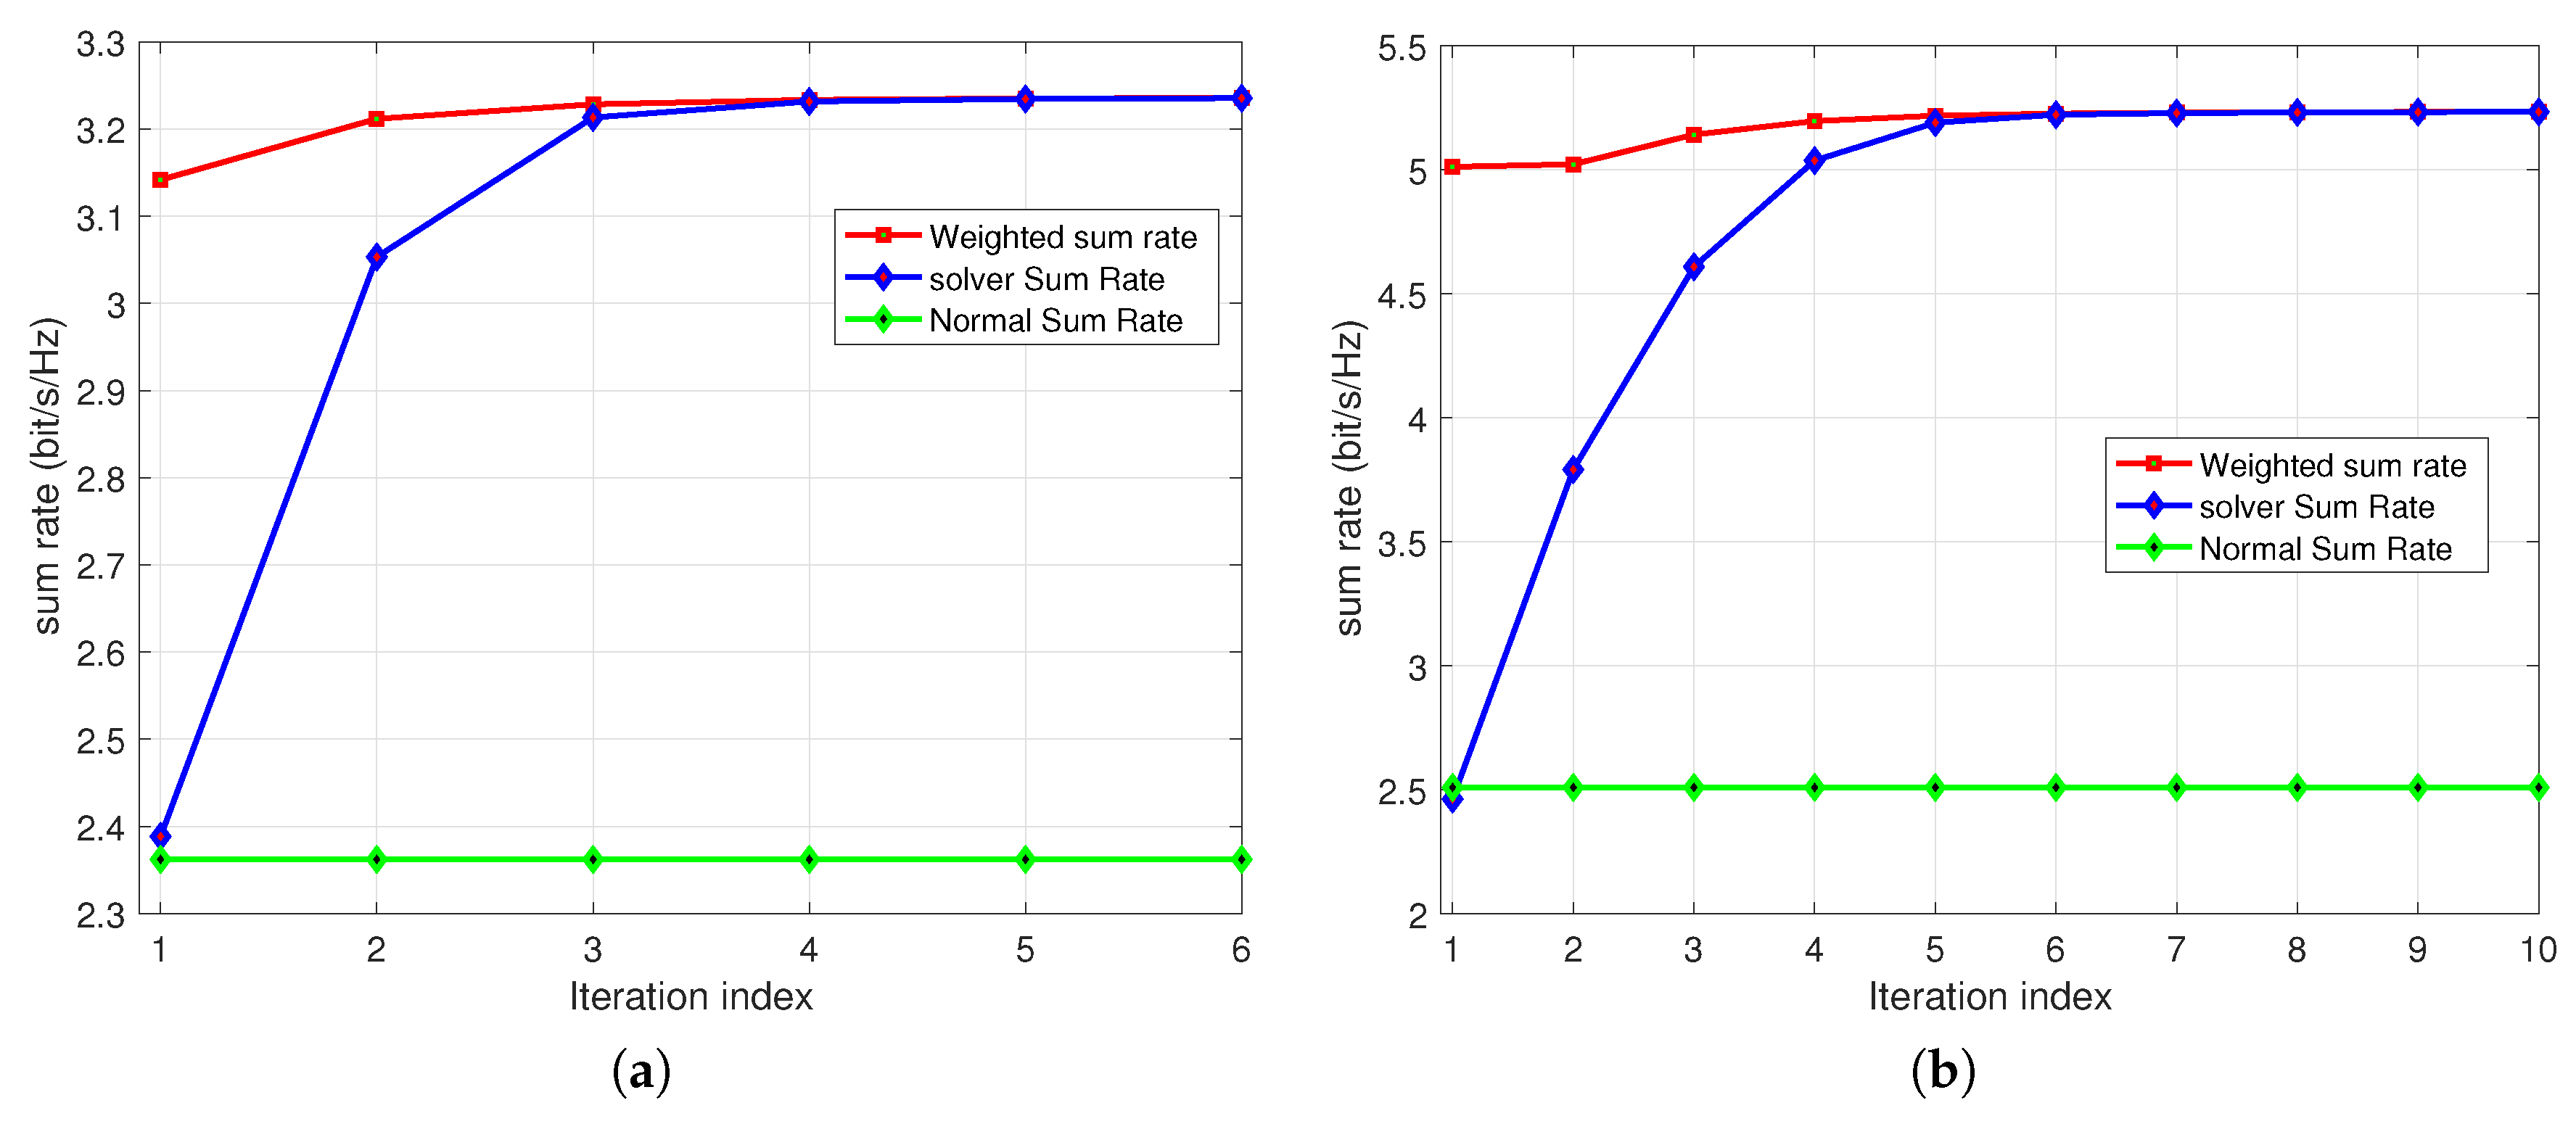
Next, Figure 8 shows convergence of the iteration index for the beamforming coordination. The results compare the solver, optimal and non-optimal results. Due to the uplink-downlink operation, the algorithm utilizes the bisection search optimization approach. The macrocell first chooses a set of users to be served for the beamforming. Then, solver sum rate result is solved by searching for the optimal point where the iteration loop always return to feasible fixed point. Interestingly, the iteration depends on the user K, as plot (a) with converging faster than plot (b) with , this is due to the CSI exchange, and thus determines the computational complexity of the algorithm. Further, a search is done to achieve the optimal solution for (25), this is suppose to maintain a priority vector for user set, and produce the required QoS target in (28).
Then, Figure 9 presents the the ASE with number of BS antenna installed to achieve the target QoS. By comparing the two cases, the optimal beamforming is not able to meet the QoS target with than non-optimal beamforming. This is due to the fact that less transmit antennas can ensure QoS within a cell signal strength is not enough to generate severe co-channel interference. In contrast, for large BS antenna, the optimal Beamforming outperforms the non-optimal beamforming in achieving the target QoS. Thus suggesting that the optimal beamforming produced solution to coordinate with other macrocells to reduce co-channel interference and achieve the same target [36], and therefore improve the ASE without any lost to the max-min optimality.
In Figure 10, we compare the ASE, BS antenna and Ricean factor. Note that in the Ricean channel, one eigenvalue always pre-dominate. The figure depicts the optimal MBS and the strength of the LoS channel that can achieve the results can guarantee a rate-fairness for the BS. We observe the max-min optimal beamforming vectors require at least 40 BS antenna and Ricean factor to achieve ASE and avoid channel correlation. Thus with beamforming , the optimal will use antennas and but achieve same rate.
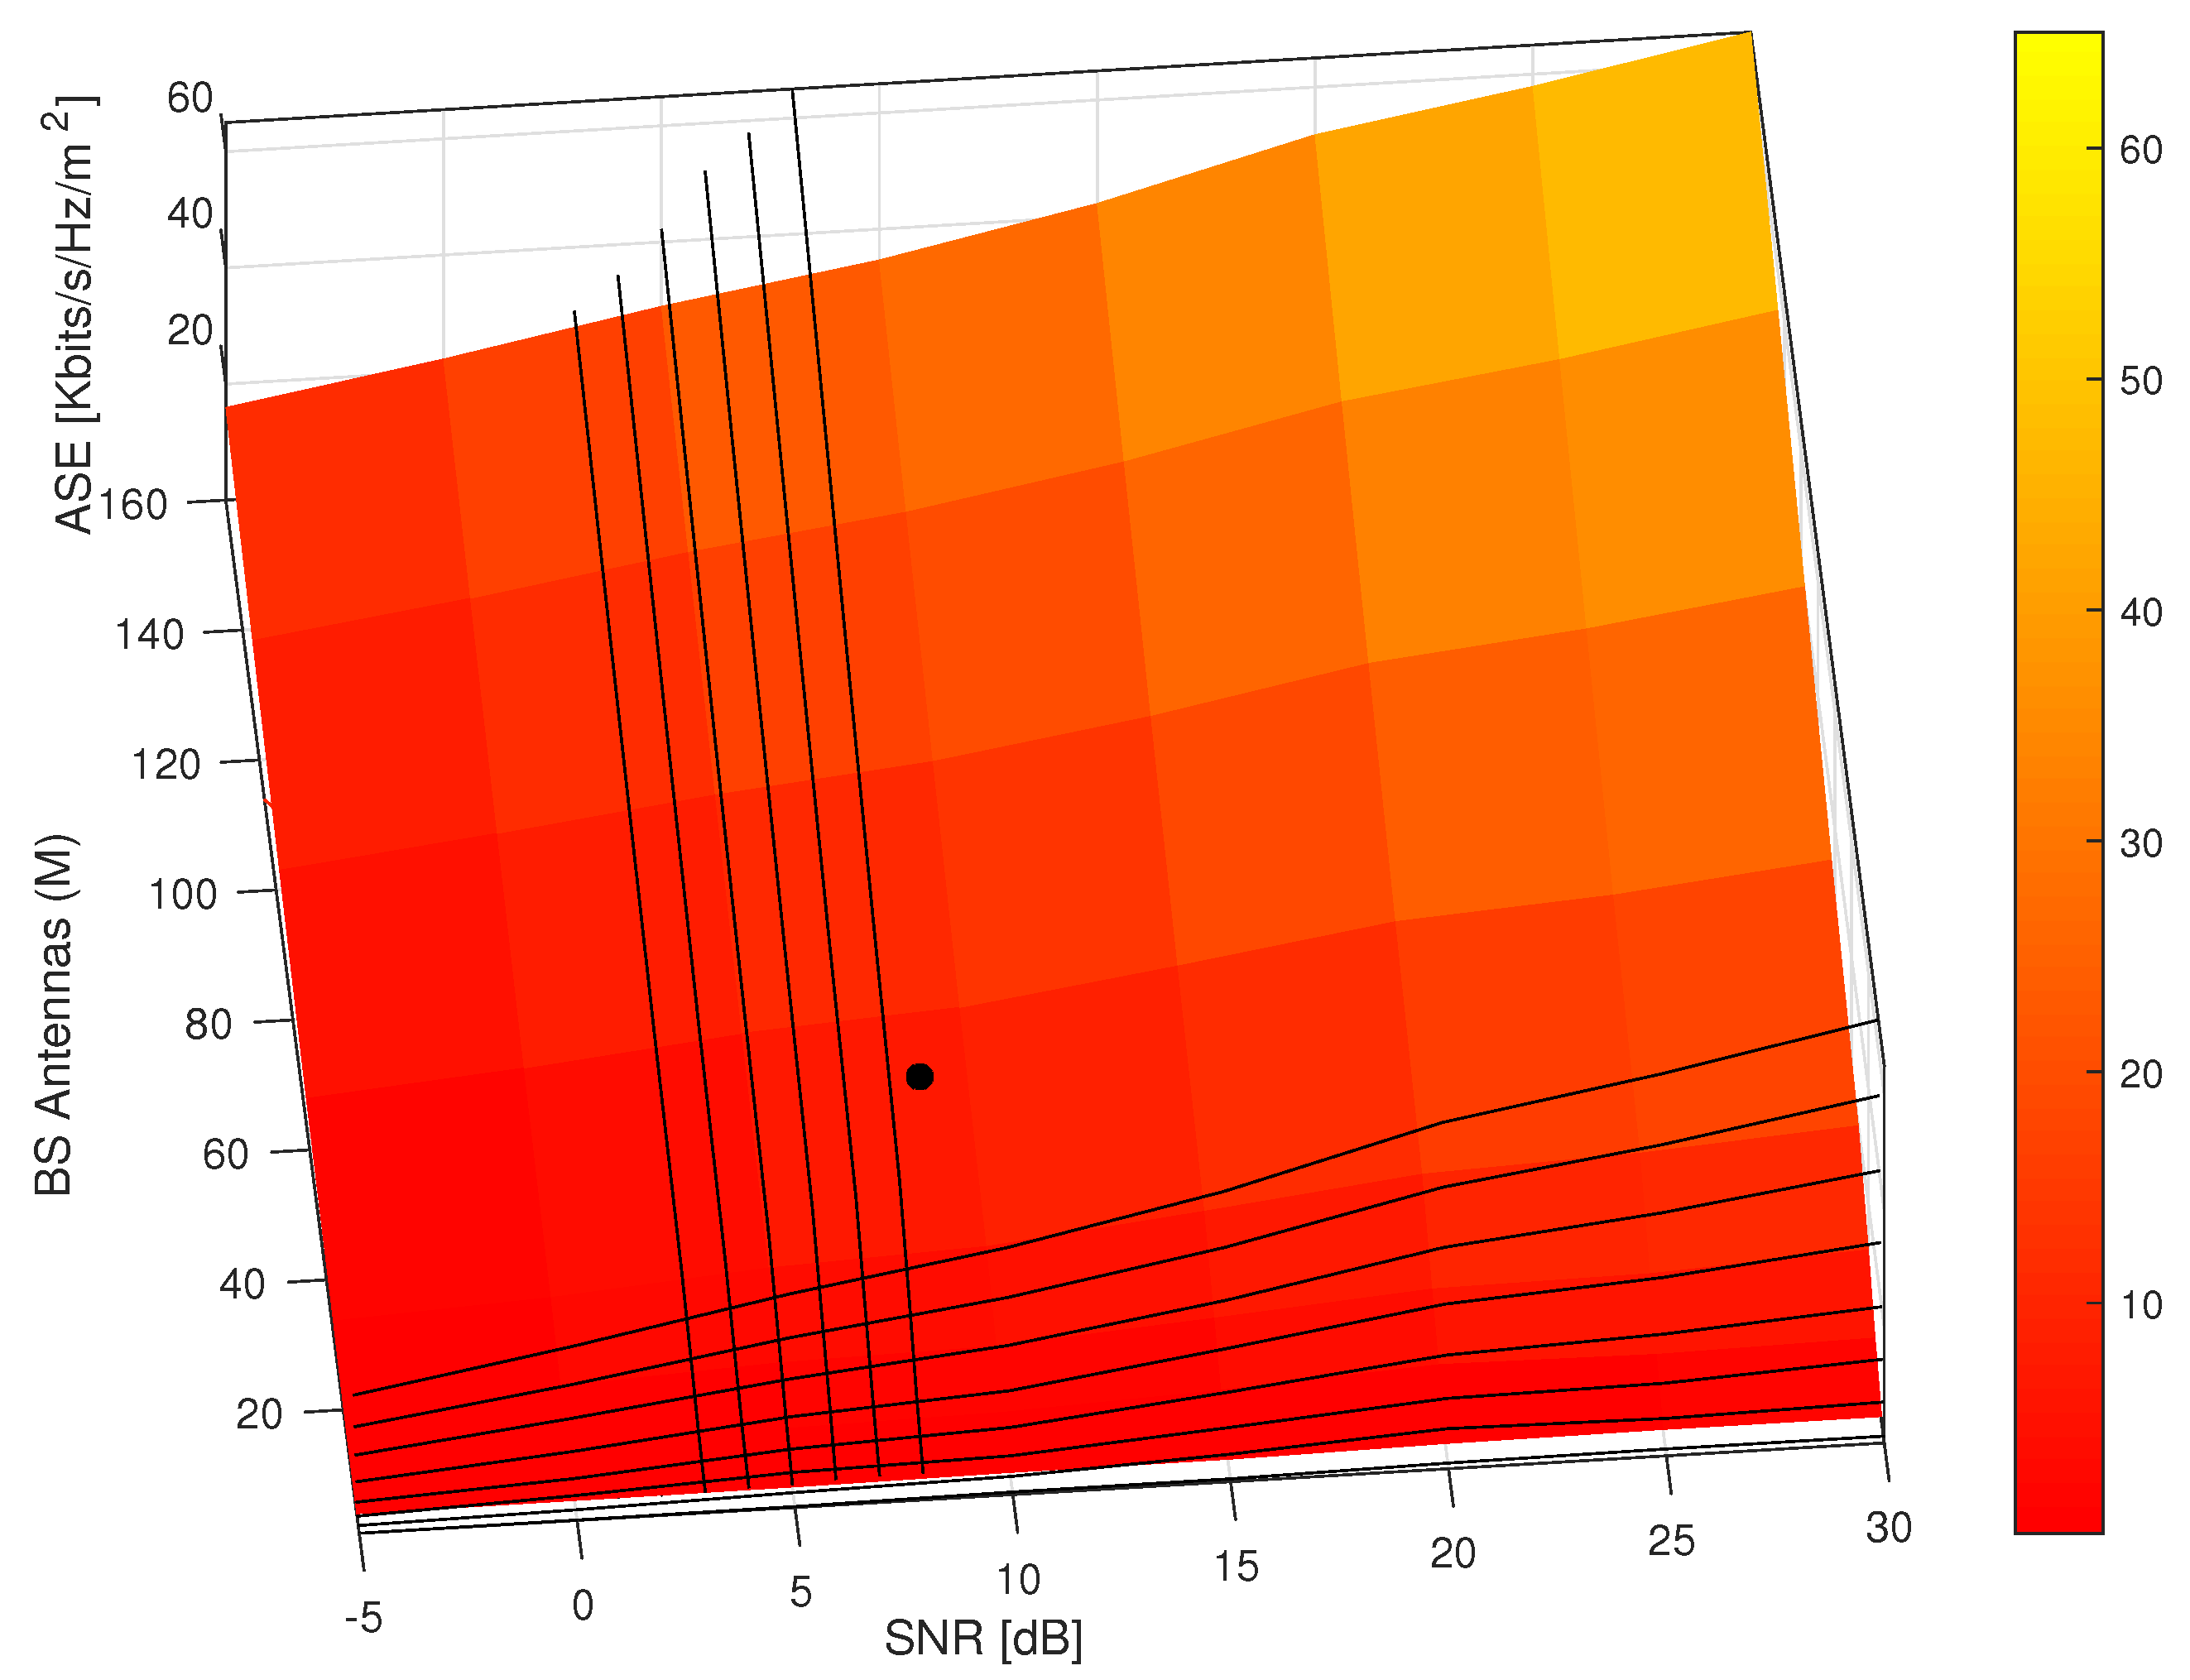
Then, ASE, BS antenna (M) and SNR are presented in Figure 11. Since transmit beamforming enables the transmit power to send the information, the optimal transmit power with (i.e., with antennas) will require less power than in but achieve same ASE. This means the served MBS uses full power while other MBSs use less transmit power. Similarly, the optimal SNR 9 dB will guarantee rate-fairness for the users served by the beamforming coordination.
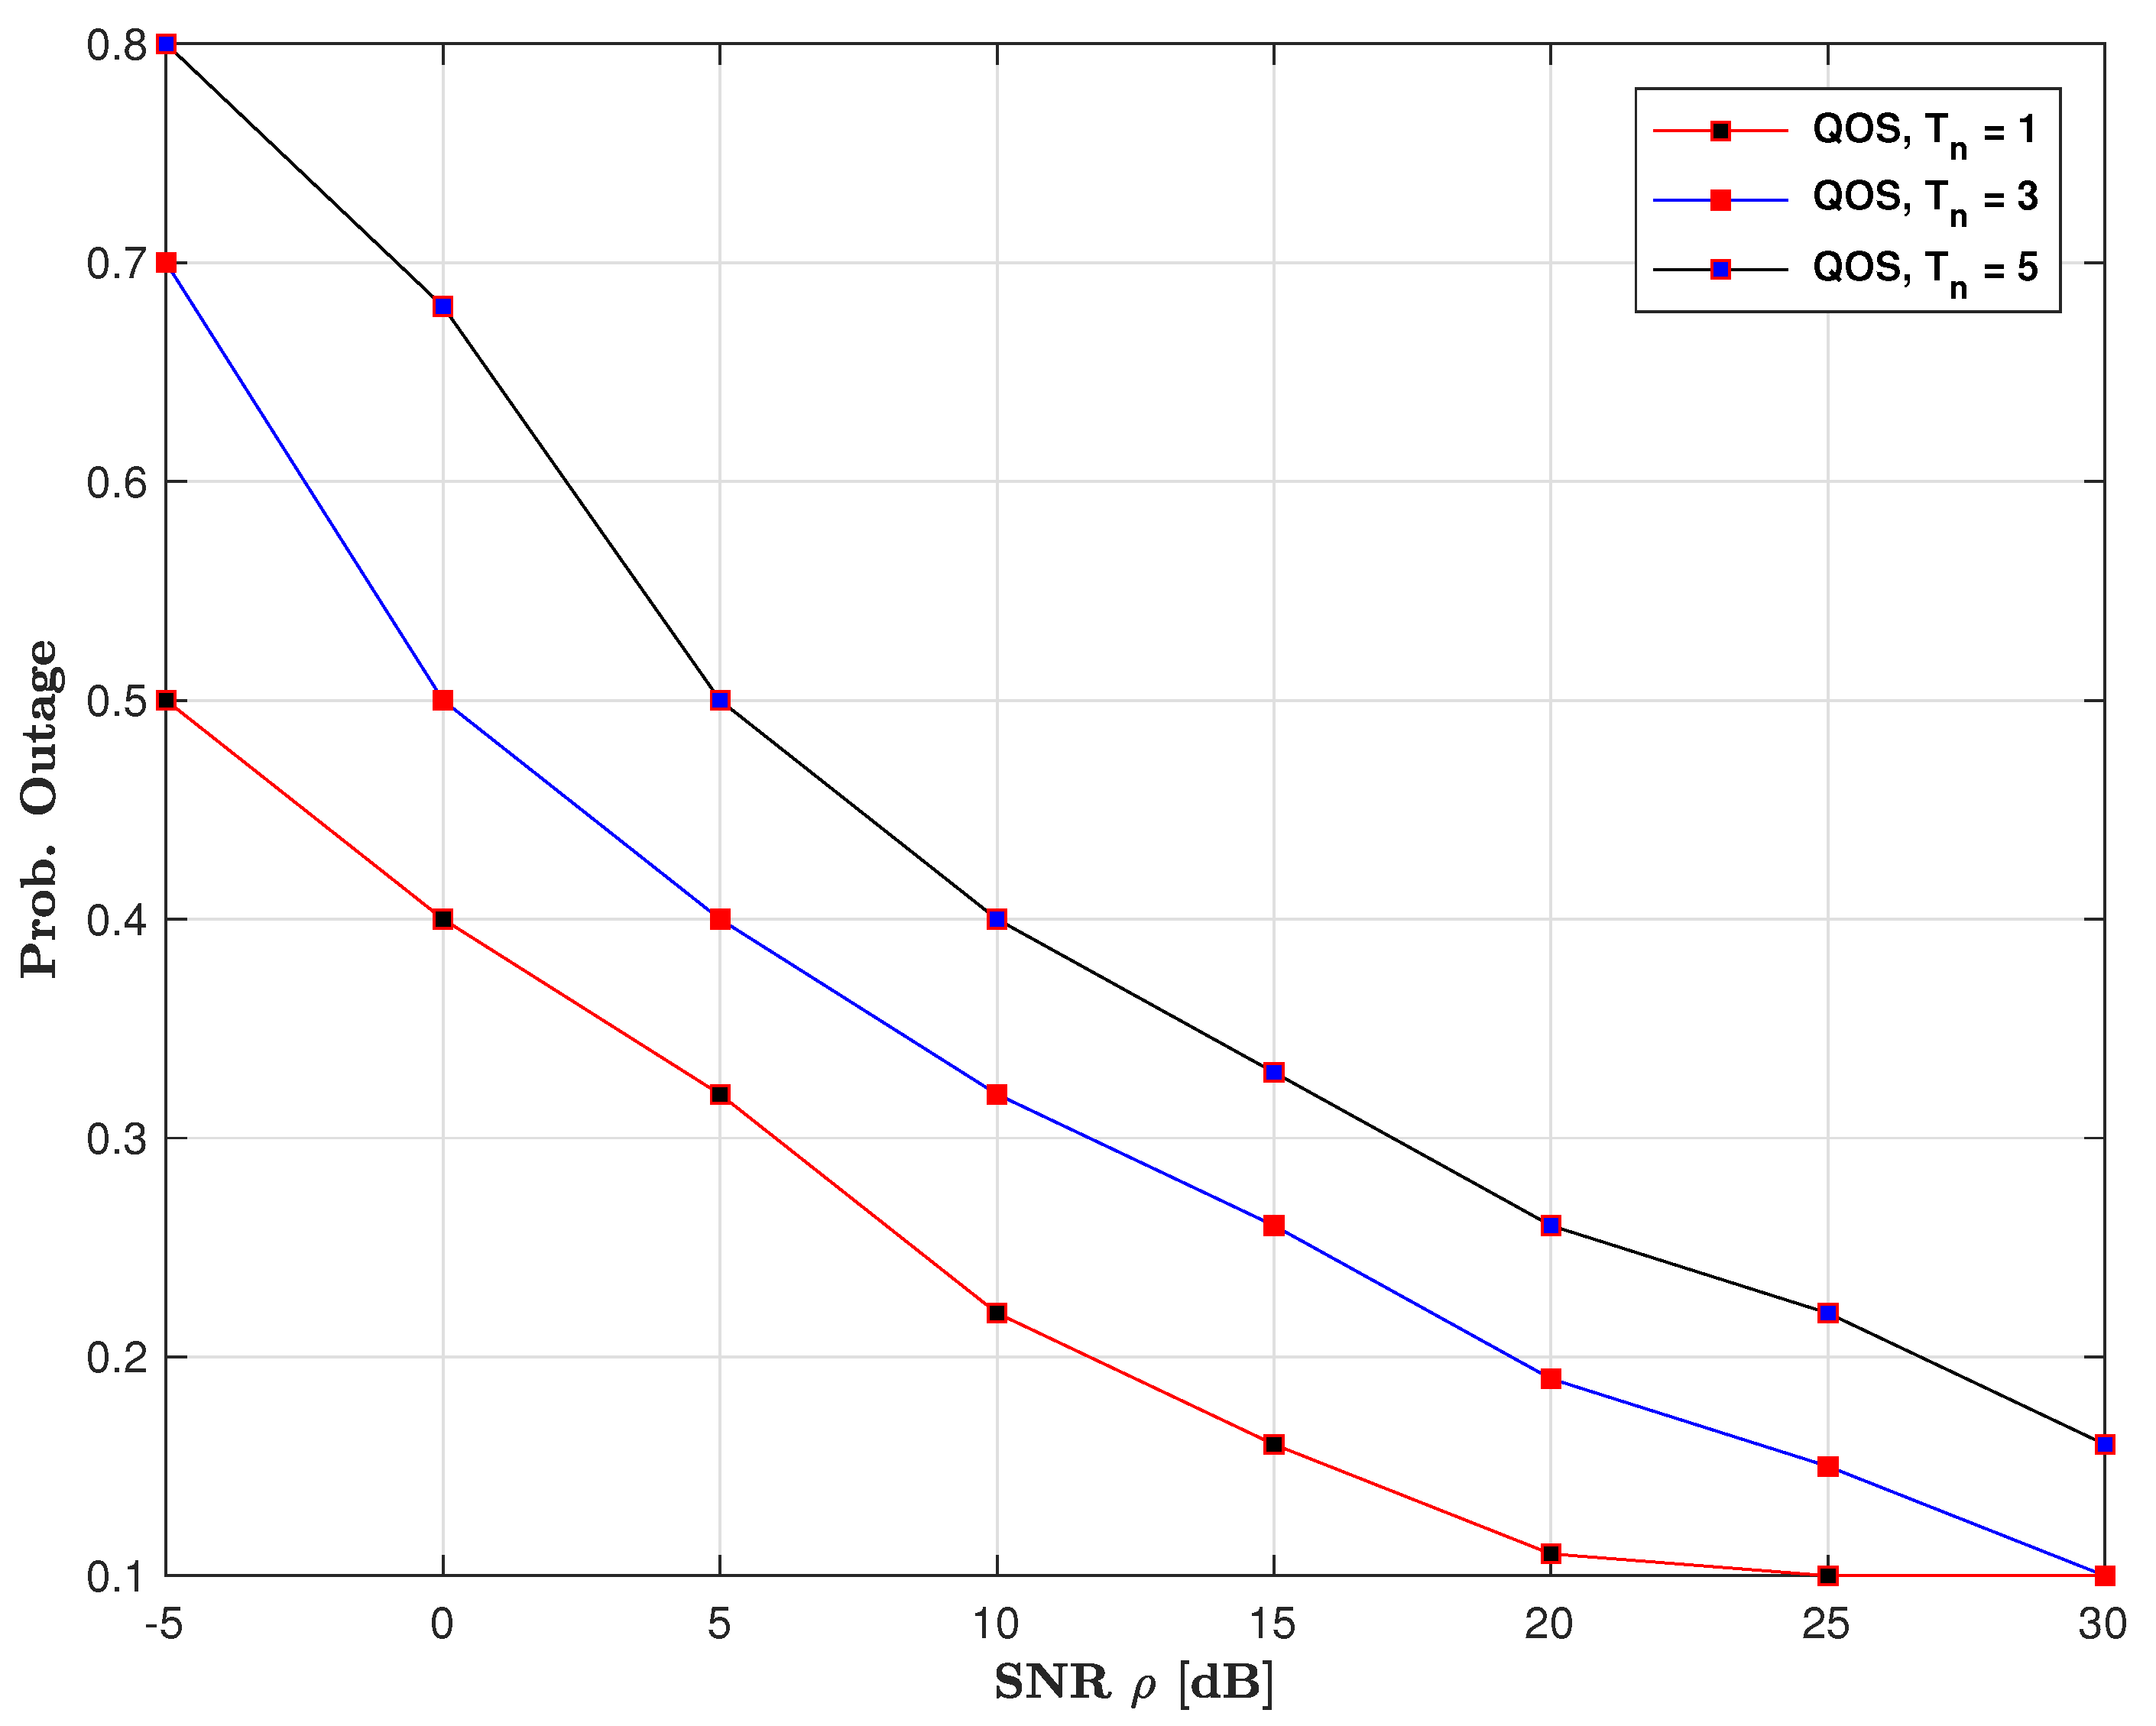
Finally, the probability of outage with the SNR for various cases of QoS is plotted in Figure 12. Based on the optimization problem (25), a lower QoS value means the small factor and lower power ensures a low SIR . Thus the user is located at the cell-edge of the macro cell and prone to outage. In contrast, the higher QoS values corresponds to large factor and high power, with the user located at the cell center. Since all the QoS cases almost approach convergence it indicates cell-edge effect. Also with low power at MBS, cell-center users are better served than cell-edge users, this is practically consistent.
7. Conclusions
This paper considers the stochastic geometry model for the geographical locations of all the BSs and users, and analyze the performance of massive MIMO HetNet. Two multi-path fadings are analyzed, that is Ricean fading for the intended signal and Rayleigh fading for the interfering signals. We provide a tractable expression of the typical user SIR in evaluating probability of coverage, outage probability and area spectral efficiency. Based on the derive expressions, numerical results show that the probability of coverage and outage probability converge for different user locations, Ricean factor and pathloss. Further, with efficient transmit beamforming coordination, we improve on the ASE performance. Thus, macro BS power control improves the cell-edge user performance, guarantees user scheduling rate-fairness and avoids strong channel correlation by the MBS antenna beamforming. Also, optimal values of BS antennas, transmission power and Ricean factor are obtained. The contributions in this work project massive MIMO HetNet for future network designs.
Author Contributions
The authors contributed equally in the paper. This work was was done by J.K.N.N. and C.A.M. checked and corrected the theoretical and simulation results.
Conflicts of Interest
The authors declare no conflict of interest.
References
- Heath, R.W., Jr.; Kountouris, M.; Bai, T. Modeling Heterogeneous Network Interference Using Poisson Point Process. IEEE Trans. Signal Process. 2013, 61, 4114–4126. [Google Scholar] [CrossRef]
- ElSawy, H.; Hossain, E.; Haenggi, M. Stochastic Geometric for Modeling, Analysis, and Design of Multi-Tier and Cognitive Cellular Wireless Networks: A Survey. IEEE Commun. Surv. Tutor. 2013, 15, 996–1019. [Google Scholar] [CrossRef]
- Jo, H.S.; Sang, Y.J.; Xia, P.; Andrews, J.G. Heterogeneous Cellular Networks with Flexible Cells Association: A Comprehensive Downlink SINR Anslysis. IEEE Trans. Wirel. Commun. 2012, 11, 3484–3494. [Google Scholar] [CrossRef]
- Yao, R.; Liu, Y.; Lu, L.; Li, G.Y.; Maaref, A. Cooperative Precoding for Cognitive Transmission in Two-Tier Networks. IEEE Trans. Commun. 2016, 64, 1423–1436. [Google Scholar] [CrossRef]
- Wildemeersch, M. Statistical Modeling and Analysis of Interference in Wireless Networks; University of Twente: Enschede, The Netherlands, 2013. [Google Scholar]
- Baccelli, F.; Blaszczyszyn, B. Stochastic Geometry and Wireless Networks: Volume I Theory. In Stochastic Geometry and Wireless Networks: Volume I Theory; Inria-00403039v1; NOW Publishers: Paris, France, 2009. [Google Scholar]
- Kountouris, M.; Pappas, N. HetNets and Massive MIMO: Modeling, Potential Gains and Performance Analysis. In Proceedings of the IEEE—APS Tropical Conference on Antennas and Propagation in Wireless Communications, Torino, Italy, 9–13 September 2013. [Google Scholar]
- Bai, T.; Heath, R.W., Jr. Analyzing Uplink and Rate in Massive MMO Systems Using Stochastic Geometry. IEEE Trans. Commun. 2016, 64, 4592–4606. [Google Scholar] [CrossRef]
- Li, C.; Zhang, J.; Andrews, J.G.; Letaief, B.K. User-Centric Intercell Interference Nulling for Downlink Small Cell Network. IEEE Trans. Commun. 2015, 63, 1419–1431. [Google Scholar] [CrossRef]
- Li, C.; Zhang, J.; Andrews, J.G.; Letaief, B.K. Success Probability and Area Spectral Efficiency in Multiuser MIMO HetNet. IEEE Trans. Commun. 2016, 64, 1544–1556. [Google Scholar] [CrossRef]
- Tepedelenlioglu, C.; Rajan, A.; Zhang, Y. Applications of Stochastic Ordering to Wireless Communications. IEEE Trans. Wirel. Commun. 2011, 10, 4249–4257. [Google Scholar] [CrossRef]
- Haenggi, M. A Geometric Interpretation of Fading in Wireless Networks: Theory and Applications. IEEE Trans. Inf. Theory 2008, 54, 5500–5510. [Google Scholar] [CrossRef]
- Hosseini, K.; Yu, W.; Adve, R.S. A Stochastic Analysis of Network MIMO Systems. IEEE Trans. Signal Process. 2016, 64, 4113–4126. [Google Scholar] [CrossRef]
- Björnson, E.; Sanguinetti, L.; Kountouris, M. Deploying Dense Networks for Maximal Energy Efficiency: Small Cells Meet Massive MIMO. IEEE J. Sel. Areas Commun. 2016, 34, 832–847. [Google Scholar] [CrossRef]
- Weber, S.; Andrews, J.G.; Jindal, N. An Overview of the Transmission Capacity of Wireless Networks. IEEE Trans. Commun. 2010, 58, 3593–3604. [Google Scholar] [CrossRef]
- Renzo, M.D.; Guidotti, A.; Corazza, G.E. Average Rate of Downlink Heterogeneous Cellular Networks over Generalized fading Channels: A Stochastic Geometry Approach. IEEE Trans. Commun. 2013, 61, 3050–3071. [Google Scholar] [CrossRef]
- Ding, M.; Wang, P.; Lopez-Perez, D.; Mao, G.; Lin, Z. Performance Impact of LOS and NLOS Transmissions in Dense Cellular Networks. IEEE Trans. Wirel. Commun. 2016, 15, 2365–2380. [Google Scholar] [CrossRef]
- Zhang, Q.; Yang, H.H.; Quek, T.Q.S.; Lee, J. Heterogeneous Cellular Networks with LoS and NLoS Transmissions—The Role of Massive MIMO and Small Cells. IEEE Trans. Wirel. Commun. 2017, 12, 7996–8010. [Google Scholar] [CrossRef]
- Yang, X.; Fapojuwo, A.O. Coverage Probability Analysis of Heterogeneous Cellular Networks in Rician/Rayleigh Fading Environments. IEEE Commun. Lett. 2015, 19, 1197–1200. [Google Scholar] [CrossRef]
- Zhuang, H.; Ohtsuki, T. A Model Based on Poisson Point Process for Analyzing MIMO Heterogeneous Networks Utilizing Fractional Frequency Reuse. IEEE Trans. Wirel. Commun. 2014, 13, 6839–6850. [Google Scholar] [CrossRef]
- Andrews, J.G.; Baccelli, F.; Ganti, R.K. A Tractable Approach to Coverage and Rate in Cellular Networks. IEEE Trans. Commun. 2011, 59, 3122–3134. [Google Scholar] [CrossRef]
- Peng, M.; Li, Y.; Quek, T.Q.S.; Wang, C. Device-to-Device Underlaid Cellular Networks Under Rician Fading Channels. IEEE Trans. Wirel. Commun. 2014, 13, 4247–4259. [Google Scholar] [CrossRef]
- Wang, L.C.; Liu, W.C.; Cheng, Y.H. Statistical Analysis of a Mobile-to-Mobile Rician Fading Channel Model. IEEE Trans. Veh. Technol. 2009, 58, 32–38. [Google Scholar] [CrossRef]
- Dhillon, S.H.; Ganti, K.R.; Baccelli, F.; Andrews, J.G. Modeling and Analysis of K-Tier Downlink Heterogeneous Cellular Networks. IEEE J. Sel. Areas Commun. 2012, 30, 550–560. [Google Scholar] [CrossRef]
- Nguyen, D.H.N.; Le, L.B.; le Ngoc, T. Multiuser Admission Control and beamforming Optimization Algorithms for MISO Heterogeneous Networks. IEEE Access 2015, 3, 759–773. [Google Scholar] [CrossRef]
- Feng, M.; Mao, S.; Jiang, T. Joint Frame Design, Resource Allocation and User Association for Massive MIMO Heterogeneous Networks with Wireless Backhaul. IEEE Trans. Wirel. Commun. 2018, 3, 1937–1950. [Google Scholar] [CrossRef]
- Karipidis, E.; Sidiropoulos, N.D.; Luo, Z.Q. Quality of Service and Max-Min Fair Transmit Beamforming to Multiple Co-channel Multicast Groups. IEEE Trans. Signal Process. 2008, 56, 1268–1278. [Google Scholar] [CrossRef]
- Davaslioglu, K.; Coskun, C.C.; Anyanoglu, E. Energy-Efficient Resource Allocation for Fractional Frequency Reuse in Heterogeneous Networks. IEEE Trans. Commun. 2015, 14, 5484–5497. [Google Scholar] [CrossRef]
- Kuhn, V. Wireless Communications over MIMO Channels: Applications to CDMA and Multiple Antenna Systems; John Wiley & Press: Hoboken, NJ, USA, 2006. [Google Scholar]
- Vergara, V.M.; Barbin, S.E. LOS and NLOS Components in MIMO Rice Fading Channels. In Proceedings of the IEICE—Proceedings of Asia—Pacific Conference, Yokohama, Japan, 7–10 December 2010. [Google Scholar]
- Gradshteyn, I.S.; Ryzhik, I.M. Integrals and Series. In Table of Integrals, Series, and Products, 7th ed.; Jeffrey, A., Zwillinger, D., Eds.; Elsevier Academic Press: London, UK, 2009. [Google Scholar]
- Mahmud, A.; Hamdi, K.A. A Unified Framework for the Analysis of Fractional Frequency Reuse Techniques. IEEE Trans. Commun. 2014, 62, 3692–3705. [Google Scholar] [CrossRef]
- Jeong, Y.; Quek, T.Q.S. Beamforming Optimization for Multiuser Two-Tier Networks. J. Commun. Netw. 2011, 13, 327–338. [Google Scholar] [CrossRef]
- Boyed, S.; Vandenerghe, L. Convex Optimization; Cambridge University Press: Cambridge, UK, 2004. [Google Scholar]
- Matskani, E.; Sidiropoulos, N.D.; Luo, Z.Q.; Tassiulas, L. Convex Approximation Techniques for Joint Multiuser Downlink Beamforming and Admission Control. IEEE Trans. Wirel. Commun. 2008, 7, 2682–2693. [Google Scholar] [CrossRef]
- Zhu, J.; Yang, H.C. Low-Complexity QoS-Aware Coordinated Scheduling for Heterogeneous Networks. IEEE Trans. Veh. Technol. 2017, 7, 6596–6601. [Google Scholar] [CrossRef]
- Schubert, M.; Boche, H. Iterative Multiuser Uplink and Downlink Beamforming under SINR. IEEE Trans. Signal Process. 2005, 7, 2324–2334. [Google Scholar] [CrossRef]
- Bacha, M.; Wu, Y.; Clerckx, B. Downlink and Uplink Decoupling in Two-Tier Heterogeneous Networks with Multi-Antenna Base Stations. IEEE Trans. Wirel. Commun. 2017, 5, 2760–2775. [Google Scholar] [CrossRef]
- Atzen, A.; Arnau, J.; Debbah, M. Fractional Pilot Reuse in Massive MIMO Systems. In Proceedings of the IEEE International conference on Communication Workshop (ICCW), London, UK, 8–12 June 2015. [Google Scholar]
Figure 1.
Models the PPP design with the understudy cluster wrapped around.

Figure 2.
Design of a two-tier HetNet with transmission path.

Figure 3.
Convergence of the infinite series with values of Ricean factor.

Figure 4.
Probability of coverage as function of quality of service with (.

Figure 5.
Probability of coverage with SIR comparing cases of pathloss exponent.

Figure 6.
Plotting outage probability versus SIR comparing various cases of Ricean factor.

Figure 7.
Outage probability with QoS target, comparing different Rate values.

Figure 8.
Shows convergence of the optimization. (a) for ; (b) for .

Figure 9.
Plot of the Area Spectral Efficiency with BS antenna comparing cases of QoS targets.

Figure 10.
Plot of the ASE with the BS antenna (M) and Ricean factor.

Figure 11.
Performance of the ASE versus BS antenna (M) and SNR [dB].

Figure 12.
Plot Probability of outage with the SNR=, comparing QoS cases.


Table 1.
Summary of Related Works.
| Study | Theorem | Objectives | Propagation | Reference |
|---|---|---|---|---|
| HetNet | Stochastic | Throughput EE, ASE, SIR Distribution Coverage and Outage probability | Rayleigh | [3,7,9][10] M[11,15,16][18,20] M[21][25,26] M[28] |
| Ricean | [12,19][22,23] D |
M denotes Massive MIMO systems approach; D denotes Device-to-Device communications approach.
Table 2.
Algorithm for Max-Min Weighted SIR for Macrocell.
| Initiate , , |
| For until convergence, iterate below steps |
| repeat |
| 1. From (26), update the uplink transmit power q[t + 1] |
| 2. Update the transmit beamforming matrix , as given (27): |
| 3. Update the transmit power , as given (26): |
| untilconvergence |
Table 3.
Table of simulation Parameters for the Heterogeneous Network.
| Parameter | Values |
|---|---|
| Pathloss exponent | 2.7, 3.7, 5.7 |
| Distance dependent-pathloss (LoS) | |
| Distance dependent-pathloss (NLoS) | |
| shadowing standard deviation | 8 dB |
| Ricean factor | 0, 2, 5 |
| users K | 32 |
| BS antennas M | 128 |
| number of macro BSs | 1, 4 |
| macro BS transmit power | 30 dBm |
| number of femto BS | 5 |
| femto BS transmit power | 3 dBm |
| minimum distance to macro BS | 0.035 Km |
| maximum distance to macro BS R | 0.3 Km |
© 2018 by the author. Licensee MDPI, Basel, Switzerland. This article is an open access article distributed under the terms and conditions of the Creative Commons Attribution (CC BY) license (http://creativecommons.org/licenses/by/4.0/).
Share and Cite
MDPI and ACS Style
Nyarko, J.K.N.; Mbom, C.A. A Performance Study of Massive MIMO Heterogeneous Networks with Ricean/Rayleigh Fading. Electronics 2018, 7, 79. https://doi.org/10.3390/electronics7060079
AMA Style
Nyarko JKN, Mbom CA. A Performance Study of Massive MIMO Heterogeneous Networks with Ricean/Rayleigh Fading. Electronics. 2018; 7(6):79. https://doi.org/10.3390/electronics7060079
Chicago/Turabian StyleNyarko, James Kweku Nkrumah, and Christian Ango Mbom. 2018. "A Performance Study of Massive MIMO Heterogeneous Networks with Ricean/Rayleigh Fading" Electronics 7, no. 6: 79. https://doi.org/10.3390/electronics7060079
Note that from the first issue of 2016, this journal uses article numbers instead of page numbers. See further details here.