Detectors on Edge Nodes against False Data Injection on Transmission Lines of Smart Grid

1
College of Computer, National University of Defense Technology, Changsha 410073, China
2
Department of Electronic Information and Electrical Engineering, Changsha University, Changsha 410022, China
*
Author to whom correspondence should be addressed.
Electronics 2018, 7(6), 89; https://doi.org/10.3390/electronics7060089
Submission received: 23 April 2018
/
Revised: 28 May 2018
/
Accepted: 31 May 2018
/
Published: 4 June 2018
(This article belongs to the Special Issue Cyber-Physical Systems)
Abstract
:False data injection (FDI) attack is a hot topic in large-scale Cyber-Physical Systems (CPSs), which can cause bad state estimation of controllers. In this paper, we focus on FDI detection on transmission lines of the smart grid. We propose a novel and effective detection framework to identify FDI attacks. Different from the previous methods, there are multi-tier detectors which utilize edge nodes such as the programmable logic controllers (PLCs) instead of the central controller to detect attacks. The proposed framework can decrease the transmission time of data to reduce the latency of decisions because many sensory data need not be transmitted to the central controller for detection. We also develop a detection algorithm which utilizes classifiers based on machine learning to identify FDI. The training process is split from every edge node and is placed on the central node. The detectors are lightweight and are properly adopted in our detection framework. Our simulation experiments show that the proposed detection framework can provide better detection results than the existing detection approaches.
1. Introduction
With the tight combination of information technology and physical systems, many vulnerabilities have been exposed. Especially, attackers can utilize the vulnerabilities of wireless network to intrude into the CPSs, causing the vast destruction of physical systems, such as FDI attack [1].
FDI attack is an extremely hot topic for malicious attackers and defenders because of its easy implementation and great destruction force. An FDI attack can be launched by directly modifying data of sensors or falsifying sensory data returned to the controllers, causing the wrong state estimation and improper operations. Many FDI attack strategies in different realms have been described in previous research such as FDI attacks in smart grid, FDI attacks in railway, and FDI attacks in nuclear power stations.
In this paper, we focus on the detection of FDI attacks on transmission lines of the smart grid. An FDI attack on transmission line refers to the action in which a smart attacker modifies a part of sensory data to cause the false evaluation of line states such as transmission line outage mask attacks [2]. Transmission line states estimated based on related sensory data are critical to maintain the normal running of smart grid. Each-tier controllers need to distribute energy to different lines based on the states of lines. If a line is disconnected, the corresponding current will be automatically transmitted by other lines, which may increase the possibility that other lines are also disconnected when the controller does not know the line has been disconnected. The 2003 northeastern blackout in the United States has shown that outages of a few lines can cause a cascading failure and lead to a large-scale blackout. The existing works [3,4] also demonstrated the importance of integrity of information about line state.
Considering the importance of line state and the possibility of data modification, many mechanisms have been proposed to detect line outages and identify FDI attacks [5,6,7,8,9,10,11,12]. For example, in [10], the method based on social users information was described, but, further development was required. The residual based detectors [7] have been used widely in power systems, where the detector needs to utilize the topology of lines and the whole sensory data. In [8,9], effective methods were proposed to detect FDI attacks on transmission line states. The method in [8] evaluated the equivalent impedances of transmission lines to identify FDI attacks. In [9], a method based on Kalman Filter was proposed.
However, there mainly exist three shortages in the previous methods, including (i) many effective line outage detection algorithms such as [5] did not consider the camouflage of sensory data; (ii) many effective FDI detection methods such as [11,12] cannot be directly applied in the realm of transmission lines, for example, in [11], when the changes in demands are seen as commands, the number of commands will be extremely large and the detector may not effectively detect attacks with limited ability; (iii) many FDI detectors are placed in the central controller. The methods completely depend on the central nodes and do not pay attention to reducing the latency of making decisions of sub-controllers. Control signals from some smart sub-controllers need to wait for the results of FDI detection, which causes some critical operations to be executed with latency. Although some distributed detection frameworks have been proposed and can achieve significant reductions in communication overhead rather than the central detection framework, the large amount of extra resource needs to be used to construct agents. For example, in [13], a distributed detection framework was described, where lines can be divided into multiple classes and multiple agents can be used to detect the exceptions of different classes, however, a large amount of resource is needed to construct agents.
Considering the above three shortages, the edge computing [14,15] brings a new view and we propose a novel and effective detection framework on edge nodes to identify FDI attacks on transmission lines for developing line outage detection. Some edge nodes with the computation ability can be used to analyze data. For example, in the smart grid, substations and PLCs can be used as the edge nodes to analyze sensory data so that the smart edge nodes can directly make decisions to operate related components. Our detection framework is composed of multi-tier detectors which are placed on edge nodes (sub-controllers). The proposed framework can earlier detect bad data because of the reduction of communication time. Considering edge nodes have less computing resource, we also develop a lightweight detection method for detectors. The method uses classifiers based on machine learning techniques to identify bad data, and the training process of data is split from edge nodes and placed on the central node. The simulation on IEEE 14-bus and 39-bus test systems shows that our detection framework can effectively identify FDI attacks with higher accuracy, lower false negative ratio, and lower false positive ratio than the existing detectors.
2. Preliminaries
In this section, we first introduce the structure of the smart grid, and then review the threat model about FDI.
2.1. The Structure of Smart Gird
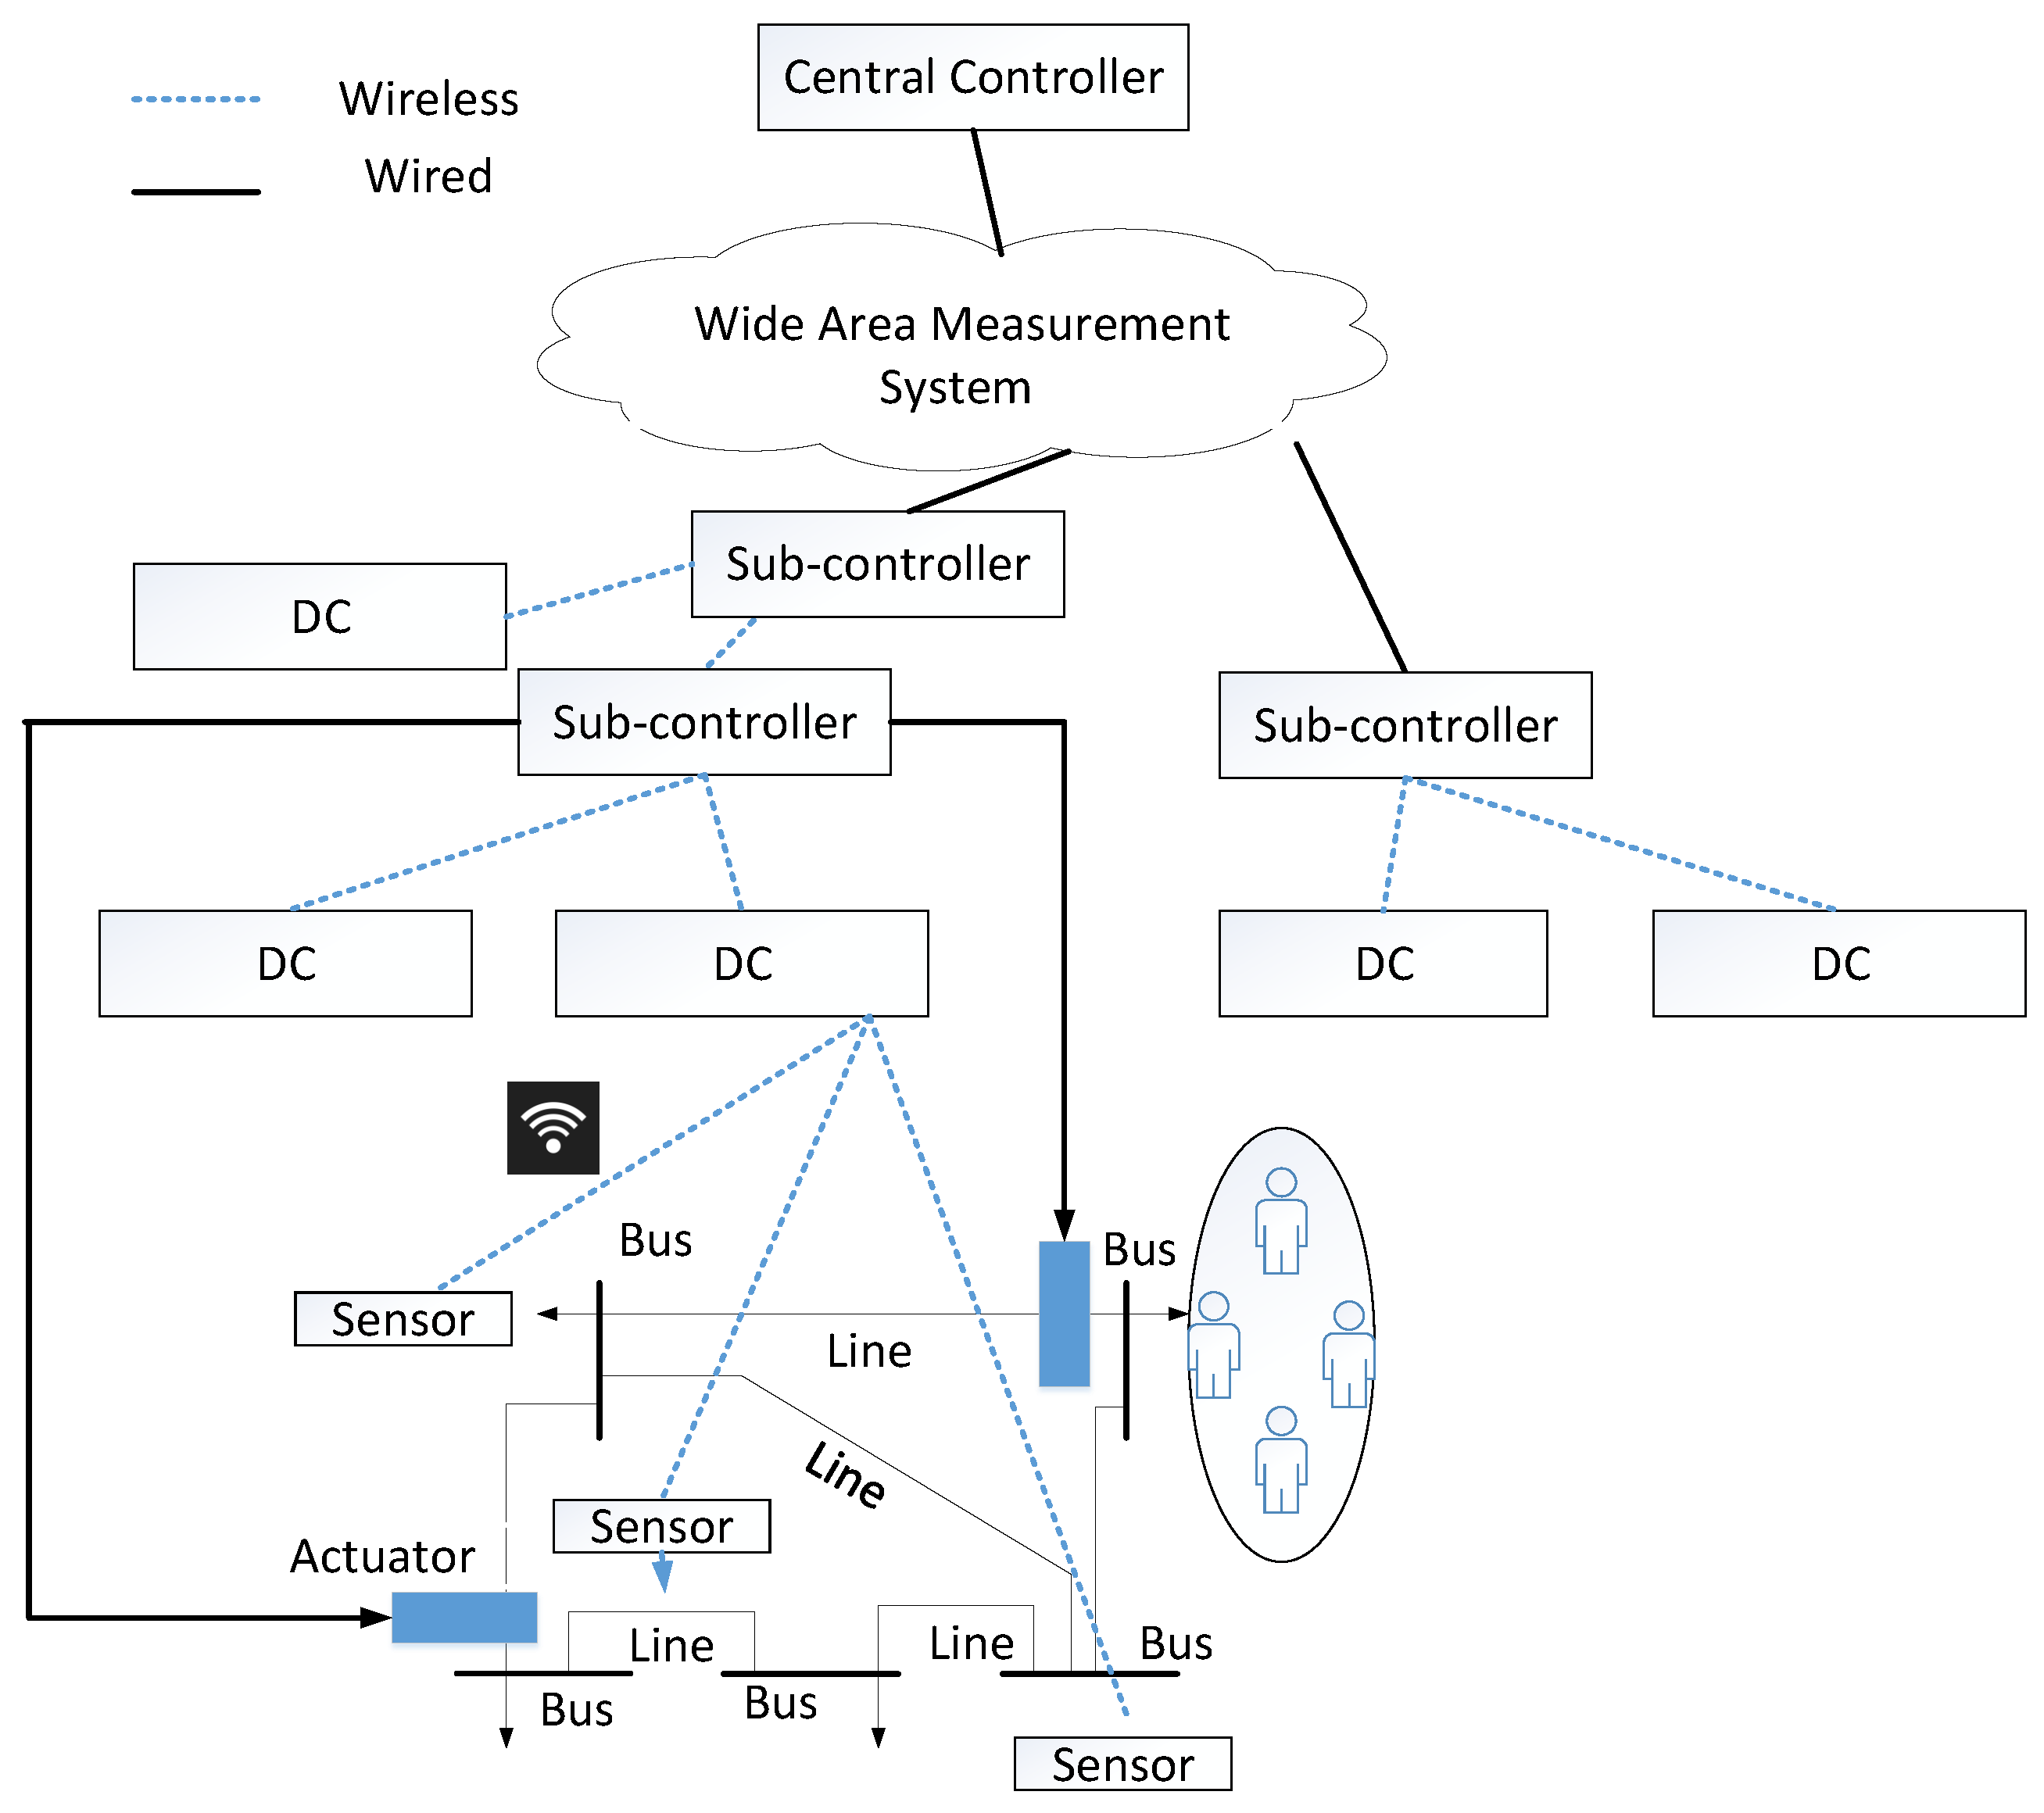
Figure 1 shows the simplified structure of the smart grid. The smart grid is comprised of the central controller, a set of data concentrators (DCs), a set of sub-controllers, many actuators, a set of sensors, many buses with generators and loads, and lots of transmission lines. These components can be divided into three levels including physical level, monitoring level, and control level. The relationship of three levels is shown in Figure 2. The monitoring level measures the states of components of the physical level and sends sensory data to the control level. The control level issues signals to manipulate the physical components based on sensory data from the monitoring level. Next, we describe three levels, respectively.
Physical level is composed of buses and lines. The bus with the generators injects power into the grid and the bus with the loads consumes power. A line transmits power between two buses.
Under normal situations, the sum of loads are equal to the generation from generators, which means
where means the demands of bus and denotes the generation of bus . means the number of buses.
Moreover, as described in [16], a linear model is used, where between bus and bus satisfies
where S is the Shift Factor Matrix of the power grid. U and V are Bus-generator incidence matrix and Bus-load incidence matrix, respectively. means the line flow vector. denotes the load measurements. is the generation vector.
Because of the physical characters of transmission lines, when the power flow becomes larger and the temperature of lines will be higher, the lines may be broken and the corresponding power flow will be transmitted by other lines. The situation can also lead to the disconnection of other lines such that a cascading failure occurs. Therefore, obtaining the accurate information of the line state is very important for the controllers.
Monitoring level is comprised of sensors and DCs. Sensors monitor the physical process and transmit sensory data to the corresponding DCs each period of time. The measured data includes bus phases, generation and load of buses, power flow of lines, injected power of buses and so on. DCs are responsible for collecting data from sensors and transmitting sensory data to the corresponding sub-controllers. At last, the data is transmitted from the sub-controllers to the central controller by the wide area measurement system.
Control level is composed of the central controller, sub-controllers, and actuators. The central controller and sub-controllers can analyze the sensory data to evaluate the current system states. Based on the current system state, the central controllers and sub-controllers can issue commands to operate the actuators. For example, when a line is just broken, the sub-controllers and central controller need to redistribute power. In many systems, the sub-controller is near the physical components and there may exist the distant distance from the central node because of the large scale. Considering the possibility of FDI, the detector is needed. Traditionally, a detector is placed on the central node because of the comprehensive sensory data and enough computing capability. However, considering some operations from the sub-controllers such as load shedding and isolation should be decided with low latency, the strategy may bring some troubles because the sub-controllers need to wait for the results from detectors.
2.2. Threat Model
For the attackers, we make assumptions as follows: (i) an attacker can utilize the vulnerabilities of wireless network to modify sensory data returned to the controller; (ii) as described in [2], attackers mainly modify power flow of line between bus and bus , , and the load measurement of bus , , to mask the real state of transmission lines; (iii) the residual based detector [7] is used on the central controller and the detector considers that the normal data should satisfy
where l is a fix threshold. .
Figure 3 shows the attack model. Attackers intrude into the wireless network. When sensory data f and d are sent from the sensors or DCs to the sub-controllers, data are modified as and . Then controllers obtain the false data and submit it to the detector. The detector detects data and returns results to controllers.
The false data injection attacks can be classified into two classes [16]:
- (1)
- Random Attack: attackers randomly inject false data;
- (2)
- Smart Attack: attackers inject constructed bad data. The bad data satisfies
When (4) is satisfied, the detection performance of many detectors will be degraded [7].
3. Our Detection Framework
In this section, we first describe the detection framework. Then, we depict the algorithm for the detector on every edge node. Finally, we analyze the performance of the proposed framework.
3.1. Structure of Framework
The core of the detection framework is that during the process of sensory data transmission, some data is directly detected by the sub-controllers and sub-controllers do not wait for the results from the detector of the central controller to make decisions. To obtain the target, we can utilize edge nodes with low computing ability to detect false data, such as PLCs. In Figure 4, we describe the proposed detection framework, where a new component called S-CLASSIFIER which utilizes the storage and computing resource of the corresponding sub-controller is designed. Different from the previous methods such as the residual based detectors, every sub-controller can know more quickly whether sensory data has been modified, and makes decisions to control the power grid.
An S-CLASSIFIER is composed of four components: an S-DC, an aggregator, a link indicator, and a detector. Next, we describe their functions, respectively.
Link Indicator maintains a vector , where means the number of lines. When the line is connected, , otherwise, . Every time the lines have a disconnection or a new connection, related information will be updated by the central controller.
Aggregator receives a part of sensory data from the corresponding S-DC and processes the line information as a vector based on the information of link indicator. Then, the aggregator sends vectors of different lines to the detector. In the next subsection, we will elaborately describe how to process data and which data should be sent.
Detector in an S-CLASSIFIER is responsible for classifying data from the aggregator as bad data or good data. When bad data is identified, the detector issues alarms to the related components in the sub-controller and also transmits alarms to its last-tier S-CLASSIFIER. The parameters of the detector can be updated based on the changes of topology. When the line topology has a change, the central controller will update parameters of the detector in every S-CLASSIFIER. The parameters are transmitted from its last-tier S-DC to its S-DC and then the S-DC sends the parameters to the detector.
S-DC is responsible for receiving sensory data from the corresponding DCs and transmitting information between two-tier S-CLASSIFIERs. The low-tier S-DC transmits the received sensory data and alarms to the last-tier S-DC. The last-tier S-DC can transmit the update of parameters from the central controller to its next-tier S-DC.
3.2. Detector Construction
The core of the detector is a classifier, which receives the input from the corresponding aggregator and validates whether the input is good or bad.
We use machine learning techniques to obtain a classifier for every detector in S-CLASSIFIERs. Due to the low computing capability, the detector in a S-CLASSIFIER cannot buffer and process a large amount of data. Therefore, the designed classifier should only identify the current data without depending on other previous data. To obtain the target, we split the training process from the detector and place it in the central controller. The central controller collects all of the sensory data and can train a specific classifier for every detector. The computing model is written into the firmware of sub-controllers. When the typology has a change, parameters of the classifier are updated by the detector from the central controller. Because in a stable grid the typology can remain invariant for a long time, the update of parameters will not be frequent. Defenders need to select proper machine learning techniques to train data such as Support Vector Machine (SVM), however, technique like K-Nearest Neighbor (KNN) is improper because the detector needs to utilize the history data to obtain the detection result. Next, we use the classifier based on SVM as an example to illustrate the detector construction.
For any detector on the sub-controller, the central controller trains the related sensory data to get a hyperplane
where x is the trained sample. Vector and constant are the parameters of the detector.
The detector will use input data to compute . If the value is larger than 0, can be seen as the normal data. Otherwise, an alarm is issued.
Next, we describe how the aggregator of the sub-controller obtains a trained or detected sample .
Considering there exists relevance among the power flow of the line, the voltage of two buses, the loads of two buses, and the state of line connection, we take sensory data about the line as the vector. We can obtain =
subject to
where denotes the phase angle of the bus. is the set of lines that are managed by the S-CLASSIFIER. ,.
A sub-controller only manages lines whose information can be completely collected. If the lower-tier sub-controllers of a sub-controller can completely collect the information of a line, then the sub-controller does not manage the line. If the information about a line is incomplete, for example the load of a bus is transmitted to another edge node, the sample cannot be obtained by the current edge node and related data will be sent to its last-tier sub-controller until the sub-controller can first collect all information of the sample. Then the sub-controller manages the line. Figure 5 shows an example to illustrate the sample construction in different detectors. The detector in the S-CLASSIFIER only processes sample . The detector in the S-CLASSIFIER only processes sample . The detector in the S-CLASSIFIER only processes sample .
3.3. Performance Analysis
Taking Figure 5 as an example, we analyze the performance of the proposed detection framework including the time latency that a sub-controller makes decisions, the amount of transferred data, and the extra needed resource. The time latency that the sub-controller makes decisions refers to the duration from the time that data is obtained by the sub-controller to the time when the detection results are obtained by the sub-controller, denoting as .
Time Latency of making decisions. A sub-controller needs to consider whether the sensory data that is used to evaluate system state is normal. Therefore, a new operation from the sub-controller needs to wait for the detection results of the integrity of sensory data.
For a central detection framework, we assume that every injected bad data can be identified with the same executing time . Besides, the information transmission needs to cost some time. means the time of data transmission between the node and the node. Therefore, for sub-controllers, the time latency of making decisions is
For the proposed framework, we use to denote the execution time of the detector. For a sub-controller, the time latency of making decisions is
Due to the simplicity of hyperplane computing, compared with the transmission time, the execution time is very short. Comparing the time latency of two modes, we can know the detection framework on edge nodes can effectively reduce the time latency of making decisions of sub-controllers. Especially, the closer the sub-controller is to the sensors (a lower-tier sub-controller), the lower the time cost.
The Amount of Transferred Data. For a central detection framework, the whole sensory data is transferred to the central controller, and then detection results are returned to different sub-controllers. For the proposed detection framework, when sensory data is transmitted from the sensors to the central controller, sub-controllers can directly read and analyze the data. Different from the central mode, a sub-controller can produce alarms and send them to the last-tier sub-controllers. However, the central modes transmit the same number of alarms to different sub-controllers. Therefore, compared with the central mode, there does not exist extra data transferred by the proposed framework.
Extra Resource. Our detection framework is comprised of four components. However, some functions such as link information and data collector exist in the original sub-controller. Because detector and aggregator only use addition operation and multiplication operation and every sub-controller detects a part of lines, the higher-tier sub-controllers need not verify the whole sensory data and enough computing resource can be provided by the sub-controllers.
4. Numerical Results
In this section, several simulations are given to evaluate the effectiveness of the detector. We compare our method with the residual based detector and the central SVM detector to illustrate the effectiveness, where the central SVM detector utilizes sensory data from different sub-controllers to construct a hyperplane on the central node to detect bad data and trained/test samples are the same as the proposed detector.
In our effectiveness evaluations, we choose the IEEE 14-bus test system and IEEE 39-bus test system [12] as the benchmarks.
4.1. Simulation on IEEE 14-Bus Test System
For IEEE 14-bus test system, there are 14 buses and 20 lines with changes in demands as shown in Figure 6. The buses and lines are divided into two areas, and sensors and PMUs in an area transmit sensory data to the same DC and sensory data from different areas are transmitted to different DCs. Two DCs transmit data to two different sub-controllers, sub-1 and sub-2. The two sub-controllers directly connect with the central controller (cc). We assume that the system can be fully measured by sensors including injected power of every bus, voltage phase of every bus, and power flow in every line. The sensory data is simulated using MATPOWER as described in [2]. Different load variations are generated according to an Ornstein-Uhlenbeck process [17] to account for the dynamic and stochastic behavior of power demand in the grid over a period of time. We use Java to simulate three detectors in controllers. Six thousand attacks including random attacks and smart attacks are launched as the trained samples. Six thousand normal data are also used as normal samples. One thousand attacks and 1000 normal situations are used as the test samples.
For evaluating the performance of detection tasks, three metrics are defined as follows.
Accuracy: the ratio of the accurate classification to all situations in test cases.
False Positive Ratio (FP): the ratio of normal situations that are considered as attacked situations to all normal situations in test cases.
False Negative Ratio (FN): the ratio of attack situations that are considered as normal situations to all attack situations in test cases.
In Table 1, we show the detection results of detectors based on SVM classification, including the central SVM detector and SVM based detectors on edge nodes. We can clearly observe that the accuracy of detection results on every edge node is higher than the central SVM detector. Simultaneously, the lower false negative ratio is obtained by detectors on edge nodes. Comparing the false positive ratios of two methods, we can find that detectors on edge nodes get better results.
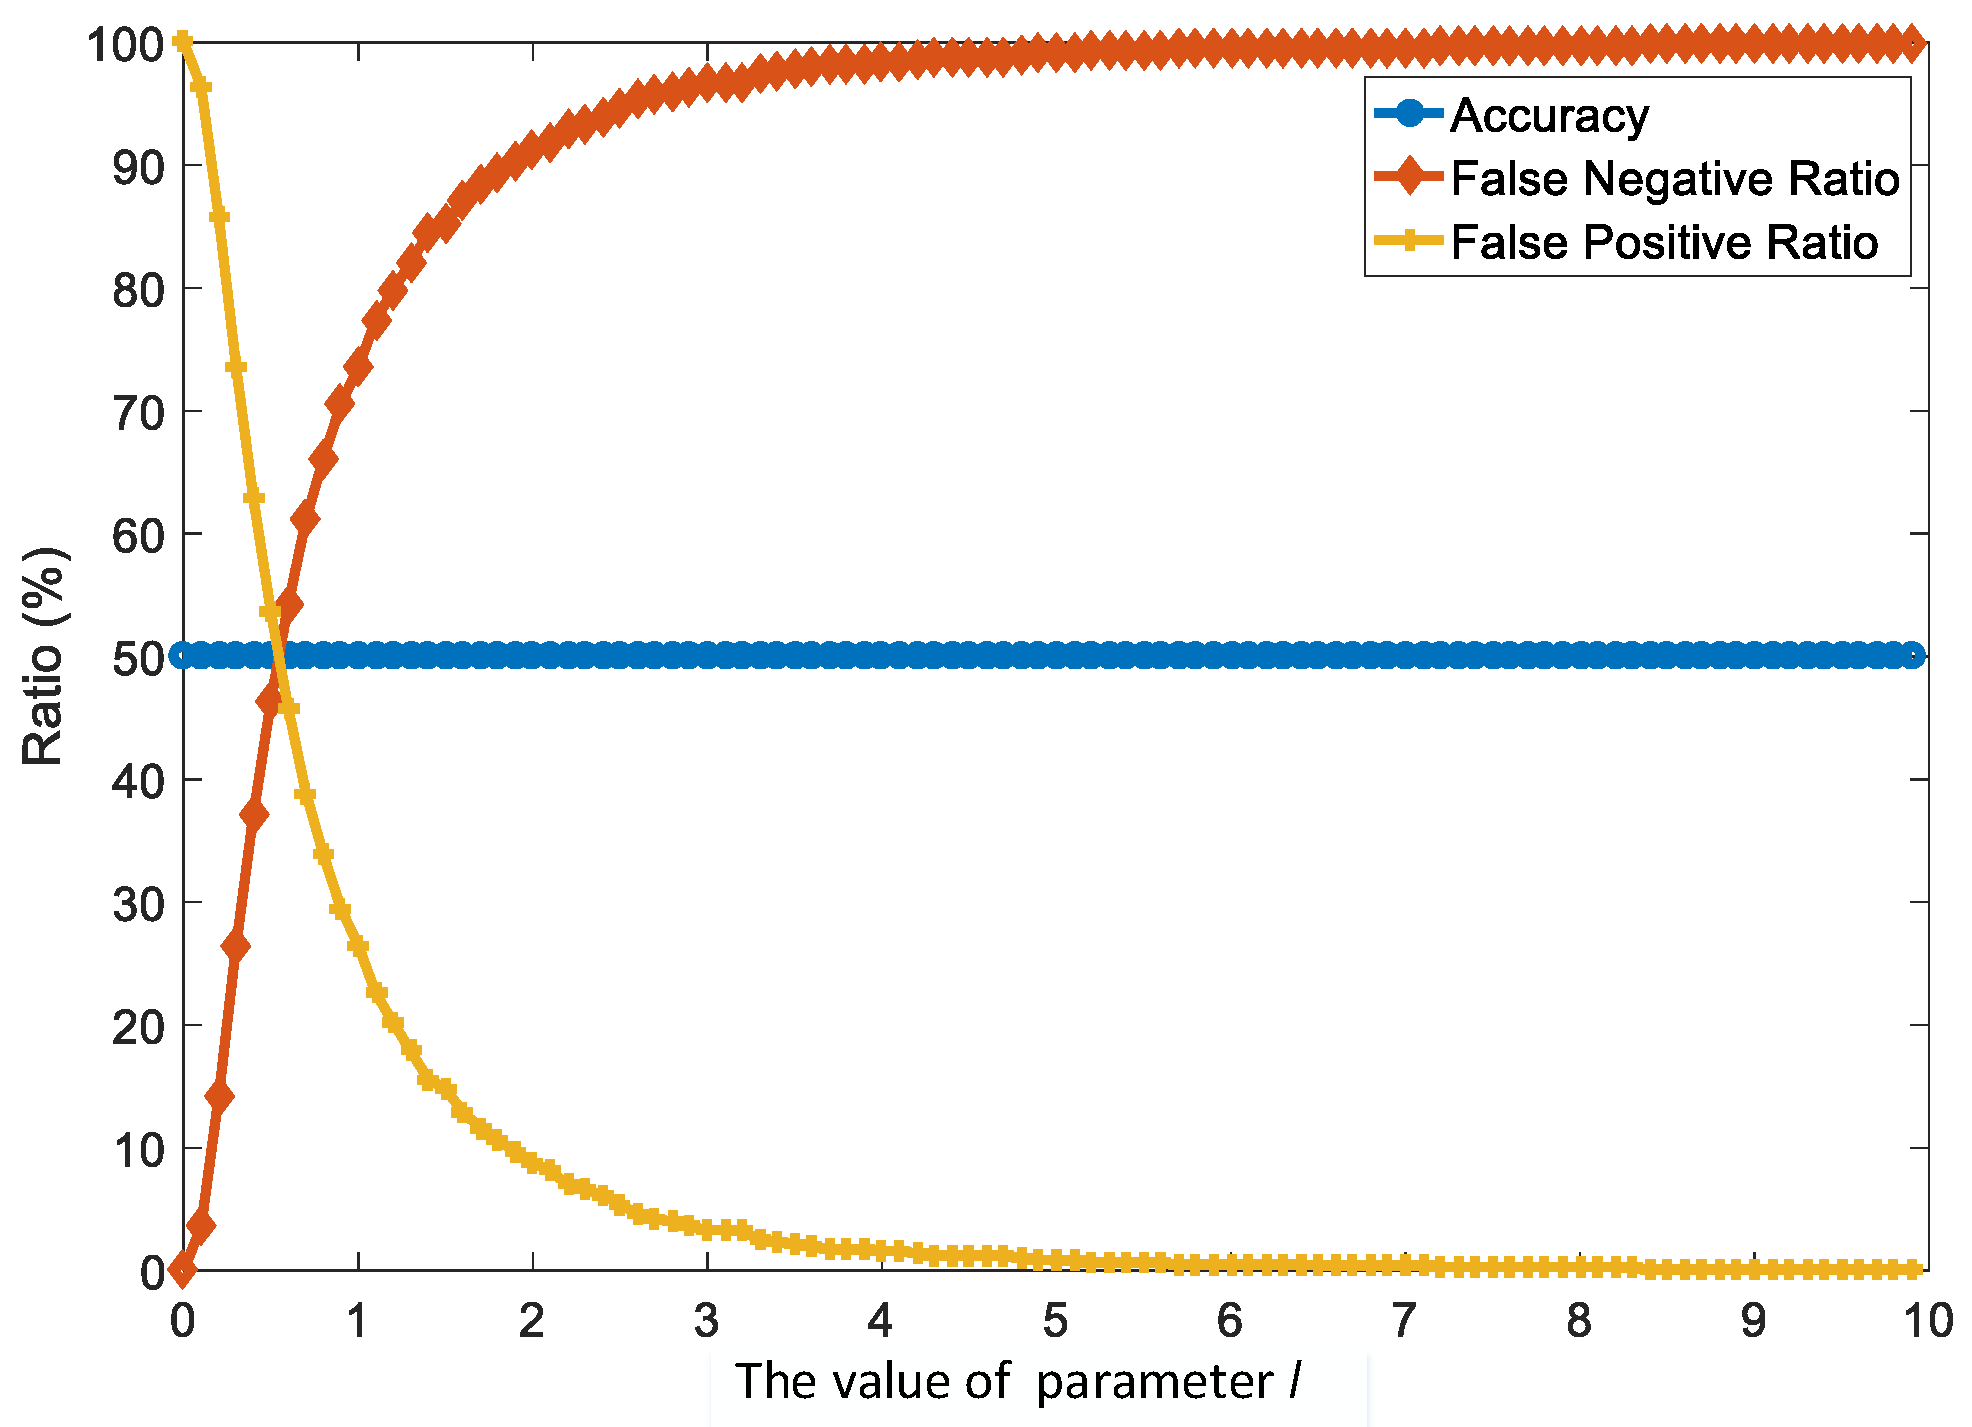
In Figure 7, we show the detection results of residual based detectors. Under different values of parameter l, accuracy, false negative ratio, and false positive ratio are obtained. We can clearly see that the accuracy is 50% and remains invariant. When a lower false positive ratio is obtained, a higher false negative ratio will be generated and the value is difficult to be accepted by defenders.
4.2. Simulation on IEEE 39-Bus Test System
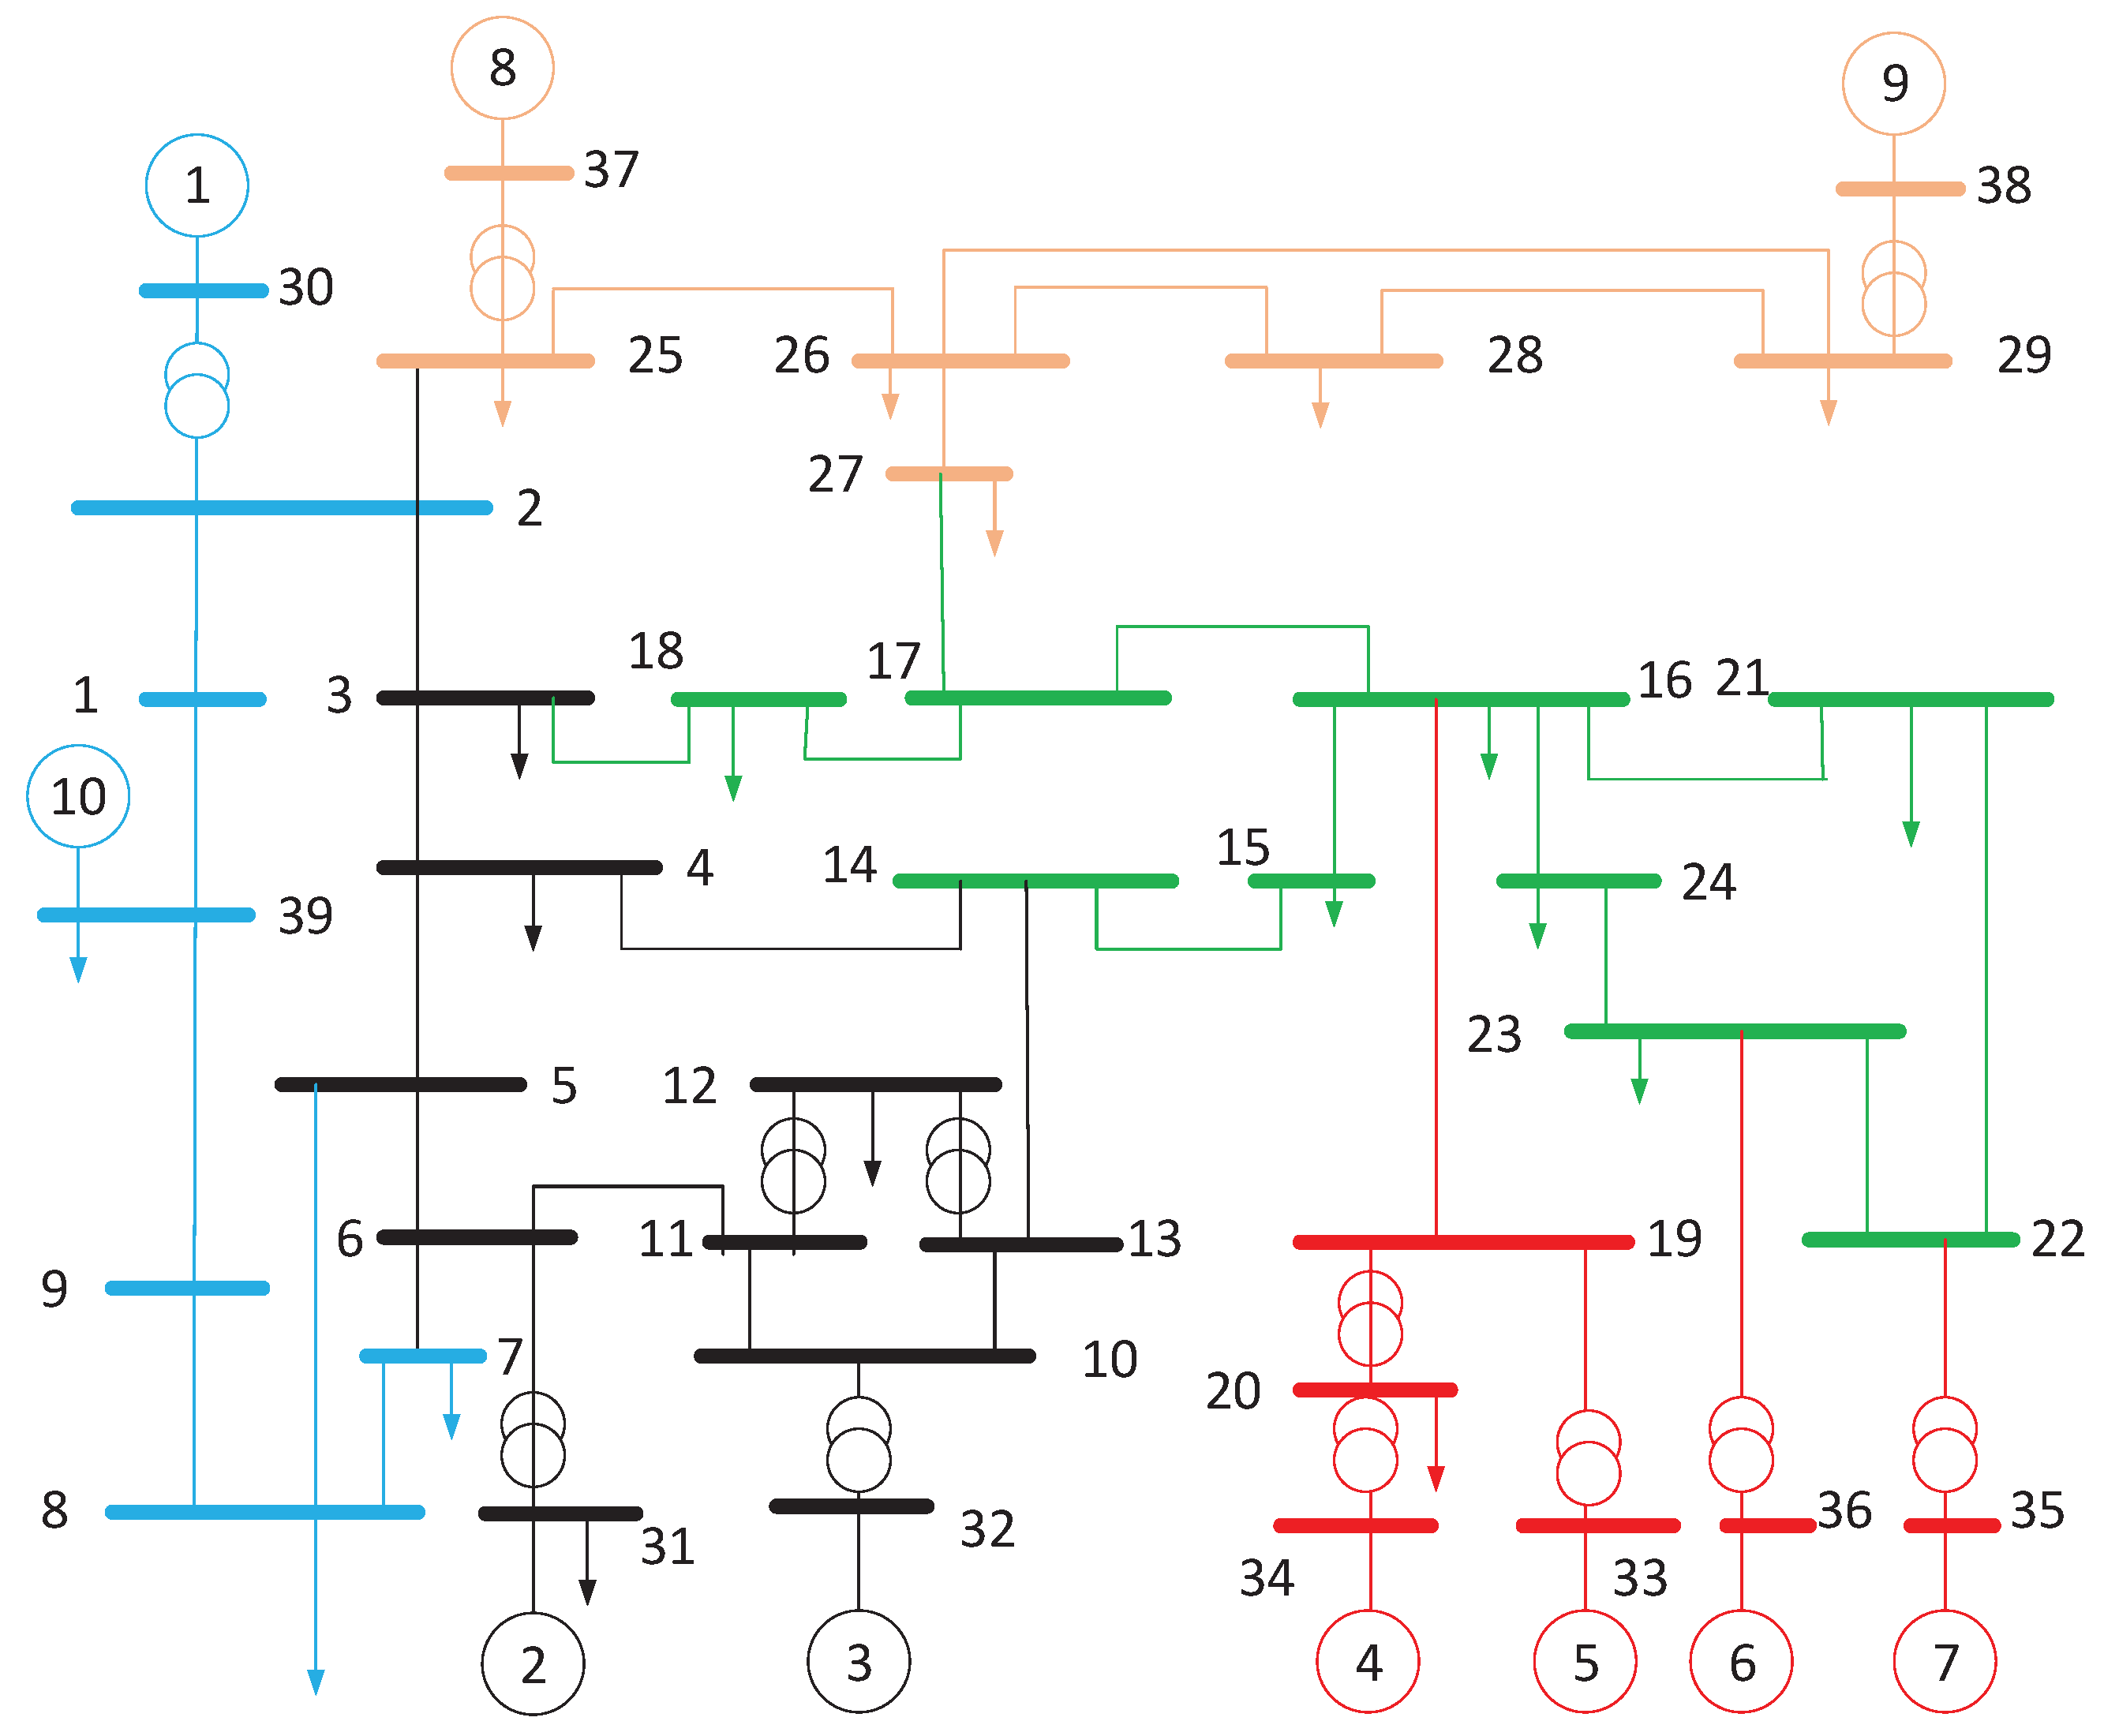
For IEEE 39-bus test system, there are 39 buses and 46 branches with changes in demands as shown in Figure 8. The buses and lines are divided into five areas, and sensors and PMUs in an area transmit sensory data to the same DC and sensory data from different areas are transmitted to different DCs. Five DCs transmit data to five different sub-controllers, sub-1, sub-2, sub-3, sub-4 and sub-5. The five sub-controllers directly connect with the central controller (cc). We also assume that the system can be fully measured by sensors including injected power of every bus, voltage phase of every bus, and power flow in every line. We use Java to simulate six detectors in controllers. The simulation environment is the same as the IEEE 14-bus test system.
In Table 2, we show the detection results of SVM classification based detectors, including the central SVM detector and SVM based detectors on edge nodes. We can clearly observe that the accuracy of detection results on every edge node is higher than the central SVM detector. Simultaneously, the lower false negative ratio is obtained by detectors on edge nodes. Comparing the false positive ratios of two methods, we find that most detectors on edge nodes can get better results. Only the detector on the sub-controller sub-1 gets 2.8% false positive ratio, which is higher than the false positive ratio of the central SVM detector. However, the average false positive ratio of all of detectors on edge nodes is lower than the false positive ratio of the central SVM detector.
Considering Table 1 and Table 2, we can get the conclusion that the proposed detection method on edge nodes can obtain the better results than the central SVM detector.
In Figure 9, we show the detection results of residual based detectors. Under different values of parameter l, accuracy, false negative ratio, and false positive ratio are obtained. We can clearly see that the highest accuracy is 84%, the lowest false negative ratio is 20%, and the lowest false positive ratio is 2%.
5. Conclusions
In this paper, we mainly pay attention to the detection about FDI on transmission lines, and propose a new detection framework. Contrary to the previous methods, we utilize the resource of edge nodes to implement lightweight detectors, which can decrease the transmission time of data to reduce the latency of decisions of sub-controllers. Moreover, simulation results show our detectors can provide higher accuracy, lower false negative ratio, and lower false positive ratio. In the future, we will enhance the detection framework to defend other attacks such as time synchronization attacks and command disaggregation attacks.
References
Author Contributions
P.X. and P.Z. contributed to the overall study design and analysis, and writing of the manuscript. Z.Z. and P.C. validated the effectiveness of our methods. Y.X. contributed to the overall writing of the manuscript. All of the authors approved the final version of the manuscript
Acknowledgments
The authors would like to thank support from the National Natural Science Foundation of China under Grant No. 61572514, Changsha Science and Technology Program under Grant K1705007, and Science and Technology Planning Project of Changsha under Grant ZD1601042.
Conflicts of Interest
The authors declare no conflict of interest.
References
- Deng, R.; Xiao, G.; Lu, R.; Liang, H.; Vasilakos, A.V. False Data Injection on State Estimation in Power Systems attacks, Impacts, and Defense: A Survey. IEEE Trans. Ind. Inform. 2017, 13, 411–423. [Google Scholar] [CrossRef]
- Liu, X.; Li, Z.; Liu, X.; Li, Z. Masking Transmission Line Outages via False Data Injection Attacks. IEEE Trans. Inf. Forensics Secur. 2016, 11, 1592–1602. [Google Scholar] [CrossRef]
- Lu, Z.; Wei, M.; Lu, X. How they interact? Understanding cyber and physical interactions against fault propagation in smart grid. In Proceedings of the IEEE INFOCOM 2017—IEEE Conference on Computer Communications, Atlanta, GA, USA, 1–4 May 2017; pp. 1–9. [Google Scholar]
- Yan, J.; He, H.; Zhong, X.; Tang, Y. Q-Learning-Based Vulnerability Analysis of Smart Grid against Sequential Topology Attacks. IEEE Trans. Inf. Forensics Secur. 2017, 12, 200–210. [Google Scholar] [CrossRef]
- Abdelaziz, A.Y.; Mekhamer, S.F.; Ezzat, M.; El-Saadany, E.F. Line outage detection using support Vector Machine (SVM) based on the Phasor Measurement Units (PMUs) technology. In Proceedings of the 2012 IEEE Power and Energy Society General Meeting, San Diego, CA, USA, 22–26 July 2012; pp. 1–8. [Google Scholar]
- Garcia, M.; Catanach, T.; Wiel, S.V.; Bent, R.; Lawrence, E. Line Outage Localization using Phasor Measurement Data in Transient State. IEEE Trans. Power Syst. 2016, 31, 3019–3027. [Google Scholar] [CrossRef]
- Wang, J.; Tu, W.; Hui, L.C.K.; Yiu, S.M.; Wang, E.K. Detecting Time Synchronization Attacks in Cyber-Physical Systems with Machine Learning Techniques. In Proceedings of the 2017 IEEE 37th International Conference on Distributed Computing Systems (ICDCS), Atlanta, GA, USA, 5–8 June 2017; pp. 2246–2251. [Google Scholar]
- Pal, S.; Sikdar, B.; Chow, J. Classification and Detection of PMU Data Manipulation Attacks Using Transmission Line Parameters. IEEE Trans. Smart Grid 2017, 29, 1. [Google Scholar] [CrossRef]
- Manandhar, K.; Cao, X.; Hu, F.; Liu, Y. Detection of Faults and Attacks Including False Data Injection Attack in Smart Grid Using Kalman Filter. IEEE Trans. Control Netw. Syst. 2014, 1, 370–379. [Google Scholar] [CrossRef]
- Sun, H.; Wang, Z.; Wang, J.; Huang, Z.; Carrington, N.; Liao, J. Data-Driven Power Outage Detection by Social Sensors. IEEE Trans. Smart Grid 2016, 7, 2516–2524. [Google Scholar] [CrossRef]
- Vu, Q.D.; Tan, R.; Yau, D.K.Y. On applying fault detectors against false data injection attacks in cyber-physical control systems. In Proceedings of the IEEE INFOCOM 2016—The 35th Annual IEEE International Conference on Computer Communications, San Francisco, CA, USA, 10–14 April 2016; pp. 1–9. [Google Scholar]
- Li, B.; Lu, R.; Wang, W.; Choo, K.K.R. DDOA: A Dirichlet-Based Detection Scheme for Opportunistic Attacks in Smart Grid Cyber-Physical System. IEEE Trans. Inf. Forensics Secur. 2016, 11, 2415–2425. [Google Scholar] [CrossRef]
- Zhao, L.; Song, W.Z. Distributed power-line outage detection based on wide area measurement system. Sensors 2014, 14, 13114–13133. [Google Scholar] [CrossRef] [PubMed]
- Dubey, A.; Karsai, G.; Pradhan, S. Resilience at the edge in cyber-physical systems. In Proceedings of the 2017 Second International Conference on Fog and Mobile Edge Computing (FMEC), Valencia, Spain, 8–11 May 2017; pp. 139–146. [Google Scholar]
- Renart, E.G.; Diaz-Montes, J.; Parashar, M. Data-Driven Stream Processing at the Edge. In Proceedings of the 2017 IEEE 1st International Conference on Fog and Edge Computing (ICFEC), Madrid, Spain, 14–15 May 2017; pp. 31–40. [Google Scholar]
- Liu, X.; Li, Z. Local Load Redistribution Attacks in Power Systems with Incomplete Network Information. IEEE Trans. Smart Grid 2014, 5, 1665–1676. [Google Scholar] [CrossRef]
- Perninge, M.; Knazkins, V.; Amelin, M.; Soder, L. Modeling the electric power consumption in a multi-area system. Eur. Trans. Electr. Power 2011, 21, 413–423. [Google Scholar] [CrossRef]
Figure 1.
The structure of the smart grid [13].
Figure 1.
The structure of the smart grid [13].

Figure 2.
The relationship among three levels.

Figure 3.
Attack model.

Figure 4.
Detection Framework on Edge Nodes.

Figure 5.
An example of the detection framework on edge nodes, where measurements about buses and , and lines and are transmitted to the S-CLASSIFIER. Measurements about buses and , and line are transmitted to the S-CLASSIFIER.
Figure 5.
An example of the detection framework on edge nodes, where measurements about buses and , and lines and are transmitted to the S-CLASSIFIER. Measurements about buses and , and line are transmitted to the S-CLASSIFIER.

Figure 6.
IEEE 14-bus test system, where buses and lines with the same color transmit sensory data to the same DC. Sub-1 manages the red area and sub-2 is responsible for the blue area.
Figure 6.
IEEE 14-bus test system, where buses and lines with the same color transmit sensory data to the same DC. Sub-1 manages the red area and sub-2 is responsible for the blue area.

Figure 7.
The detection results from the residual based detector on IEEE 14-bus test system, where l is the detection threshold of the detector based on the residual.
Figure 7.
The detection results from the residual based detector on IEEE 14-bus test system, where l is the detection threshold of the detector based on the residual.

Figure 8.
IEEE 39-bus test system, where buses and lines with the same color transmit sensory data to the same DC, sub-1 manages the blue area, sub-2 is responsible for the black area, sub-3 manages the green area, and sub-4 and sub-5 are responsible for the red area and orange area, respectively.
Figure 8.
IEEE 39-bus test system, where buses and lines with the same color transmit sensory data to the same DC, sub-1 manages the blue area, sub-2 is responsible for the black area, sub-3 manages the green area, and sub-4 and sub-5 are responsible for the red area and orange area, respectively.

Figure 9.
The detection results from the residual based detector on IEEE 39-bus test system.


Table 1.
The SVM classifiers based detection results on IEEE 14-bus test system.
| Method | Central SVM Detector | SVM Detectors on Edge Nodes | ||
|---|---|---|---|---|
| cc | sub-1 | sub-2 | ||
| Accuracy | 94.72% | 97.64% | 97.87% | 96.58% |
| FN | 8.55% | 4.49% | 3.42% | 6.66% |
| FP | 2.01% | 0.23% | 0.84% | 0.18% |
Table 2.
The SVM classifiers based detection results on IEEE 39-bus test system.
| Method | Central SVM Detector | SVM Detectors on Edge Nodes | ||||||
|---|---|---|---|---|---|---|---|---|
| cc | sub-1 | sub-2 | sub-3 | sub-4 | sub-5 | Average | ||
| Accuracy | 92.72% | 98% | 96.87% | 96.58% | 97.81% | 97.37% | 96.52% | 97.19% |
| FN | 12.70% | 3.38% | 3.42% | 6.66% | 3.54% | 4.20% | 6.34% | 4.59% |
| FP | 1.85% | 0.62% | 2.84% | 0.18% | 0.84% | 1.06% | 0.62% | 1.03% |
© 2018 by the authors. Licensee MDPI, Basel, Switzerland. This article is an open access article distributed under the terms and conditions of the Creative Commons Attribution (CC BY) license (http://creativecommons.org/licenses/by/4.0/).
Share and Cite
MDPI and ACS Style
Xun, P.; Zhu, P.; Zhang, Z.; Cui, P.; Xiong, Y. Detectors on Edge Nodes against False Data Injection on Transmission Lines of Smart Grid. Electronics 2018, 7, 89. https://doi.org/10.3390/electronics7060089
AMA Style
Xun P, Zhu P, Zhang Z, Cui P, Xiong Y. Detectors on Edge Nodes against False Data Injection on Transmission Lines of Smart Grid. Electronics. 2018; 7(6):89. https://doi.org/10.3390/electronics7060089
Chicago/Turabian StyleXun, Peng, Peidong Zhu, Zhenyu Zhang, Pengshuai Cui, and Yinqiao Xiong. 2018. "Detectors on Edge Nodes against False Data Injection on Transmission Lines of Smart Grid" Electronics 7, no. 6: 89. https://doi.org/10.3390/electronics7060089
Note that from the first issue of 2016, this journal uses article numbers instead of page numbers. See further details here.