Article

Closing the Wearable Gap: Mobile Systems for Kinematic Signal Monitoring of the Foot and Ankle

1
Industrial and Systems Engineering, Mississippi State University, Mississippi State, MS 39762, USA
2
Electrical and Computer Engineering, Mississippi State University, Mississippi State, MS 39762, USA
3
Kinesiology, Mississippi State University, Mississippi State, MS 39762, USA
*
Author to whom correspondence should be addressed.
Electronics 2018, 7(7), 117; https://doi.org/10.3390/electronics7070117
Submission received: 7 June 2018 / Revised: 9 July 2018 / Accepted: 13 July 2018 / Published: 18 July 2018
(This article belongs to the Special Issue Data Processing and Wearable Systems for Effective Human Monitoring)

Abstract

:
Interviews from strength and conditioning coaches across all levels of athletic competition identified their two biggest concerns with the current state of wearable technology: (a) the lack of solutions that accurately capture data “from the ground up” and (b) the lack of trust due to inconsistent measurements. The purpose of this research is to investigate the use of liquid metal sensors, specifically Liquid Wire sensors, as a potential solution for accurately capturing ankle complex movements such as plantar flexion, dorsiflexion, inversion, and eversion. Sensor stretch linearity was validated using a Micro-Ohm Meter and a Wheatstone bridge circuit. Sensors made from different substrates were also tested and discovered to be linear at multiple temperatures. An ankle complex model and computing unit for measuring resistance values were developed to determine sensor output based on simulated plantar flexion movement. The sensors were found to have a significant relationship between the positional change and the resistance values for plantar flexion movement. The results of the study ultimately confirm the researchers’ hypothesis that liquid metal sensors, and Liquid Wire sensors specifically, can serve as a mitigating substitute for inertial measurement unit (IMU) based solutions that attempt to capture specific joint angles and movements.

1. Introduction

While improving athletic performance is a common goal of Strength and Conditioning (S&C) coaches across all levels of competition, the question of optimization of performance is still subject to trial and error. Quantifying training protocols is one method to evaluate and validate performance programs. Traditionally, optical motion capture of biomechanical data collection is considered the gold standard for identifying kinematic and kinetic parameters [1] and is generally confined to a research laboratory or lab-like environment due to the equipment requirements. Unfortunately, high costs and limited access to these research environments reduces the opportunity for improving all athletes through technical analysis [2]. One promising technological advancement that has seen increased exposure in research and competition is wearable sensor technology and the opportunity to measure near real-time kinematics on the playing field [3]. Measuring various physiological and kinematic parameters is now accessible to the average athlete compared to the human activity recognition devices from twenty years ago [4,5]. Numerous commercially available products utilize micro electromechanical systems [6] (MEMS), accelerometers, and gyroscopes to capture biomechanical measures outside the lab [1].
One of the benefits of using MEMS devices is that they offer a lower-cost alternative to traditional motion capture solutions. Using an inertial frame, the relative orientation of limb segments can be calculated from accelerometer and gyroscope data [7]. One commonly used type of MEMS is the inertial measurement unit, or IMU, and it is found in most technologies where some form of movement information is captured. However, several recurring issues are seen in IMU-based motion capture systems including distortion and drift [1], and challenges in how to consistently manage calibration [8]. The distortion and drift that affects actual sensor horizontal and vertical data are due to distortions in non-homogeneous magnetic fields, often caused by building construction materials and magnetic interference [1,9]. To reduce noise, improved anatomical models and static calibration in defined positions have been developed [1,7]. However, measurement errors still occur due to skin and segment speed of movement and axial segment rotation [10]. According to Kavanagh et al. [11], the separation of limb segment resultant acceleration could not be identified within the sensor data, resulting in the difficulty to obtain accurate measurements. Additionally, external devices are often incompatible with activities that involve contact and may require frequent adjustment and re-calibration [12] making them impractical for use in real-world environments.
In human movement, the neuromuscular system senses strains, positioning, and stretching of its proprioceptors and muscular system in order to coordinate limb segment movement [13]. A body network sensor system that mimics strain and stretch around the joints may offer an alternative to using stiff, circuit board-based IMUs in capturing human limb movement. Given calibration and consistency challenges that exist with IMUs used in the athletic wearable market today, a potential solution may lie in the use of a different kind of sensor, or sensors developed for a different purpose, such as soft robotic sensors. Totaro et al. custom designed soft sensors and integrated them into garments for precise movement validated in lower limb joints [14] but this research did not utilize “off-the-shelf” sensors and therefore are limited for future, real-world environment use cases. Other recent studies utilized more commercialized soft robot sensor solutions found in exoskeletons technologies for less complex movements not located around the foot and ankle [15,16]. For the purposes of this study, soft robotic sensors can be identified as silicone–textile (or other soft materials) layered with liquid conductive material and generally identified as resistive or capacitive [17,18]. As these sensors are stretched, their resistive or capacitive values increase. At the beginning of this research, there were two primary soft robotic sensor solutions available to test. Liquid Wire is a resistance-based sensor and StretchSense is a capacitive-based sensor, both of which provide increased output values when stretched past their initial resting lengths. Several advantages for using soft robotic sensors such as these include (a) the ability to measure biomechanical strain without worry for occlusion errors that typically occur in optical systems and eliminate drift that can occur in MEMS sensors [2]; (b) the realization of small changes in electromechanical specifications during loading and unloading; and (c) the reduction of interference as observed by the wearer [19]. In addition, soft robotic sensors inherently offer “stretchability”, which allows the sensors to cover arbitrarily shaped joints that occur on the human body [20].
The purpose of the research described herein is to take a new type of sensor, soft robotic sensors, and determine if this solution can be re-purposed for motion capture via a customized wearable technology application. The motivation behind this idea being to mitigate or completely remove the problems described regarding IMU-based wearable solutions. Before any solution design and prototyping based around this sensor solution was initiated, the researchers identified critical questions that needed to be addressed by subject matter experts (SMEs): (a) There are known issues with data consistency and reliability with wearable technology (as previously defined) but what do actual SMEs of the technology think? (b) What are the gaps that SMEs identify as being the biggest opportunities for wearables?

1.1. Interviews—Two Concerns

In order to address the first question regarding wearable industry gaps, this research team sought out SMEs who were not only familiar with the intended (and actual) use of the technology but who were also knowledgeable of the “state of the art” of the wearable market. As a result of securing regional NSF I-Corporation (I–Corp) grant funding, the researchers conducted a series of nearly three-dozen, hour-long interviews with S&C coaches and athletic trainers (AT) from around the country in all sports at the collegiate and professional levels for both men and women competition. These interviews were conducted to establish the need and use of wearable technology to improve athletic performance and manage athletic activity. The primary questions posed to the interviews were (a) “What are the gaps in the current generation of wearable technologies available to you today?” and (b) “If you could design a wearable solution, what information would it capture for you in order to assist in making critical decisions about health and safety?” Two primary concerns were repeated by the interviewees. The first concern was that current data from wearable sensors could not be trusted due to consistent inaccuracies and lack of transparency with generalized correlations. The second most consistently identified gap was that data captured “from the ground up” was desired but was either missing or delivered improperly in current wearable technological solutions designed for athletic competition and movement evaluation. The term ”from the ground up” highlights a desire on the part of the S&C coaches and ATs to have data collected at the point where the athlete comes in contact with the ground, the foot and ankle.

1.1.1. Rebuilding Trust

The first gap identified through the I–Corp interviews, the issue of trust, is a major concern as these S&C coaches and ATs are responsible for making decisions about the health and safety of athletes. Training and rehabilitation protocols directly influence athletes’ functional health beyond competition. Backing the concerns identified by the interviewees, multiple researchers have expressed concerns about the efficacy of sensors in rehabilitation use due to inaccuracies [21,22], and the inability of users to successfully manage the number of false positives that can occur through wearable sensor use often results in poor compliance [21]. To overcome inaccuracies found in wearable technology, researchers have used a variety of different and frequent calibration procedure methods [23], extra sensors, and substituted ultra-wide band for magnetometers [8]. As seen in a study of three commercially available Altitude and Heading Reference Systems (AHRS) [23], relative accuracy, which can be related to human joint angle measurement, deviated from one degree in a 30 s time segment to over 16 degrees in repeated two minute dynamic segments compared to the gold standard of optical motion capture. Resetting of the reference points for the sensors during the trials did improve accuracy; however, constant re-calibration can occur in the lab and be tolerated but this frequent level of adjustment is neither practical nor acceptable for practitioners who would need to stop training or practice to re-calibrate wearable devices.
From the corroborated output amassed during the I–Corp interviews, the number of step counts by Mississippi State University (MSU) men’s and women’s basketball teams captured during the 2016–2017 season recorded higher than normal step activity during practices. Further investigation into the data revealed that the dribbling motion of the basketball by the player’s arms and hands were being counted as steps and work performed. Other inaccuracies also occurred with the MSU football team. During a spring training practice in 2017, one player registered as taking a few hundred steps and traveling 10 miles, which is obviously not physically possible. At most, average football players in an average practice will travel between one and two miles depending on the position played, but not 10 miles. Additional evidence of inaccuracies has led S&C coaches at universities of similar sizes and athletic budgets as MSU to completely stop using any type of wearable technology. These peer institutions are recommending that other university athletic programs do the same and terminate wearable use for health and safety assessments associated with practice and training events.

1.1.2. From the Ground Up

The second piece of valuable information gained from the S&C coaches and AT interviews regarding wearable gaps revealed the need for information to be captured “from the ground up”. According to responses from the I–Corp interviewees, current wearable technology does not provide accurate ground reaction force and ankle complex movement data. Determining ankle complex movement (especially in near real–ime to aid in health and safety-based decision making) has many benefits to both the athletic and rehabilitation industries, as the foot and ankle mobility influence total human movement [24]. Repeated lateral movement or excessive movement beyond normal range of motion of inversion can lead to ankle sprains [25]. In addition, high and repeated forces occurring at the foot and ankle can be used to infer what happens at the knee and hip, which can lead to early fatigue and negatively alter postural control, resulting in biomechanical compensations that may cause injury [26]. A review of currently available wearable solutions further accentuates this ankle data gap. While a few solutions capture some information at the foot and ankle level, none of them capture absolute joint angles—meaning, no solution can give exact ankle movement values. In fact, few, if any, wearable solutions provide more than inferred joint angle data (ankle or otherwise) because angles are assumed based on limb segments. Devices proven to be inaccurate due to drift and other inconsistencies are also using inferences to make assumptions about generalized joint movements. The interviewees’ concerns about both trust and a lack of data captured “from the ground up” come full circle based on information shown in Table 1. Thus, the need to develop wearable technology differently is clear and further emphasizes the need to utilize a technology capable of consistently capturing the strains and stressors at the ankle complex in order to provide data that may not be visually noticed by the S&C coaches.
Table 1 is an analysis of many of the movement-calculating wearable solutions available identified in the I-Corps interviews by S&C coaches as either having been used in the past, in use today by their institution or, at a minimum, of interest for potential consideration. Since many of these wearable technologies are new solutions and have not been validated in literature, much of the information had to be extracted from manufacturer websites as well as news and sports-related articles. In some cases, true capability and functionality were not clear; therefore, the authors had to default to promotional material claims and intellectual property definitions via patents. Much of the information about the devices’ true functionality and data capturing granularity is vague at best, which is one of the reasons highlighted in the interviews for why a lack of trust among the users of the technology exists. While compiling Table 1 further emphasized the lack of trust gap, the completed version of the table also highlights the second gap, a lack of absolute measurements for any joint, including the ankle complex.

1.2. Dynamic Range of Motion and Sensor Placement

Due to the intricacy of the ankle complex, precise placement of sensors are required to obtain accurate kinematic data during movement. Ankle complex rotational components can be found within the talocrural, subtalar, and inferior tibofibular joints [25]. Given the anatomical design of the ankle joints, movement of the foot during open kinetic chain in plantar flexion and dorsiflexion do not occur in a single sagittal plane [64]. During plantar flexion, the foot moves 28 degrees in the sagittal plane, one degree in the transverse plane, and four degrees in the frontal plane [25]. Likewise during dorsiflexion, there are 23 degrees of movement in the sagittal plane, nine degrees in the transverse plane, and two degrees in the frontal plane [25]. Unlike previous research on comparisons of IMUs for optimal motion capture which both ignore internal and external rotations and inversion and eversion [65], this study looks at the viability in using soft robotic sensors to capture all movement in all three planes.
An important aspect of this investigation is the consideration for placement of these sensors in order to optimize measurements of complex ankle movements. Previous work by Mengüç et al. [2] has evaluated the sensor placement at the posterior part of the ankle and heel, extending from the distal aspect of the gastrocnemius muscle complex down to the calcaneous, which has shown positive results in sagittal plane movements (coefficient of determination 0.9680). To capture tri-planar ankle joint movement, one sensor was placed parallel to the distal 1/3 aspect of the fibula, overlaying the lateral malleolus to capture inversion and eversion. Second, vertically in–line with the distal 1/3 aspect of the tibia onto the superior aspect of the talus and a third sensor was positioned perpendicular to the 23 degree axis of inversion [25]. This research provides a starting point for where sensors should be placed in order to effectively capture full range of ankle motion.
With a clear goal identified (capture data “from the ground up”) and a potential replacement IMU sensor direction found, the aim of this study is to evaluate the use of resistive soft robotic sensors at the ankle complex movement level. Determining ankle complex movement in near real-time has many benefits to both the athletic and rehabilitation industries, as the foot and ankle mobility influence total human movement [24]. As repeated lateral movement or excessive movement beyond normal range of motion of inversion can lead to ankle sprains [25], applying resistive soft robotic sensors at the ankle complex may provide information to coaches, trainers, and therapists in preventing over-use injuries and validate proper ankle rehabilitation training exercises. The goal of this paper is to show that soft robotic sensors have the potential to usher in a new type of wearable that is not limited by the difficult challenges created by IMUs such as drift. Liquid Wire sensors were selected for this study given their resistive properties, the researcher’s access to different substrate types, and the ability to custom order sensors with specific resting resistances and lengths. Based on the goals and limitations above, the contributions of this paper are as follows:
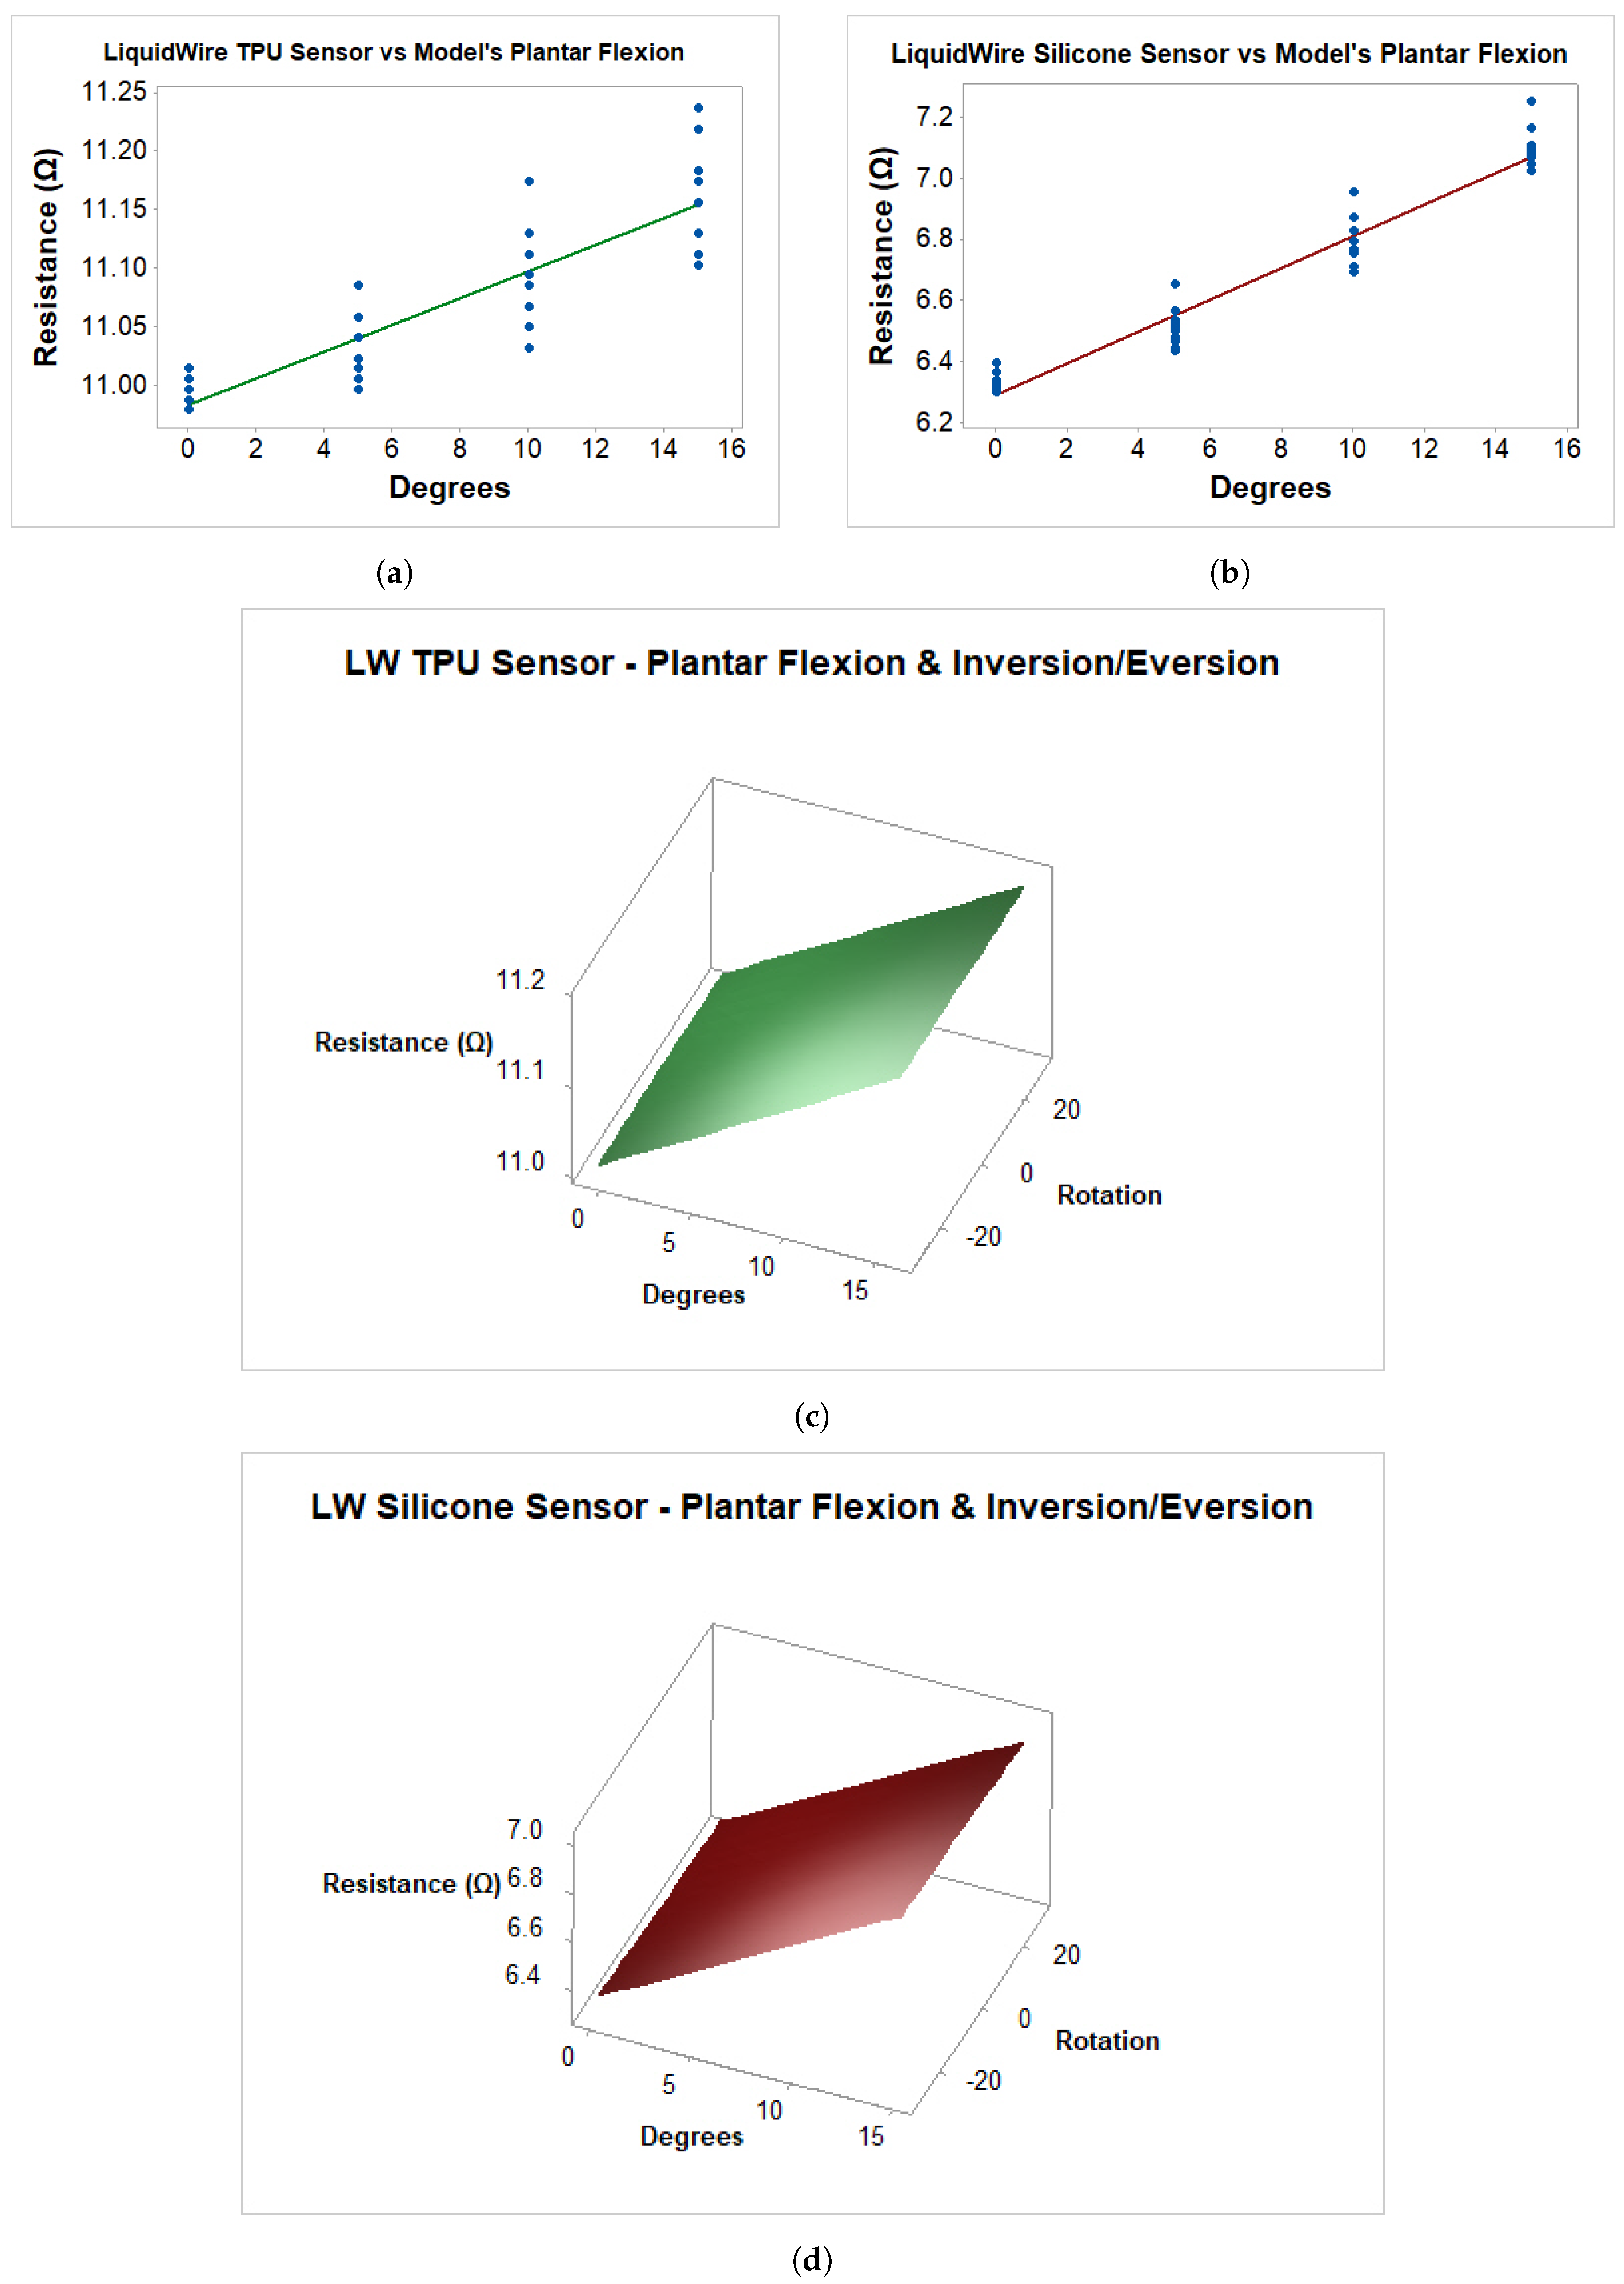
  • Liquid metal sensors (specifically those manufactured by Liquid Wire [66]), which are designed for soft-robotics applications, are experimentally shown to be suitable for capturing ankle complex movements for dorsiflexion, plantar flexion, inversion, and eversion.
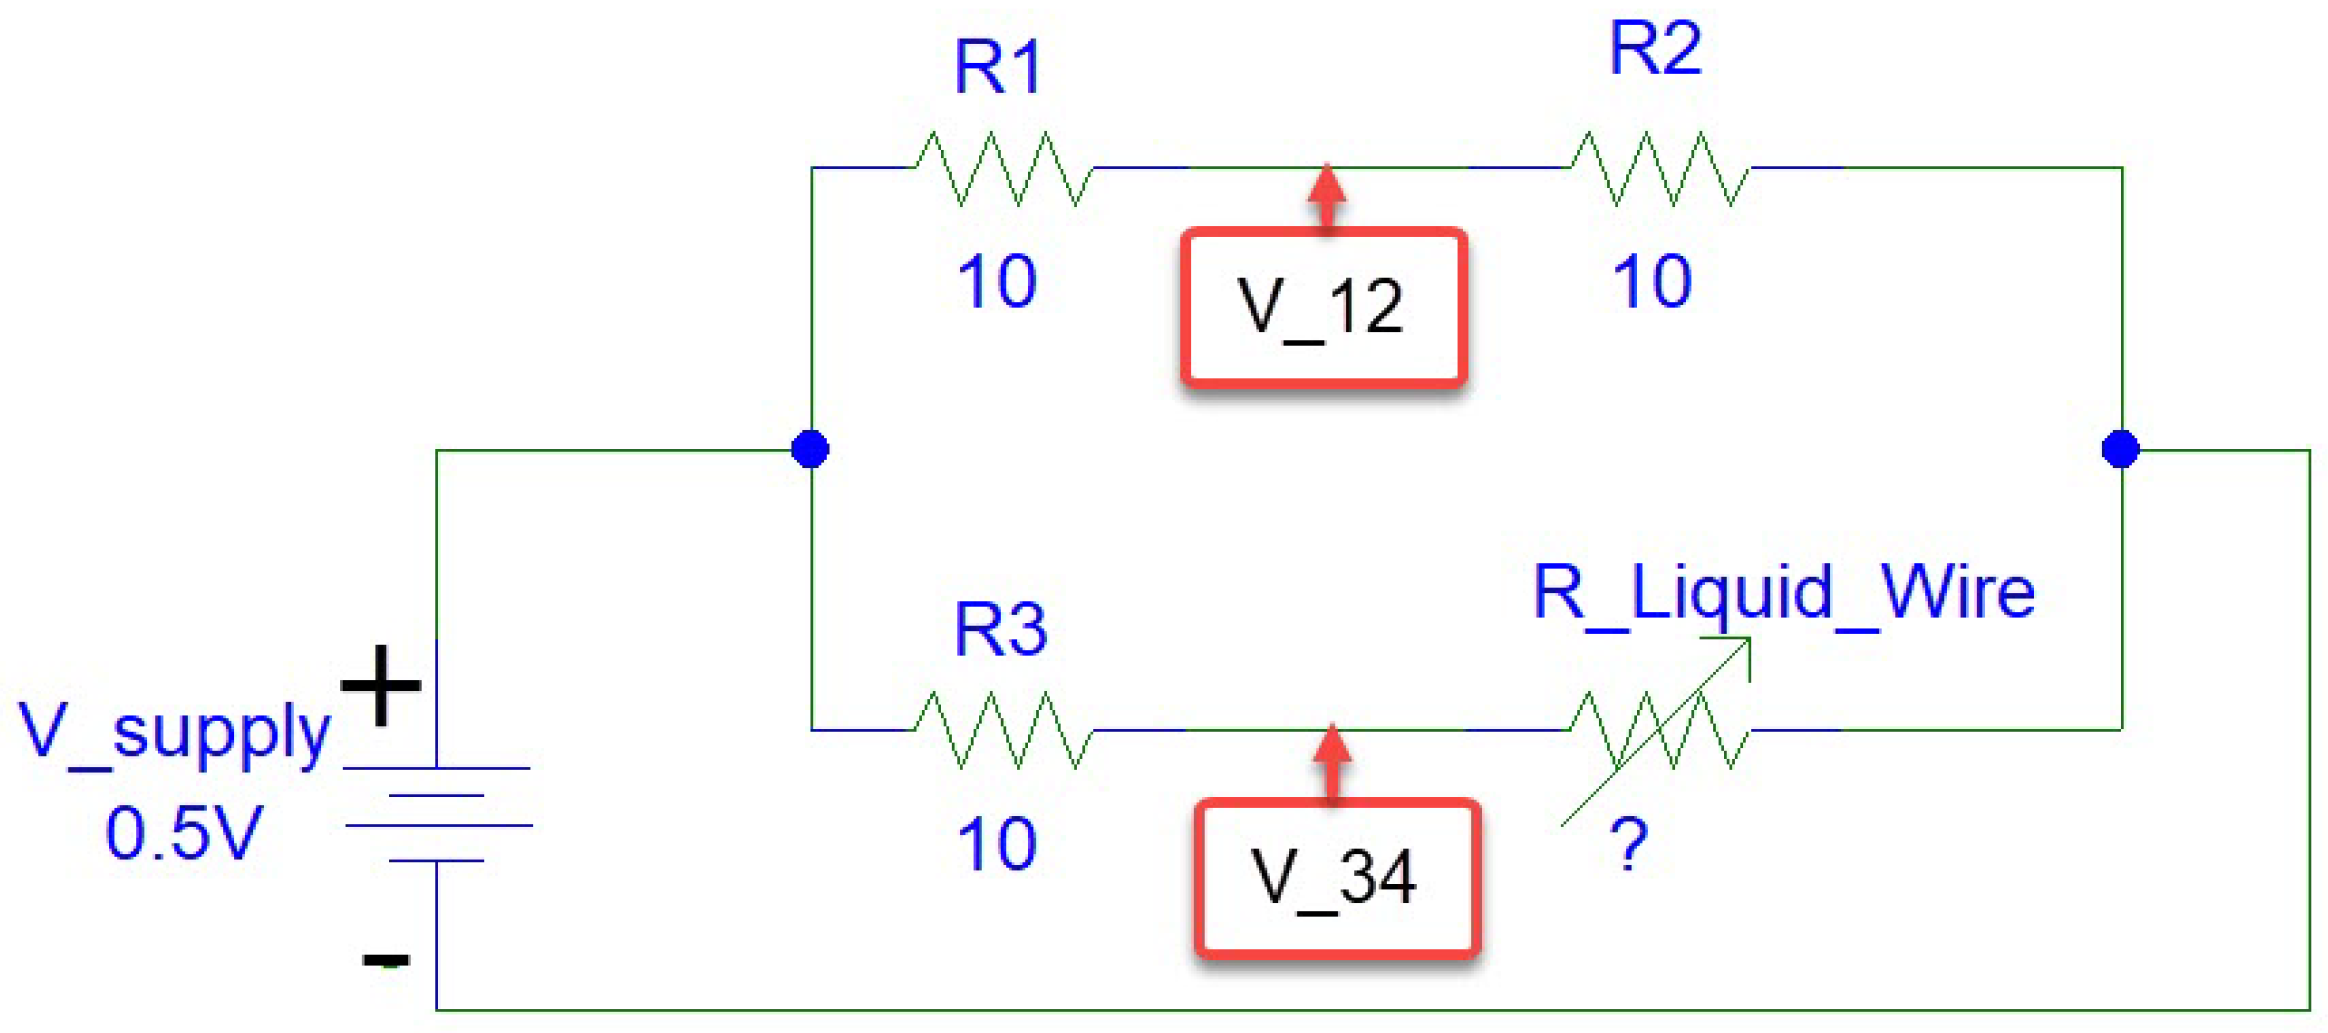
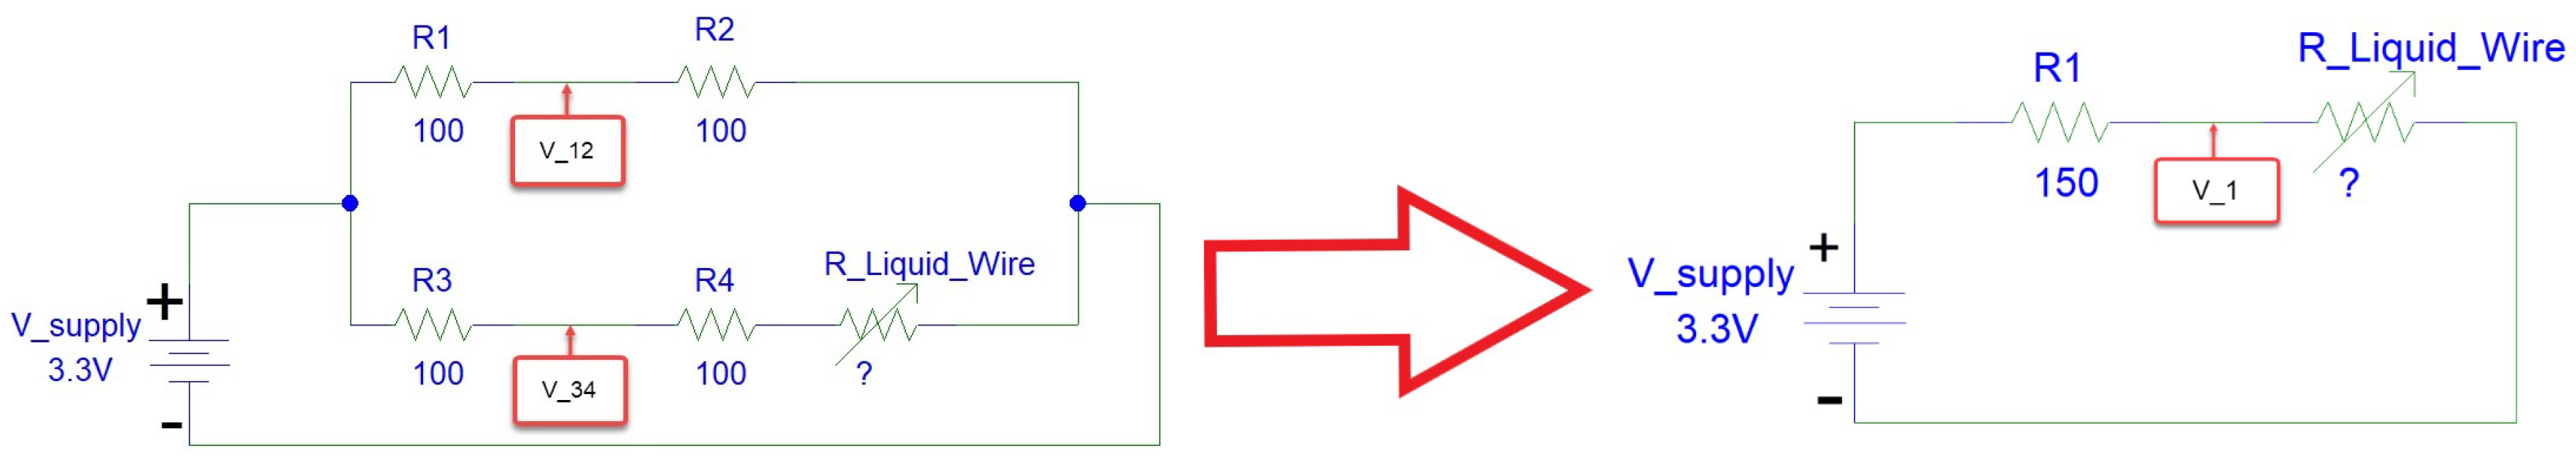
  • A simple microprocessor-based computing unit prototype designed to accurately measure the Liquid Wire sensors resistances is provided.
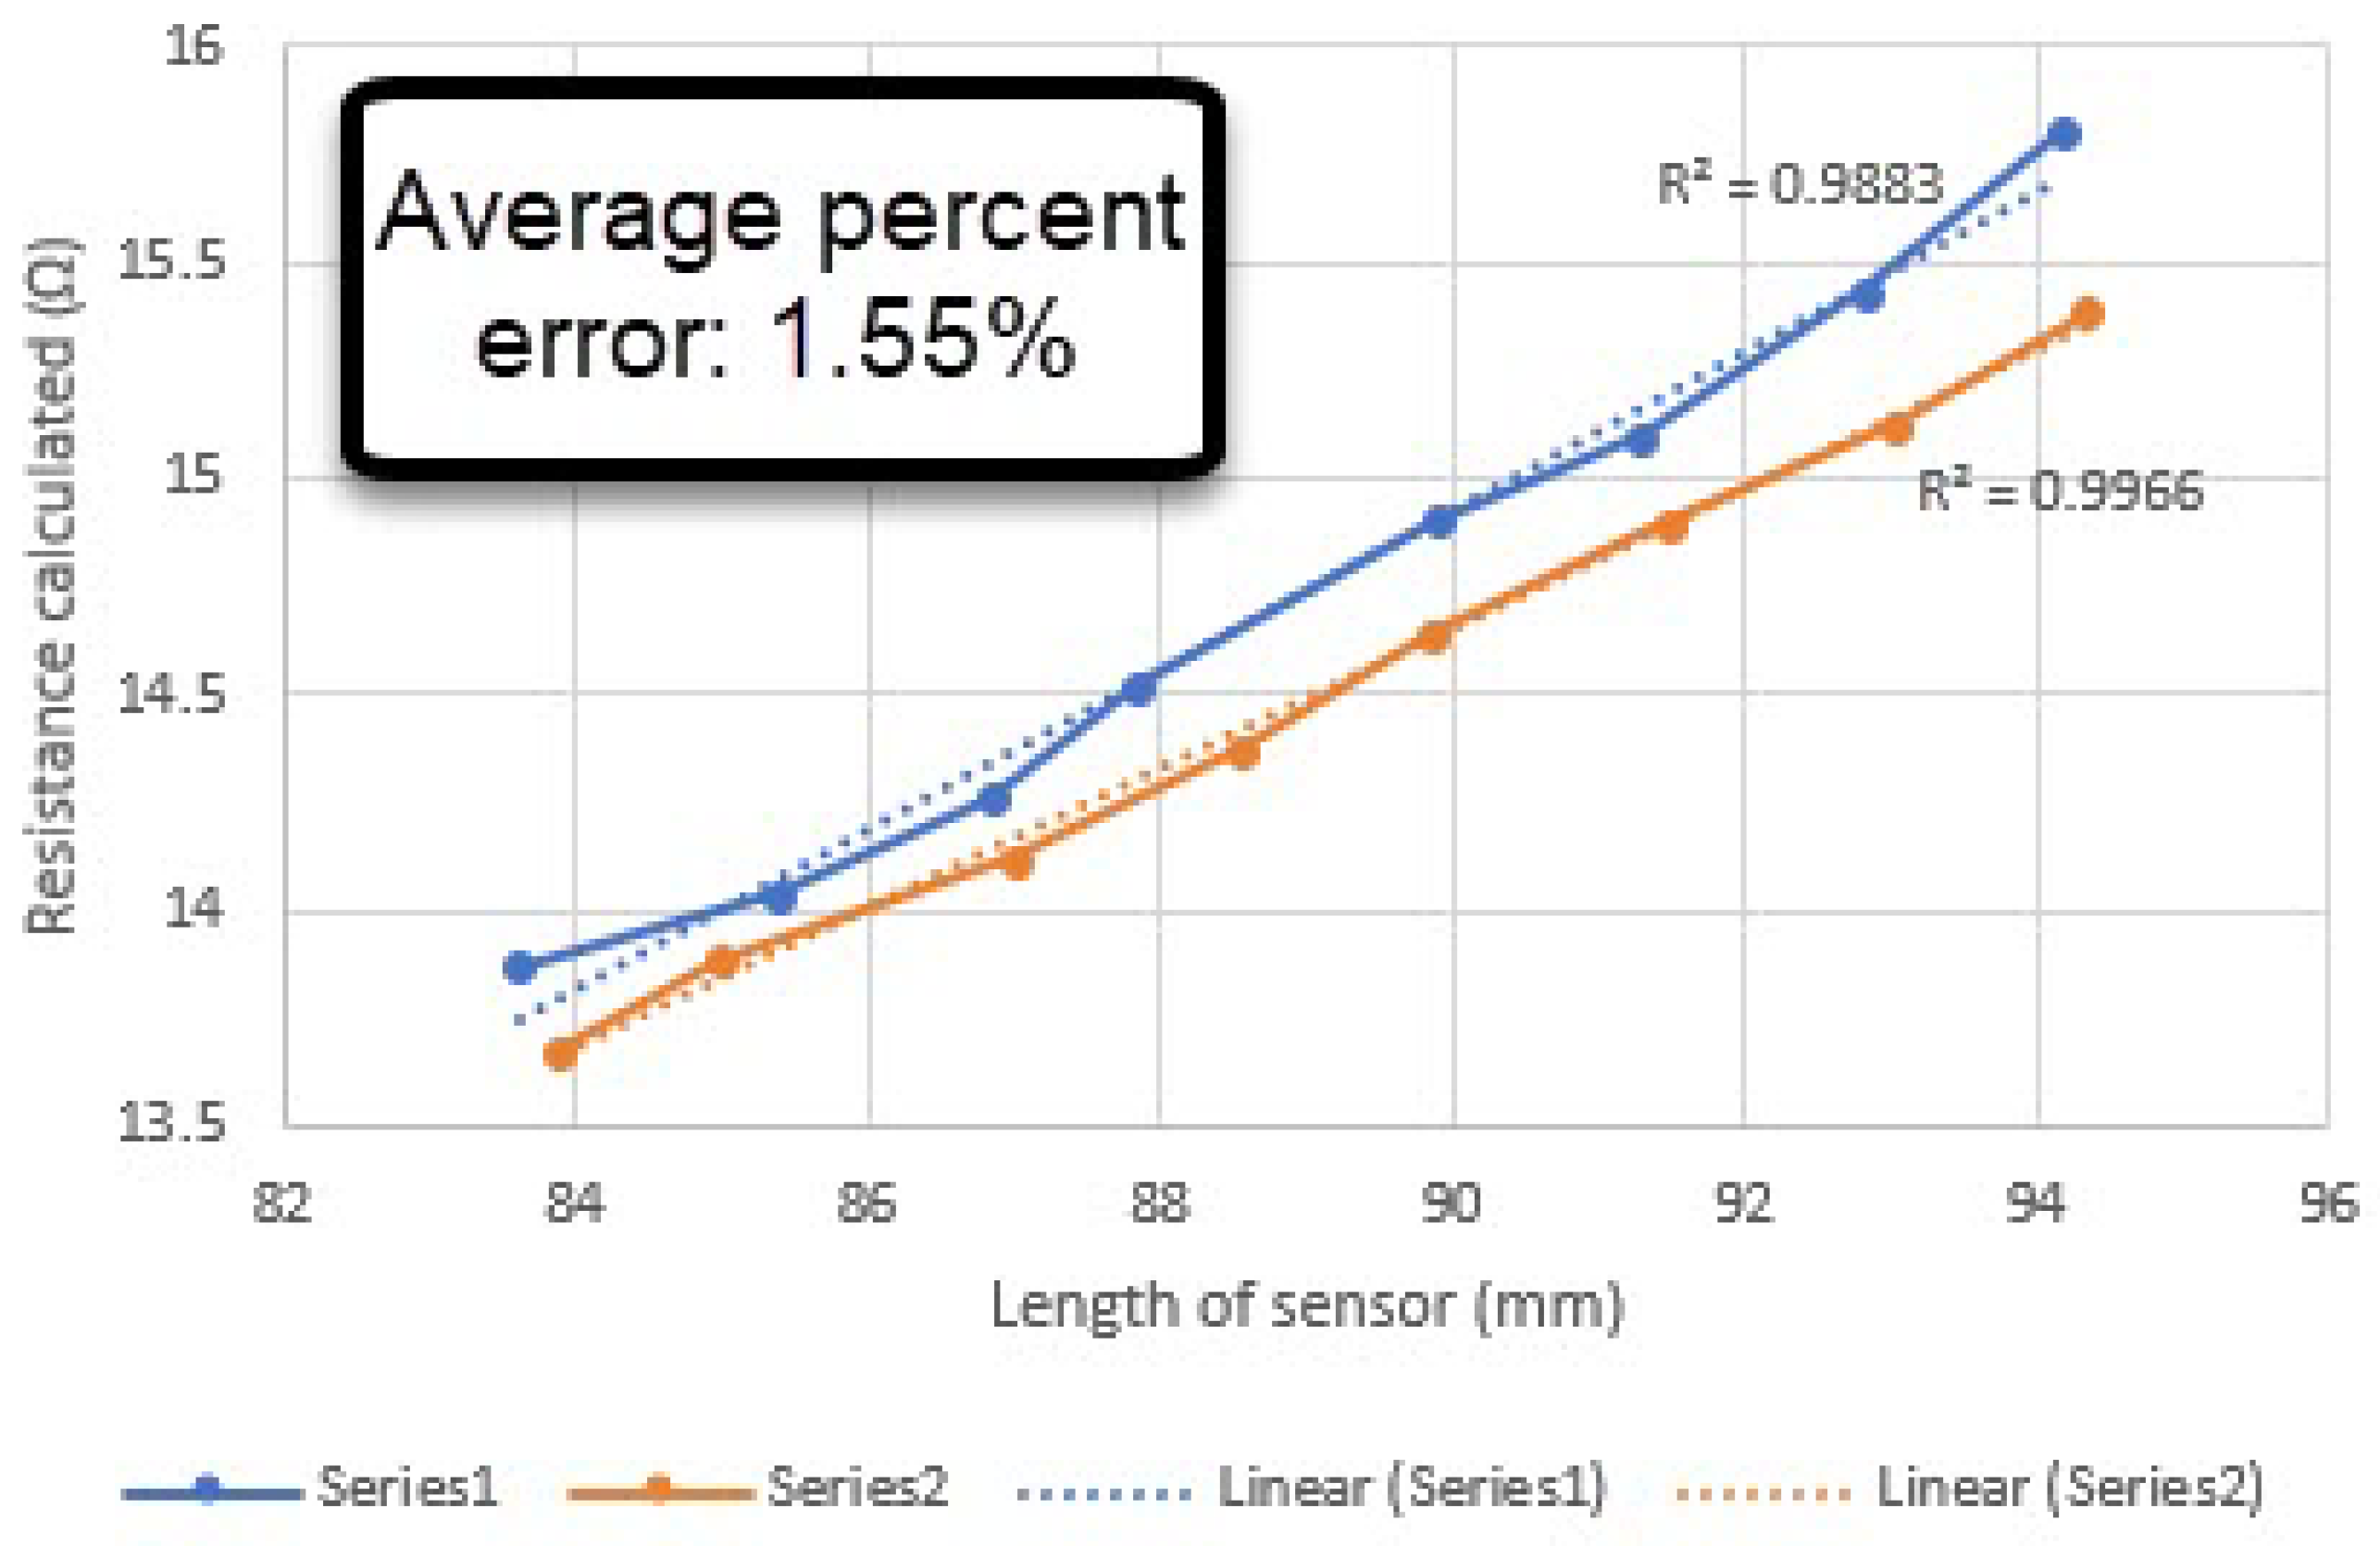
  • Liquid Wire sensors, which vary their resistance under stretching, are experimentally shown to provide a linear relationship versus stretching distance and temperature.
  • Linear regression models were used to relate the resistance measurements into ankle angle measurements.
  • A detailed summary of the state-of-the-art in wearable solutions is provided which shows that there currently is not another wearable solution capable of making ankle measurements (Table 1).
The remainder of this paper is organized as follows. Section 2 provides information on experimental materials and methods. Section 3 discusses experimental results. Section 4 draws conclusions and lists the researchers’ future work pursuits.

2. Materials and Methods

This section discusses materials and methods for (a) testing the Liquid Wire sensors; (b) testing the dynamic range of motion; and (c) estimating angles from the Liquid Wire sensors. Results and conclusions from these tests are discussed in Section 3 and Section 4, respectively.

2.1. Liquid Wire Testing

In order to prove that the Liquid Wire sensors are a viable tracking solution, the researchers conducted several experiments to verify that the sensor output changed linearly with stretched length, regardless of temperature, and that the sensor could be feasibly utilized in a microcontroller-based system.

2.1.1. Testing Goals
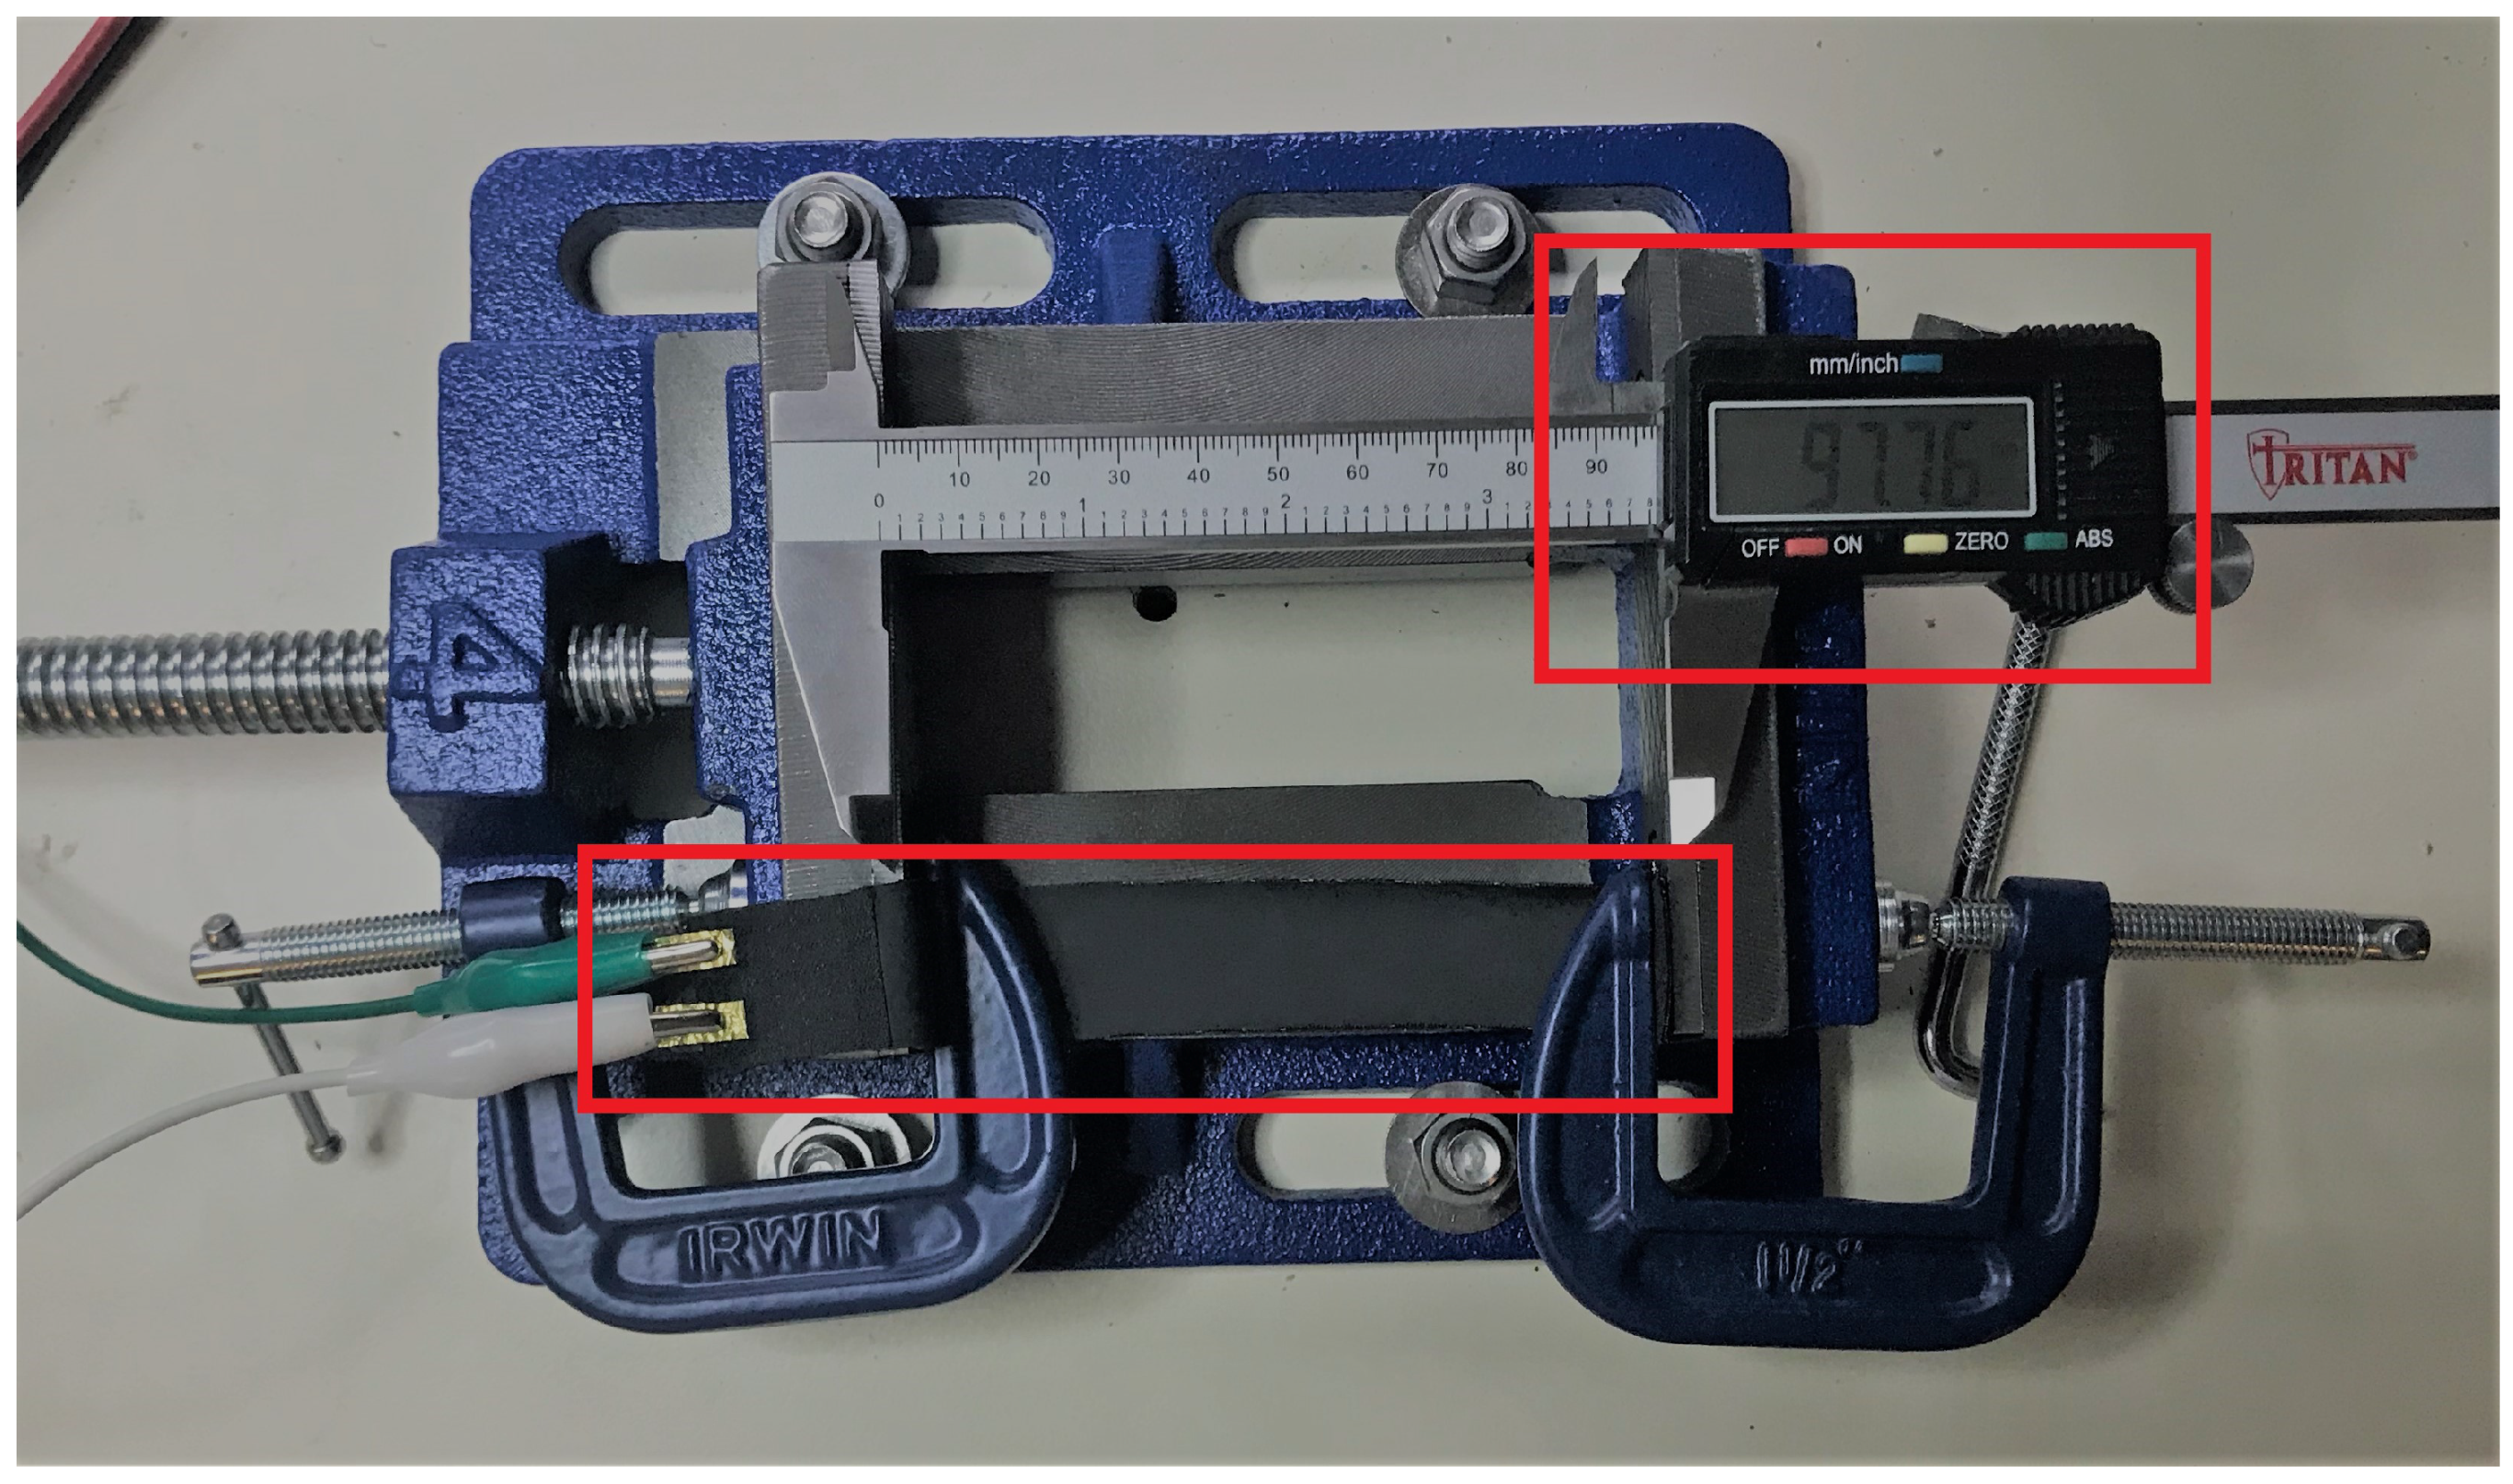
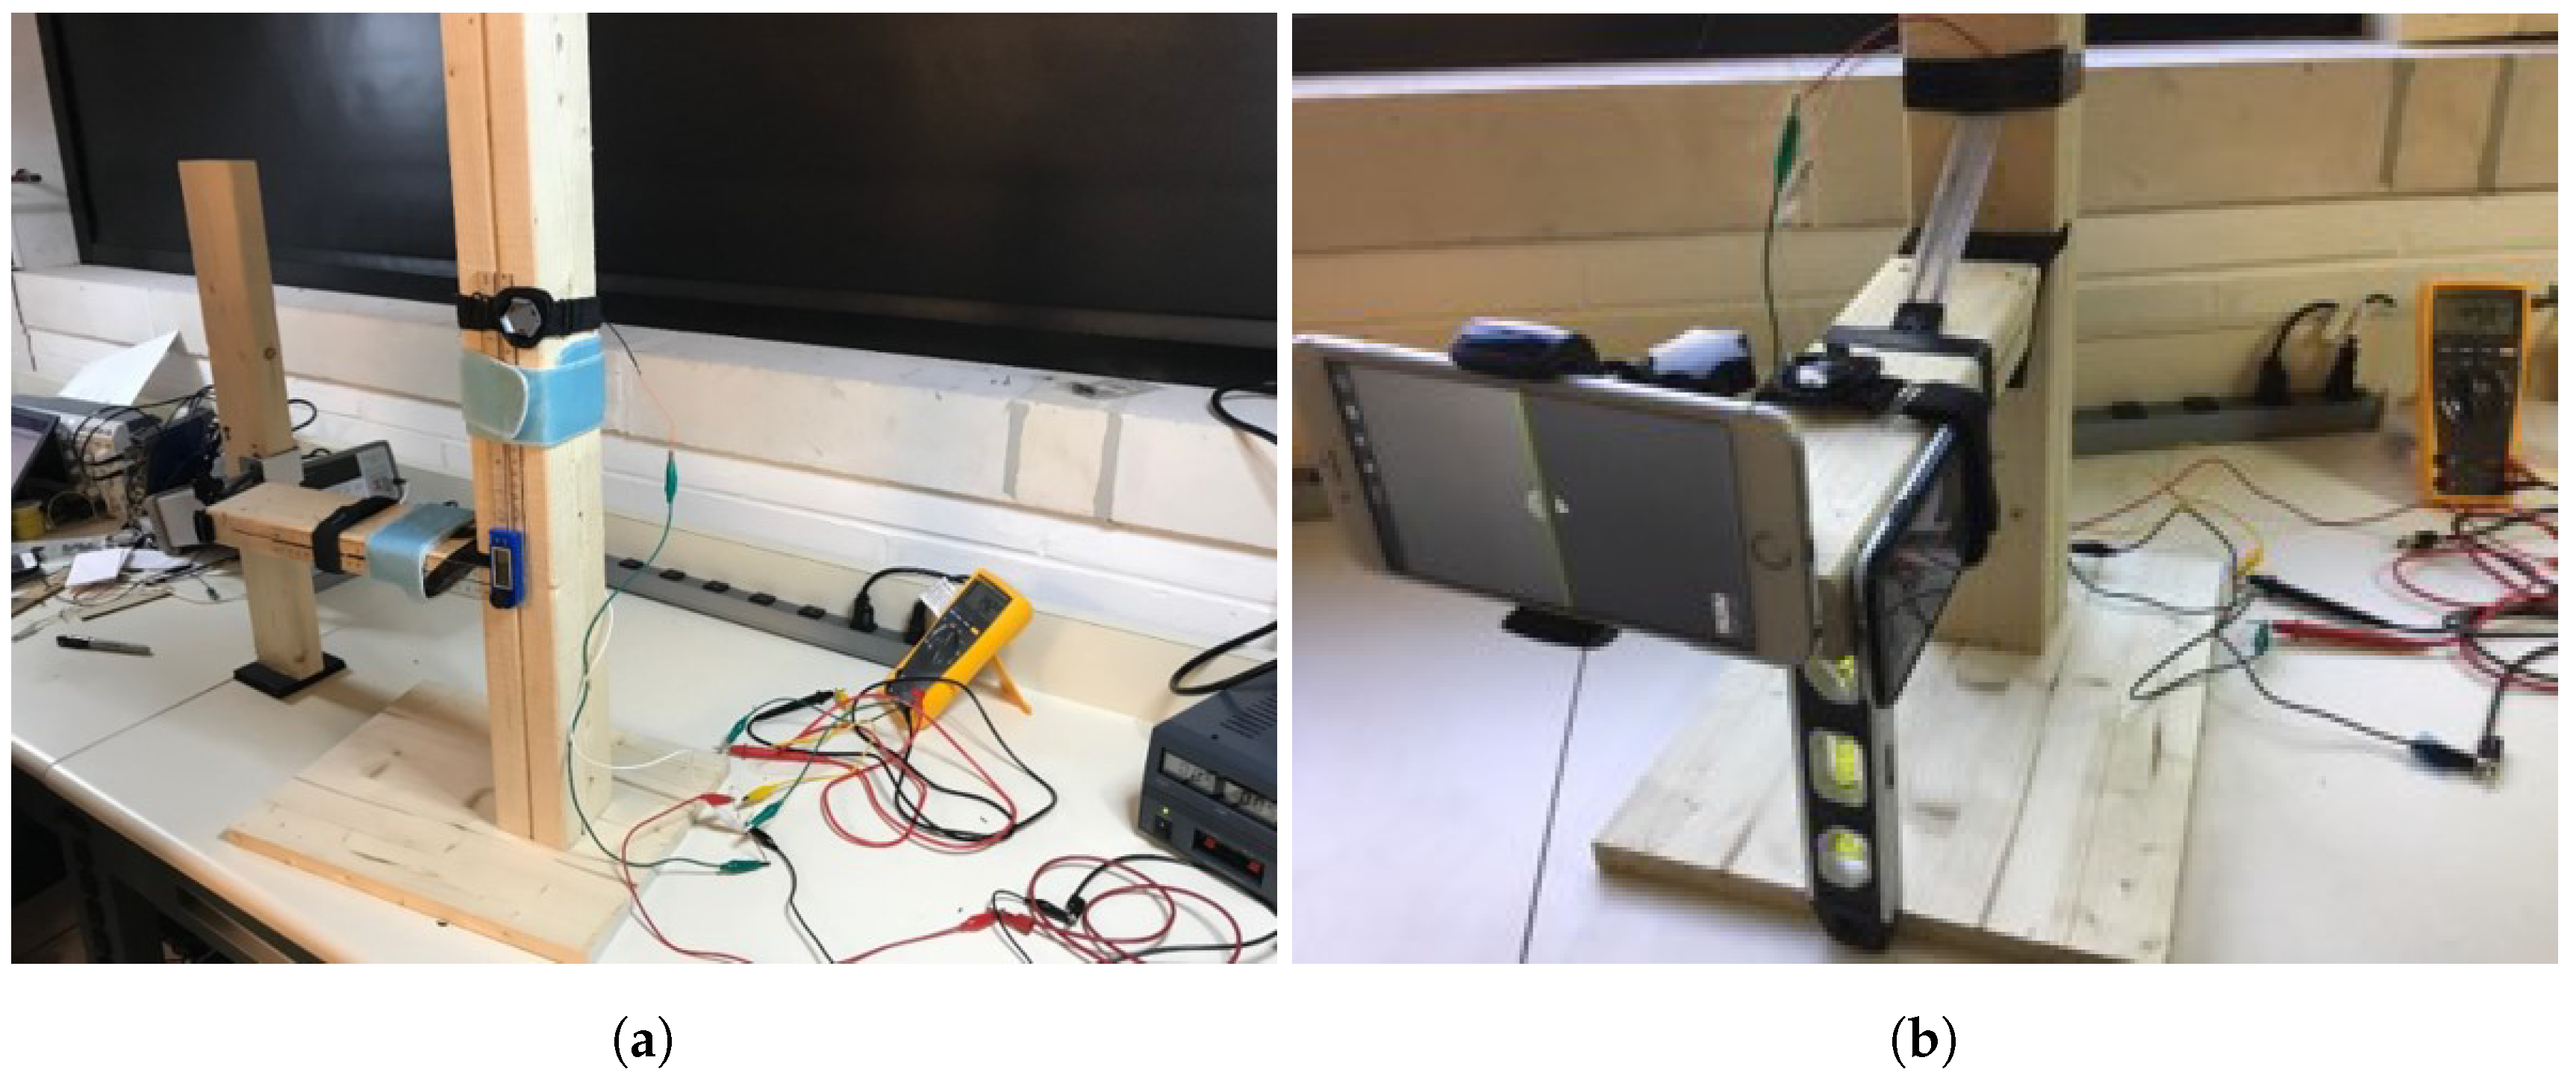
The goals of the Liquid Wire testing were to (a) validate that the Liquid Wire sensor is linear in resistance versus stretched length; (b) validate that the Liquid Wire sensor is linear in resistance versus stretched length at various temperatures; and to (c) validate that the Liquid Wire sensor’s resistance could be accurately measured in a microprocessor-based solution.

2.1.2. Equipment

Test equipment is shown in Table 2. Table 3 lists the bill-of-materials for the computing unit.

2.1.3. Test Procedure

An apparatus was constructed to take measurements from the Liquid Wire sensors at various stretched lengths. In order to stretch the sensor in a stable and consistent manner, an IRWIN four-inch drill press vise was mounted on top of a table. Two IRWIN QUICK–GRIP three-inch clamps held down each end of the Liquid Wire sensor to an end of the vise. Care was taken to not over–tighten the clamps so as to not damage the test article. A digital caliper was used to measure the length of the segment of sensor being stretched. A screw located on one side of the vise was used for adjusting one side of the vise and was used to consistently stretch the Liquid Wire sensor. Figure 1 shows the test fixture in the Sensor Analysis and Intelligence Laboratory (SAIL) facility. The Liquid Wire sensor is the dark band highlighted near the bottom of the figure. The caliper measuring the sensor length is also highlighted. By turning the vice screw, the sensor length can be carefully adjusted.

Linearity Testing

For the first experiment, two benchmark methods for measuring resistance were used to determine if there is a linear relationship between resistance and stretch length. The methods used were: (a) a Micro-Ohm Meter, which is the lab standard in measuring resistance; and (b) a Wheatstone bridge circuit, which is a very accurate and common circuit used for measuring resistance. These two methods were evaluated and compared against each other to decide which one would be used for the remaining experiments. For the first method, an Agilent Micro-Ohm Meter was connected directly to the Liquid Wire sensor to measure its resistance. The Liquid Wire sensor was mounted on the testing apparatus, and the screw was turned in 180 intervals. At each interval, the resistance and length of the sensor was measured. This was done until the sensor was stretched to approximately 20 mm longer than its original length.
The same process was then repeated for the Wheatstone bridge circuit. For this method, three 10 Ω resistors were soldered together. Care was taken to identify these resistors as R1, R2, R3, similar to the schematic shown in Figure 2. The Micro-Ohm meter was used to record precise measurements of the three resistors to be used in calculations. Alligator clamps were used to connect the Liquid Wire sensor to R2 and R3. A power supply (Vsupply) was connected and set to 0.5 V to reduce current draw through the resistors. The positive end was connected to the node between R1 and R3, and the negative end was connected to the node between R2 and the Liquid Wire sensor. A multimeter was then connected at the node between R1 and R2 and the node between R3 and the Liquid Wire sensor, and these nodes are labeled as V12 and V34 in Figure 2, respectively. A voltage measurement (Vmeasured) was taken from the multimeter to determine the difference between these two nodes. These values were used to determine the resistance with Equations (1) and (2), where all resistances have units of Ohms. The complete derivation for these equations can be found in Appendix A.
α = V m e a s u r e d V s u p p l y + R 2 R 1 + R 2
R L i q u i d W i r e = R 3 α 1 α
The benefits of using the Micro-Ohm Meter is its level of precision and the ease of setup as circuit construction was not required to get sensor measurements. Moreover, measurements from this very accurate device were used to validate the prototype computing unit’s measurements. However, this method was not without issue. Due to the way the device calculated the sensor’s resistance, there was inherent drift in the measurements. Also, the resistance was updated about once a second, therefore, measuring with this method would not work in a real-time application. The change in resistance was still linear, but it was difficult to get a consistent measurement, since the Micro-Ohm Meter would slightly change the value displayed soon after stretching the sensor. While the multimeter output for the Wheatstone bridge circuit did not provide the same level of precision as the Micro-Ohm Meter, it still provided a more consistent reading for the researcher to record. This was important for consistently collecting data in the remaining experiments.
Results for both of these methods are discussed in Section 3.1.1. Based on the issues described related to taking measurements with the Micro-Ohm Meter, the Wheatstone bridge circuit was selected as the method of measurement to be used for the remaining experiments described in this section as well as the static model testing described in Section 2.2. During this experiment, the researchers noted that the connections to the sensor leads were getting damaged. After consulting with Liquid Wire, the company stated that a sensor would not work reliably and could potentially be damaged if stretched 20% beyond the sensor’s original length.

Temperature Testing

In order to verify that the Liquid Wire sensor output remained linear against stretched length regardless of temperature, the same testing apparatus was arranged as described in Section 2.1.3 using the Wheatstone bridge circuit. Two types of Liquid Wire sensors were used, each with a different substrate: one with a TPU (thermoplastic polyurethane) coated proprietary liquid metal, and one with a silicone covering. The different types were chosen for this particular experiment to evaluate whether or not substrate had an effect on resistance at different temperatures. Data was collected for four different stretched lengths of the sensor. This data was first collected with the sensor at room temperature. Afterwards, a heat gun was used to heat the sensor up to 80 F. A hand-held temperature sensor was used to monitor sensor temperature and make sure that it was maintained at the same temperature. Data was then collected, and the temperature was verified and corrected at each stretched length. This process was completed one last time at 98 F, to simulate the surface temperature of the human body’s skin. Results from this experiment are discussed in Section 3.1.2.

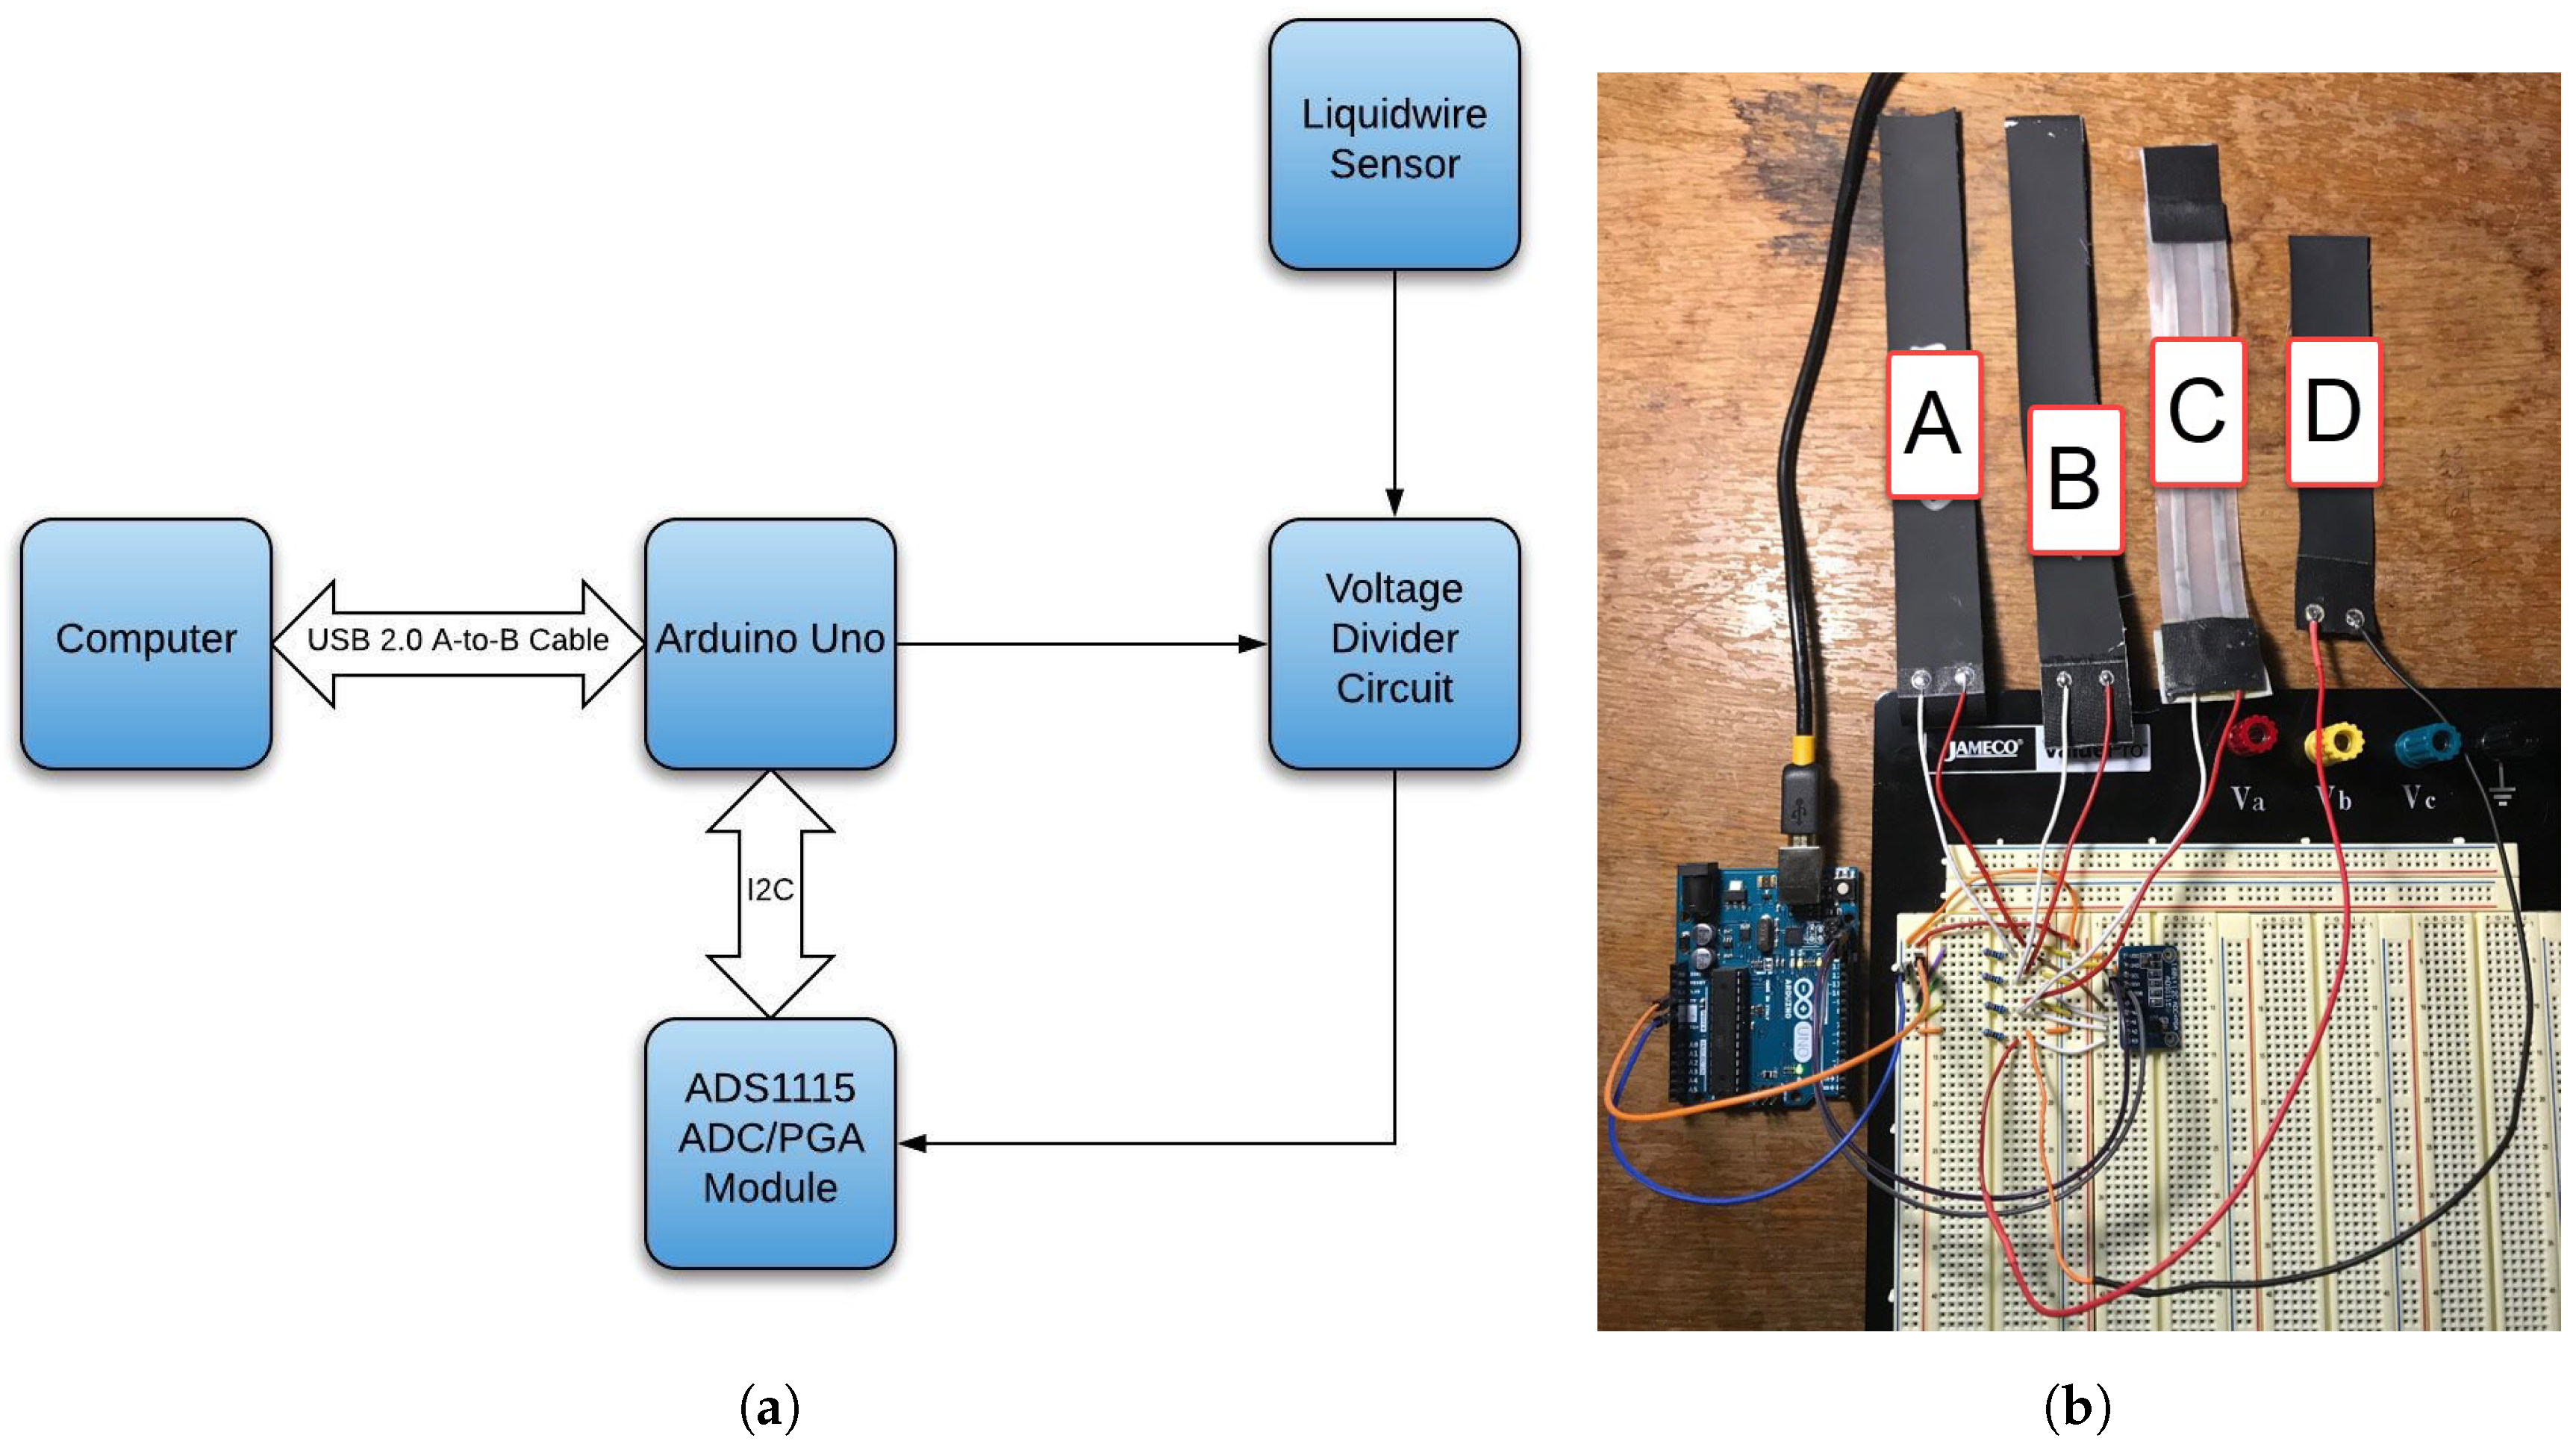
Microprocessor Testing

A microprocessor-based prototype, also known as the computing unit, was constructed to validate the potential for the sensor data to be collected in real-time. This prototype was designed to take measurements from the various types of sensors that were supplied by Liquid Wire, which would also be used for future research experiments (See Future Work in Section 4.2). Table 4 provides several examples of sensors that were tested, which are also pictured in Figure 3. The researchers first designed the prototype using an Arduino Uno R3, an ADS1115 16–bit Analog–to–Digital Converter (ADC) Module, and the previously described Wheatstone bridge circuit. The ADC module was able to pick up small changes in voltage due to its high precision voltage reading, which was useful for increasing sensitivity to changes in stretched length of the Liquid Wire sensor. This module was able to collect even more precise data through the use of its built–in programmable gain amplifier (PGA), which could amplify small signals to provide even more sensitivity to sensor output changes. It essentially replaced the multimeter used in the previous experiments, as it took the difference in voltage measurements between nodes V34 and V12 and transmitted a corresponding analog value to the microprocessor over I2C. The Wheatstone bridge circuit and ADC module were powered by the 3.3 V source from the Arduino Uno. Due to the higher voltage supply, the 10 Ω resistors were replaced with 100 Ω resistors to reduce current flow through the circuit. An extra 100 Ω resistor was placed in series with the leg of the Liquid Wire sensor to keep the bridge closer to being balanced. The microprocessor communicated with a laptop over a serial connection and provided output that indicated the current resistance of the Liquid Wire sensor.
While testing the prototype with different sensors, the researchers encountered an issue with reaching a peak amplified voltage due to the differences in resting resistances (resistance measured without stretching) between the Liquid Wire sensors. These resting resistances ranged from roughly 5 Ω to 45 Ω . To prevent this issue, either the gain of the amplifier had to be reduced or the values of the resistors in the Wheatstone bridge had to be increased. Furthermore, this would come at the expense of losing levels of voltage measurements, also known as bins. In practical terms, when correlating sensor readings to joint angles, the prototype would lose precision when estimating angles in future experiments if the circuit was not physically changed. Due to this issue, the researchers investigated replacing the Wheatstone bridge circuit with a voltage divider circuit, which was determined to be a simpler and more flexible method for measuring sensors of varying resistance. An added benefit to the voltage divider circuit was that four sensors could be measured at the same time instead of two, since the ADC module would only need to measure the voltage measured at one node (V1 in Figure 4).
The data shown in Figure 5 taken from Personal Simulation Program with Integrated Circuit Emphasis (pSPICE) provides further justification for this design choice. The simulation performed shows the range of bins that correlate to the given range of resistances that was stated previously. The simulated Wheatstone bridge circuit used 100 Ω resistors at each leg with a variable resistor in series with one of the legs to emulate the Liquid Wire sensor. An instrumentation amplifier was connected to nodes V34 and V12 to emulate the PGA functionality of the ADC module taking a differential measurement. The simulated voltage divider circuit used a 150 Ω resistor in series with a variable resistor. A non-inverting operational amplifier was connected at node V1 between the 150 Ω resistor and the variable resistor to emulate the PGA functionality of the ADC module taking a single-ended measurement. In simulation, the gain was set to 4 volts per volt (V/V) for both circuits. At a range of 5 Ω to 40 Ω for the variable resistor, the voltage divider circuit provided 74,421 bins for measurements, while the Wheatstone bridge circuit provided 57,856 bins. When factoring in that the Wheatstone bridge loses linearity in measuring voltage around 32 Ω , the realistic amount of resolution provided is closer to 50,390 bins. The fact that the circuit provides less resolution and still fails to take reliable measurements after a certain threshold indicates that the voltage divider circuit is the better choice for the prototype. A picture of the computing unit and a block diagram describing the design are shown in Figure 3. The design change for the computing unit’s circuit design is depicted in Figure 4.
After re-designing the prototype, the voltage divider circuit replaced the Wheatstone bridge circuit to validate the accuracy of the computing unit. The same test procedure described in Section 2.1.3 that was used for validating linearity of the Liquid Wire sensor was conducted using the computing unit as a method of measurement. The data collected from the computing unit was compared to data collected with the Micro-Ohm meter to validate accuracy. Results are discussed in Section 3.1.3.

2.2. Static Model Testing

The human ankle complex is comprised of three joints: the talocrural joint, the subtalar joint, and the distal tibiofibular joint, which is a syndesmosis joint [25]. This allows the foot and ankle to move in multiple planes of motion as needed for walking, running, and athletic movements. Modeling of the ankle complex has provided basic descriptions of foot movement in plantar flexion, a downward movement of the foot; dorsiflexion, an upward movement of the foot; eversion, an outward movement of the bottom of the foot; and inversion, an inward movement of the bottom of the foot. Using these four measures of ankle complex movement has been shown to be effective in studying the differences in passive and active joint movement [24].
To understand the sensor output’s relationship to the ankle joint movement, a model of the human ankle was constructed of 2 × 4 pine and 3/8 rubber flooring material securely screwed into the wood, allowing for angular rotation in the sagittal and frontal planes as derived from a previous model used in the literature [67]. The sensor was then attached to the model using toupee double sided tape and reinforced with an overlapping elastic band to secure and create two anchor points. Upon attachment, the sensor was stretched slightly. To measure the degrees of plantar flexion and rotation, two smartphones were calibrated using a carpenter’s bubble level running the RIDGID Level iOS application. The smartphones were securely attached to the model via elastic bands and phone mount. An electronic goniometer was used to validate the measurements from the smartphone. Using smartphones allowed for validation of accurate measure for the degrees of movement compared to the hand placement of the electronic goniometer on the model for each change in position. The movement of the model foot was performed by one experimenter while a second experimenter read and recorded the voltage output from a multimeter. A TPU-based sensor and a silicone-based sensor were used for this study. Markings on the model allowed for consistent placement of the different Liquid Wire sensors.

2.2.1. Testing Goals

The goals of the model testing were twofold: (a) to capture changes in resistance of the Liquid Wire sensors relative to simulated ankle complex movement and (b) to evaluate the different substrates in capturing simulated ankle complex movement. Previous bench testing provided insight into the linearity of the Liquid Wire sensors; the focus of this portion of the study is on consistent linearity occurring in simulated joint rotation.

2.2.2. Equipment

The ankle model was constructed of a 1/2 wooden base with a vertical wooden 2 × 4 spine screwed to the base. Two additional 2 × 4 ’s were used, allowing for the flexible flooring to be securely screwed to the bottom 2 × 4 . The additional 2 × 4 was placed on top of the flooring material and secured by screws into the 2 × 4 spine. Another 2 × 4 was attached to the top of the flooring material which represented the foot. Images of the model are shown in Figure 6. The sensor was connected to a Wheatstone bridge circuit that was arranged as described in the Linearity Testing portion of Section 2.1.3.

2.2.3. Test Procedure

Two researchers compiled the data onto a Microsoft Excel formatted sheet. After properly applying and securing the sensor with toupee tape and an anchor strap, and mounting the smartphones onto the model, one researcher moved the model’s foot and called out the number of degrees of movement. The second researcher then recorded the multimeter output onto the Excel sheet. After recordings were taken, calculations were run based on the previously given Equations (1) and (2) to determine the resistance of the Liquid Wire sensor.

3. Results and Discussion

This section discusses the results of the Liquid Wire TPU and Silicone sensors conducted in Section 2 (a) the bench testing on linearity; (b) temperature testing; and (c) changes in resistance during a static positioning representing plantar flexion, inversion, and eversion on the ankle model.

3.1. Liquid Wire Testing Results

The following three subsections discuss the results gathered and their relevance to the testing goals (a), (b), and (c) as defined in Section 2.1.1.

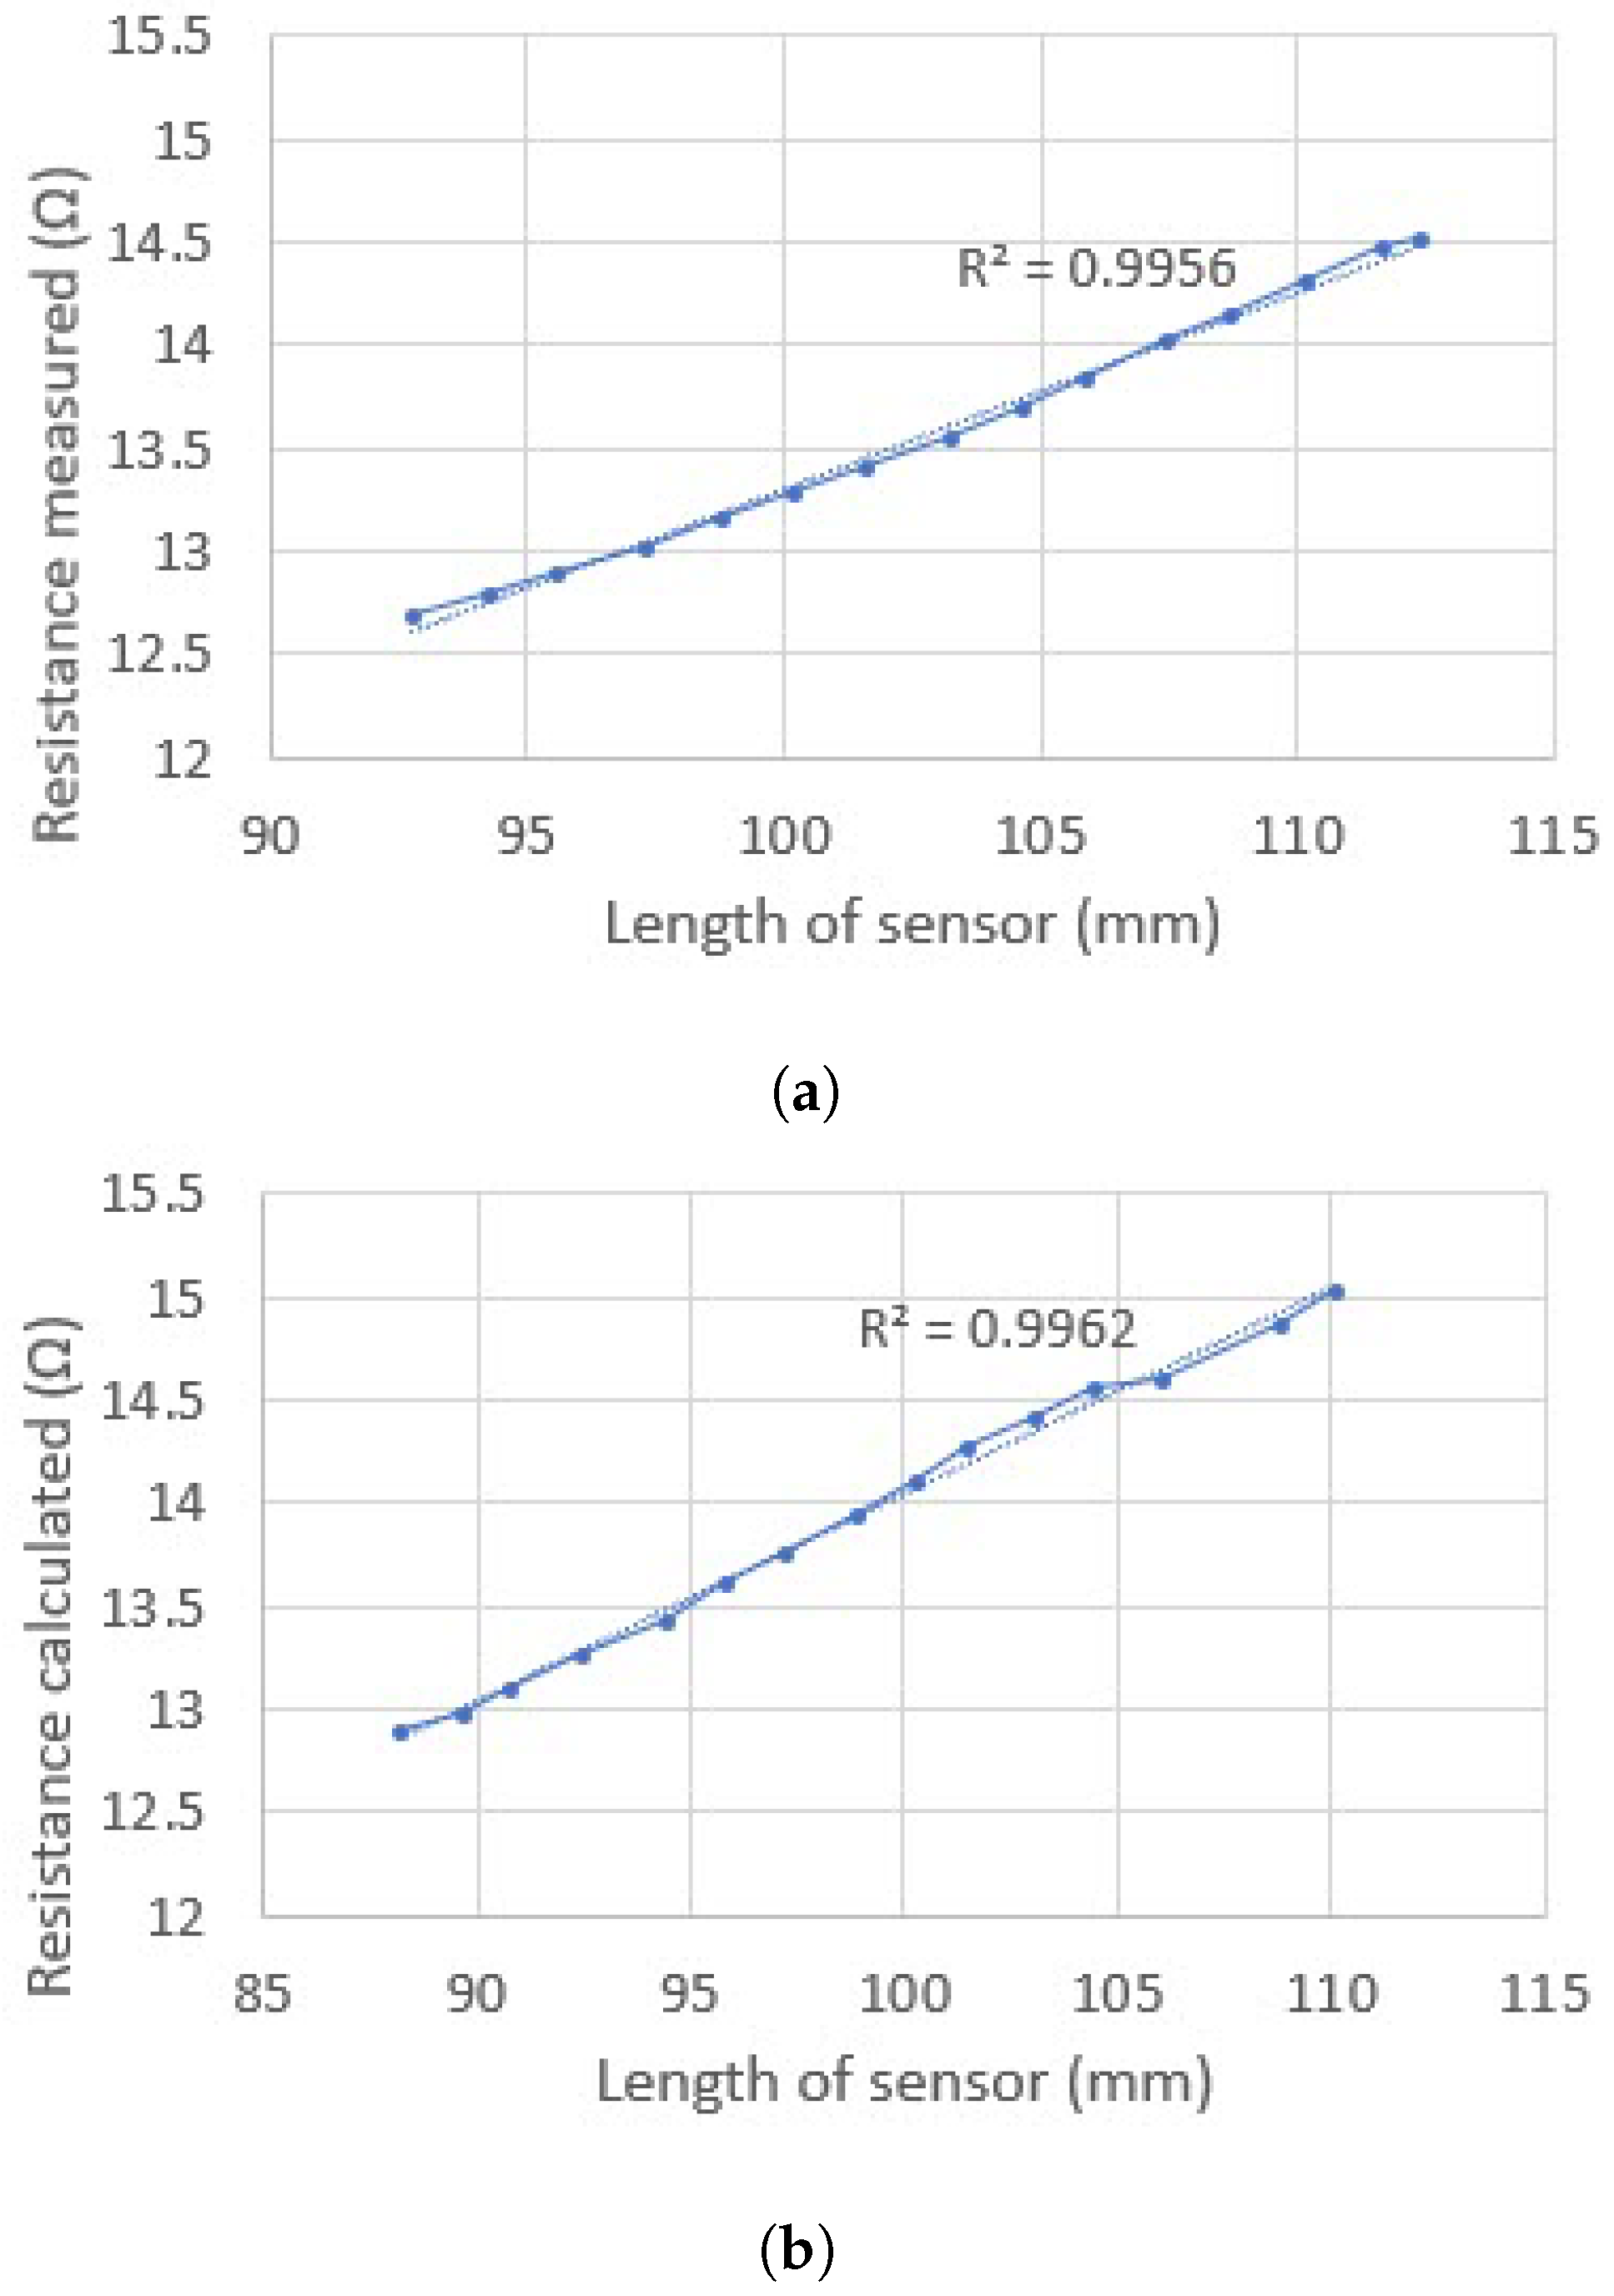
3.1.1. Linearity Testing Results

The results in Figure 7 address testing goal (a) of Section 2.1.1, which was to validate that the Liquid Wire sensor was linear in resistance versus stretched length. Linearity in stretched length was evident for both the Micro-Ohm Meter and the Wheatstone bridge circuit. Figure 7 depicts linearity test data collected for each method as well as their coefficient of determination values.

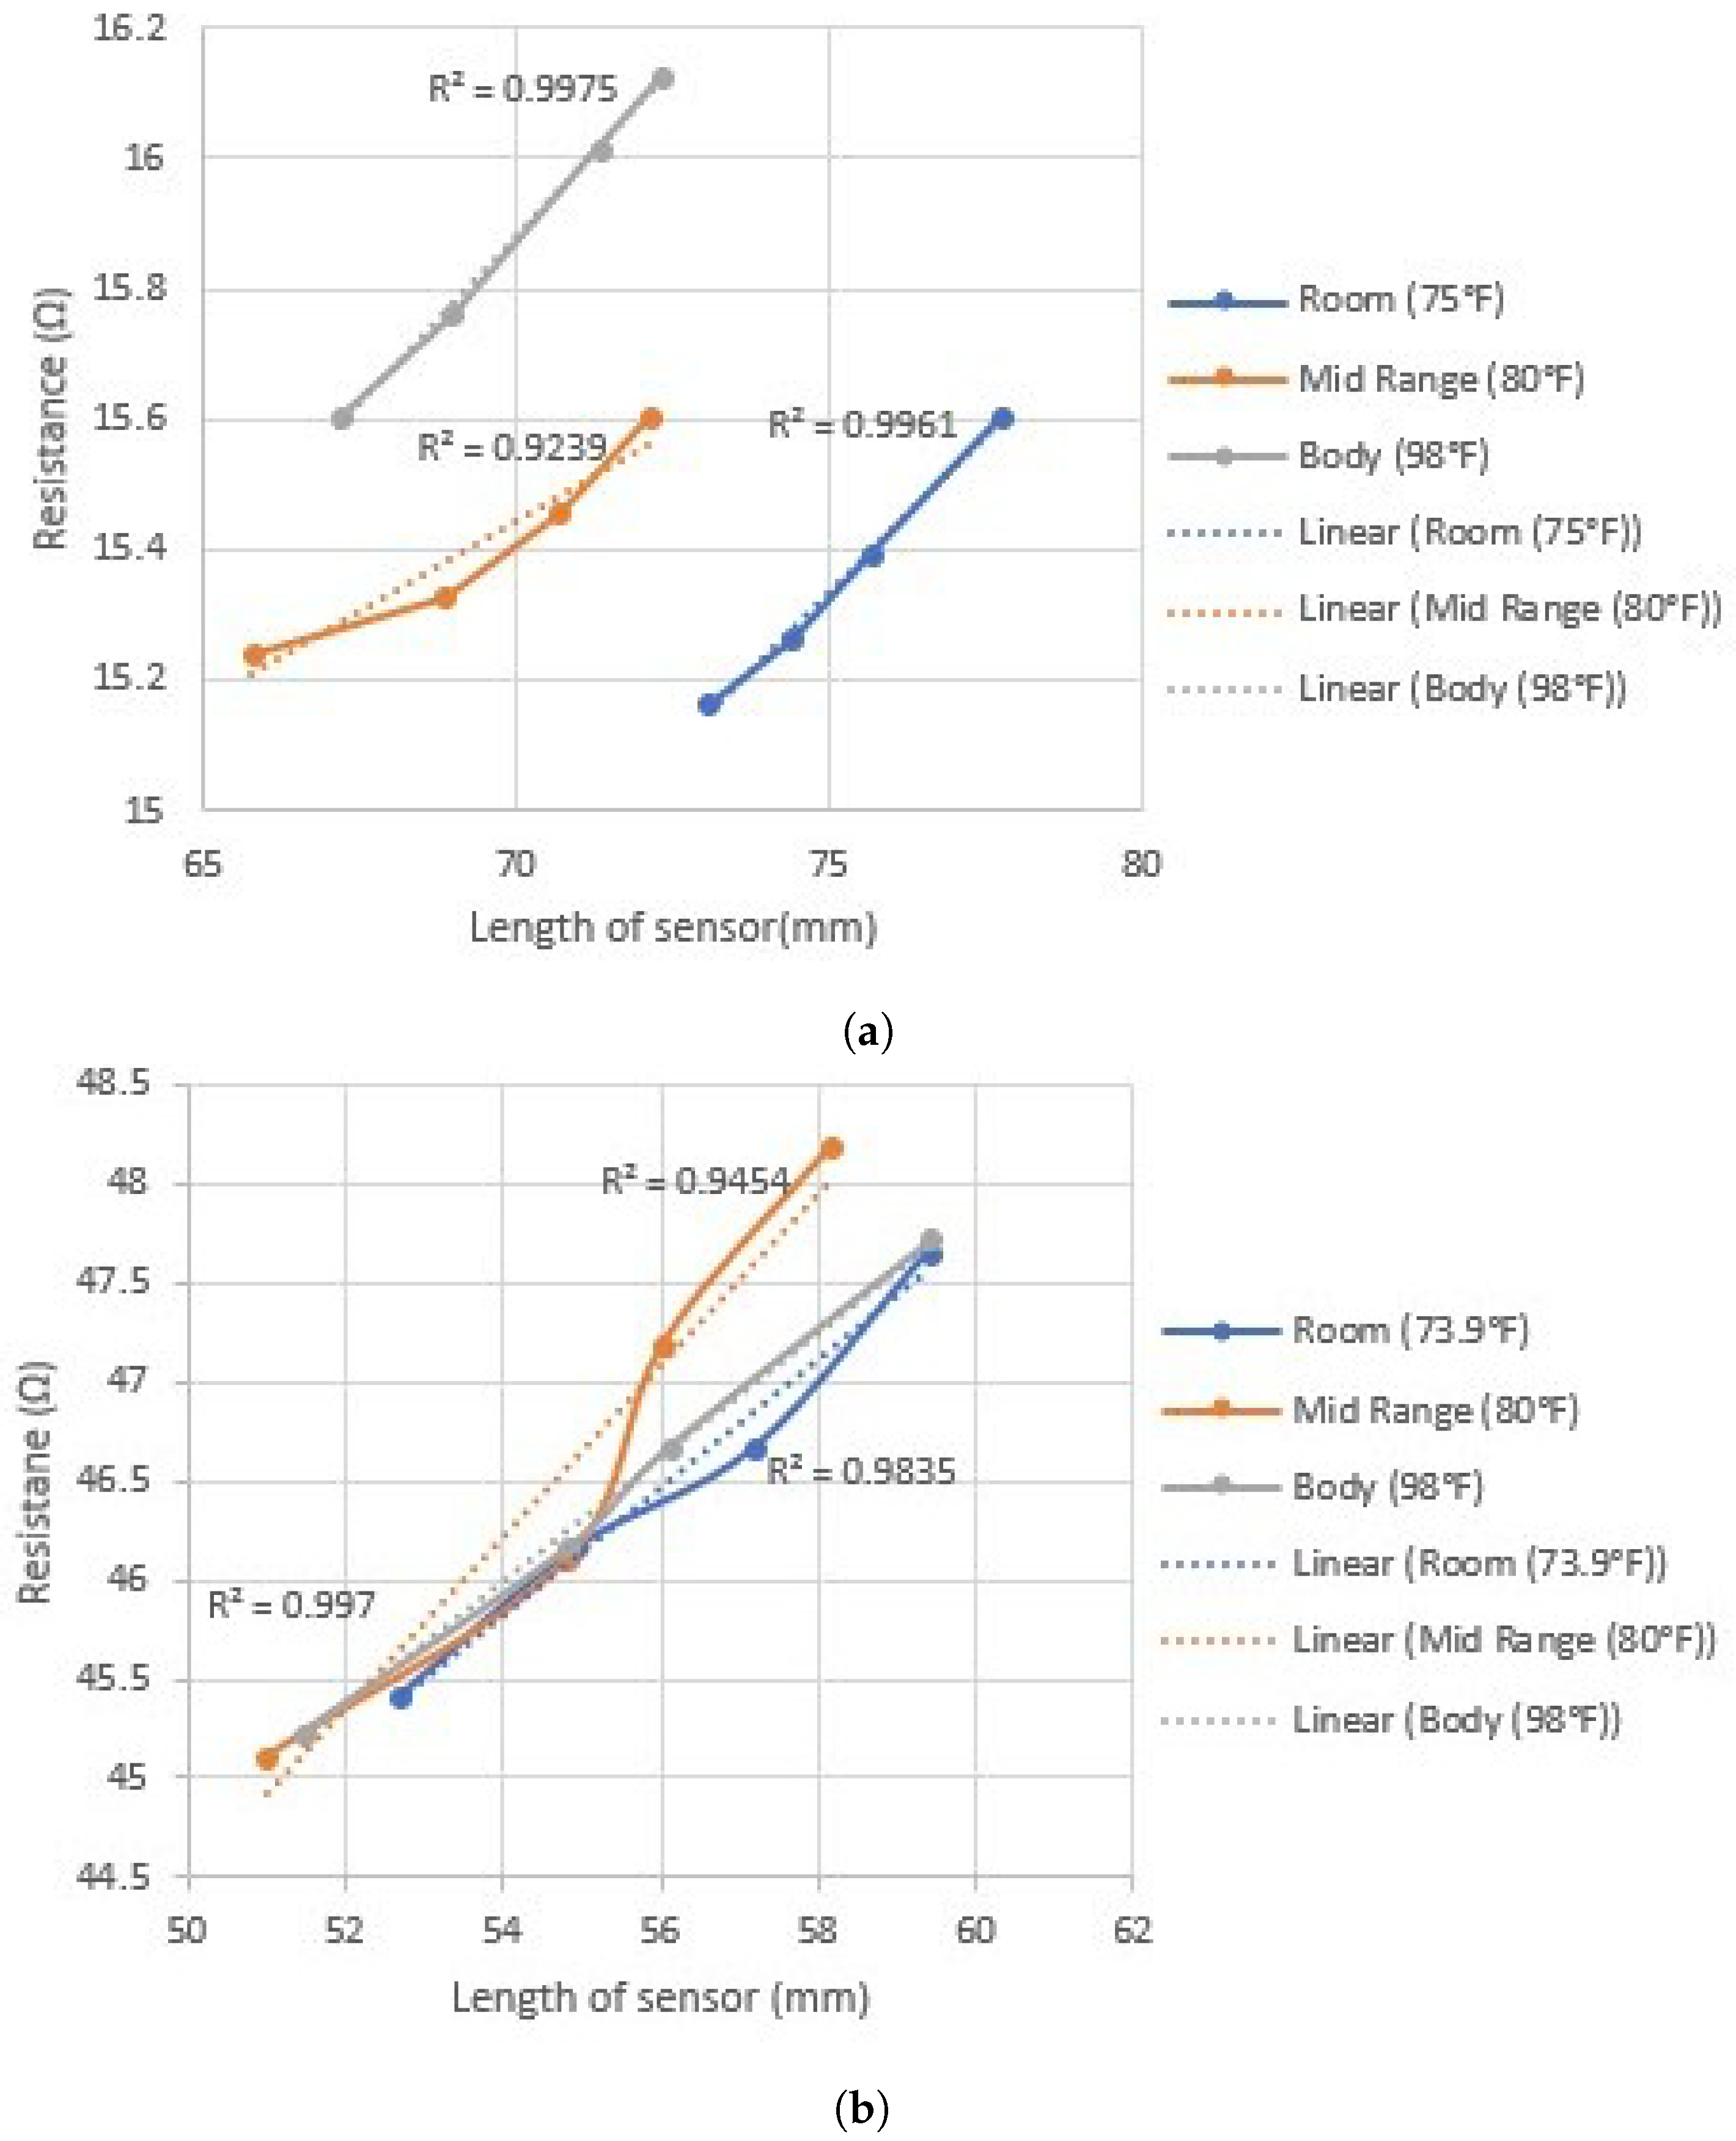
3.1.2. Temperature Testing Results

Next, testing goal (b) of Section 2.1.1 was addressed, which was to validate that the Liquid Wire sensor was linear in resistance versus temperature. Based on the data gathered, temperature did not have a drastic effect on the linearity of strain on the Liquid Wire sensors. However, one interesting result was that temperature did appear to have an effect on the TPU sensor’s resistance overall, as the values measured increased with temperature. Based on the data collected from the silicone sensor, there appeared to be minimal correlation with resistance and temperature. This finding is important when considering tying resistive values to the tracking of movement on the human body. If the TPU sensor is used, extra temperature sensing may be needed to correct an increase in resistance value if the sensor’s temperature is affected by the human’s surface body temperature. Results are shown in Figure 8.

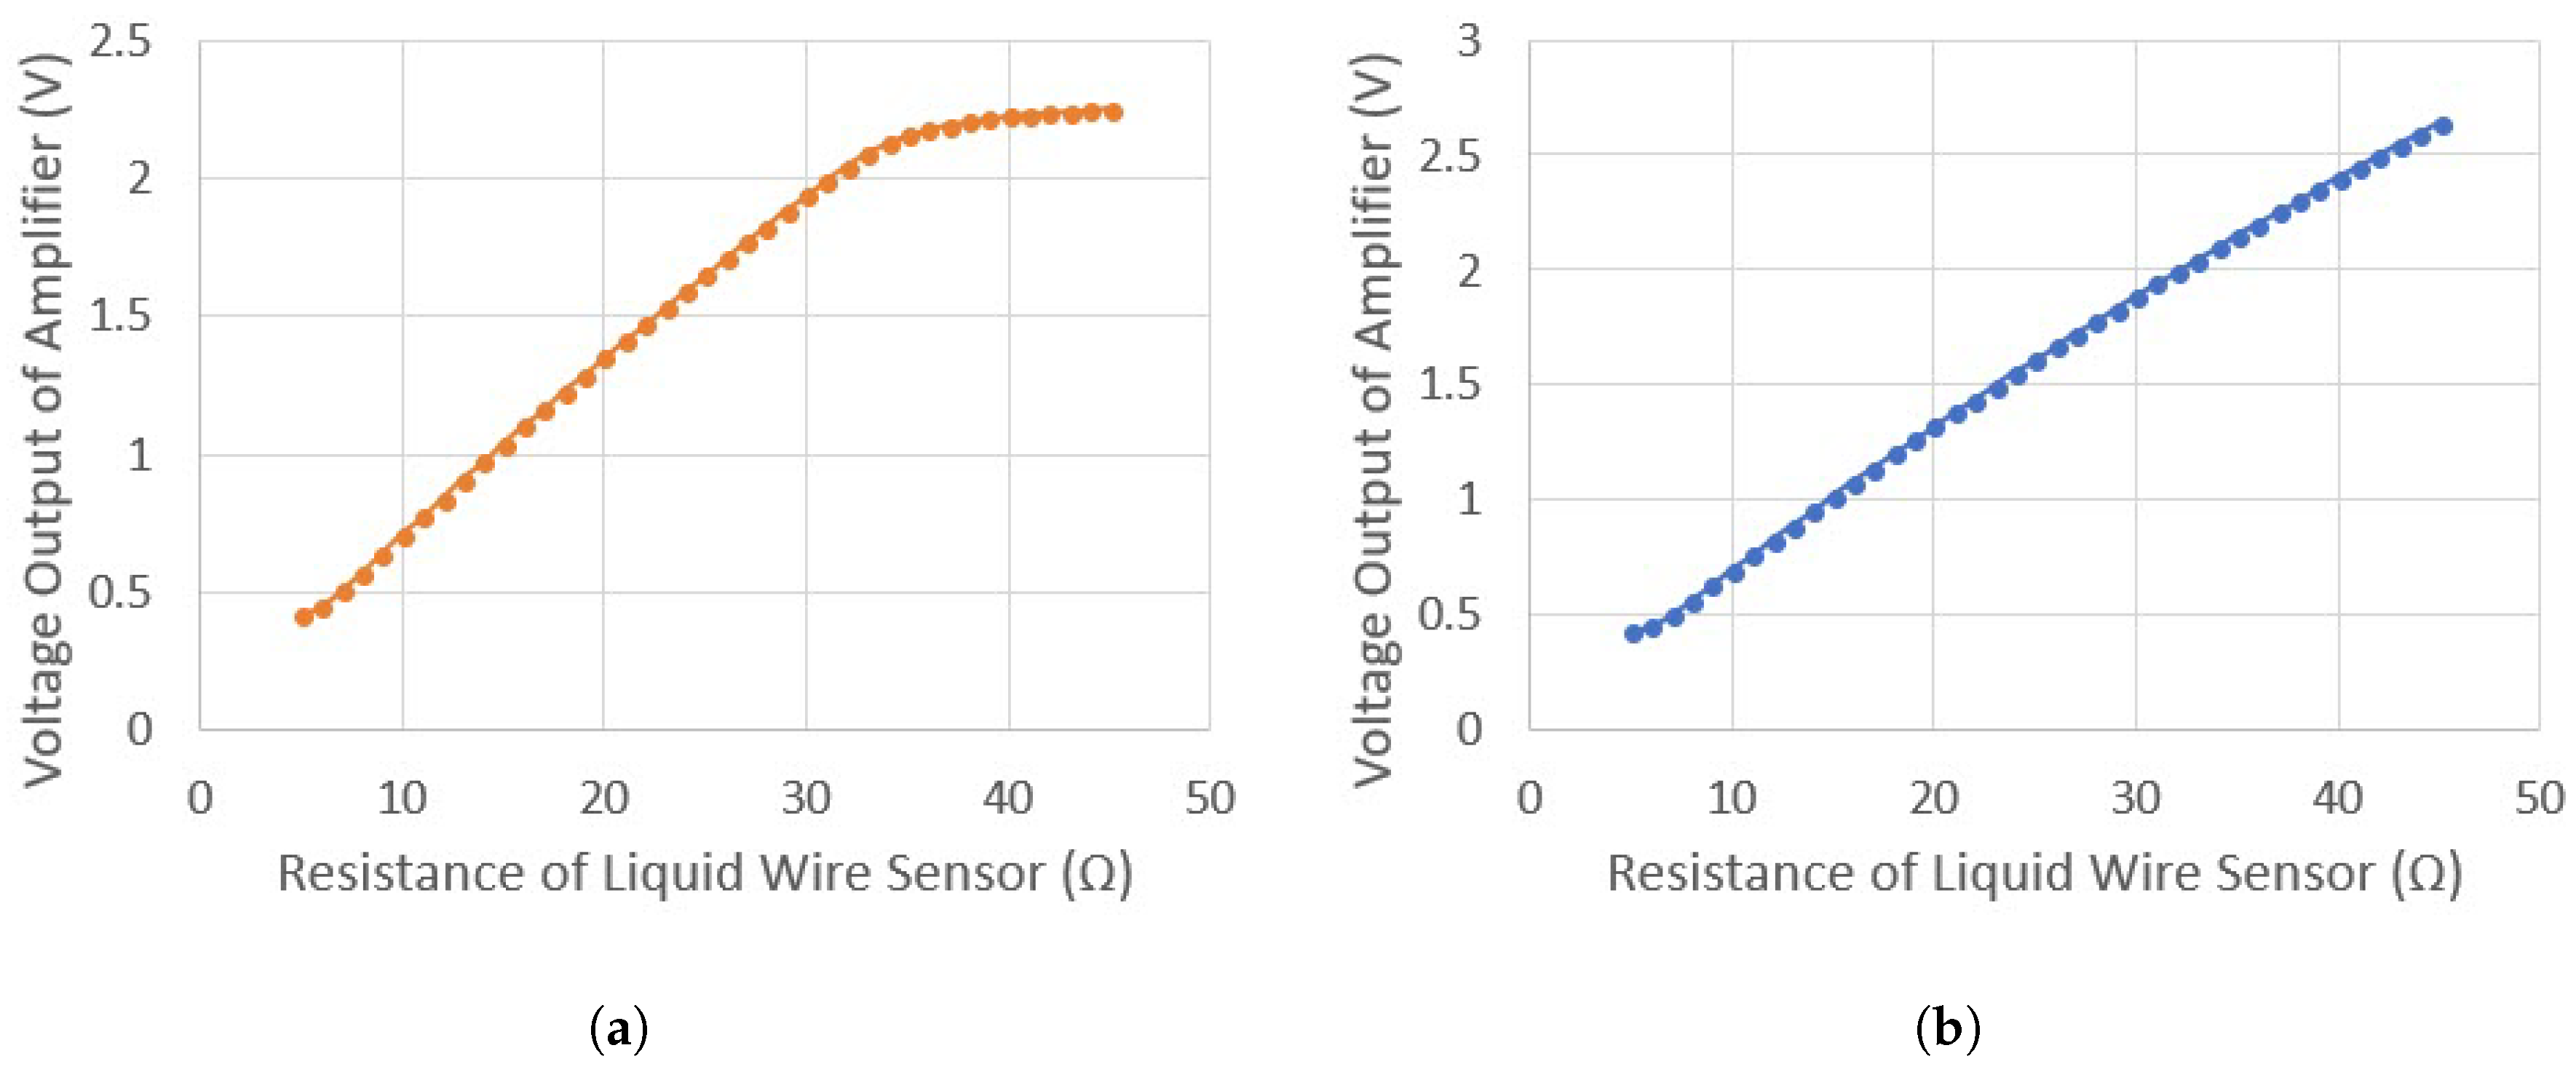
3.1.3. Computing Unit Testing Results

Finally, the computing unit prototype was compared against a Micro-Ohm meter to satisfy testing goal (c). The prototype constructed for taking measurements of the Liquid Wire sensor proved to be a viable solution. An average percent error of 1.55% was calculated between the measurements taken from the computing unit and the Micro-Ohm meter. This could have been due to the calculations performed by the microprocessor, or from researcher error when resetting the linearity testing apparatus. Results are shown in Figure 9. These results show that the computing unit is very close to measurements of a high–accuracy, laboratory unit.

3.2. Estimating Angles from Liquid Wire Measurements Testing Results

To test the linearity of both the Liquid Wire TPU and Silicone sensors, the model was moved and held at specific, static degrees representing human ankle complex plantar flexion. This resulted in the degree of plantar flexion as the independent variable and sensor resistance as the dependent variable. Using a regression analysis comparing the change in sensor resistance when stretched due to changes in increasing ankle model’s plantar flexion resulted in the development of two mathematical models. The significance level was set at α = 0.05 for all of the analyses. The Fit Regression Model analysis (MiniTab18 Statistical Software, USA), revealed the regression models for the Liquid Wire TPU (Equation (3)) and Liquid Wire silicone sensor (Equation (4)), which produced linear models with coefficients (p–value <0.001). Thus, the model provides the expected value of sensor resistance in Ohms when varying degrees of D, which is angle of plantar flexion in degrees. R T P U is the resistance estimate for the TPU sensor, and R S I L is the resistance estimate for the silicone sensor, respectively. The rotational aspect of the model resulted in almost equal changes in resistance of the sensors. This provided insight into the requirement of using multiple sensors to assess ankle inversion and eversion. Due to the symmetry of the change (Figure 10c,d), it would not be possible for the software to determine whether the change in resistance was inversion or eversion. In future human trials, we will assess changes in degrees of ankle complex movement from specific ranges of sensor resistance. Measurement results of the Liquid Wire sensor are shown in Figure 10.
R T P U = 10.9831 + 0.01142 D
R S I L = 6.2922 + 0.05194 D

4. Conclusions

The purpose of this research was to find a way to mitigate some of the concerns regarding wearable technology identified by the SMEs interviewed in response to the NSF I–Corp project. The first noted concern was the lack of wearable solutions that capture data “from the ground up” and provide meaningful data about the ankle complex. The researchers addressed this concern by focusing on a sensor-based solution that could accurately capture movement of the ankle complex. The second concern voiced by the SMEs was their lack of trust for existing wearable solutions. The identification of this trust issue is accompanied by research in literature as there are known concerns with IMU drift and the need for calibration of wearable equipment. To address this concern, the research team investigated liquid metal sensors to determine if they would be an appropriate measurement option in future wearable solutions. The researchers wanted to learn if liquid metal sensors could be utilized to capture absolute joint angles as opposed the inferred joint measurements that are present in most wearable solutions available during the time of this study. For this reason, Liquid Wire sensors were selected.
In order to test the Liquid Wire sensors, basic tests were performed to validate the linearity of the sensors using two methods: (a) Micro-Ohm Meter and (b) Wheatstone bridge. The results of both methods concluded that the Liquid Wire sensors show a linear correlation between the increase in stretch of the sensor and the increase in resistance. Linearity of the Liquid Wire sensor was tested across different temperatures with the expectation being that these sensors would be located within adjacent materials, creating additional frictional heat, therefore becoming warmer than room temperature. Also, Liquid Wire sensors comprised of different substrates were tested for linearity at different temperatures with the similar expectation that they must be comfortable to the wearer, as the sensors may be embedded in or on top of material that is in close contact with the skin and therefore different materials may offer different comfort. Linearity remained consistent regardless of temperature or substrate. This is important to know as the the sensor could be closer to room temperature at the beginning of an exercise and closer to body temperature as the exercise progresses so compensating for different resistance values will be important for correctly and consistently correlating ankle complex movement to sensor outputs. For future data collection, a computing unit was built to collect resistance values. This computing unit was validated against a Micro-Ohm Meter to insure accuracy and consistency of the readings. It was determined that the voltage divider circuit is more practical than the Wheatstone bridge at this time, since we don’t currently have a consistent resting resistance to work with. Furthermore, using the voltage divider reduced the size of our circuit and allowed us to measure more sensors at the same time with the ADC module, which could end up working in our favor for future product hardening.
To further test Liquid Wire capability in the context of ankle complex movement, a model of the human foot and ankle was constructed to provide a platform on which to attach the sensor and test for very specific human movements such as plantar flexion. With the aid of the ankle complex model, both substrates were tested while performing the plantar flexion motion and both TPU– and silicone-based sensors were found to have a significant relationship between the positional change and the resistance values therefore confirming that the Liquid Wire solution is effective for accurately capturing these types of movements.
The results of the study ultimately confirm the researchers’ hypothesis that liquid metal sensors, and Liquid Wire sensors specifically, can serve as a mitigating substitute for IMU-based solutions that attempt to capture specific joint angles and movements. The solution that the researchers have begun to design based on this Liquid Wire-based ankle complex wearable concept will be effective in overcoming the primary concerns identified by the SMEs that use wearable technology in athletic and training environments.

4.1. Limitations

To the knowledge of the researchers performing this study, this research was the first of its kind; therefore, limitations were identified during the discovery process. First, the Wheatstone bridge circuit used to power the sensors and capture sensor resistance exhibited small levels of noise causing minimal variations in voltage output at the time of data capture readings. Creating a printed circuit board (PCB) for future research will help to solve this problem by reducing the sensitivity of the analog signal to noise. The Liquid Wire sensors themselves did not appear to contribute to the noise in the measurements and so a PCB solution should mitigate this problem.
Second, because a wooden model of the ankle complex was used and not a real human ankle, there were limitations in the ability to capture certain movements such as dorsiflexion. In order to capture dorsiflexion, the sensor needed to be fastened to the wooden model in such a way as to keep the Liquid Wire sensor in a stretched position so that a reduction in resistance could be measured as the “foot” was lifted back and toward the “shin”. However, if the sensor’s position begins at rest and no stretching is applied to the sensor, then the resistance value will not change and therefore will not be representative of movement changes. Beginning trials with the Liquid Wire sensor in a stretched state posed an issue for the researchers because of the length of the sensor and the rigid nature of working with the wooden model that led to stretching the sensor beyond its 20% stretch limitations. This over-stretching often resulted in a damaged sensor or damaged sensor terminals. For this reason, dorsiflexion has to be demonstrated by a reverse of the methods used to test plantar flexion which prove the capability of the sensor in that it remains linear as the stretch state is removed but is not representative of real dorsiflexion movements. Furthermore, due to the sensor being set in a stretched state and the method by which it was mounted, there would sometimes be slippage at the point at which it was mounted. Since the sensor output is also sensitive to change based on pressure, this caused variation in the resistance measurements taken at each angle for plantar flexion. The researchers believe that the dimensions of the wooden model versus the dimensions of a real ankle complex attribute to these challenges. This measurement was also difficult to make because only one sensor was used, leading to the next limitation.
Third, ankle complex movements are complicated and three–dimensional in nature. Only using one sensor to take measurements limited the movements that could be studied. For example, inversion and eversion occur when the foot is turned either inward or outward respectively. A single Liquid Wire sensor is able to determine (through an increased resistance value) that movement at the ankle has occurred when an inversion or an eversion movement is made. However, the sensor cannot differentiate between these two movements. Likewise, when a plantar flexion movement is combined with either an inversion or eversion movement, there is no way to differentiate between the amount of stretch caused by the plantar flexion version verses the other movement. Multiple sensors are needed to identify direction and magnitude of the ankle complex movement.
Lastly, an important lesson learned on the part of the experimenters is the desire for consistent and common resting resistances (resistances when the liquid metal sensor is not stretched) for the Liquid Wire sensors. While all sensors were linear in their movement–to–stretch resistive output, not all sensors held comparable resistance values at rest. Due to the variation in resting resistances, a more flexible circuit was required, but this will add more complexity to the programming for the computing unit to determine resting resistances for the sensors. This was less of an issue as only one sensor was being tested at a time, but as this team moves forward with human trials and multiple sensors to capture the more difficult movements of dorsiflexion and inversion/eversion in addition to plantar flexion, a consistent resting resistance is preferred with a known, minimal variance.

4.2. Future Work

Additional work has already begun with the Liquid Wire sensors including human trials where multiple sensors with the same resting resistances will be positioned on participants in order to perform static and dynamic movements of the foot and ankle. As the limitations of this study showed, multiple sensors will need to be positioned around the ankle complex in order to capture more complicated movements, but where these sensors should be placed and how they will be held in place on the participant is a critical discovery. Using machine learning, the researchers will be able to take the resistance values from multiple sensors anchored to a participant and determine the exact position of the foot and ankle. This positioning will then be validated using motion capture and force plate feedback allowing the researchers to identify the capability delta between the soft robotic sensor solution and the golden standard of human movement analysis. Further, once preferred Liquid Wire sensor placement is identified, a proper gait study on human participants using static and dynamic movement assessment techniques will be used to validate that data “from the ground up” is being properly captured and that precise ankle complex movements are correctly identified. Once the machine learning algorithms are adequately refined for walking movements, product hardening will occur for testing of training-based movements commonly used by athletes outside of the lab in their practice environments.

Author Contributions

Conceptualization, T.L., D.S., R.F.B.V., J.E.B., H.C. and A.K.; Data curation, T.L., D.S., P.W. and T.I.; Formal analysis, T.L., D.S., R.F.B.V., J.E.B., H.C., A.K., P.W. and T.I.; Funding acquisition, R.F.B.V., J.E.B. and H.C.; Investigation, T.L., D.S., P.W. and T.I.; Methodology, T.L., D.S., R.F.B.V., J.E.B., H.C., A.K. and T.I.; Project administration, T.L., R.F.B.V., J.E.B., H.C. and A.K.; Resources, R.F.B.V., J.E.B., H.C. and A.K.; Software, D.S.; Supervision, R.F.B.V., J.E.B., H.C. and A.K.; Validation, D.S., R.F.B.V., J.E.B., H.C., A.K., P.W. and T.I.; Visualization, T.L., D.S., R.F.B.V., J.E.B., H.C., A.K., P.W. and T.I.; Writing—original draft, T.L., D.S., R.F.B.V., J.E.B., H.C., A.K., P.W. and T.I.; Writing—review & editing, T.L., D.S., R.F.B.V., J.E.B., H.C., A.K., P.W. and T.I.

Funding

This research was partially funded by the Mississippi State University Bagley College of Engineering and the Office of Research and Development.

Acknowledgments

This project was partially funded by a Mississippi State University (MSU) Office of Research and Development (ORED) undergraduate research grant and a MSU Bagley College of Engineering Working Group grants for the Multi–Sensor Working Group and the Wearables Working Group. The need for the research identified herein was derived from feedback obtained through an NSF I–Corp interview session where over 30 strength and conditioning coaches and athletic trainers were asked to speak to the current state of the wearable market for athletics and their ability to make informed decisions about health and safety using the solutions available to their programs. These interviews represented men and women from multiple sports teams across collegiate- and professional-level organizations throughout the United States. The research was conducted in the Sensor Analysis and Intelligence Laboratory (SAIL) facility at the Center for Advanced Vehicular Systems (CAVS) at Mississippi State University.

Conflicts of Interest

The authors declare no conflict of interest.

Appendix A

The following equations provide a more detailed explanation of the mathematical calculations used to determine the resistance of the Liquid Wire sensor in the Wheatstone bridge circuit. Please refer to Figure 2 for circuit components.
V 12 = R 2 R 1 + R 2 × V s u p p l y
V 34 = R L i q u i d W i r e R 3 + R L i q u i d W i r e × V s u p p l y
V 12 + V m e a s u r e d V 34 = 0
V m e a s u r e d = V 34 V 12
V m e a s u r e d = R L i q u i d W i r e R 3 + R L i q u i d W i r e × V s u p p l y R 2 R 1 + R 2 × V s u p p l y
V m e a s u r e d V s u p p l y = R L i q u i d W i r e R 3 + R L i q u i d W i r e R 2 R 1 + R 2
V m e a s u r e d V s u p p l y + R 2 R 1 + R 2 = R L i q u i d W i r e R 3 + R L i q u i d W i r e
α = V m e a s u r e d V s u p p l y + R 2 R 1 + R 2
α = R L i q u i d W i r e R 3 + R L i q u i d W i r e
R 3 α + R L i q u i d W i r e × α = R L i q u i d W i r e
R 3 α = R L i q u i d W i r e × ( 1 α )
R L i q u i d W i r e = R 3 × α 1 α

References

  1. Fong, D.T.P.; Chan, Y.Y. The use of wearable inertial motion sensors in human lower limb biomechanics studies: A systematic review. Sensors 2010, 10, 11556–11565. [Google Scholar] [CrossRef] [PubMed] [Green Version]
  2. Mengüç, Y.; Park, Y.L.; Martinez-Villalpando, E.; Aubin, P.; Zisook, M.; Stirling, L.; Wood, R.J.; Walsh, C.J. Soft wearable motion sensing suit for lower limb biomechanics measurements. In Proceedings of the 2013 IEEE International Conference on Robotics and Automation (ICRA), Karlsruhe, Germany, 6–10 May 2013; pp. 5309–5316. [Google Scholar]
  3. Chan, M.; Estève, D.; Fourniols, J.Y.; Escriba, C.; Campo, E. Smart wearable systems: Current status and future challenges. Artif. Intell. Med. 2012, 56, 137–156. [Google Scholar] [CrossRef] [PubMed]
  4. Lara, O.D.; Labrador, M.A. A survey on human activity recognition using wearable sensors. IEEE Commun. Surv. Tutor. 2013, 15, 1192–1209. [Google Scholar] [CrossRef]
  5. Foerster, F.; Smeja, M.; Fahrenberg, J. Detection of posture and motion by accelerometry: A validation study in ambulatory monitoring. Comput. Hum. Behav. 1999, 15, 571–583. [Google Scholar] [CrossRef]
  6. Espinosa, H.G.; Lee, J.; James, D.A. The inertial sensor: A base platform for wider adoption in sports science applications. J. Fit. Res. 2015, 4, 13–20. [Google Scholar]
  7. Cooper, G.; Sheret, I.; McMillian, L.; Siliverdis, K.; Sha, N.; Hodgins, D.; Kenney, L.; Howard, D. Inertial sensor-based knee flexion/extension angle estimation. J. Biomech. 2009, 42, 2678–2685. [Google Scholar] [CrossRef] [PubMed] [Green Version]
  8. Filippeschi, A.; Schmitz, N.; Miezal, M.; Bleser, G.; Ruffaldi, E.; Stricker, D. Survey of Motion Tracking Methods Based on Inertial Sensors: A Focus on Upper Limb Human Motion. Sensors 2017, 17, 1257. [Google Scholar] [CrossRef] [PubMed]
  9. O’Donovan, K.J.; Kamnik, R.; O’Keeffe, D.T.; Lyons, G.M. An inertial and magnetic sensor based technique for joint angle measurement. J. Biomech. 2007, 40, 2604–2611. [Google Scholar] [CrossRef] [PubMed]
  10. Liu, K.; Liu, T.; Shibata, K.; Inoue, Y.; Zheng, R. Novel approach to ambulatory assessment of human segmental orientation on a wearable sensor system. J. Biomech. 2009, 42, 2747–2752. [Google Scholar] [CrossRef] [PubMed]
  11. Kavanagh, J.J.; Morrison, S.; James, D.A.; Barrett, R. Reliability of segmental accelerations measured using a new wireless gait analysis system. J. Biomech. 2006, 39, 2863–2872. [Google Scholar] [CrossRef] [PubMed]
  12. Luinge, H.J.; Veltink, P.H. Measuring orientation of human body segments using miniature gyroscopes and accelerometers. Med. Biol. Eng. Comput. 2005, 43, 273–282. [Google Scholar] [CrossRef] [PubMed]
  13. d’Avella, A.; Portone, A.; Fernandez, L.; Lacquaniti, F. Control of fast-reaching movements by muscle synergy combinations. J. Neurosci. 2006, 26, 7791–7810. [Google Scholar] [CrossRef] [PubMed]
  14. Totaro, M.; Poliero, T.; Mondini, A.; Lucarotti, C.; Cairoli, G.; Ortiz, J.; Beccai, L. Soft Smart Garments for Lower Limb Joint Position Analysis. Sensors 2017, 17, 2314. [Google Scholar] [CrossRef] [PubMed]
  15. Huang, B.; Li, M.; Mei, T.; McCoul, D.; Qin, S.; Zhao, Z.; Zhao, J. Wearable Stretch Sensors for Motion Measurement of the Wrist Joint Based on Dielectric Elastomers. Sensors 2017, 17, 2708. [Google Scholar] [CrossRef] [PubMed]
  16. Papi, E.; Bo, Y.N.; McGregor, A.H. A flexible wearable sensor for knee flexion assessment during gait. Gait Posture 2018, 62, 480–483. [Google Scholar] [CrossRef] [PubMed]
  17. Atalay, A.; Sanchez, V.; Atalay, O.; Vogt, D.M.; Haufe, F.; Wood, R.J.; Walsh, C.J. Batch Fabrication of Customizable Silicone-Textile Composite Capacitive Strain Sensors for Human Motion Tracking. Adv. Mater. Technol. 2017, 2. [Google Scholar] [CrossRef]
  18. Lu, N.; Lu, C.; Yang, S.; Rogers, J. Highly sensitive skin-mountable strain gauges based entirely on elastomers. Adv. Funct. Mater. 2012, 22, 4044–4050. [Google Scholar] [CrossRef]
  19. Mengüç, Y.; Park, Y.L.; Pei, H.; Vogt, D.; Aubin, P.M.; Winchell, E.; Fluke, L.; Stirling, L.; Wood, R.J.; Walsh, C.J. Wearable soft sensing suit for human gait measurement. Int. J. Robot. Res. 2014, 33, 1748–1764. [Google Scholar] [CrossRef]
  20. Yamada, T.; Hayamizu, Y.; Yamamoto, Y.; Yomogida, Y.; Izadi-Najafabadi, A.; Futaba, D.N.; Hata, K. A stretchable carbon nanotube strain sensor for human-motion detection. Nat. Nanotechnol. 2011, 6, 296–301. [Google Scholar] [CrossRef] [PubMed]
  21. Aziz, O.; Robinovitch, S.N. An analysis of the accuracy of wearable sensors for classifying the causes of falls in humans. IEEE Trans. Neural Syst. Rehabil. Eng. 2011, 19, 670–676. [Google Scholar] [CrossRef] [PubMed]
  22. Bonato, P. Wearable sensors and systems. IEEE Eng. Med. Biol. Mag. 2010, 29, 25–36. [Google Scholar] [CrossRef] [PubMed]
  23. Lebel, K.; Boissy, P.; Hamel, M.; Duval, C. Inertial measures of motion for clinical biomechanics: Comparative assessment of accuracy under controlled conditions–changes in accuracy over time. PLoS ONE 2015, 10, e0118361. [Google Scholar] [CrossRef] [PubMed]
  24. Jamwal, P.K.; Hussain, S.; Tsoi, Y.H.; Ghayesh, M.H.; Xie, S.Q. Musculoskeletal modelling of human ankle complex: Estimation of ankle joint moments. Clin. Biomech. 2017, 44, 75–82. [Google Scholar] [CrossRef] [PubMed] [Green Version]
  25. Hertel, J. Functional anatomy, pathomechanics, and pathophysiology of lateral ankle instability. J. Athl. Train. 2002, 37, 364. [Google Scholar] [PubMed]
  26. Gribble, P.A.; Hertel, J. Effect of lower-extremity muscle fatigue on postural control. Arch. Phys. Med. Rehabil. 2004, 85, 589–592. [Google Scholar] [CrossRef] [PubMed]
  27. Marsland, F.; Lyons, K.; Anson, J.; Waddington, G.; Macintosh, C.; Chapman, D. Identification of cross-country skiing movement patterns using micro-sensors. Sensors 2012, 12, 5047–5066. [Google Scholar] [CrossRef] [PubMed]
  28. Gabbett, T.J. Quantifying the physical demands of collision sports: Does microsensor technology measure what it claims to measure? J. Strength Cond. Res. 2013, 27, 2319–2322. [Google Scholar] [CrossRef] [PubMed]
  29. Walker, E.J.; McAinch, A.J.; Sweeting, A.; Aughey, R.J. Inertial sensors to estimate the energy expenditure of team-sport athletes. J. Sci. Med. Sport 2016, 19, 177–181. [Google Scholar] [CrossRef] [PubMed]
  30. Zephyr Performance Systems. 2018. Available online: https://www.zephyranywhere.com/ (accessed on 15 January 2018).
  31. Johnson Sports Trainining. What Does Zephyr GPS Measure? 2016. Available online: http://zephyrathlete.weebly.com/what-does-zephyr-measure.html (accessed on 4 November 2016).
  32. Kim, J.H.; Roberge, R.; Powell, J.; Shafer, A.; Williams, W.J. Measurement accuracy of heart rate and respiratory rate during graded exercise and sustained exercise in the heat using the Zephyr BioHarness™. Int. J. Sports Med. 2013, 34, 497. [Google Scholar] [CrossRef] [PubMed]
  33. Hailstone, J.; Kilding, A.E. Reliability and validity of the Zephyr™ BioHarness™ to measure respiratory responses to exercise. Meas. Phys. Educ. Exerc. Sci. 2011, 15, 293–300. [Google Scholar] [CrossRef]
  34. Parrington, L.; Phillips, E.; Wong, A.; Finch, M.; Wain, E.; MacMahon, C. Validation of inertial measurement units for tracking 100m sprint data. In Proceedings of the 34th International Conference of Biomechanics in Sport, Tsukuba, Japan, 18–22 July 2016; Volume 34. [Google Scholar]
  35. Zebra. Zebra Sports Solutions. 2018. Available online: https://www.zebra.com/us/en/solutions/location-solutions/zebra-sport-solution.html (accessed on 15 January 2018).
  36. Zebra. Zebra Buys Navis, Proveo. 2007. Available online: http://www.rfidjournal.com/articles/view?3682 (accessed on 28 October 2016).
  37. Taylor, T. NFL Using Zebra RFID Chips to Track Player Movements, Gather Data. 2015. Available online: http://www.si.com/edge/2015/03/05/nfl-player-tracking-technology-new-orleans-saints (accessed on 4 November 2016).
  38. Cole, B. Zebra Technologies Partners with NFL to Track Player Movements. 2015. Available online: http://www.fangraphs.com/techgraphs/zebra-technologies-partners-with-nfl-to-track-player-movements/ (accessed on 28 October 2016).
  39. RFIDJournal. Zebra Acquires Active RFID Provider WhereNet. 2016. Available online: http://www.rfidjournal.com/articles/view?6652 (accessed on 28 October 2016).
  40. TheStreet. Zebra Technologies Makes Fast Company’s List Of Most Innovative Companies. 2016. Available online: https://www.thestreet.com/story/13459311/1/zebra-technologies-makes-fast-companys-list-of-most-innovative-companies.html (accessed on 27 October 2016).
  41. Zebra Technologies. Partners in Innovation. 2016. Available online: https://www.zebra.com/us/en/nfl.html (accessed on 4 November 2016).
  42. STATSports.com. STATSport. 2018. Available online: http://statsports.com/ (accessed on 15 January 2018).
  43. Zebra Technologies. REVEALED: The Hi-tech GPS Gizmo Liverpool Use to Ensure Gerrard, Suarez and Co are Fit Enough for New Season. 2013. Available online: http://www.dailymail.co.uk/sport/football/article-2377757/Liverpool-use-STATSports-Viper-united-ensure-players-fit-enough.html (accessed on 4 November 2016).
  44. Bennett, C.L.; Odom, C.; Ben-Asher, M. Knee angle estimation based on imu data and artificial neural networks. In Proceedings of the 2013 29th Southern Biomedical Engineering Conference (SBEC), Miami, FL, USA, 3–5 May 2013; pp. 111–112. [Google Scholar]
  45. Podoloff, R.M.; Benjamin, M.H.; Winters, J.; Golden, R.F. Flexible Tactile Sensor for Measuring Foot Pressure Distributions and for Gaskets. U.S. Patent 5,033,291, 23 July 1991. [Google Scholar]
  46. Akçetin, P.I.; Ergen, S.Ç.; Sezgin, T.M. HMM based inertial sensor system for coaching of rowing activity. In Proceedings of the 2012 20th Signal Processing and Communications Applications Conference (SIU), Mugla, Turkey, 18–20 April 2012. [Google Scholar]
  47. Müller, M.; Vilzmann, R.; Zierer, F. Pressure Measuring Base for Measurement of Mechanical Pressure Distribution on Human Foot Sole of e.g., Shoe for Medical Application for Patients with Diabetic Foot, Has Electronic Unit, and Pressure Sensors Arranged at Feed Lines. German Patent DE102010049154A1, 16 June 2016. [Google Scholar]
  48. Hurkmans, H.; Bussmann, J.; Benda, E.; Verhaar, J.; Stam, H. Accuracy and repeatability of the Pedar Mobile system in long-term vertical force measurements. Gait Posture 2006, 23, 118–125. [Google Scholar] [CrossRef] [PubMed]
  49. Charry, E.; Umer, M.; Taylor, S. Design and validation of an ambulatory inertial system for 3-D measurements of low back movements. In Proceedings of the 2011 Seventh International Conference on Intelligent Sensors, Sensor Networks and Information Processing (ISSNIP), Adelaide, SA, Australia, 6–9 December 2011. [Google Scholar]
  50. McGinnis, R.S.; DiCristofaro, S.; Mahadevan, N.; Sen-Gupta, E.; Silva, I.; Jortberg, E.; Wright, J.A.; Ghaffari, R.; Aranyosi, A.J.; Patel, S. Longitudinal Data from Wearable Sensor System Suggests Movement Improves Standing Posture. In Proceedings of the 41st Annual Meeting of the American Society of Biomechanics, Boulder, CO, USA, 8–11 August 2017. [Google Scholar]
  51. Elbawab, M.; Olesik, J.; Aghazadeh, F.; Amankrah, F.; Horqque, D.; Zane, L. Motion Capture Garment. WO Patent App. PCT/CA2016/051,398, 1 June 2017. [Google Scholar]
  52. Schwameder, H.; Andress, M.; Graf, E.; Strutzenberger, G. Validation of an IMU-System (Gait-Up) to Identify Gait Parameters in Normal and Induced Limping Walking Conditions. In Proceedings of the ISBS-Conference Archive, Tsukuba, Japan, 18–22 July 2016; Volume 33. [Google Scholar]
  53. Waltz, E. A wearable turns baseball pitching into a science [News]. IEEE Spectrum 2015, 52, 16–17. [Google Scholar] [CrossRef]
  54. Notch. 2018. Available online: https://wearnotch.com/ (accessed on 15 January 2018).
  55. Liu, H.; Dai, R.; Gauthier, P. Multi-Node Motion Measurement and Analysis System. U.S. Patent App. 15/208,028, 20 April 2017. [Google Scholar]
  56. Zhang, J.T.; Novak, A.C.; Brouwer, B.; Li, Q. Concurrent validation of Xsens MVN measurement of lower limb joint angular kinematics. Physiol. Meas. 2013, 34, N63. [Google Scholar] [CrossRef] [PubMed]
  57. MacDonald, K.; Bahr, R.; Baltich, J.; Whittaker, J.L.; Meeuwisse, W.H. Validation of an inertial measurement unit for the measurement of jump count and height. Phys. Ther. Sport 2017, 25, 15–19. [Google Scholar] [CrossRef] [PubMed]
  58. Najafi, B.; Wrobel, J.; Boloori, A. Providing Motion Feedback Based on User Center of Mass. U.S. Patent 8,979,665, 17 March 2015. [Google Scholar]
  59. Chesnin, K.J.; Selby-Silverstein, L.; Besser, M.P. Comparison of an in-shoe pressure measurement device to a force plate: Concurrent validity of center of pressure measurements. Gait Posture 2000, 12, 128–133. [Google Scholar] [CrossRef]
  60. Esposito, M.; Macagno, M.; Vigano, D.G. Sensors, Interfaces and Sensor Systems for Data Collection and Integrated Remote Monitoring of Conditions at or Near Body Surfaces. U.S. Patent 8,925,392, 6 January 2015. [Google Scholar]
  61. Mestrovic, M.A.; Petersen, P.M.; Cranston, R.W.; Stannard, W.B.; D’arcy, P.B. System, Garment and Method, 2016. U.S. Patent 9,427,179, 30 August 2016. [Google Scholar]
  62. SensoriaFitness.com. Sensoria Fitness Socks and Anklet. 2016. Available online: http://store.sensoriafitness.com/sensoria-fitness-smart-socks (accessed on 28 October 2016).
  63. McGarry, C. Review: Sensoria’s Smart Socks Are a Futuristic Novelty that no Runner Really Needs. 2015. Available online: https://www.macworld.com/article/2936611/review-sensorias-smart-socks-are-a-futuristic-novelty-that-no-runner-really-needs.html (accessed on 28 October 2016).
  64. Wu, G.; Siegler, S.; Allard, P.; Kirtley, C.; Leardini, A.; Rosenbaum, D.; Whittle, M.; D D’Lima, D.; Cristofolini, L.; Witte, H.; et al. ISB recommendation on definitions of joint coordinate system of various joints for the reporting of human joint motion—Part I: Ankle, hip, and spine. J. Biomech. 2002, 35, 543–548. [Google Scholar] [CrossRef]
  65. Seel, T.; Raisch, J.; Schauer, T. IMU-based joint angle measurement for gait analysis. Sensors 2014, 14, 6891–6909. [Google Scholar] [CrossRef] [PubMed]
  66. Liquid Wire. Introducing Metal Gel. 2018. Available online: https://liquidwire.io/ (accessed on 28 January 2018).
  67. Fuller, E.A. Center of pressure and its theoretical relationship to foot pathology. J. Am. Podiatr. Med. Assoc. 1999, 89, 278–291. [Google Scholar] [CrossRef] [PubMed]
Figure 1. Picture of Liquid Wire test fixture. Liquid Wire sensor and digital caliper highlighted.
Electronics 07 00117 g001
Figure 2. Schematic diagram of Wheatstone bridge circuit. Resistances are in Ω .
Electronics 07 00117 g002
Figure 3. Microprocessor prototype. (a) Computing Unit block diagram; (b) Computing unit with various Liquid Wire sensors connected.
Electronics 07 00117 g003
Figure 4. Computing unit circuit design change from Wheatstone bridge to voltage divider.
Electronics 07 00117 g004
Figure 5. Comparison of range of voltage levels (bins) that can be used for taking measurements at various sensor values. Note that sensitivity of change decreases for the Wheatstone bridge at about 32 Ω . (a) Wheatstone bridge measurement range; (b) Voltage divider measurement range.
Electronics 07 00117 g005
Figure 6. Pictures of the ankle model mockup. (a) Measurements taken with goniometer; (b) Measurements taken with smartphone levels.
Electronics 07 00117 g006
Figure 7. Data collected for linearity testing for resistance versus the stretch length. (a) Micro-Ohm Meter results; (b) Wheatstone bridge results.
Electronics 07 00117 g007
Figure 8. Data collected for temperature testing for resistance vs length stretched. (a) TPU; (b) Silicone.
Electronics 07 00117 g008
Figure 9. Comparison of Computing Unit and Micro-Ohm meter measurements collected.
Electronics 07 00117 g009
Figure 10. Liquid Wire TPU and Silicone sensor measurements and model results. (a) Change in resistance of TPU sensor relative to angle of plantar flexion on model during multiple static testing trials; (b) Change in resistance of silicone sensor relative to angle of plantar flexion on model during multiple static testing trials; (c) 3D surface plot results of plantar flexion, inversion, and eversion with single TPU sensor; (d) 3D surface plot results of plantar flexion, inversion, and eversion with single silicone sensor.
Electronics 07 00117 g010
Table 1. Wearable solution capability comparison. R = RFID Tags. T = Total Distance. Z = Z-axis only. A = Average Value. DP = Developmental Platform. H = Hydrocell Technology. CF = Conductive Fibers. GPS = Global Positioning System.
Kinematic
Measures
Kinetic
Measures
Hardware
SymmetryStep/Jump CountInferred Joint AnglesAbsolute Joint AnglesLimb SegmentsIntensity & LoadGround Reaction ForceShock/Impact ForcePressureAccelerometersMagnetometersGyroscopesGPSDielectric Elastomers
Catapult [27,28,29]IMU×× × × ××××
Zephyr [30,31,32,33]IMU × × × × ×
IMeasureU [34]IMU××× ×× × ×××
Zebra [35,36,37,38,39,40,41]RFID T × R
STATSport [42,43]IMU × × × ××××
ADPM [44]IMU××× ×× × ×××
TekScan [45]Insole × × ×× ×
Shimmer Sense [46]DP ×× ×× × ×××
zFlo-Motion [47]Insole × ×Z××× ×
Novel Pedar [48]Insole & DP × × ×× ×
DorsaVi [49]IMU × × A× ×××
BioStamp [50]IMU & Research ×× × × × ×
Heddoko [51]IMU Garment ×× × ××× ×
GaitUP [52]IMU ×× × × ×××
Motus [53]IMU ×× ×× × ×
Notch [54]IMU & DP × × ×××
Noitom [55]IMU & DP × × × ×
Xsens [56]IMU××× ×× × ×××
G-Vert [57]IMU×× × × × ××
LegSys [58]IMU ×× × ×××
paroTec [59]Insole×× × ×× H
Sensoria [60,61,62,63]CF×× ××××
Table 2. Test Equipment for Liquid Wire Testing.
Component/PurposeManufacturerModel
Clamps—hold test articleIrwinQuick-Grip 3 clamps
Drill Press—stretch test articleIrwin4 Drill Press Vise
Micro-Ohm meter—validate computing unitAgilent/Keysight34420A
Digital multimeter—validate computing unitFluke179
Liquid Wire sensors—test articlesLiquid WireVarious
Hand-held temperature sensor—monitor test article temperatureEtekcity1080
Ankle complex model—test sensor linearityCustomAnkle test fixture
Blow dryer—heat test articleConair146RX
Digital Caliper—measure test article stretchTritan0344621
DC Benchtop Power Supply—power circuit for testingExtech382213
Table 3. Equipment bill of materials for the prototype computing unit.
ManufacturerModelDescription
ArduinoUno R3Microprocessor
RexQuailsRQ-RK-001Resistors
CTYRZCH433011808316 Bit I2C ADS1115 4-channel Analog–to–Digital Converter Module
Jameco ValuePro20812Solderless Breadboard
ElencoJW–350Pre–formed Jumper Wire Kit
ElegooEL–CP–004Breadboard wire set for Arduino
Cable Matters200001–BLK–10x3USB 2.0 A–to–B Printer Cable, 10 feet
Table 4. Liquid Wire Testing Article Specifications.
IDSubstrateLength (mm)Resting Resistance ( Ω )
AThermoplastic Polyurethane20230.0
BThermoplastic Polyurethane20944.1
CSilicone1656.0
DThermoplastic Polyurethane10713.6

