Article

Development of RP-HPLC, Stability Indicating Method for Degradation Products of Linagliptin in Presence of Metformin HCl by Applying 2 Level Factorial Design; and Identification of Impurity-VII, VIII and IX and Synthesis of Impurity-VII

by
Sushant B. Jadhav
1,2,
P. Sunil Reddy
1,
Kalyanaraman L. Narayanan
1 and
Popatrao N. Bhosale
2,*
1
Research and Development, Integrated Product Development, Dr. Reddy’s Laboratories Ltd, Bachupally, Hyderabad 500 090, Telangana, India
2
Department of Chemistry, Shivaji University, Kolhapur 416 004, Maharashtra, India
*
Author to whom correspondence should be addressed.
Sci. Pharm. 2017, 85(3), 25; https://doi.org/10.3390/scipharm85030025
Submission received: 21 May 2017 / Revised: 6 June 2017 / Accepted: 7 June 2017 / Published: 27 June 2017

Abstract

:
The novel reverse phase-high performance liquid chromatography (RP-HPLC), stability indicating method was developed for determination of linagliptin (LGP) and its related substances in linagliptin and metformin HCl (MET HCl) tablets by implementing design of experiment to understand the critical method parameters and their relation with critical method attributes; to ensure robustness of the method. The separation of nine specified impurities was achieved with a Zorbax SB-Aq 250 × 4.6 mm, 5 µm column, using gradient elution and a detector wavelength of 225 nm, and validated in accordance with International Conference on Harmonization (ICH) guidelines and found to be accurate, precise, reproducible, robust, and specific. The drug was found to be degrading extensively in heat, humidity, basic, and oxidation conditions and was forming degradation products during stability studies. After slight modification in the buffer and the column, the same method was used for liquid chromatography–mass spectrometry (LC-MS) and ultra-performance liquid chromatography -time-of-flight/mass spectrometry UPLC-TOF/MS analysis, to identify m/z and fragmentation of maximum unspecified degradation products i.e., Impurity-VII (7), Impurity-VIII (8), and Impurity-IX (9) formed during stability studies. Based on the results, a degradation pathway for the drug has been proposed and synthesis of Impurity-VII (7) is also discussed to ensure an in-depth understanding of LGP and its related degradation products and optimum performance during the lifetime of the product.

1. Introduction

Linagliptin (LGP) is a long-acting xanthine-based dipeptidyl peptidase (DPP) inhibitor with high selectivity to DPP-4 compared to the related enzymes DPP-8 and DPP-9 [1,2] and has minimal risk of hypoglycemia due to its effect as a glucose-dependent insulin secretagogue [3]. LGP acts primarily by blocking incretin degradation, which inhibits the breakdown of glucagon-like peptide (GLP-1) and glucose-dependent insulinotropic peptide (GIP), stimulates insulin secretion, resulting in a reduction in plasma glucose, glucagon levels, and inhibition of gastric emptying [4,5,6]. Clinical studies with LGP demonstrated efficacy in reducing glycated hemoglobin (HbA1c) levels in type 2 diabetes patients while maintaining a placebo-like safety and tolerability profile. Linagliptin has an interesting pharmacokinetics (PK) profile, characterized by negligible renal elimination, due to that, no dose adjustment is necessary for patients with renal disease as well as in hepatic insufficiency and in elderly or obese patients [1,7].
Metformin hydrochloride (MET HCl) is an oral antihyperglycemic agent in the biguanide class and improves glucose tolerance in patients with type 2 diabetes mellitus, lowering both basal and postprandial plasma glucose. Its pharmacologic mechanisms decrease hepatic glucose production, decrease intestinal absorption of glucose, and improve insulin sensitivity by increasing peripheral glucose uptake and utilization [8]. Unlike sulfonylurea, MET HCl does not produce hypoglycemia, weight gain, and PK interactions also does not cause hyperinsulinemia [9,10,11,12,13,14,15]. With MET HCl therapy, insulin secretion remains unchanged while fasting insulin levels and day-long plasma insulin response may actually decrease [16]. Moreover, LGP and MET HCl are not prone to PK drug–drug interactions. Their co-administration improves blood glucose control more potently than either compound separately, without hypoglycemia and without increasing MET related gastrointestinal side effects. Linagliptin has a neutral effect on body weight as no weight increase is observed in mono therapy or in combination with MET HCl hence, a combination of LGP and MET HCl is very effective to control type-2 diabetes [17,18].
Design of experiment (DoE) has a statistics-based approach and has several advantages, to achieve predictive knowledge of the method with a little number of experiments and helps in optimization and development of the robust and rugged method. As a result of the DoE study, the method performance can be understood and improved due to knowledge of critical method parameters (CMPs), critical method attributes (CMAs), overlay plots of design space—and consequently normal operating range (NOR) and proven acceptable range (PAR) [19,20]—which will ensure optimal performance and reliability of the method and the data generated.
The LGP and LGP-MET HCl dosage forms monographs are not yet official in any of the pharmacopoeia. However, MET HCl alone—or in combination with some other products—is available in Indian Pharmacopoeia (IP) [21], British Pharmacopoeia (BP) [22], European Pharmacopoeia (Ph.Eur.) [23], and United States Pharmacopoeia (USP) [24].
A couple of articles on the synthesis and characterization of process related LGP impurities have been recently reported [25,26]. The manufacturing process of every manufacturer is different than each other and hence the process related impurities also different from each other therefore these articles are less helpful to pharma industries. Moreover, these articles did not discuss synthesis of degradation impurities i.e., Impurity-VII (7); and identification and characterization of Impurity-VII (7), VIII (8) and IX (9), as well as stability indicating analytical method for the nine impurities. Present work also describes plausible degradation pathways and applications of DoE for optimization of chromatographic conditions.
(Note: Due to the similar concept for development of the method and use of two level factorial design, the reflected sentences or texts in this article might be nearly similar as mentioned in reference [20]).

2. Materials and Methods

2.1. Reagents and Chemicals

The active pharmaceutical ingredient (API), placebo/matrix, tablets, and their impurities were received from “Dr. Reddy’s Laboratories Ltd”, (Integrated Product Development Organization IPDO, Hyderabad, India). Emparta grade potassium dihydrogen phosphate (KH2PO4), ortho phosphoric acid (OPA), acetic acid, ammonium acetate, HPLC-grade acetonitrile (ACN), and methanol (MeOH) were purchased from Merck (Mumbai, India). Dimethyl sulphoxide (DMSO) was purchased from Spectrochem, Mumbai, India. High-purity water obtained from Milli-Q water purification system (Bedford, MA, USA) was used for the study. Nuclear magnetic resonance (NMR) solvent DMSO-d6, D2O, and CD3OD were purchased from Cambridge Isotope Laboratories Inc., Tewksbury, MA, USA.

2.2. Instrumentation and Chromatographic Conditions

Liquid chromatography (LC) analysis was performed on a Waters high-performance liquid chromatograph (Waters Corporation, Milford, MA, USA) equipped with a photodiode array detector (PDA) at 225 nm using “Empower-2 and Empower-3” software (Waters Corporation, Milford, MA, USA). Separation was accomplished on Zorbax SB-Aq column (250 × 4.6 mm, 5 µm) with flow rate 1.0 mL min1 using following gradient program (time in min/% mobile phase-B): 0/25, 8/25, 22/40, 28/45, 40/50, 50/50, 55/75, 60/75, 64/25, and 70/25. The following solutions were prepared: KH2PO4 buffer solution (0.02M) pH 3.0 adjusted with OPA used as mobile phase-A, and mobile phase-B, ACN:MeOH (90:10, v/v). The column temperature was maintained at 45 °C, and the injection volume was 40 µL. DoE and statistical analysis was performed using “Design-Expert®” software, version 9.0.1.0 (Stat-Ease, Inc., Minneapolis, MN, USA).

2.3. UPLC-TOF/MS, LC-MS and NMR Conditions

To identify m/z and fragmentation of maximum unspecified degradation products, High-Resolution Mass Spectroscopy (HRMS) analysis was performed on Waters Acquity TOF/MS (Waters Corporation, Manchester, UK) which was connected to UPLC via an electrospray ionization interface (ESI). Separation was accomplished on Acquity BEH shield RP18 column (100 × 2.1 mm, 1.7 µm) (Waters corporation, Milford Massachusetts, USA) with flow rate 0.21 mL min1 and injection volume 4 µL, ammonium acetate buffer (pH 3.8 adjusted with acetic acid) as mobile phase-A, while ACN:MeOH (90:10, v/v) as mobile phase-B using the following gradient program (time in min/%mobile phase-B): 0/25, 1.28/25, 6.88/40, 9.28/45, 14.08/50, 18.08/50, 20.08/75, 22.08/75, 23.68/25, and 26.08/25. HPLC method is converted to UPLC with Waters Acquity column calculator software.
LC-MS analysis was performed on Synapt G2-Si LC-MS (Waters Corporation, Manchester, UK) and Zorbax SB-Aq column (250 × 4.6 mm, 5 µm) with flow rate 1.0 mL min1 using the following gradient program (time in min/%mobile phase-B): 0/25, 8/25, 22/40, 28/45, 40/50, 50/50, 55/75, 60/75, 64/25, and 70/25. Ammonium acetate buffers (pH 3.8 adjusted with acetic acid) were used as mobile phase-A, while ACN: MeOH (90:10, v/v) as mobile phase-B with column oven temperature maintained at 45 °C.
The ESI source was operated in positive ion mode with the capillary voltage at 3.0 KV, source and desolvation temperature were set at 120 °C and 500 °C, respectively. The cone and desolvation gas flows were 60 and 800 L h−1, respectively.
Leucine-enkephalin was used as the lock mass generating [M+H]+ ion (m/z 556.2771) at a concentration of 200 pg mL−1 and flow rate 50 µL min−1 to ensure accuracy during analysis. The lock spray interval was set at 10 s. All data collected in centroid mode using ‘MassLynx’ software (Waters Corporation, Milford, MA, USA). The 1H NMR spectra were recorded on Varian Mercury plus 400 MHz FT-NMR spectrometer. The chemical shifts were reported in δ (ppm) relative to TMS as an internal standard.

2.4. Preparation of Standard, System Suitability, and Sample Solution

Linagliptin (LGP) standard stock solution was prepared by dissolving 80 mg (800 µg mL1) in 70 mL of diluent and diluted to 250 mL with diluent (Diluent is mobile phase-A:MeOH, 50:50 v/v). Similarly, 0.2 µg mL1 standard solution was prepared by appropriate dilution of stock solution with diluent.
Weighed and transferred accurately about 1.25 mg of Impurity-VII (7) and 1.25 mg of Impurity-IX (9) into a 100 mL volumetric flask, and dissolved in 5 mL of DMSO and added about 50 mL of diluent and then accurately transferred about 1.25 mg of Impurity-I (1) and about 1.25 mg of Impurity-II (2) standard into the same 100 mL volumetric flask, and sonicated it until dissolution. Diluted to volume with diluent and mixed well. Transferred 0.5 mL of above stock and 4.0 mL of standard stock solution into 25 mL volumetric flask and diluted to volume with diluent and mixed well. The solution was used to verify the system suitability by checking resolution between Impurity-VII (7) and Impurity-I (1) (R1); Impurity-I (1) and LGP (R2), and retention time of Impurity-II (2) and Impurity-VIII (8).
About 20 tablets of LGP-MET HCl were crushed to a fine powder with mortar and pestle. The equivalent to 5 mg of LGP was transferred to 100 mL volumetric flasks and 40 mL of diluent added after which the flasks were shaken on a rotary shaker (Lab Companion SK-600 bench top shaker, GMI, Ramsey, MN, USA) at 200 RPM for about 30 min. Then, 30 mL of diluent was added and the flask was sonicated for about 30 min with intermittent shaking. Subsequently, the solution was diluted to 100 mL with diluent and mixed well and centrifuged at 4000 RPM (about 2683× g) in a centrifuge machine for about 10 min (final concentration 50 µg mL1).

3. Results and Discussion

3.1. Method Development and Optimization

We aimed to develop the RP-HPLC method to separate all process related and degradation impurities from each other and from LGP; by selecting KH2PO4 buffer, MeOH and ACN were used in the mobile phase for selectivity, while a wavelength of 225 nm was selected with maximum absorption at 227 nm.
During development stage, KH2PO4 buffer (0.02M pH adjusted to 3.0 with OPA:MeOH 90:10 v/v) was selected as mobile phase-A, and ACN:Water:MeOH (70:15:15 v/v/v) was selected as mobile phase-B with 45 °C column oven temperature. The gradient program, (time in min/%mobile phase-B): 0/25, 8/25, 30/55, 50/75, 55/75, 60/25, and 65/25 was finalized. However, during stability studies, an unknown impurity (later named as Impurity-VII (7)) merged with Impurity-I (1). Hence, to resolve the merging of Impurity-VII (7) and Impurity-I (1) issue, gradient program and mobile phase were changed to gradient program (time in min/%mobile phase-B): 0/25, 8/25, 25/40, 33/45, 38/45, 47/55, 57/80, 62/80, 65/25, and 70/25; with KH2PO4 Buffer solution (0.02M) pH 3.0 adjusted with OPA and used as a mobile phase-A, while ACN: MeOH (90:10, v/v) as mobile phase-B, with 45 °C column oven temperature in the above experiment, Impurity-VII (7) and Impurity-I (1) are well separated but the placebo peak interferes with Impurity-VI (6). Therefore, the gradient program was finally changed to gradient program (time in min/%mobile phase-B): 0/25, 8/25, 22/40, 28/45, 40/50, 50/50, 55/75, 60/75, 64/25, and 70/25; with KH2PO4 buffer solution (0.02M) pH 3.0 adjusted with OPA and used as mobile phase-A, while ACN:MeOH (90:10, v/v) as mobile phase-B, with 45 °C column oven temperature. It was determined that best resolution between all impurities was obtained with above finalized gradient program. To check the relation between CMA and CMP; DoE experiments were carried out using above finalized chromatographic conditions.

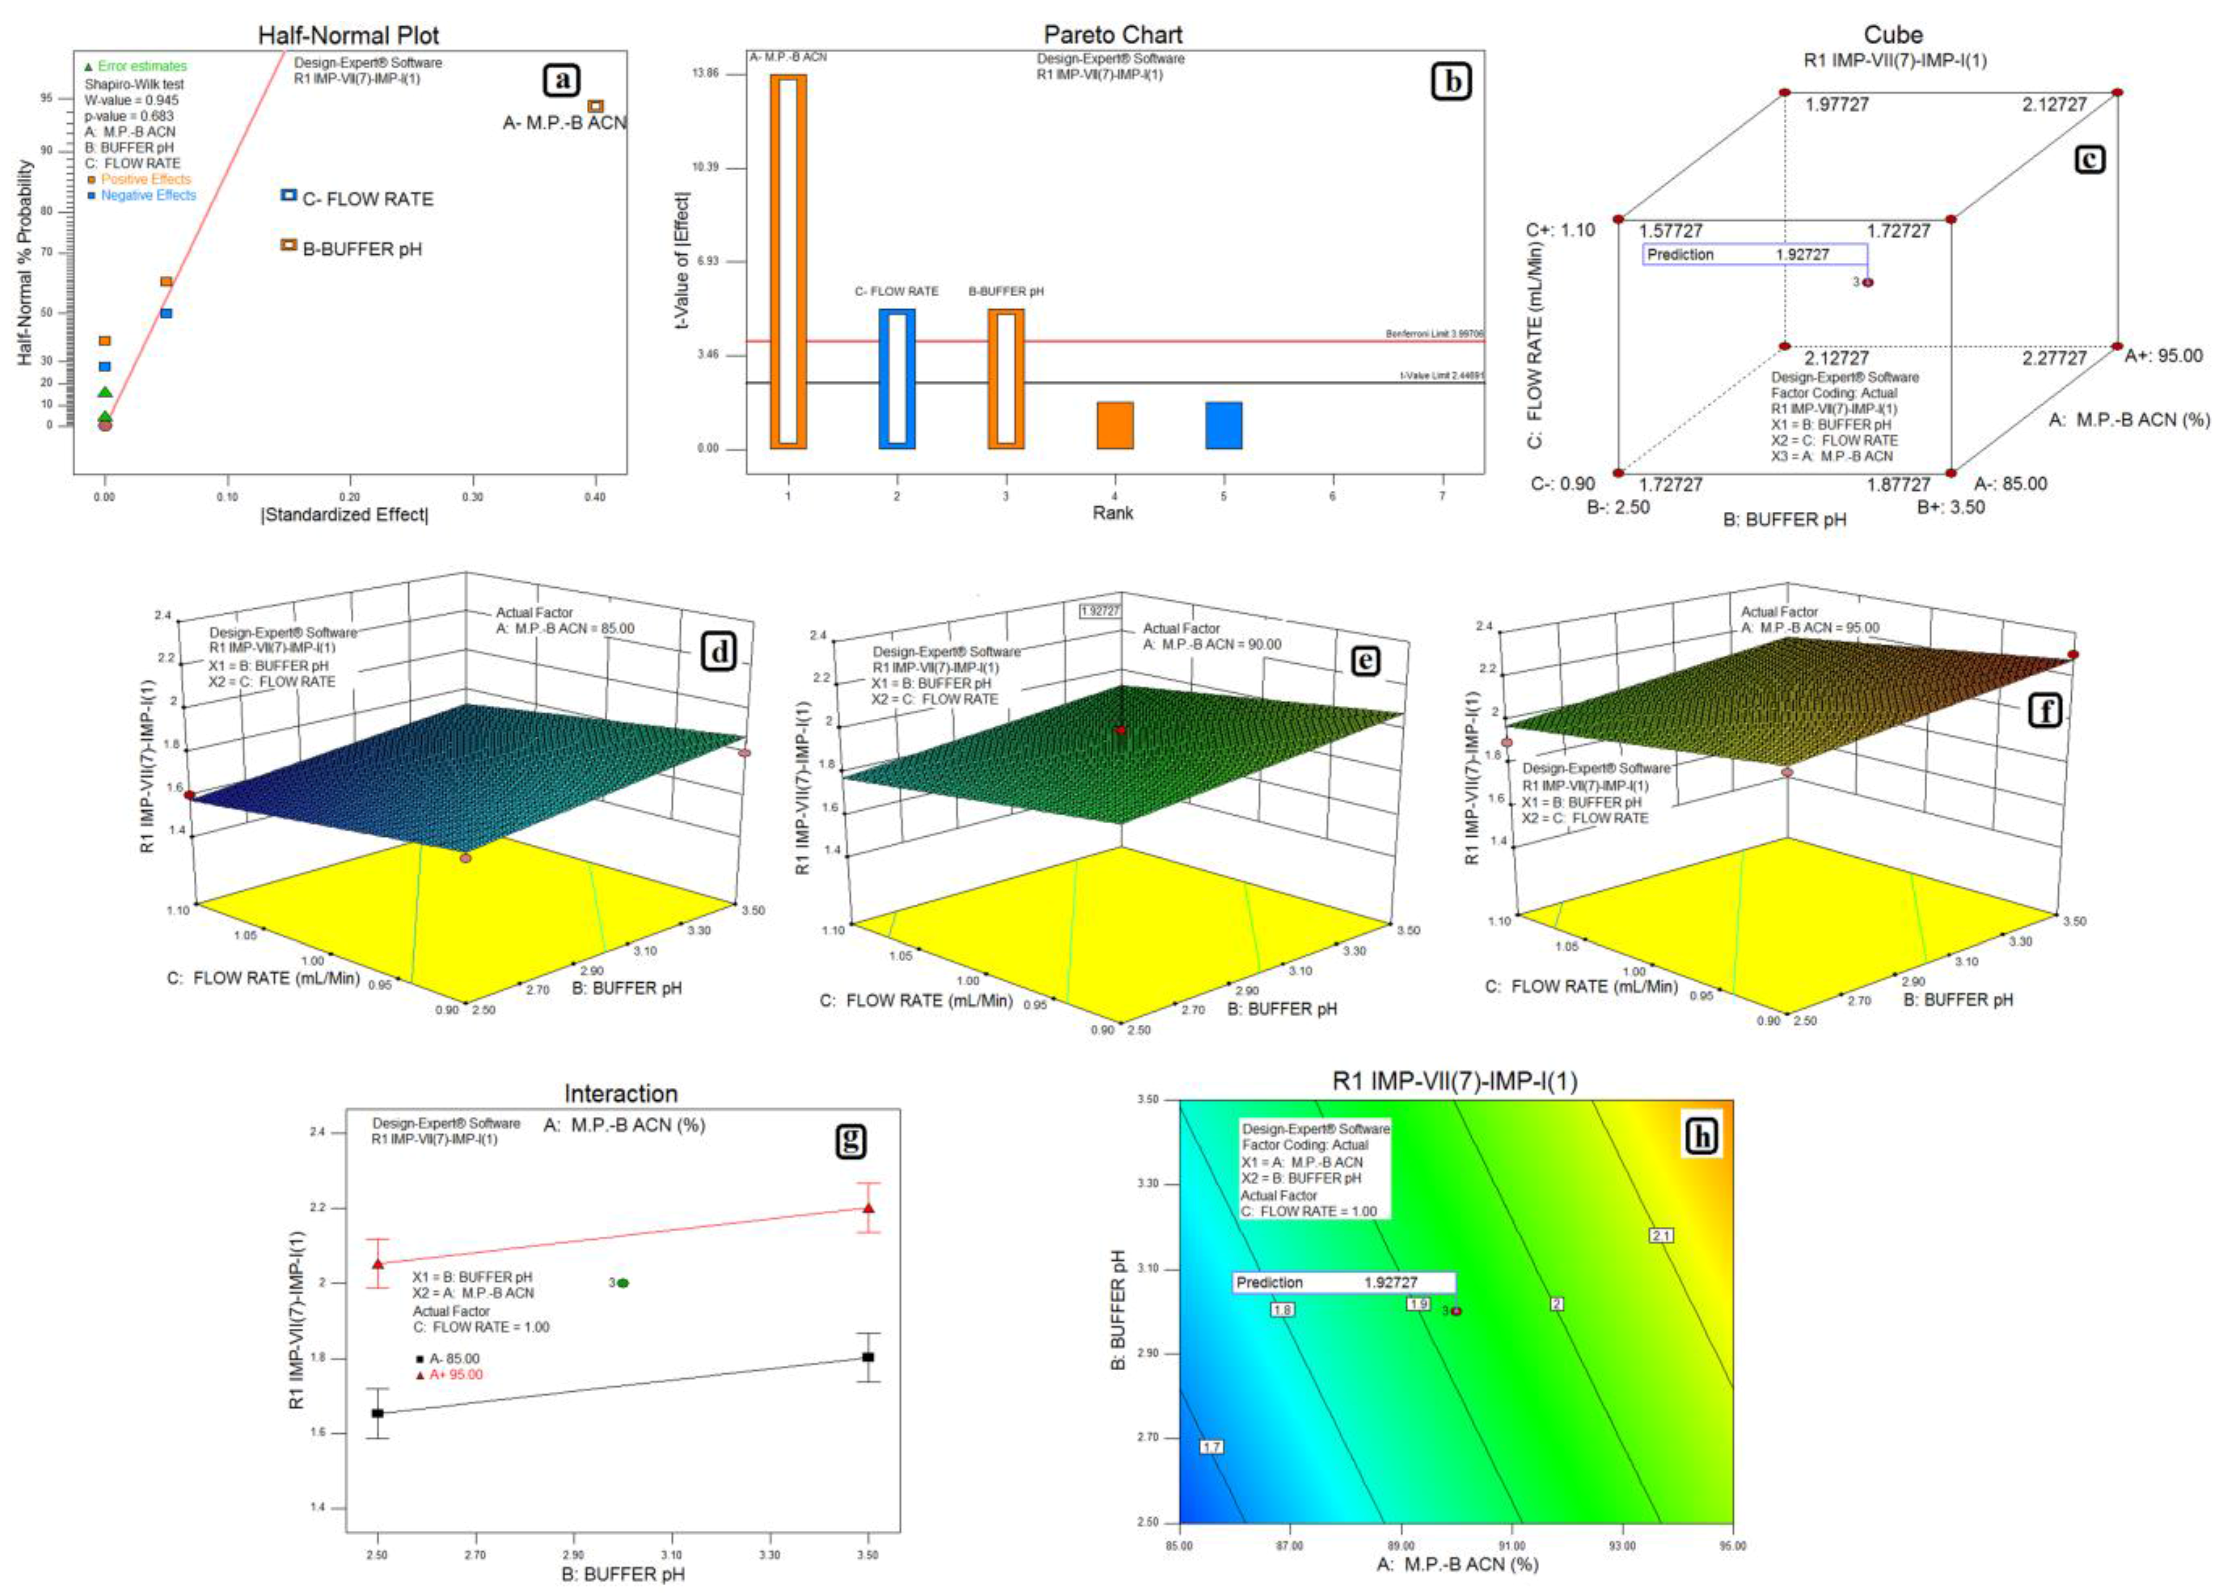
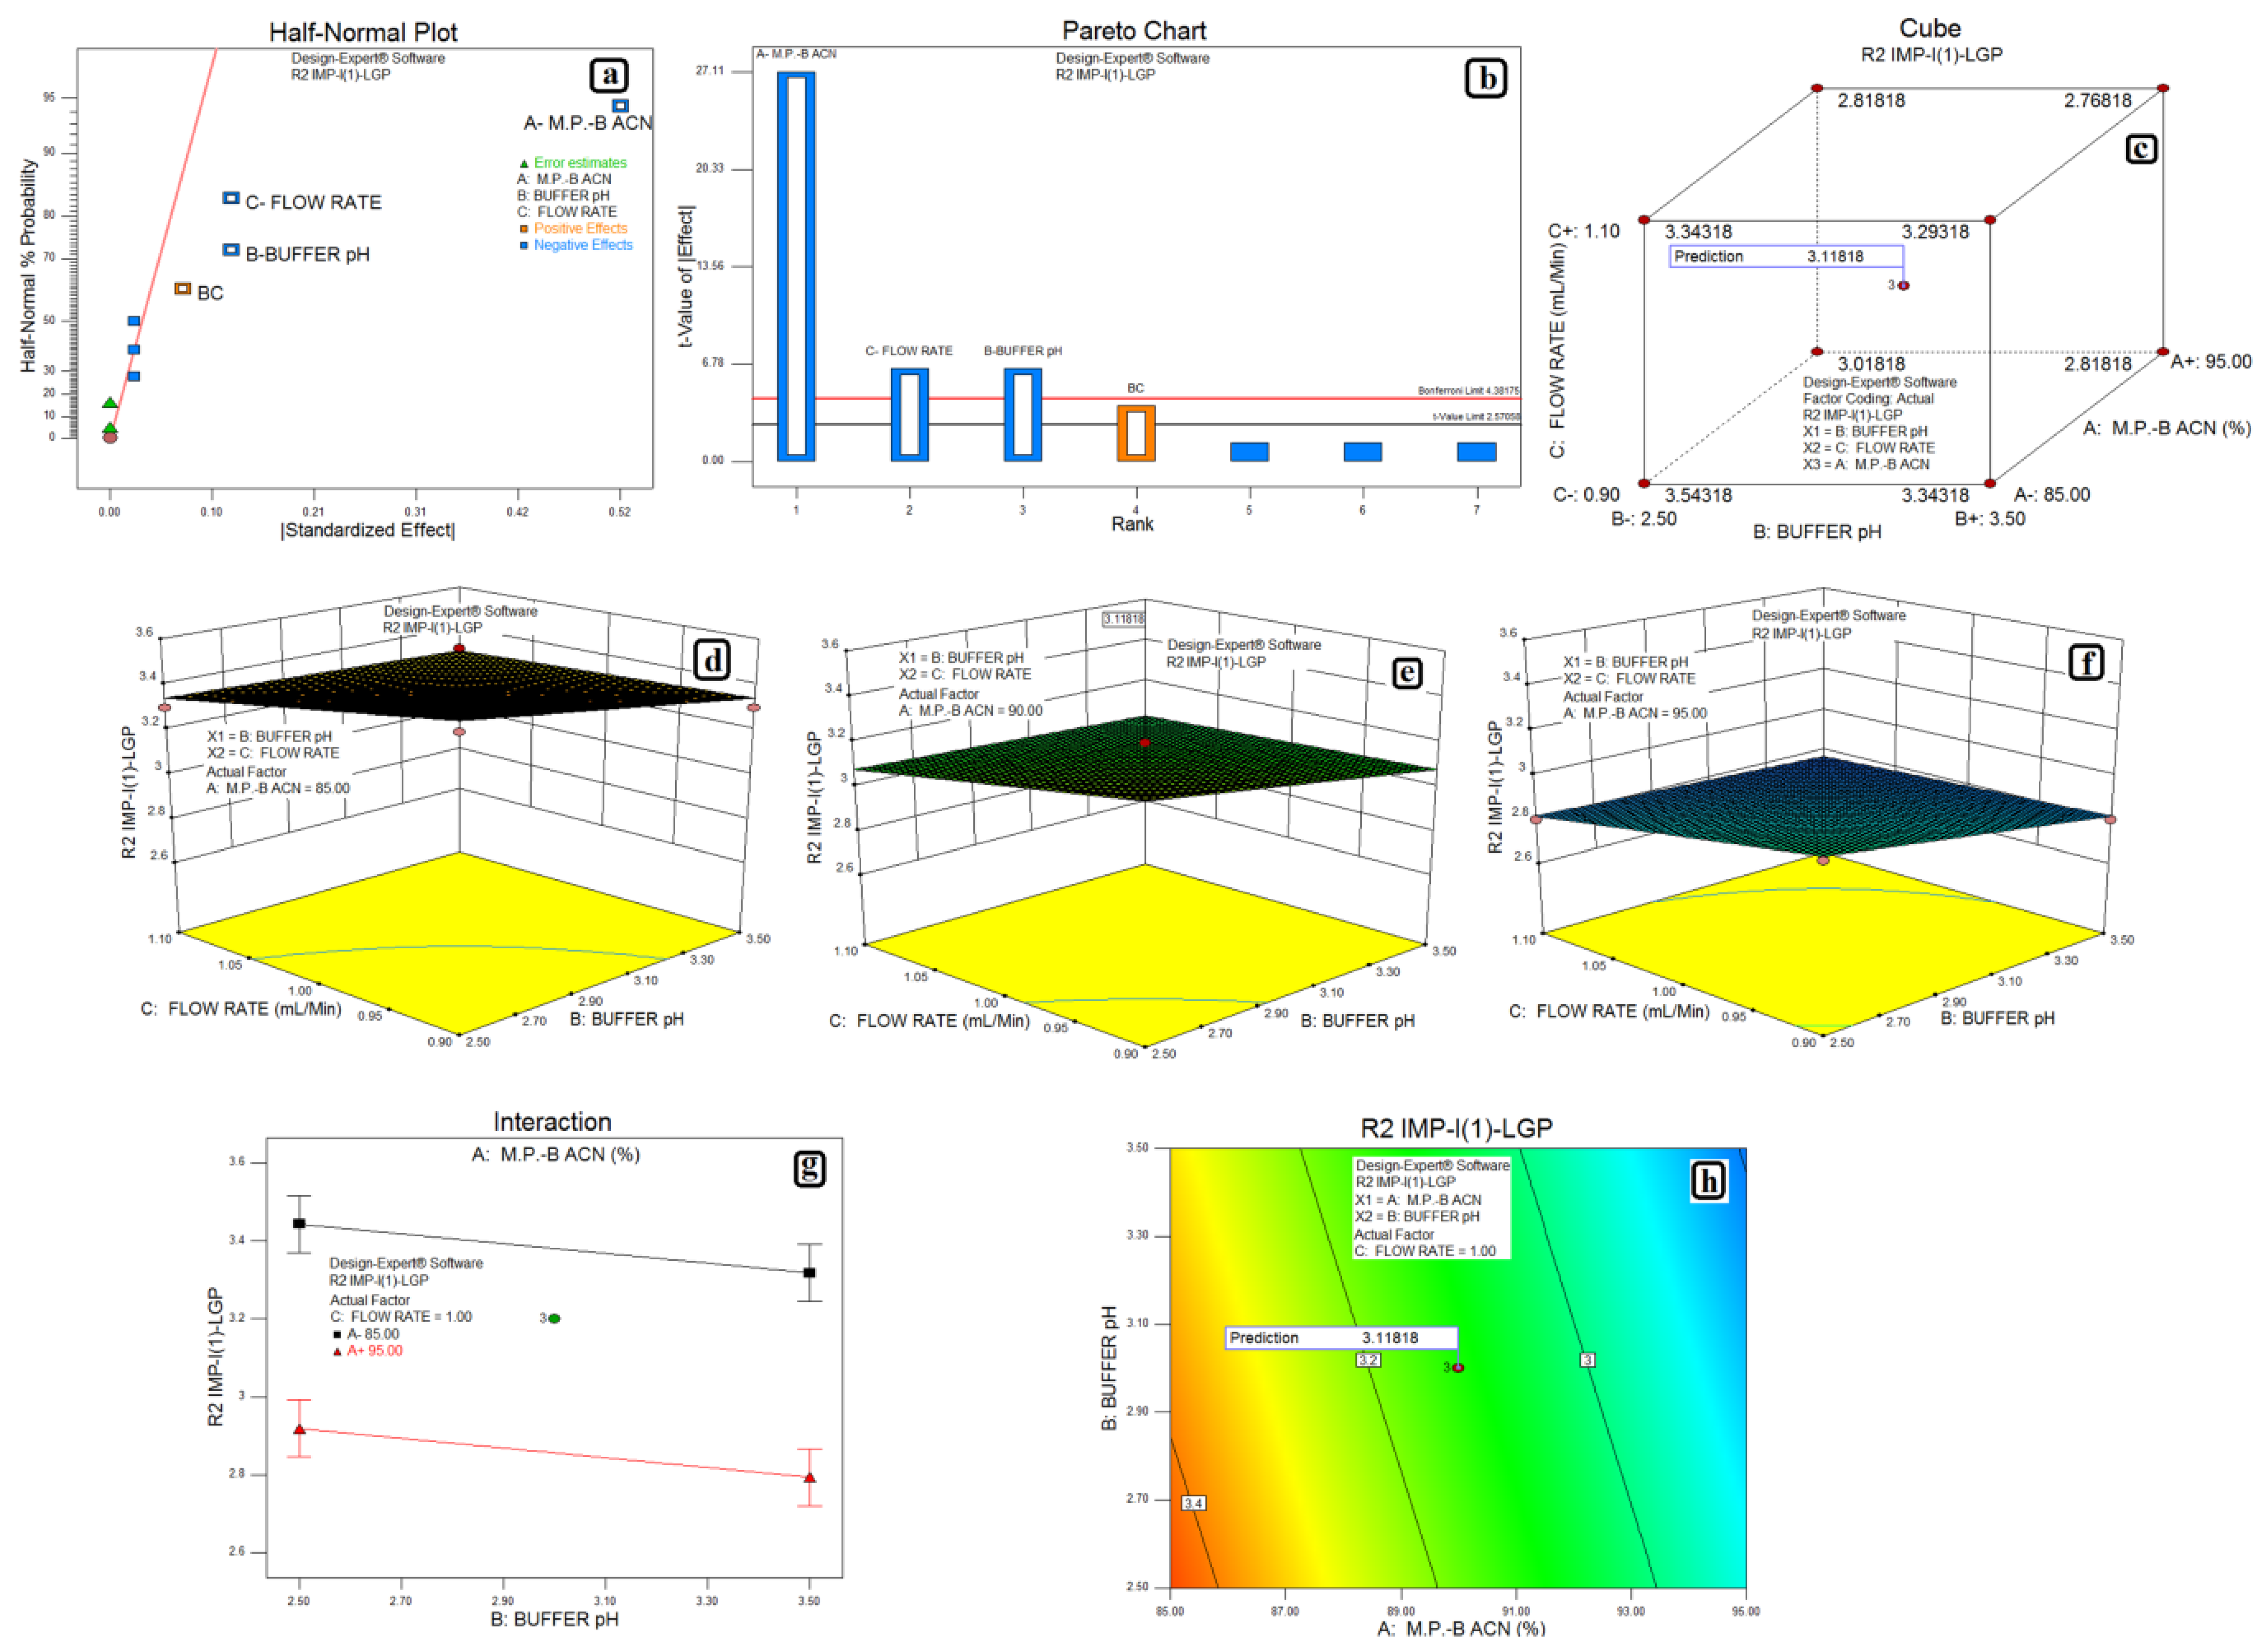
3.2. Design of Experiments and Data Analysis

During optimization of method conditions; composition of acetonitrile in mobile phase-B (A), pH of phosphate buffer (B) and flow rate (C) were identified as CMPs. The resolution between Impurity-VII (7) and Impurity-I (1) (R1); and Impurity-I (1) and LGP (R2); were identified as the CMAs. Full factorial design (with 2 level and 3 variables) was selected for DoE findings using “Design-Expert” 9.0.1.0 software. A factorial model was composed of a list of coefficients multiplied by associated factor levels and this model can be expressed as Y = β0 + β2 A + β2 B + β3 C + β12AB + β13AC + … where βn is the coefficient associated with factor n, and the letters, A, B, C…represent the factors in the model. Combinations of factors (such as AB) represent an interaction between the individual factors.
The relationship between variables was elicited using half-normal plots, Pareto charts, cube, 3D plots, interaction, and desirability plot as depicted in the Figure 1 and Figure 2; for R1 and R2, respectively. In the half-normal plot, large effects (absolute values) appear in the upper-right section of the plot. Similarly, in the Pareto chart, effects above the ‘Bonferroni limit’ were almost certainly significant, while effects above the ‘t-value’ limit were possibly significant. Both half-normal plots and Pareto charts indicate, % of ACN in mobile phase-B (A) has more significant effect on R1 and R2 followed by flow rate (B) and pH of phosphate buffer (C). Positive (+ve) effect of % of ACN in mobile phase-B (A) and pH of phosphate buffer (C); while the negative effect (−ve) of flow rate (B) indicates that an increase in % of ACN in mobile phase-B (A) and pH of phosphate buffer (C) increases the resolution of R1; while the increase in flow rate (B) decreases the resolution of R1. Similarly, an increase in % of ACN in mobile phase-B (A), flow rate (B), and pH of phosphate buffer (C) decrease the resolution of R2. Same were confirmed with desirability and interaction plots, for R1 and R2, respectively.
Further, the 3D plot shows the linear effect of % of ACN in mobile phase-B (A) (as Pareto chart) on resolution R1 and R2. Desirability plot and cube predicted resolution of 1.9 for R1 and 3.1 for R2, were optimum for the applied method conditions.

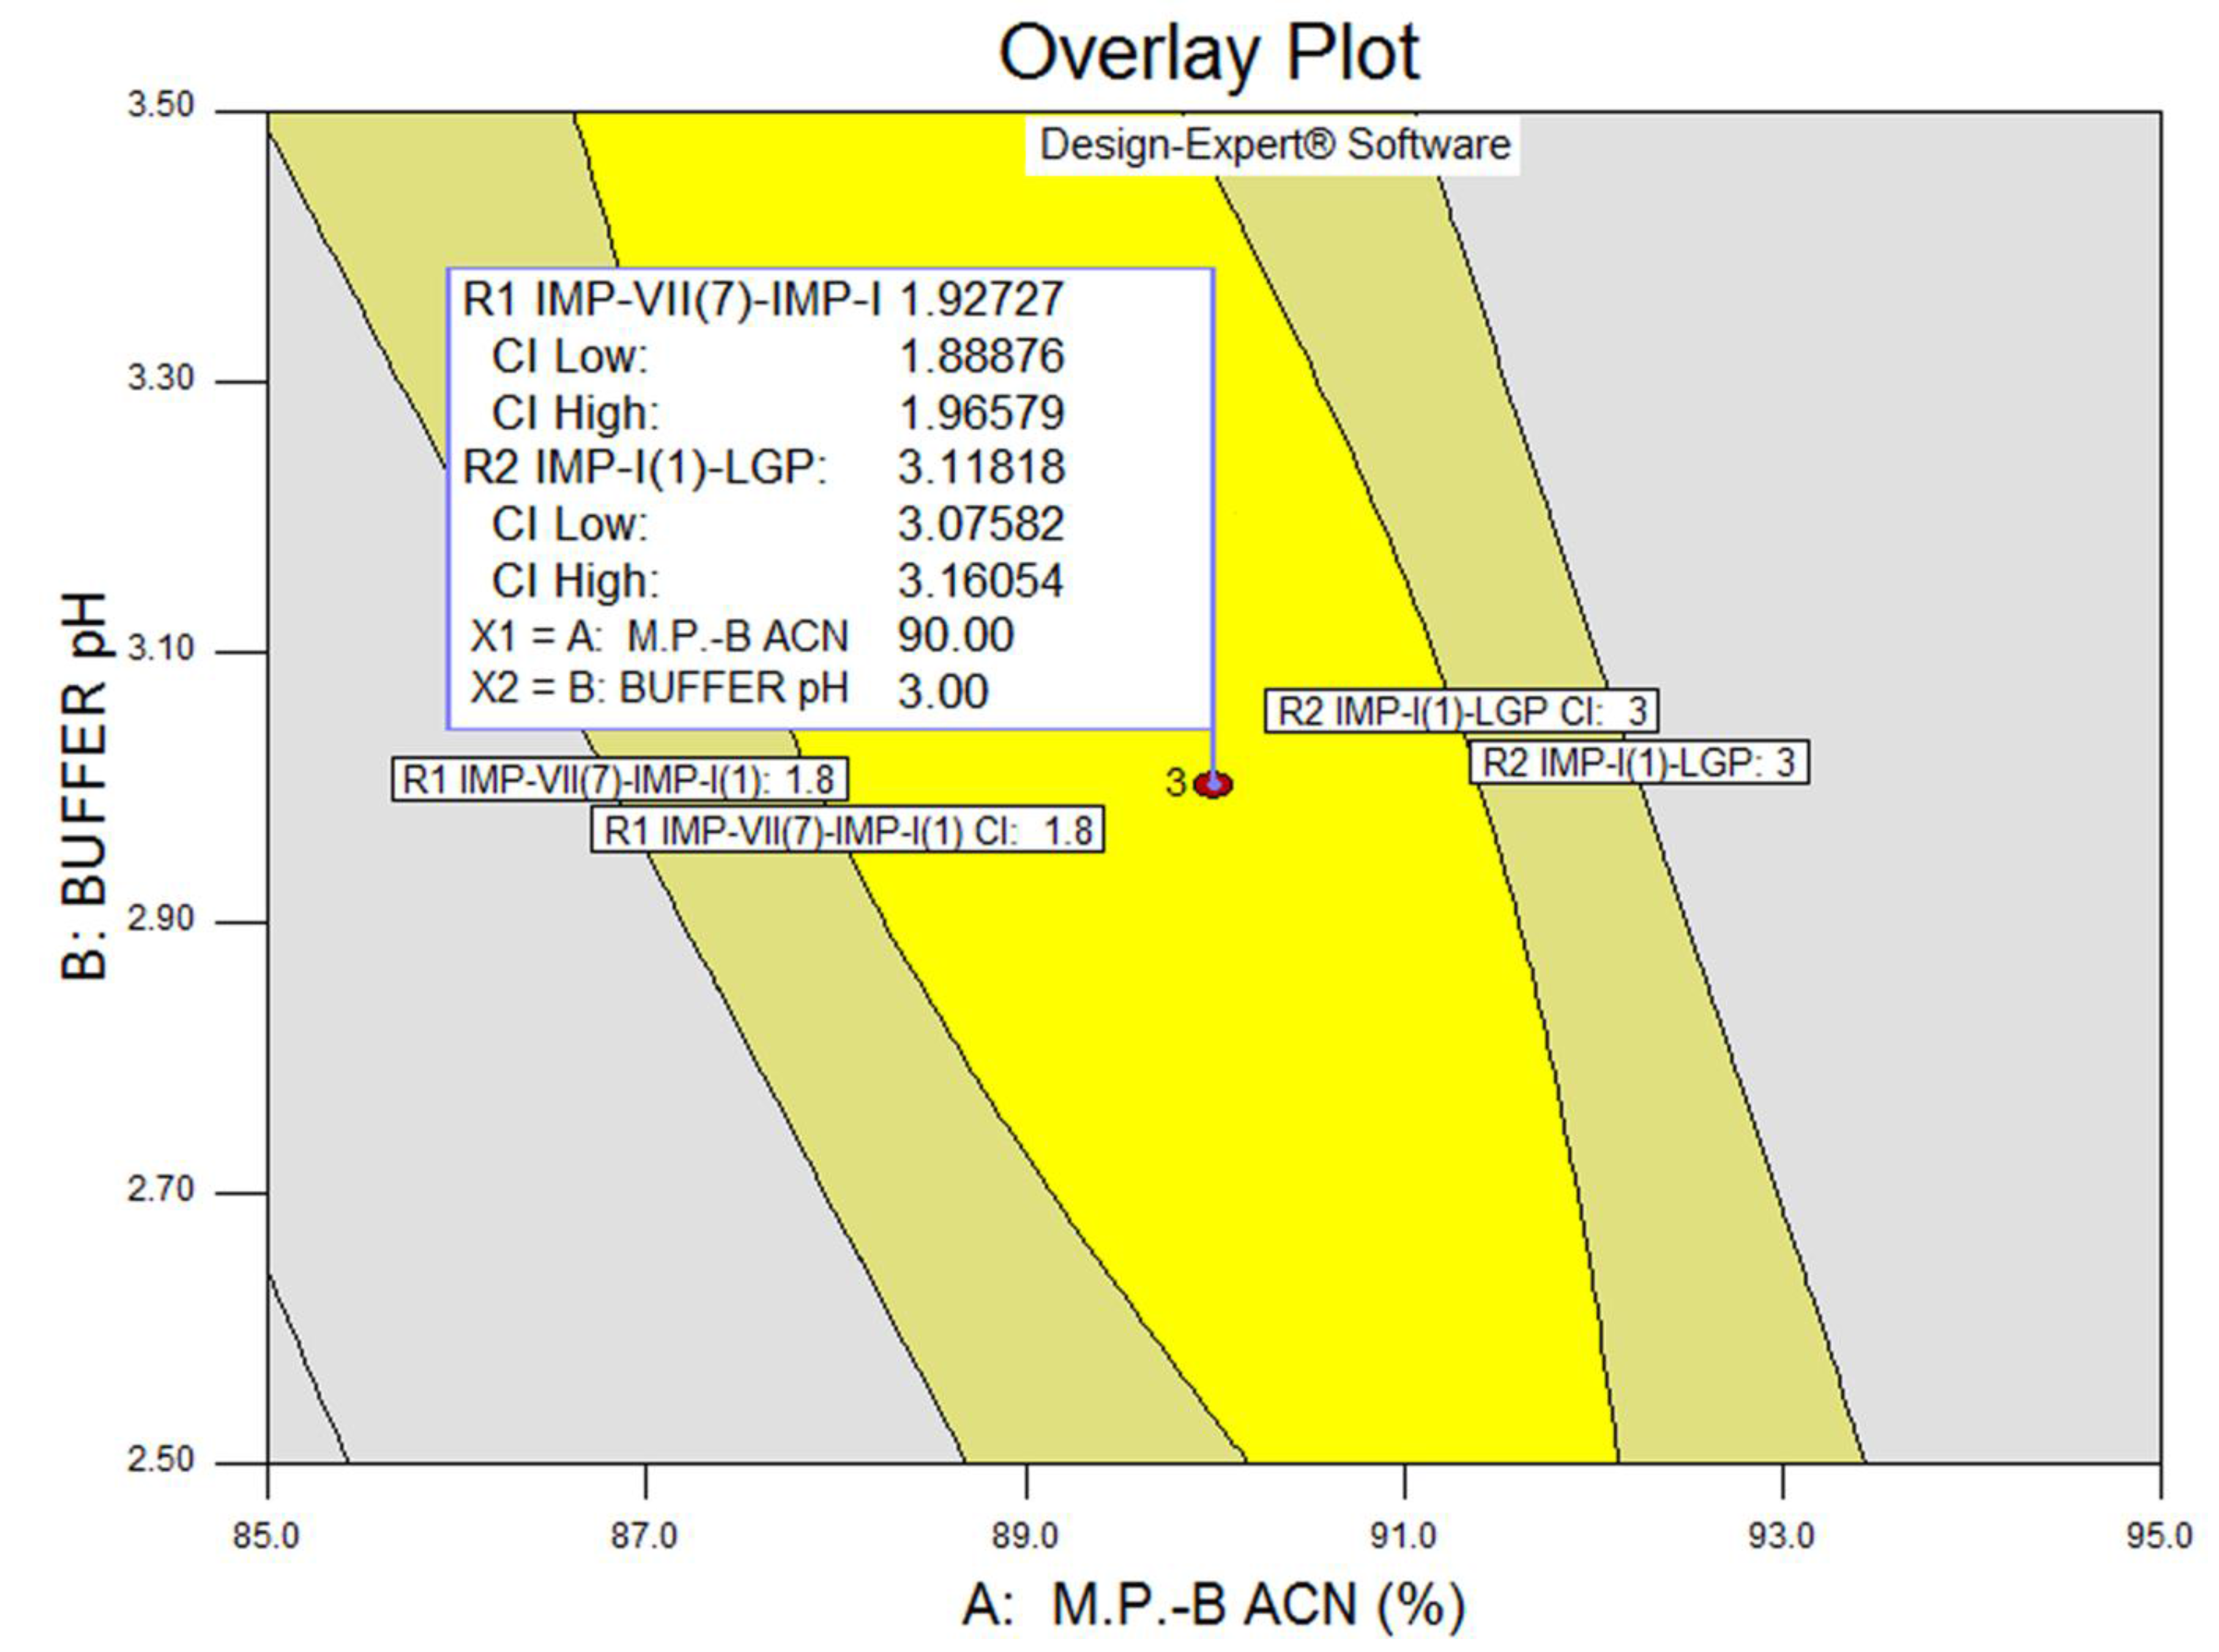
3.3. Statistical Analysis: ANOVA Analysis, Desirability and Overlay Plot

ANOVA (Analysis of variance) analysis (Table 1) showing model ‘F-value’ of 82.0, 208.33 for response R1 and R2 respectively implies the model was significant. ‘Prob > F’ values were less than 0.1 for both responses, indicates model terms were significant. The difference between adjusted and predicted R2 values were less than 0.2 as well as ‘p-value’ was less than 0.05 hence the model was significant. It shows a significant effect of % of ACN in mobile phase-B on resolution R1 and R2.
To achieve a resolution greater than 1.8 and 3.0 for R1 and R2, % of ACN in mobile phase-B should be between 87% to 92% and the pH of the buffer should range from 2.5 to 3.4 which is shown in overlay plot (Figure 3). The PAR for the % of ACN in mobile phase-B was too low i.e., 87% to 92% which indicates that method was highly sensitive to % of ACN in mobile phase-B for R1 and R2, respectively.
Therefore, the NOR for % of ACN in mobile phase-B ±2% and buffer pH ±0.2 hence it was recommended to use glass cylinders with utmost careinstead of plastic cylinders—while preparing mobile phase as a control strategy. The selected method parameters and chromatographic conditions gave the resolutions 1.9 and 3.1 for R1 and R2 respectively, which ensures minimal problems during quality control analysis. Final chromatographic conditions are as stated in 2.2 Instrumentation and Chromatographic Conditions.

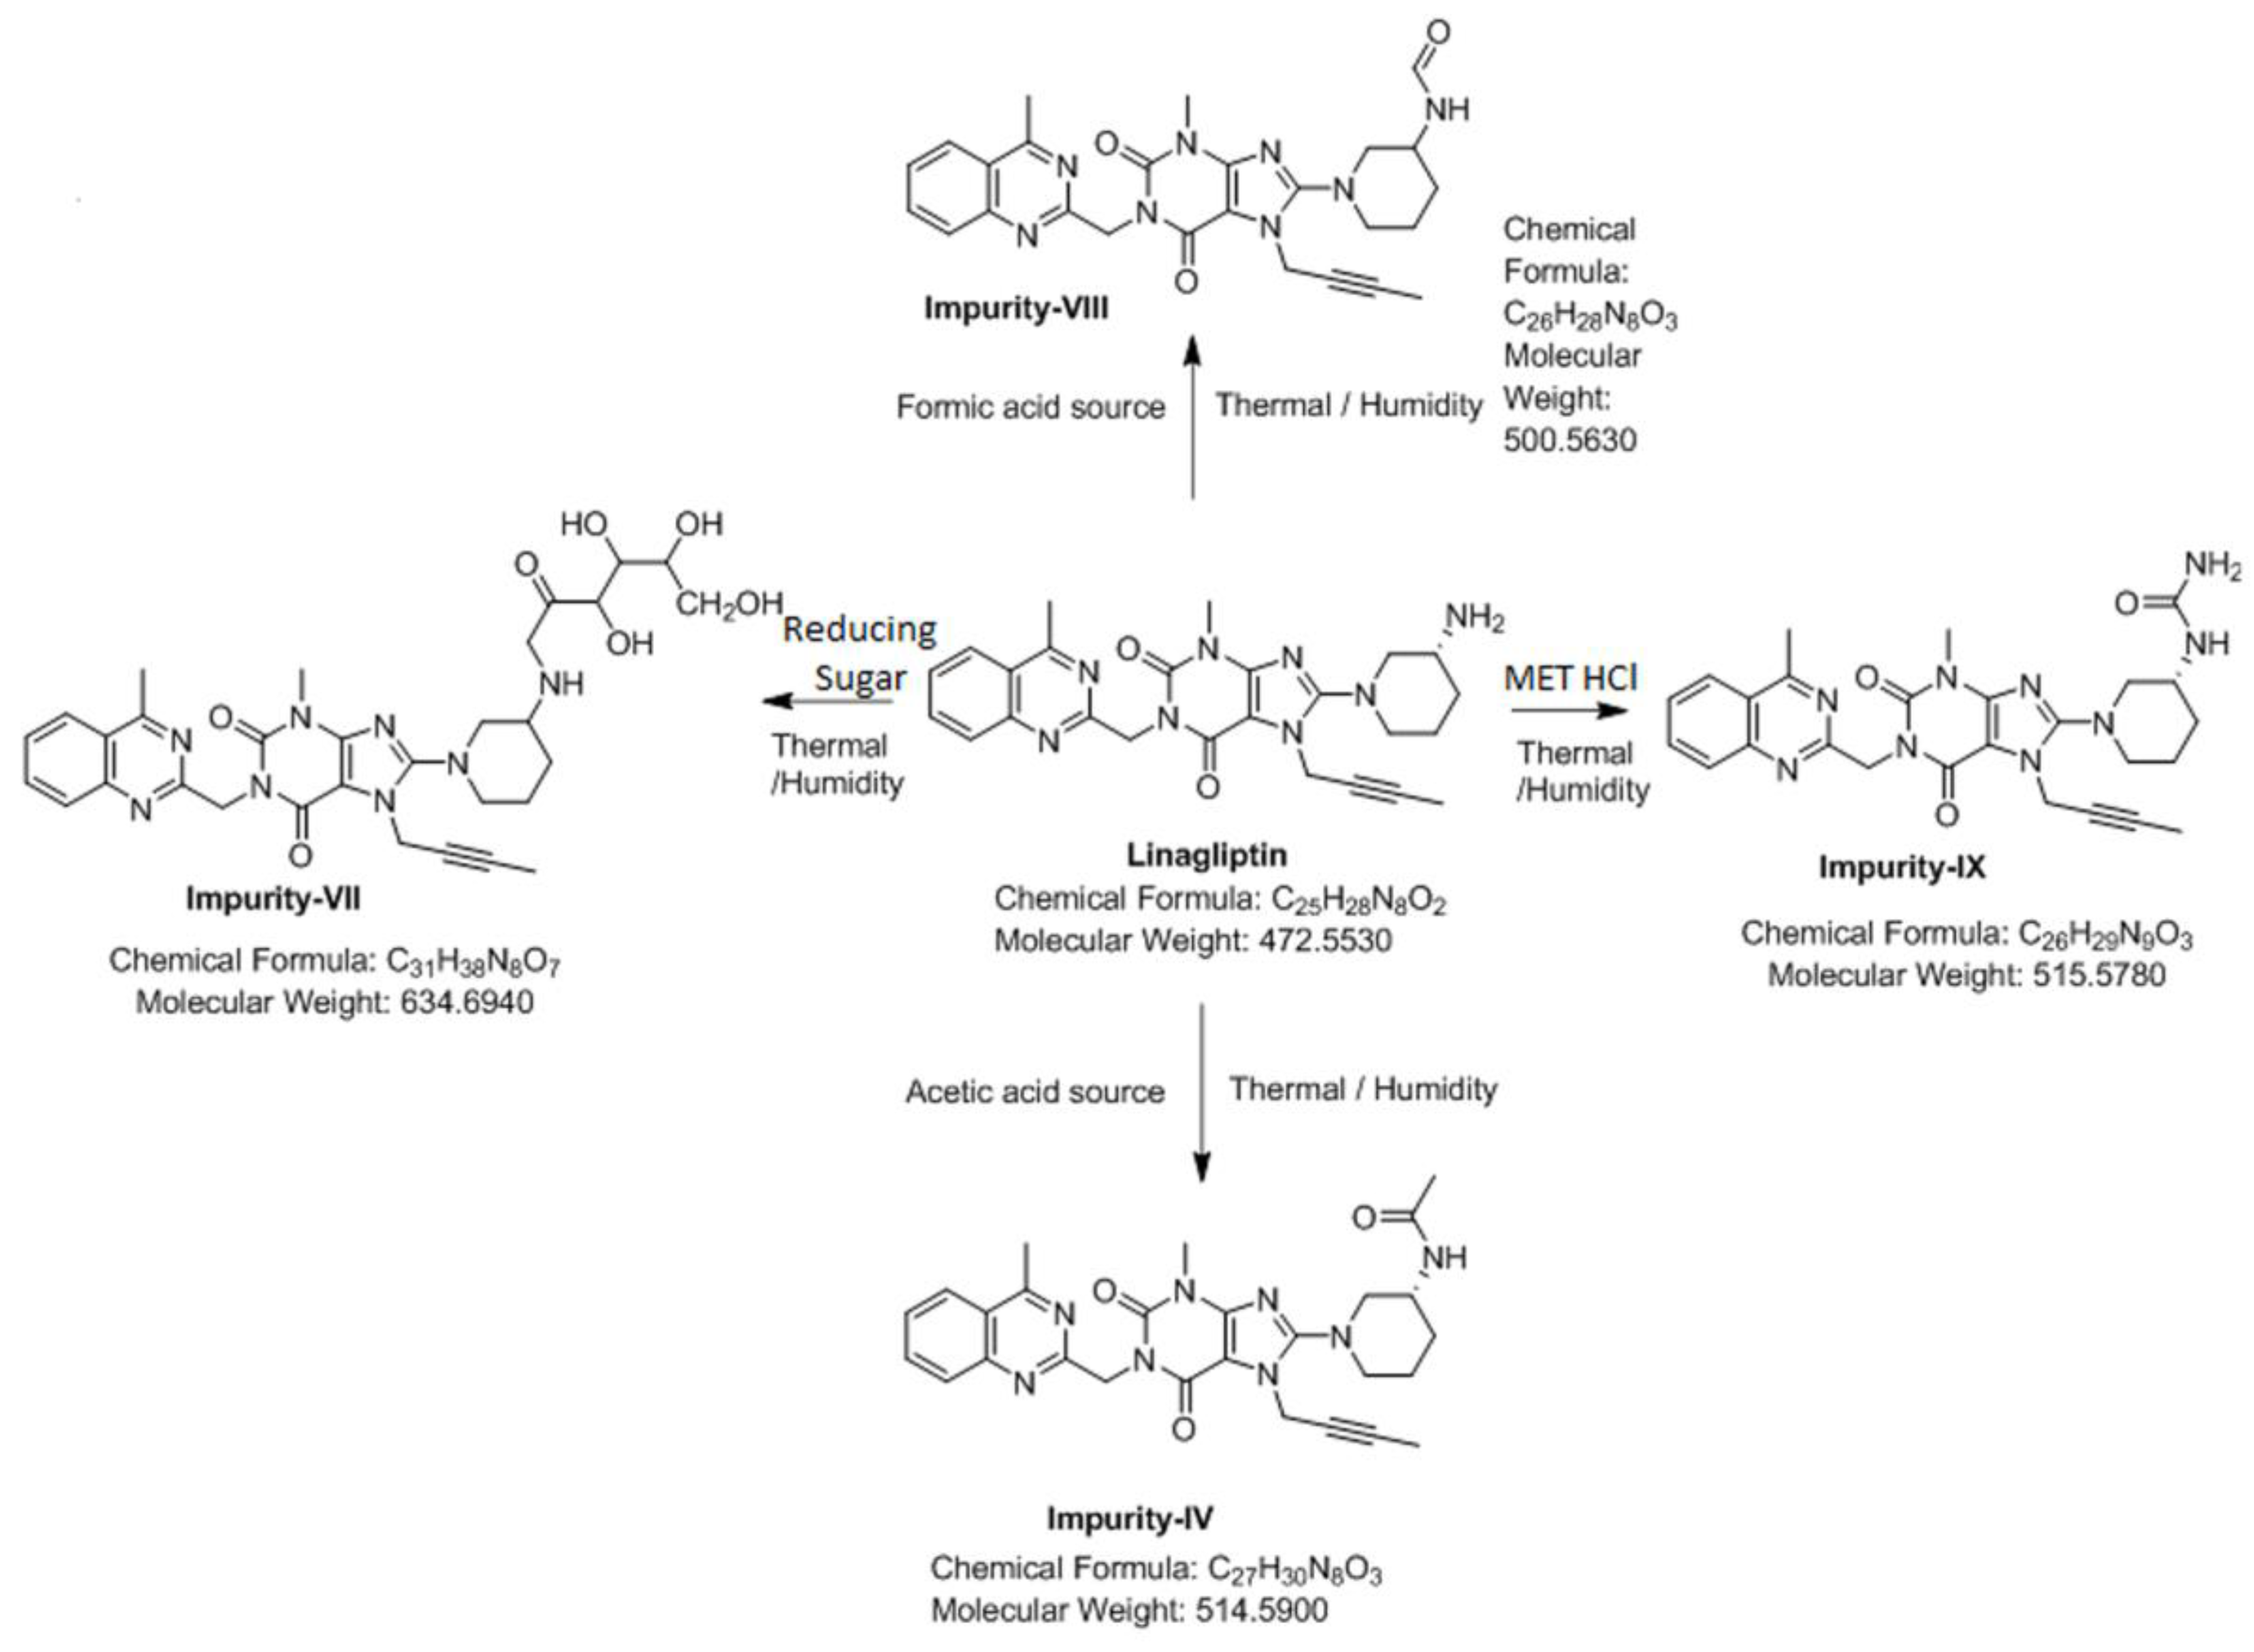
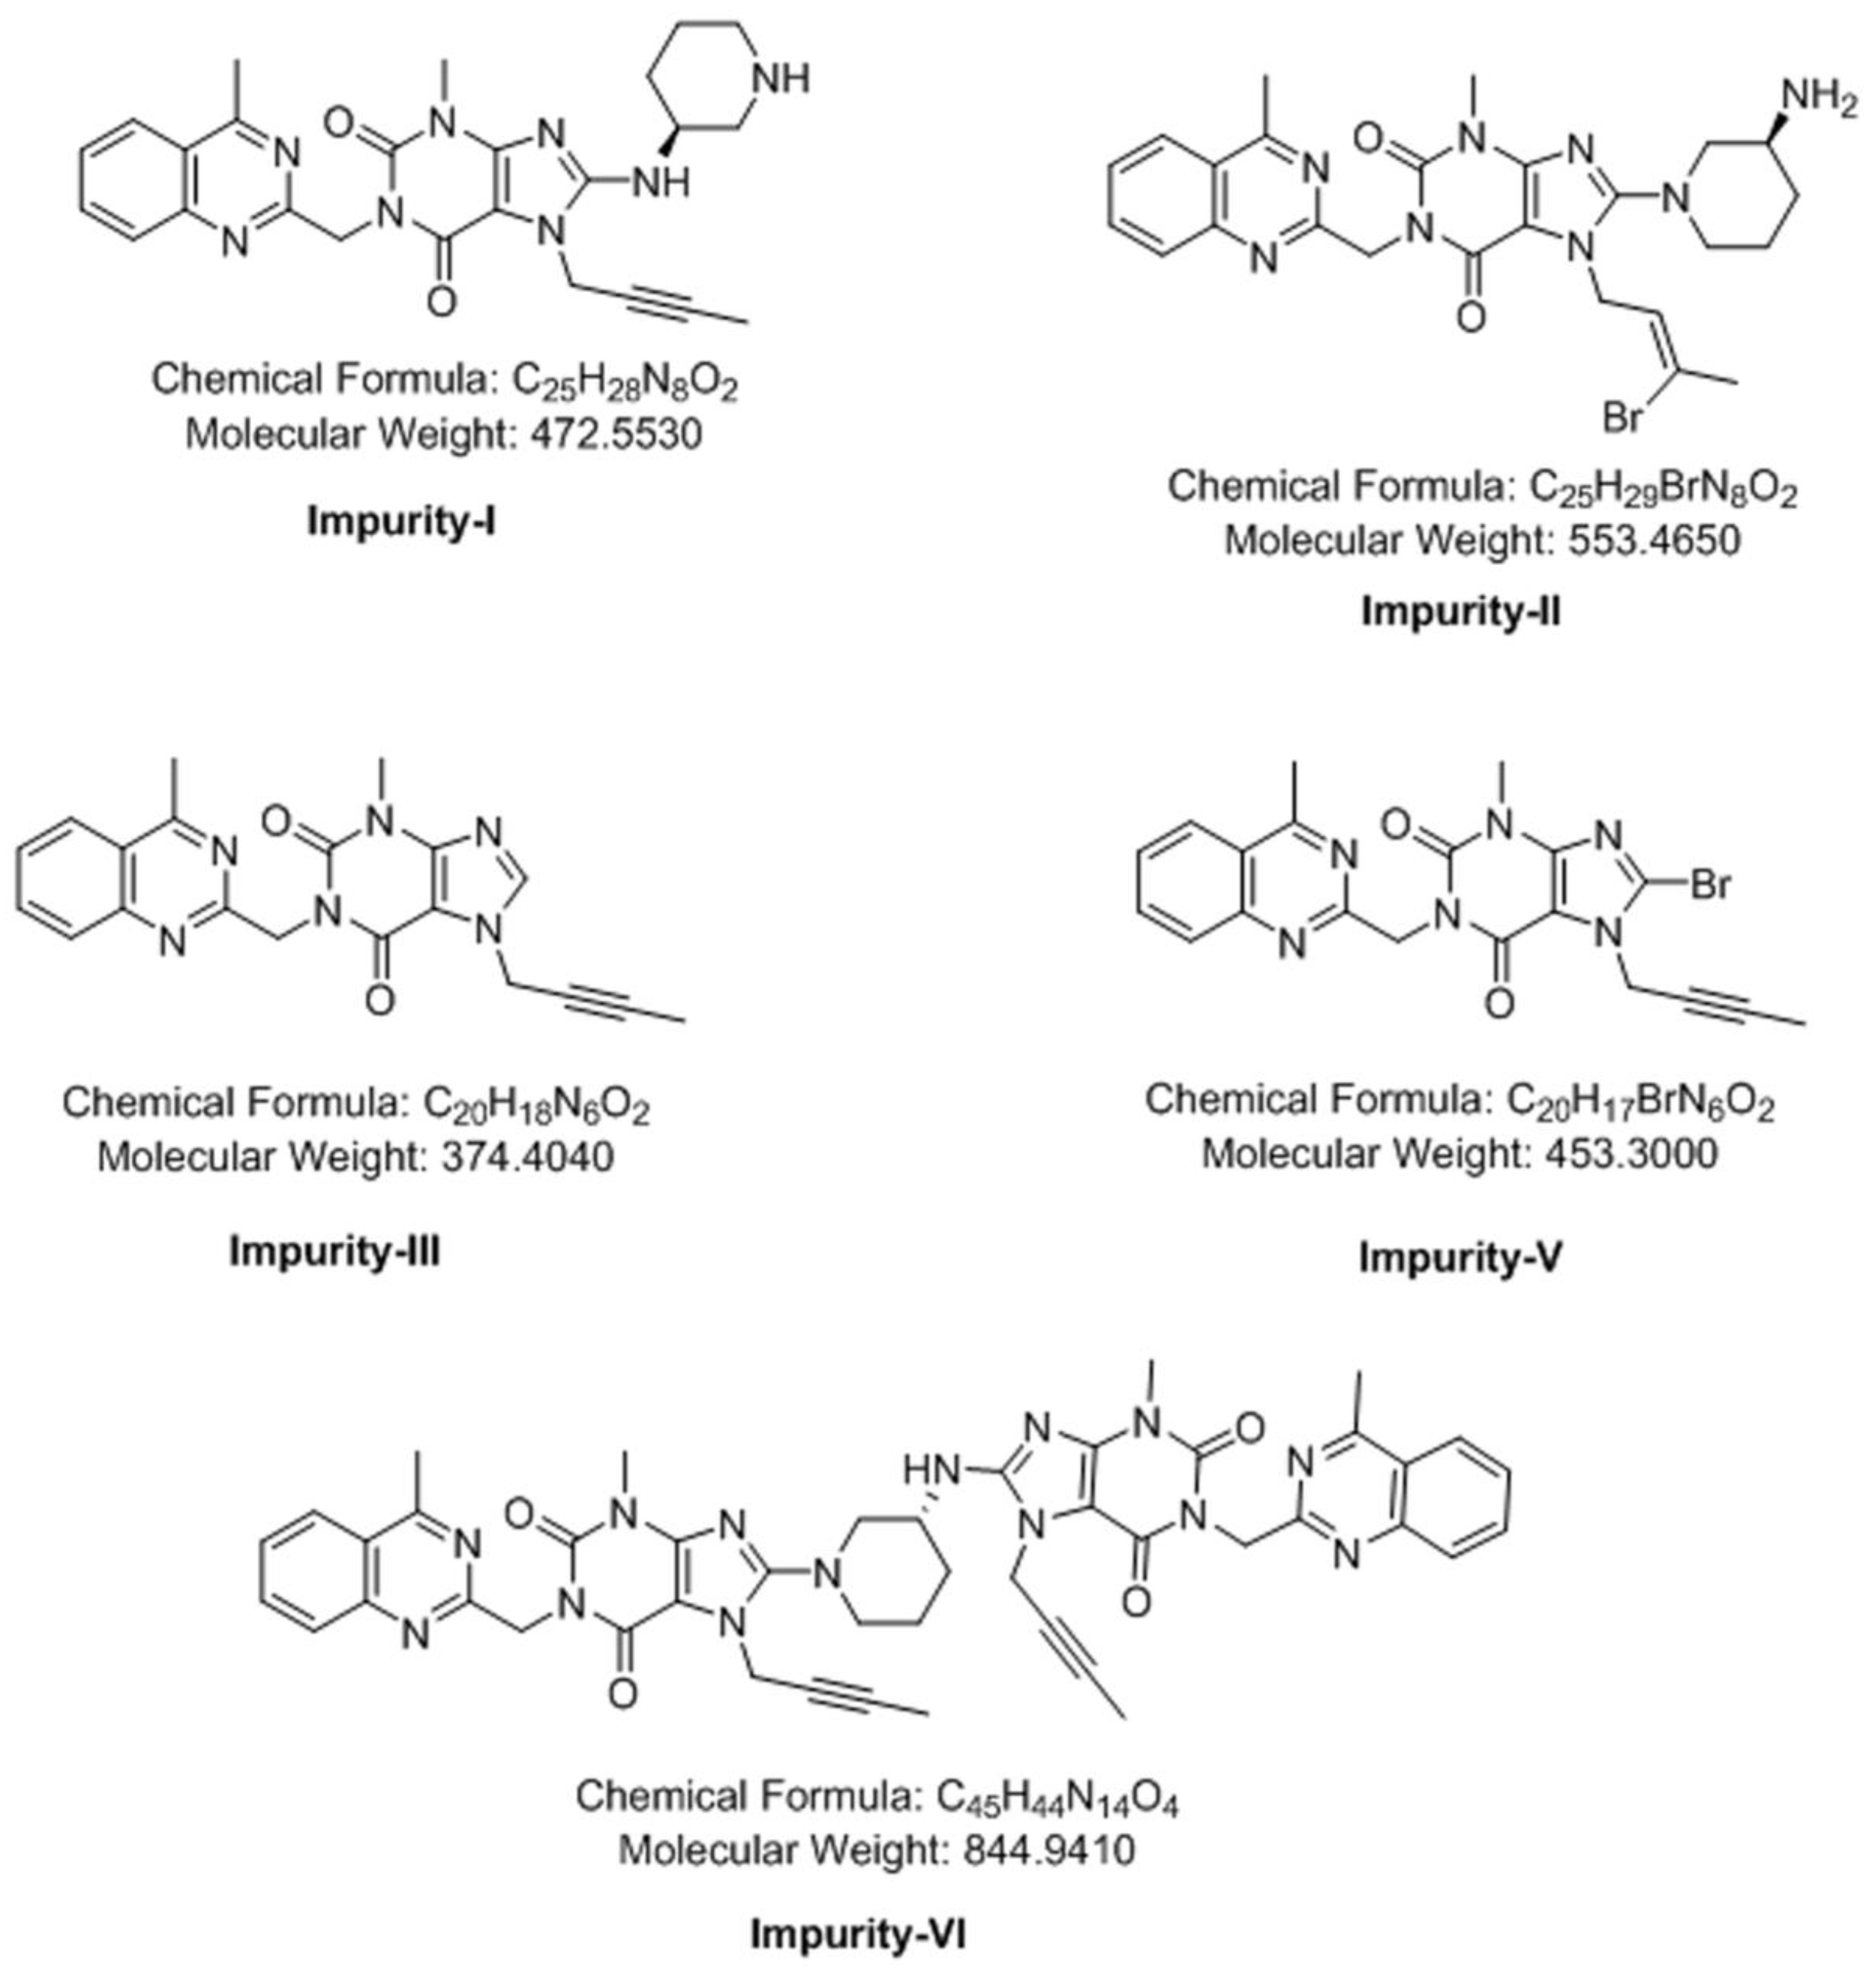
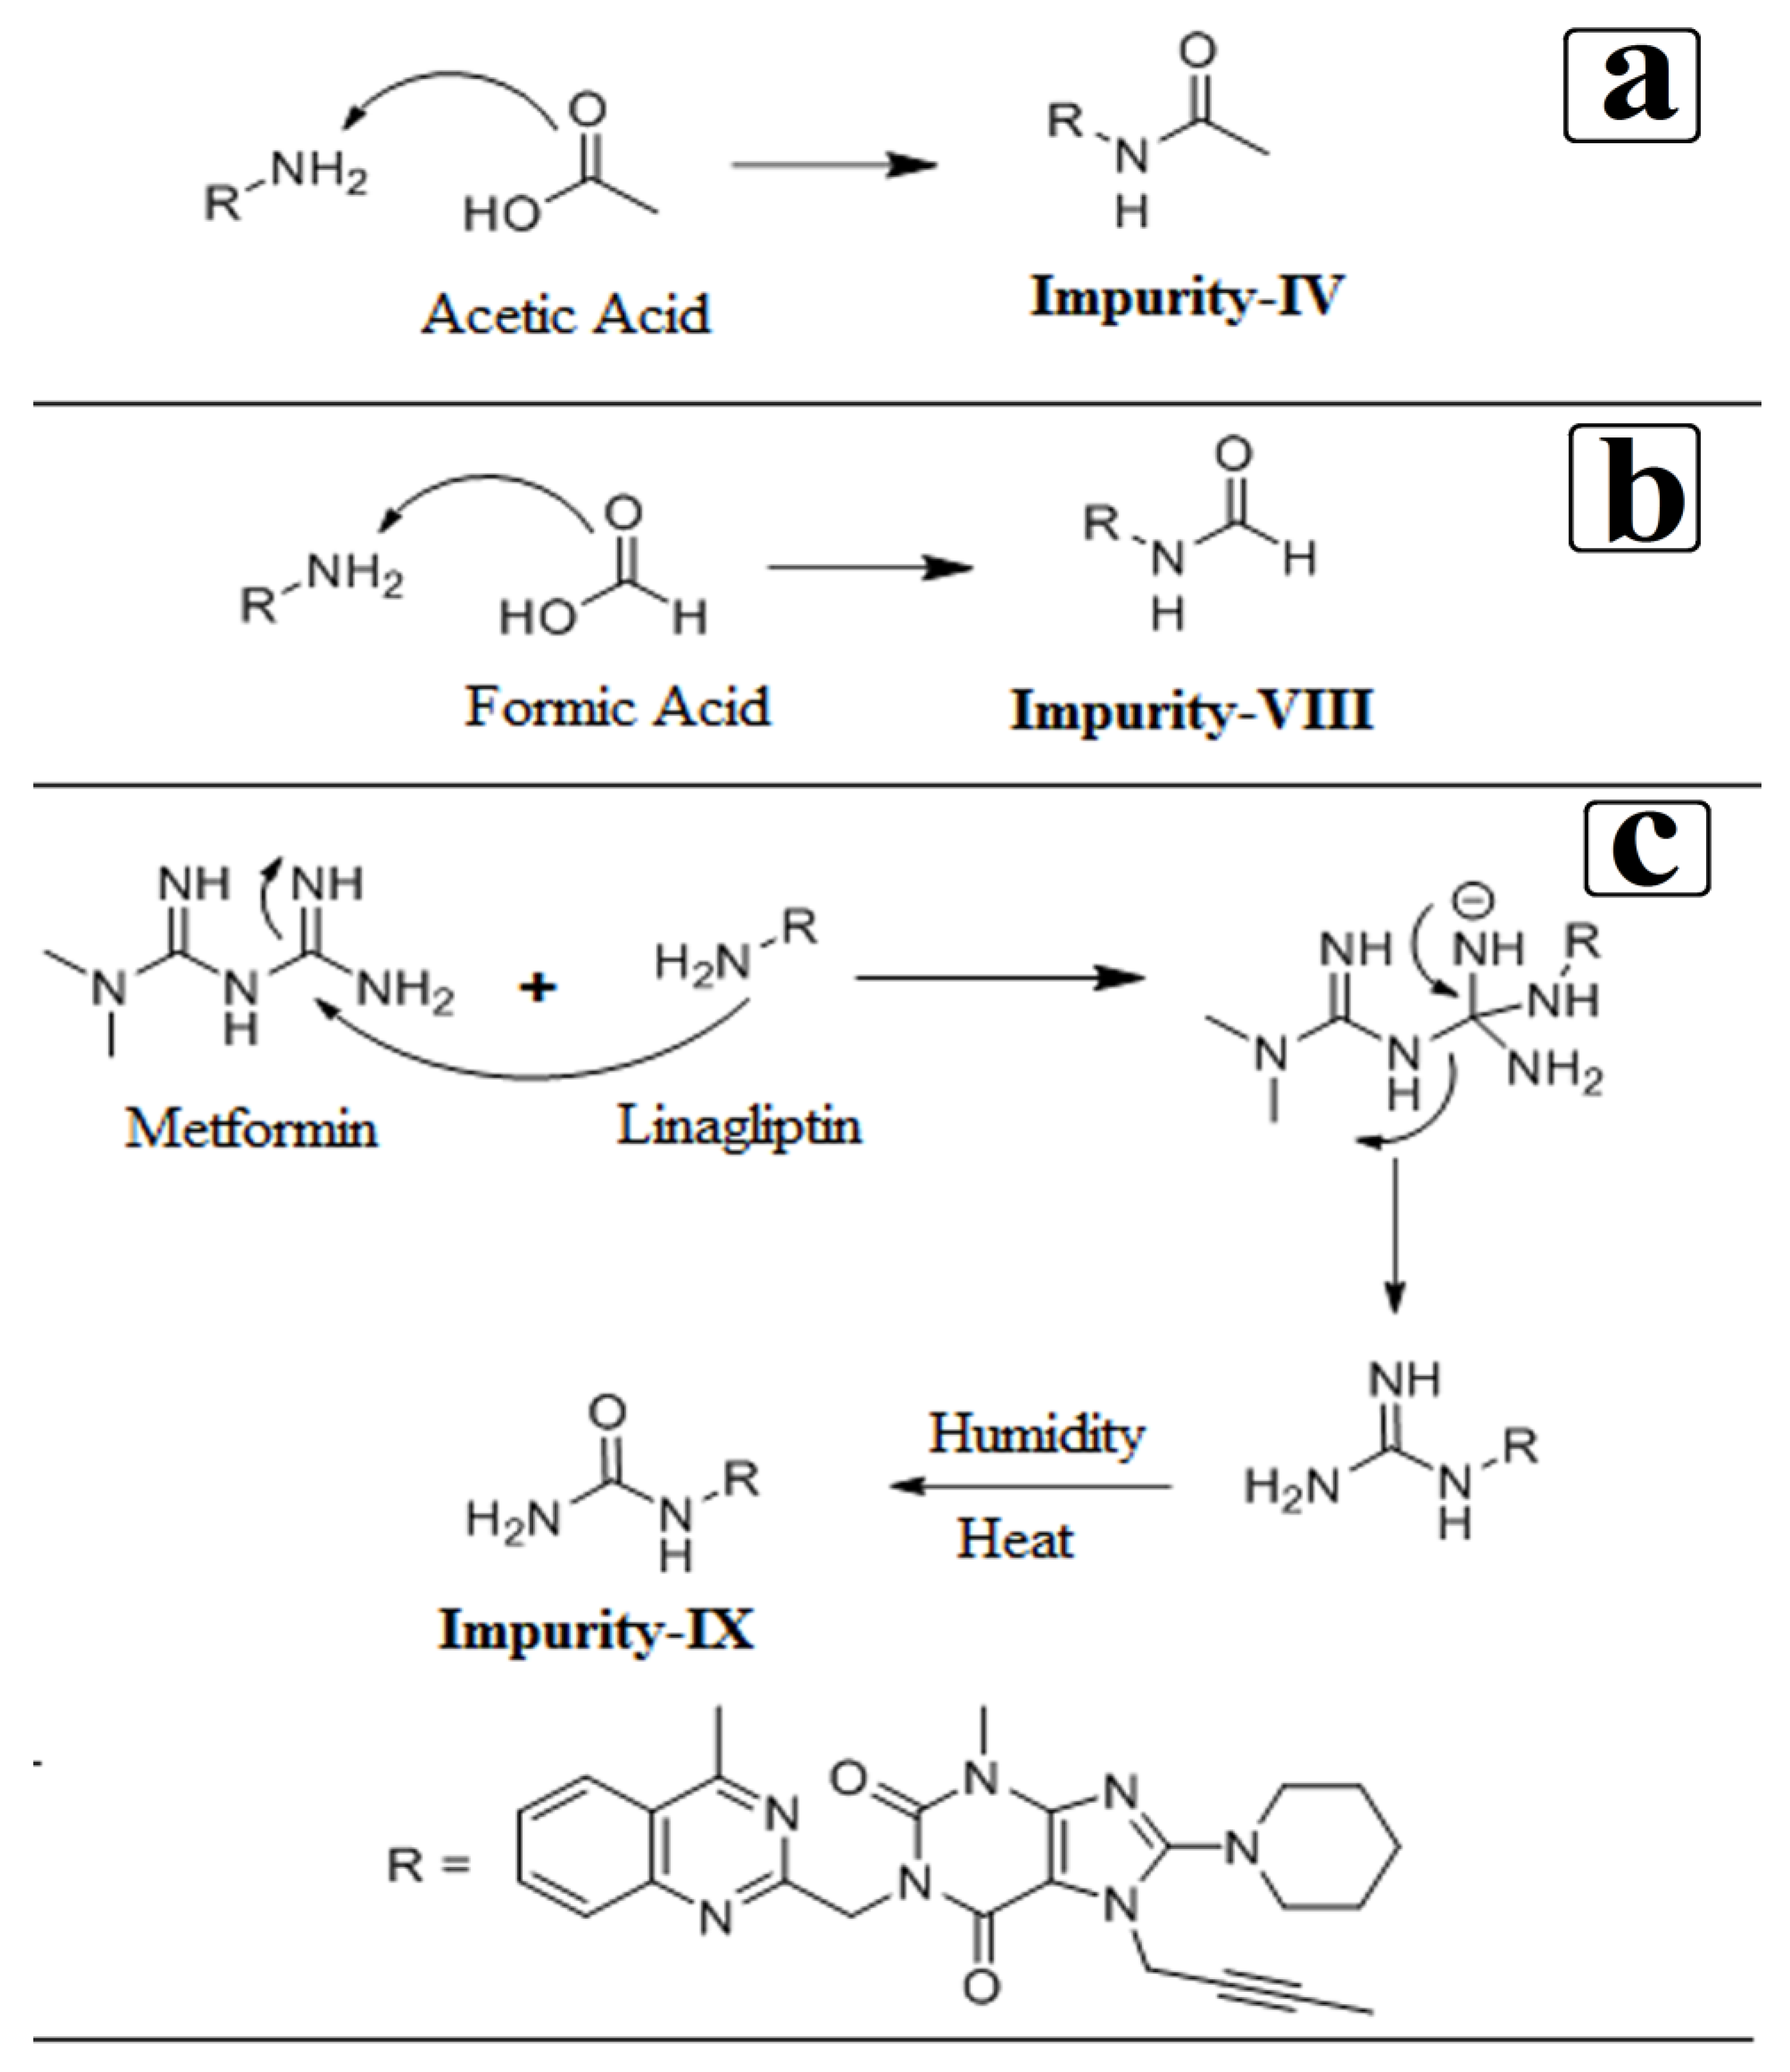
3.4. Synthesis of Impurity-VII (7) and Structural Elucidation of Unspecified, Degradation Impurities

The Impurity IV (4) was formed due to presence of traces of acetic acid in excipients and Impurity-VII (7) was formed due to presence of reducing sugar while Impurity-VIII (8) was formed due to the presence of formic acid in excipients and Impurity-IX (9) was formed in presence of MET HCl and it was observed that these four impurities will accelerate the formation in presence of heat and humidity. However, Impurity IV (4) and Impurity VIII (8) undergo a general mechanism to form amide in presence of amine and acid. The specification limits for these impurities were 1.0% and structures of these impurities were identified and confirmed by the developed method and by MS, 1H-NMR and Infra-Red (IR) outputs. Based on the results, degradation pathway, reaction mechanism of Impurity-IV (7), VIII (8), IX (9) and process related impurities were outlined as shown in Scheme 1, Scheme 2, and Scheme 3 respectively.

3.4.1. Synthesis and Structural Elucidation of Impurity-VII (7)

Mixed 1 g of LGP and 1 g of reducing sugar in a round bottom flask and added 100 mL of toluene and refluxed for about 2 h at 120 °C, then the reaction mass was subjected to preparative HPLC for isolation of desired Impurity-VII (7). The reducing sugar gets oxidized and further reacts with LGP in presence of heat, humidity, and MET-HCl, forming Impurity-VII (7).
The IR (KBr, cm1): 3420, 2936, 1702, 1652, 1517, 1438; 1H NMR (400 MHz, DMSO-d6): δ (ppm) 8.24–8.26 (m, 1H), 7.90–7.94 (m, 1H), 7.81–7.83 (m, 1H), 7.66–7.7 (m, 1H), 5.32 (s, 2H) 4.87 (s, 2H), 4.37–4.43 (m, 1H) 3.75–3.87 (m, 2H) 3.49–3.64 (m, 4H), 1.91–1.94 (m, 4H) 1.63–1.66 (m, 1H) 1.32 (m, 1H). MS (ESI): m/z 635 (M+1) and UPLC-TOF/MS spectrum showed molecular formula C31H38N8O7. The ESI-MS spectrum of the Impurity-VII (7) showed a molecule peak at m/z 635 (M+1). IR spectrum displayed the characteristic C=O absorption peak of ketone at 1702/cm. In 1H-NMR spectrum shows, 4 aromatic protons observed in the region of δ 7.7–8.24 ppm and 29 protons were observed in the region of δ 1.24–5.3 ppm. The reducing sugar moiety peaks were observed in the region of δ 1.24–5.3 ppm; based on the above spectral data the structure was identified as (Z)-7-(bu-2-yn-1-yl)-3-methyl-1-((4-methylquinazolin-2-yl)methyl)-8-(3-((2,3,4,5,6-pentahydroxyhex-1-en-1-yl)amino)piperidin-1-yl)-3,7-dihydro-1 H-purine-2,6-dione.

3.4.2. Structural Elucidation of Impurity-VIII (8)

The IR (KBr, cm1): 3453, 3363, 2939, 1699, 1660, 1566, and 1519; 1H NMR (400 MHz, DMSO-d6): δ (ppm) 8.24–8.26 (m, 2H), 8.02 (b,1H) 7.88–7.94 (m, 1H), 7.82–7.97 (m, 1H), 7.65–7.67 (m, 1H) 5.32 (s, 2H), 4.89 (s, 2H), 3.92–4.01 (m, 1H); 3.61–3.67 (m, 1H), 3.51–3.55 (m, 1H), 3.4 (s, 3H) 3.12–3.19 (3, 1H) 2.97–3.04 (m, 1H) 2.88 (s, 3H) 1.71–1.86 (m, 6H) 1.48–1.54 (m, 1H) MS (ESI) and UPLC-TOF/MS spectrum showed molecular formula C26H28N8O3. The ESI-MS spectrum of the Impurity-VIII (8) showed a molecule peak at m/z 501 (M+1). IR spectrum displayed the characteristic amide peak at 1699/cm. 1H-NMR spectrum shows, 6 aromatic protons observed in the region of δ 7.67–8.26 ppm and 22 protons were observed in the region of δ 1.48–5.32 ppm. The N-formylation (-NH-CHO) peaks were observed in the region of δ 7.67–8.26 ppm along with four aromatic protons; based on the above spectral data the structure was identified as N-(1-7-(but-2-yn-1-yl)-3-methyl-1-((4-methylquinazolin-2-yl)methyl)-2,6-dioxo-2,3,6,7-tetrahydro-1H-purin-8-yl)piperidine-3-yl)formaamide.

3.4.3. Structural Elucidation of Impurity-IX (9)

The IR (KBr, cm1): 3448, 2937, 1698, 1655, 1567, 1522, 1283, 1130, 946, and 762; 1H NMR (400 MHz, DMSO-d6): δ (ppm) 8.26 (d, 1H), 7.93–7.89 (m, 1H), 7.82–7.80 (m, 1H), 7.69–7.65 (m, 1H), 6.13 (d, 1H), 5.47 (s, 2H), 5.32 (s, 2H), 4.91 (m, 2H), 3.69–3.66 (m, 2H), 3.58–3.55 (m, 1H), 3.4 (s, 3H), 3.19 (m, 1H), 2.94–2.88 (m, 4H), 1.82–1.72 (m, 6H), 1.41–1.39 (m, 1H) MS (ESI): m/z 516 (M+H) and UPLC-TOF/MS spectrum showed molecular formula C26H29N9O3. The ESI-MS spectrum of the Impurity-IX (9) showed a molecule peak at m/z 516 (M+1). IR spectrum displayed the characteristic C=O absorption peak of ketone at 1698/cm. In 1H-NMR spectrum shows, 4 aromatic protons observed in the region of δ 8.26–7.65 ppm and 25 protons were observed in the region of δ 1.39–6.13 ppm, based on the above spectral data the structure was identified as (R)-1-(1-(7-(but-2-yn-1-yl)-3-methyl-1-((4-methylquinazolin-2-yl)methyl)-2,6-dioxo-2,3,6,7-tetrahydro-1H-purin-8-yl)piperidin-3-yl)urea.

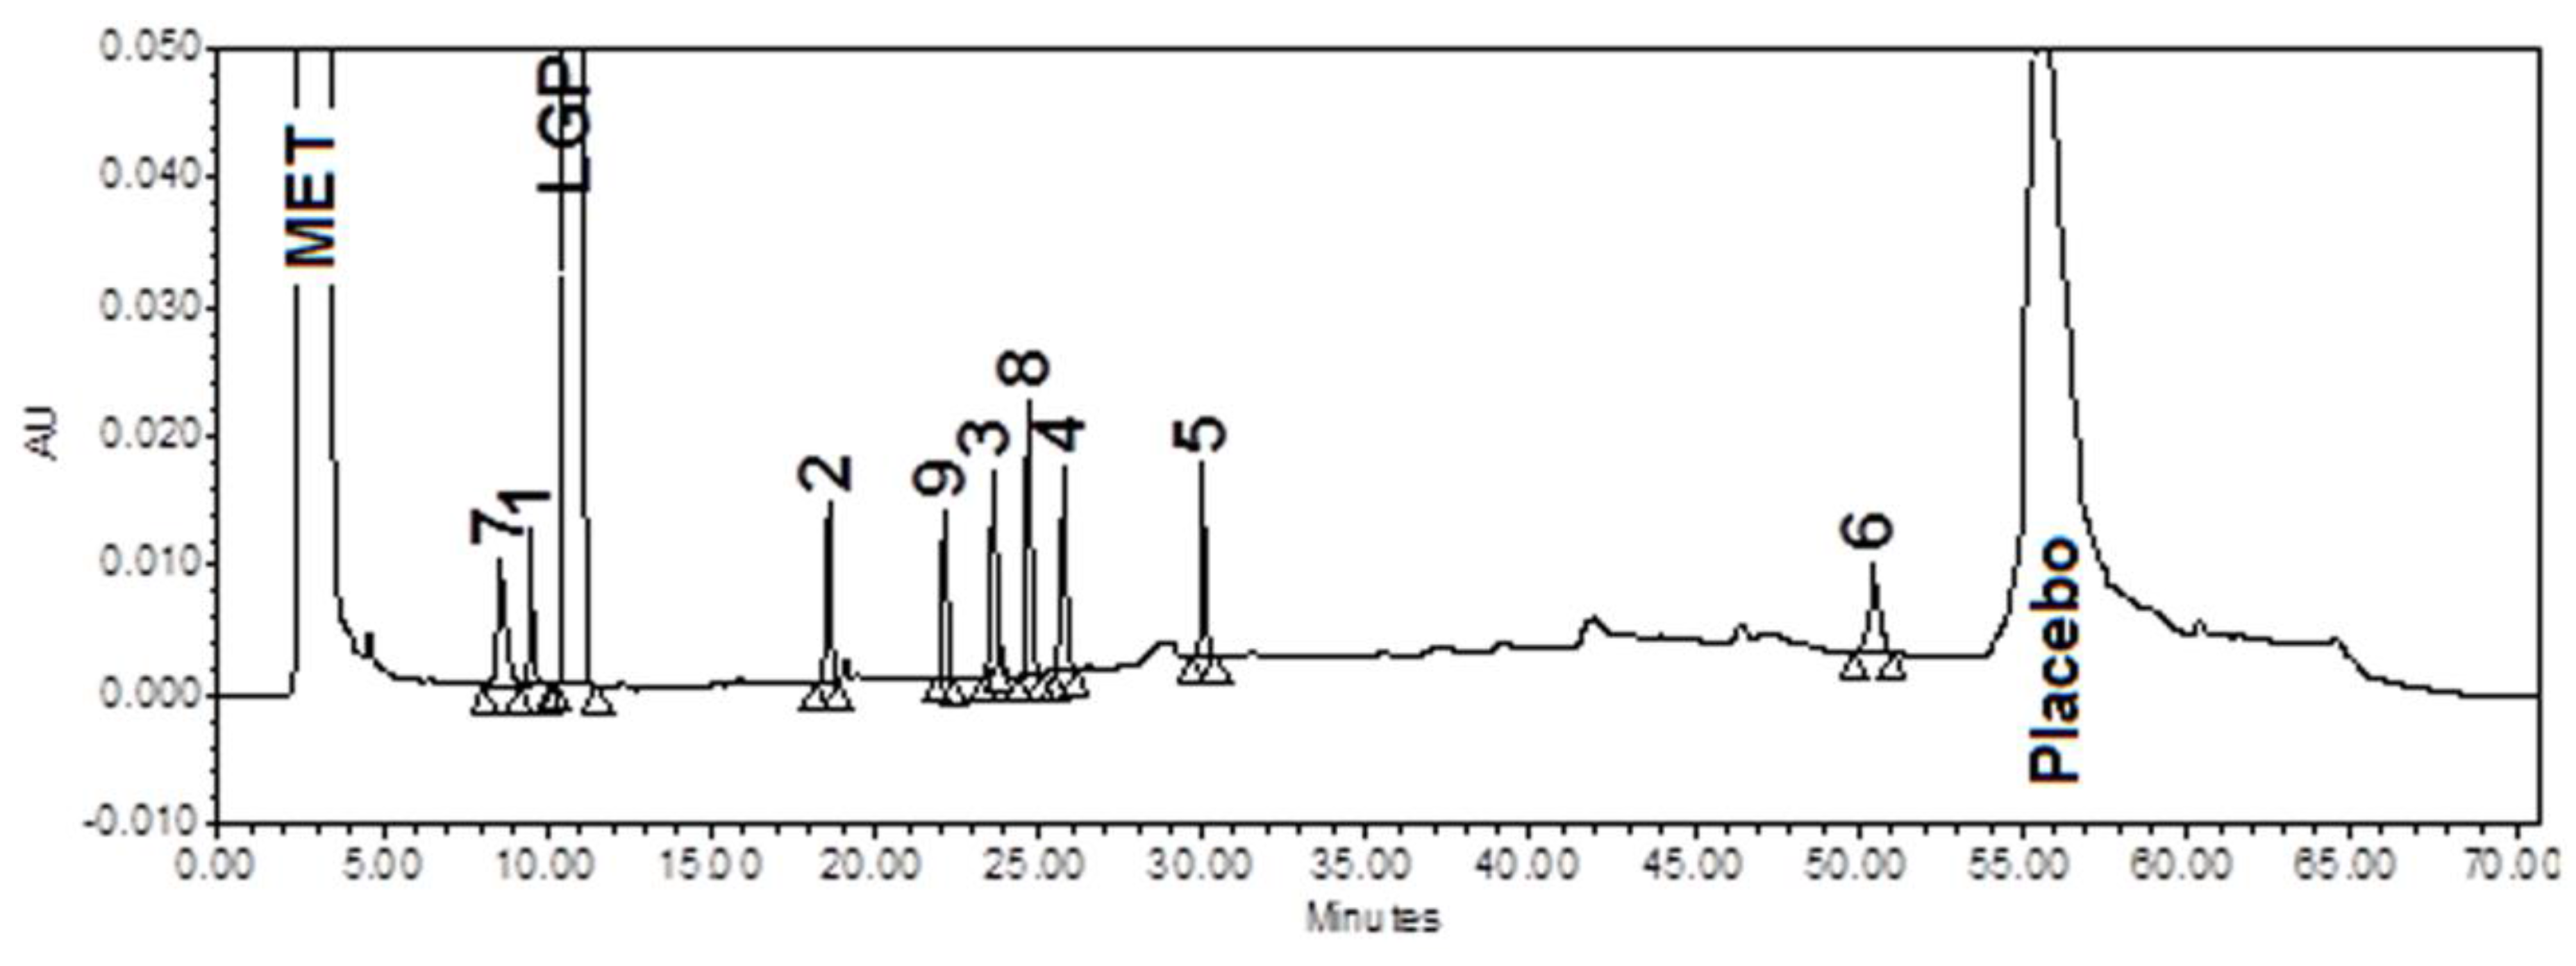
3.5. Stress (Forced Degradation) Study/Specificity

Forced degradation and placebo interference studies were performed to demonstrate the specificity of the proposed method, by preparing placebo equivalent to the amount present in drug product as well as by preparing test and stressed with acid, base hydrolysis, peroxide oxidation, photolytic, heat, and humidity stress conditions as shown in Table 2.
Specificity study shows that all impurities are well separated from LGP as shown in Figure 4, and there was no interference at the retention time (RT) of LGP and its impurities due to diluent blank, placebo/matrix, and degradation products. Disregard the peaks due to MET HCl and its impurities up to 6 min and placebo peak at about 55 min. Mass balance for each degradation condition was between 95.8–101.3%, while the purity angle was greater than the purity threshold for each impurity and LGP in all degradation conditions, indicating the high specificity and selectivity of the method.

3.6. Validation

3.6.1. Precision

The precision of the method was demonstrated by injecting six samples prepared by spiking test preparation with LGP impurity blend solution to get 0.5% concentration of each impurity and by spiking LGP on placebo to get 0.4% concentration. Intermediate precision was checked on a different day with different analyst, column, and system to get 0.5% concentration of each impurity. The developed method was found to be precise as the % RSD was <2.3%, for a method and <1.8%, for intermediate precision, as recommended by ICH.

3.6.2. Limit of Detection and Limit of Quantitation

The signal to noise ratio method was adopted for the determination of limit of quantification. Quantification limit was achieved by injecting a series of possible dilute solutions of all impurities and LGP. The precision was also established at quantification level. The limit of detection (LOD) and limit of quantitation (LOQ) values of LGP and its impurities were less than the reporting threshold for impurities and LGP.

3.6.3. Accuracy

The accuracy of the method was carried out in triplicate by adding known amount of each impurity corresponding to five concentration levels; LOQ, 50, 75, 100, and 150% of 1.0% for each impurity and LOQ, 50, 100, 125, and 150% of 0.4% of LGP along with the placebo.
The same treatment was given as described in test preparation. The percentage recoveries of all impurities at each level and each replicate were determined. The recovery of LGP and its impurities were found in the range of 95.8–112.8% with respect to added quantities of LGP and its impurities.

3.6.4. Linearity and Range

The linearity was determined by preparing standard solutions at n=6 concentration levels ranging from LOQ to 300% of 0.5% for each impurity (LOQ: 0.0197, 0.0197, 0.0196, 0.0194, 0.0196, 0.0246, 0.0199, 0.0197, 0.0201, and 0.0198 μg mL−1 for IMP-I, II, III, IV, V, VI, VII, VIII, IX and LGP respectively). The response was linear as r was >0.9972 and bias at 100% response were also <0.98% for each impurity and LGP. The range was established by confirming that the analytical procedure provides an acceptable degree of linearity, accuracy, and precision when applied to samples containing amounts of analyte from LOQ to 300% of 0.5% for each impurity and 0.4% for LGP.

3.6.5. Robustness

The effect of change in flow rate (−0.1 and +0.2 mL min−1), column oven temperature (±5 °C), pH of mobile phase-A buffer (±0.2 pH), and mobile phase-B organic composition (±10%), on the retention time, theoretical plates, tailing factor, response ratio of first two standard injections, and % RSD were studied. It was confirmed from the system suitability results and RRTs (Relative Retention Time) that the method was robust with respect to variability in above conditions.

3.6.6. Solution and Mobile Phase Stability

Stability of test and the standard solution was established on the bench top (25 °C) and in the refrigerator (2–8 °C) for 1, 2, and 5 days (d). Test solution did not show any significant change in specified, unspecified as well as on total impurities for 5 d at bench top and in refrigerator conditions. Similarity factor for standard was in the range of 0.95 to 1.05 for 5 d at bench top, as well as in refrigerator conditions, indicates that test solution and standard solution were stable for up to 5 d on the bench top and in refrigerator conditions.
Stability of mobile phase was established by storing it on the bench top (25 °C) for 5 d.
Test solution did not show any significant change with bench top stored mobile phase up to 5 d on specified, unspecified, as well as on total impurities; indicating that mobile phase was stable up to 5 days on bench top.

3.6.7. Filter Compatibility

Filter compatibility was performed on Nylon and PVDF (Poly vinylidene Difluoride) 0.45 μm syringe filters. No significant change in specified, unspecified, and total impurities with respect to the centrifuged sample was observed.
From the above data, the test procedure for the related substances of LGP in LGP-MET HCl tablets was validated and found to be linear, precise, accurate, rugged, robust, specific, and stability indicating.

4. Conclusions

A new stability indicating reverse phase HPLC method was developed; by implementing DoE approach to understand the CMP-CMA relationship; for determination of LGP and its degradation products, for API as well as pharmaceutical dosage forms i.e., in LGP-MET HCl Tablets. The overlay plot obtained by the DoE study ensures optimum method performance over the lifetime of the product. The developed method is capable of separating nine identified and specified impurities within 70 min. Forced degradation studies were conducted, and the major degradants (i.e., Impurity-VII (7) Impurity-VIII (8), and Impurity-VIII (9)) formed during stability were identified using LC-MS, TOF/MS, NMR, and IR techniques; which are not yet official in any pharmacopoeia; present work also describes the synthesis of Impurity-VII (7), which will be helpful to pharmaceutical industry. The developed method was fully validated in accordance with ICH guidelines and found to be accurate, precise, reproducible, robust, and specific; confirming the stability indicating nature of the method. Thus, the method can be used for the “Quality Control” release of LGP API and LGP-MET HCl pharmaceutical formulations.

Supplementary Materials

The following are available online at www.mdpi.com/2218-0532/85/3/25/s1, Figure S1: Overlaid Chromatogram of impurity mix solution, placebo, diluent blank and standard solution; Figure S2: Chromatograms showing degradation studies in unstressed, acid, base and peroxide; Figure S3: Chromatograms showing degradation studies in water, thermal, photolytic and humidity; Table S1: Design of experiment (DoE) design and results obtained by full factorial design with Design Expert Software; Table S2: Results of Precision (n = 6), Intermediate Precision (n = 6); LOD and LOQ (n = 6); Accuracy at LOQ (n = 3); Accuracy at 150% (n = 6); Correlation coefficient (r) and %Bias at 100% and Table S3: Results of forced degradation with respect to individual impurity; Tables S4, S5 and S6: NMR assignments for structural elucidation of Impurity-VII, -VIII and -IX respectively.

Acknowledgments

The authors would like to thank Dr. Reddy’s Laboratories Ltd., IPDO, Bachupally, Hyderabad, India for supporting this work. The authors also would like to acknowledge P. Joy Babu, Raghava Raju, Sritharan Sitaraman, Navin Vaya, Vishu Ghanwat, Rahul Mane, Neha Desai, Kishor Khot, Satish Patil, C. Kiran, Smrutiranjan, Suryaprakash, Mahadeo, Jagadish Badgujar, Sandip Akmar, and Amol Awati for their immense support and valuable suggestions to carry out this work. All the development and validation work performed at Analytical Research and Development laboratory, Dr. Reddy’s, IPDO Bachupally and FTO-SEZ, Pydibhimavaram, respectively.
The Authors “Intellectual Property Management” (IPM) has given this manuscript number as PUB-00503-16

Author Contributions

Sushant Jadhav conceived, designed and performed the experiments; Kalyanraman Narayanan and Popatrao Bhosale analyzed the data; Kalyanraman Narayanan and Sunil Reddy contributed reagents, materials, and analysis tools; Sushant Jadhav wrote the paper; and Sunil Reddy contributed to figures of the article.

Conflicts of Interest

The authors declare no conflict of interest. The funding sponsors had no role in the design of the study; in the collection, analyses, or interpretation of data; in the writing of the manuscript, or in the decision to publish the results.

References

  1. Deacon, C.F.; Holst, J.J. Linagliptin, a xanthine-based dipeptidyl peptidase-4 inhibitor with an unusual profile for the treatment of type 2 diabetes. Expert Opin. Investig. Drugs 2010, 1, 133–140. [Google Scholar] [CrossRef] [PubMed]
  2. Guedes, E.P.; Hohl, A.; de Melo, T.G.; Lauand, F. Linagliptin: Pharmacology, efficacy and safety in type 2 diabetes treatment. Diabetol. Metab. Syndr. 2013, 5, 25. [Google Scholar] [CrossRef] [PubMed]
  3. Barnett, A.H. Linagliptin: A novel dipeptidyl peptidase 4 inhibitor with a unique place in therapy. Adv. Ther. 2011, 28, 447–459. [Google Scholar] [CrossRef] [PubMed]
  4. Sachs, G.; Chang, H.H.; Rabon, E.; Schackman, R.; Lewin, M.; Saccomani, G. A nonelectrogenic H+ pump in plasma membrane of hog stomach. J. Biol. Chem. 1976, 251, 7690–7698. [Google Scholar] [PubMed]
  5. Dibona, D.R.; Ito, S.; Berglindh, T.; Sachs, G. Cellular site of acid secretion. Proc. Natl. Acad. Sci. USA 1979, 76, 6689–6693. [Google Scholar] [CrossRef] [PubMed]
  6. Fellenius, E.; Berglindh, T.; Sachs, G.; Olbe, L.; Elander, B.; Sjöstrand, S.E.; Wallmark, B. Substituted benzimidazoles inhibit gastric acid secretion by blocking H+, K+ ATPase. Nature 1981, 290, 156–161. [Google Scholar] [CrossRef]
  7. Del Prato, S.; Barnett, A.H.; Huisman, H.; Neubacher, D.; Woerle, H.J.; Dugi, K.A. Effect of Linagliptin monotherapy on glycaemic control and markers of β-cell function in patients with inadequately controlled type 2 diabetes: A randomized controlled trial. Diabetes Obes. Metab. 2011, 3, 258–267. [Google Scholar] [CrossRef] [PubMed]
  8. Jentadeuto—Mechanism of Action. Available online: http://www.rxlist.com/jentadueto-drug/clinical-pharmacology.htm (accessed on 6 December 2016).
  9. Phung, O.J.; Scholle, J.M.; Talwar, M.; Coleman, C.L. Effect of noninsulin antidiabetic drugs added to metformin therapy on glycemic control, weight gain, and hypoglycemia in type 2 diabetes. JAMA 2010, 303, 1410–1418. [Google Scholar] [CrossRef] [PubMed]
  10. Karagiannis, T.; Paschos, P.; Paletas, K.; Matthews, D.R.; Tsapas, A. Dipeptidyl peptidase-4 inhibitors for treatment of type 2 diabetes mellitus in the clinical setting: Systematic review and meta-analysis. BMJ 2012, 344, e1369. [Google Scholar] [CrossRef] [PubMed]
  11. Amiel, S.A.; Dixon, T.; Mann, R.; Jameson, K. Hypoglycaemia in Type 2 diabetes. Diabet. Med. 2008, 25, 245–254. [Google Scholar] [CrossRef] [PubMed]
  12. Liu, S.C.; Tu, Y.K.; Chien, M.N.; Chien, K.L. Effect of antidiabetic agents added to metformin on glycemic control, hypoglycemia and weight change in patients with type 2 diabetes: A network meta-analysis. Diabetes Obes. Metab. 2012, 14, 810–820. [Google Scholar] [CrossRef] [PubMed]
  13. Hermansen, K.; Mortensen, L.S. Bodyweight changes associated with antihyperglycemic agents in type 2 diabetes mellitus. Drug Saf. 2007, 30, 1127–1142. [Google Scholar] [CrossRef] [PubMed]
  14. Bonora, E. Antidiabetic medications in overweight/obese patients with type 2 diabetes: Drawbacks of current drugs and potential advantages of incretin-based treatment on body weight. Int. J. Clin. Pract. Suppl. 2007, 154, 19–28. [Google Scholar] [CrossRef] [PubMed]
  15. Scheen, A.J. Drug interactions of clinical importance with antihyperglycemic agents: An update. Drug Saf. 2005, 28, 601–631. [Google Scholar] [CrossRef] [PubMed]
  16. Metformin Hydrochloride U.S. FDA. Available online: http://www.fda.gov/ohrms/dockets/dailys/02/May02/053102/800471e6.pdf (accessed on 6 December 2016).
  17. Jadhav, S.B.; Mane, R.M.; Narayanan, K.L.; Bhosale, P.N. Analytical Enantio-Separation of Linagliptin in Linagliptin and Metformin HCl Dosage Forms by Applying Two-Level Factorial Design. Sci. Pharm. 2016, 84, 671–684. [Google Scholar] [CrossRef] [PubMed]
  18. Mitri, J.; Hamdy, O. Diabetes medications and body weight. Expert Opin. Drug Saf. 2009, 8, 573–584. [Google Scholar] [CrossRef] [PubMed]
  19. Glodek, M.; Liebowitz, S.; McCarthy, R.; McNally, G.; Oksanen, C.; Schultz, T.; Sundararajan, M.; Vorkapich, R.; Vukovinsky, K.; Watts, C.; et al. Process robustness—A PQRI White paper. Pharm. Eng. 2006, 26, 1–11. [Google Scholar]
  20. Jadhav, S.B.; Kumar, C.K.; Bandichhor, R.; Bhosale, P.N. Development of RP UPLC-TOF/MS, stability indicating method for omeprazole and its related substances by applying two level factorial design; and identification and synthesis of non-pharmacopoeial impurities. J. Pharm Biomed. Anal. 2016, 118, 370–379. [Google Scholar] [CrossRef] [PubMed]
  21. Metformin Hydrochloride. In Indian Pharmacopoeia; Government of India, Ministry of Health and Family Welfare: Ghaziabad, India, 2014; pp. 2186–2188.
  22. Metformin Hydrochloride. In British Pharmacopoeia; Medicines and Healthcare Products Regulatory Agency: London, UK, 2016; Volume 2, pp. 233–235.
  23. Metformin Hydrochloride. In European Pharmacopoeia, 9th ed.; European Pharmacopoeia Commission, Council of Europe European Directorate for the Quality of Medicines (EDQM): Strasbourg, France, 2016; pp. 4764–4766.
  24. Metformin Hydrochloride. In United States Pharmacopoeia, 39th ed.; United States Pharmacopeial Convention: Rockville, MD, USA, 2016; pp. 4764–4766, 5416–5419, 4119–4122, 8070–8074, 8092–8100.
  25. Huang, Y.; He, X.; Wu, T.; Zhang, F. Synthesis and Characterization of Process-Related Impurities of Antidiabetic Drug Linagliptin. Molecules 2016, 21, 1041. [Google Scholar] [CrossRef] [PubMed]
  26. Nandi, S.; Naresh, A.; Reddy, G.B.N.; Venkateswarlu, P.; Reddy, A.S.P.; Reddy, K.S.K. Process Related Impurities in Anti-Diabetic Drug Linagliptin. J. Pharm. Res. Opin. 2016, 5. [Google Scholar] [CrossRef]
Figure 1. (a) Half-normal plot; (b) Pareto chart; (c) cube; (d), (e), and (f) 3D plots showing effect of % of acetonitrile (ACN) in mobile phase-B and pH of buffer on resolution R1; (g) effect on resolution R1 due to interaction between buffer pH and % of ACN in mobile phase-B; and (h) desirability of resolution between Impurity-VII (7) and Impurity-I (1) R1.
Scipharm 85 00025 g001
Figure 2. (a) Half-normal plot; (b) Pareto chart; (c) cube; (d), (e), and (f) 3D plots showing effect of % of ACN in mobile phase-B and pH of buffer on resolution R2; (g) effect on resolution R2 due to interaction between buffer pH and % of ACN in mobile phase-B; and (h) desirability of resolution between Impurity-I (1) and linagliptin (LGP).
Scipharm 85 00025 g002
Figure 3. Overlay Plot with confidence interval (CI).
Scipharm 85 00025 g003
Scheme 1. Plausible degradation pathway for linagliptin (LGP) including molecular formula and molecular weight. MET HCl: Metformin HCl.
Scipharm 85 00025 sch001
Scheme 2. Plausible Reaction mechanism of (a) Impurity-IV (4), (b) Impurity-VIII (8), and (c) Impurity-IX (9).
Scipharm 85 00025 sch002
Scheme 3. Process-related impurities including molecular formula and molecular weight.
Scipharm 85 00025 sch003
Figure 4. Chromatogram of impurity mix solution including identified impurities i.e., Impurity-VII (7), Impurity-VIII (8), and Impurity-IX (9).
Scipharm 85 00025 g004
Table 1. ANOVA analysis for selected factorial model-used for prediction and diagnostic plots (Partial sum of squares-Type-III)
ResponseSourceSum of SquaresDegrees of FreedomMean SquareF Valuep-Value Prob > FModel StatusR2Adjusted R2Predicted R2
Impurity-VII (7) and Impurity-I (1)Model0.4130.1482.00<0.0001Significant0.92800.89710.8300
A-M.P.-B:ACN0.3210.32192.00<0.0001
B-Buffer pH0.04510.04527.000.0020
C-Flow Rate0.04510.04527.000.0020
Residual0.01060.00166
Lack of Fit0.01040.00250
Pure Error0.00020.000
Cor total 0.4410
Impurity-I (1) and LGPModel0.6240.16208.33<0.0001Significant0.95220.92040.8603
A-M.P.-B:ACN0.5510.55735.00<0.0001
B-Buffer pH0.03110.03141.670.0013
C-Flow Rate0.03110.03141.670.0013
Residual0.0037550.00075
Lack of Fit0.003730.00125
Pure Error0.00020.000
Cor total 0.6610
Cor Total: Totals Corrected for the mean; M.P.-BACN: Mobile Phase-B:Acetonitrile; LGP: Linagliptin.
Table 2. Purity Angle, Purity Threshold, %Degradation, Mass Balance, and Purity Flag obtained for each stress conditions
Nature of StressStress ConditionPurity AnglePurity Threshold%DegradationMass BalancePurity Flag
Acid10 mL-5N HCl- for 23 h on bench top0.1460.2670.111799.7No
Base10 mL-5N NaOH- for 25 h on bench top0.1920.3203.318996.2No
Peroxide20 mL 30% H2O2-2 hon bench top0.1370.3191.625995.8No
Water10 mL of water 5 days on bench top0.1440.262Nil99.7No
ThermalAt 105 °C for 6 h in an oven0.1450.2671.818696.3No
Photostabilty200 watt hours/square meter and 1.2 million lux hours 0.1430.2710.0528101.3No
Humidity90%RH at 25 °C for 7 days0.1400.2750.1550100.5No
RH: Relative Humidity.

