Quantification of 6-Mercaptopurine and Its Metabolites in Patients with Acute Lympoblastic Leukemia Using Dried Blood Spots and UPLC-MS/MS


Abstract
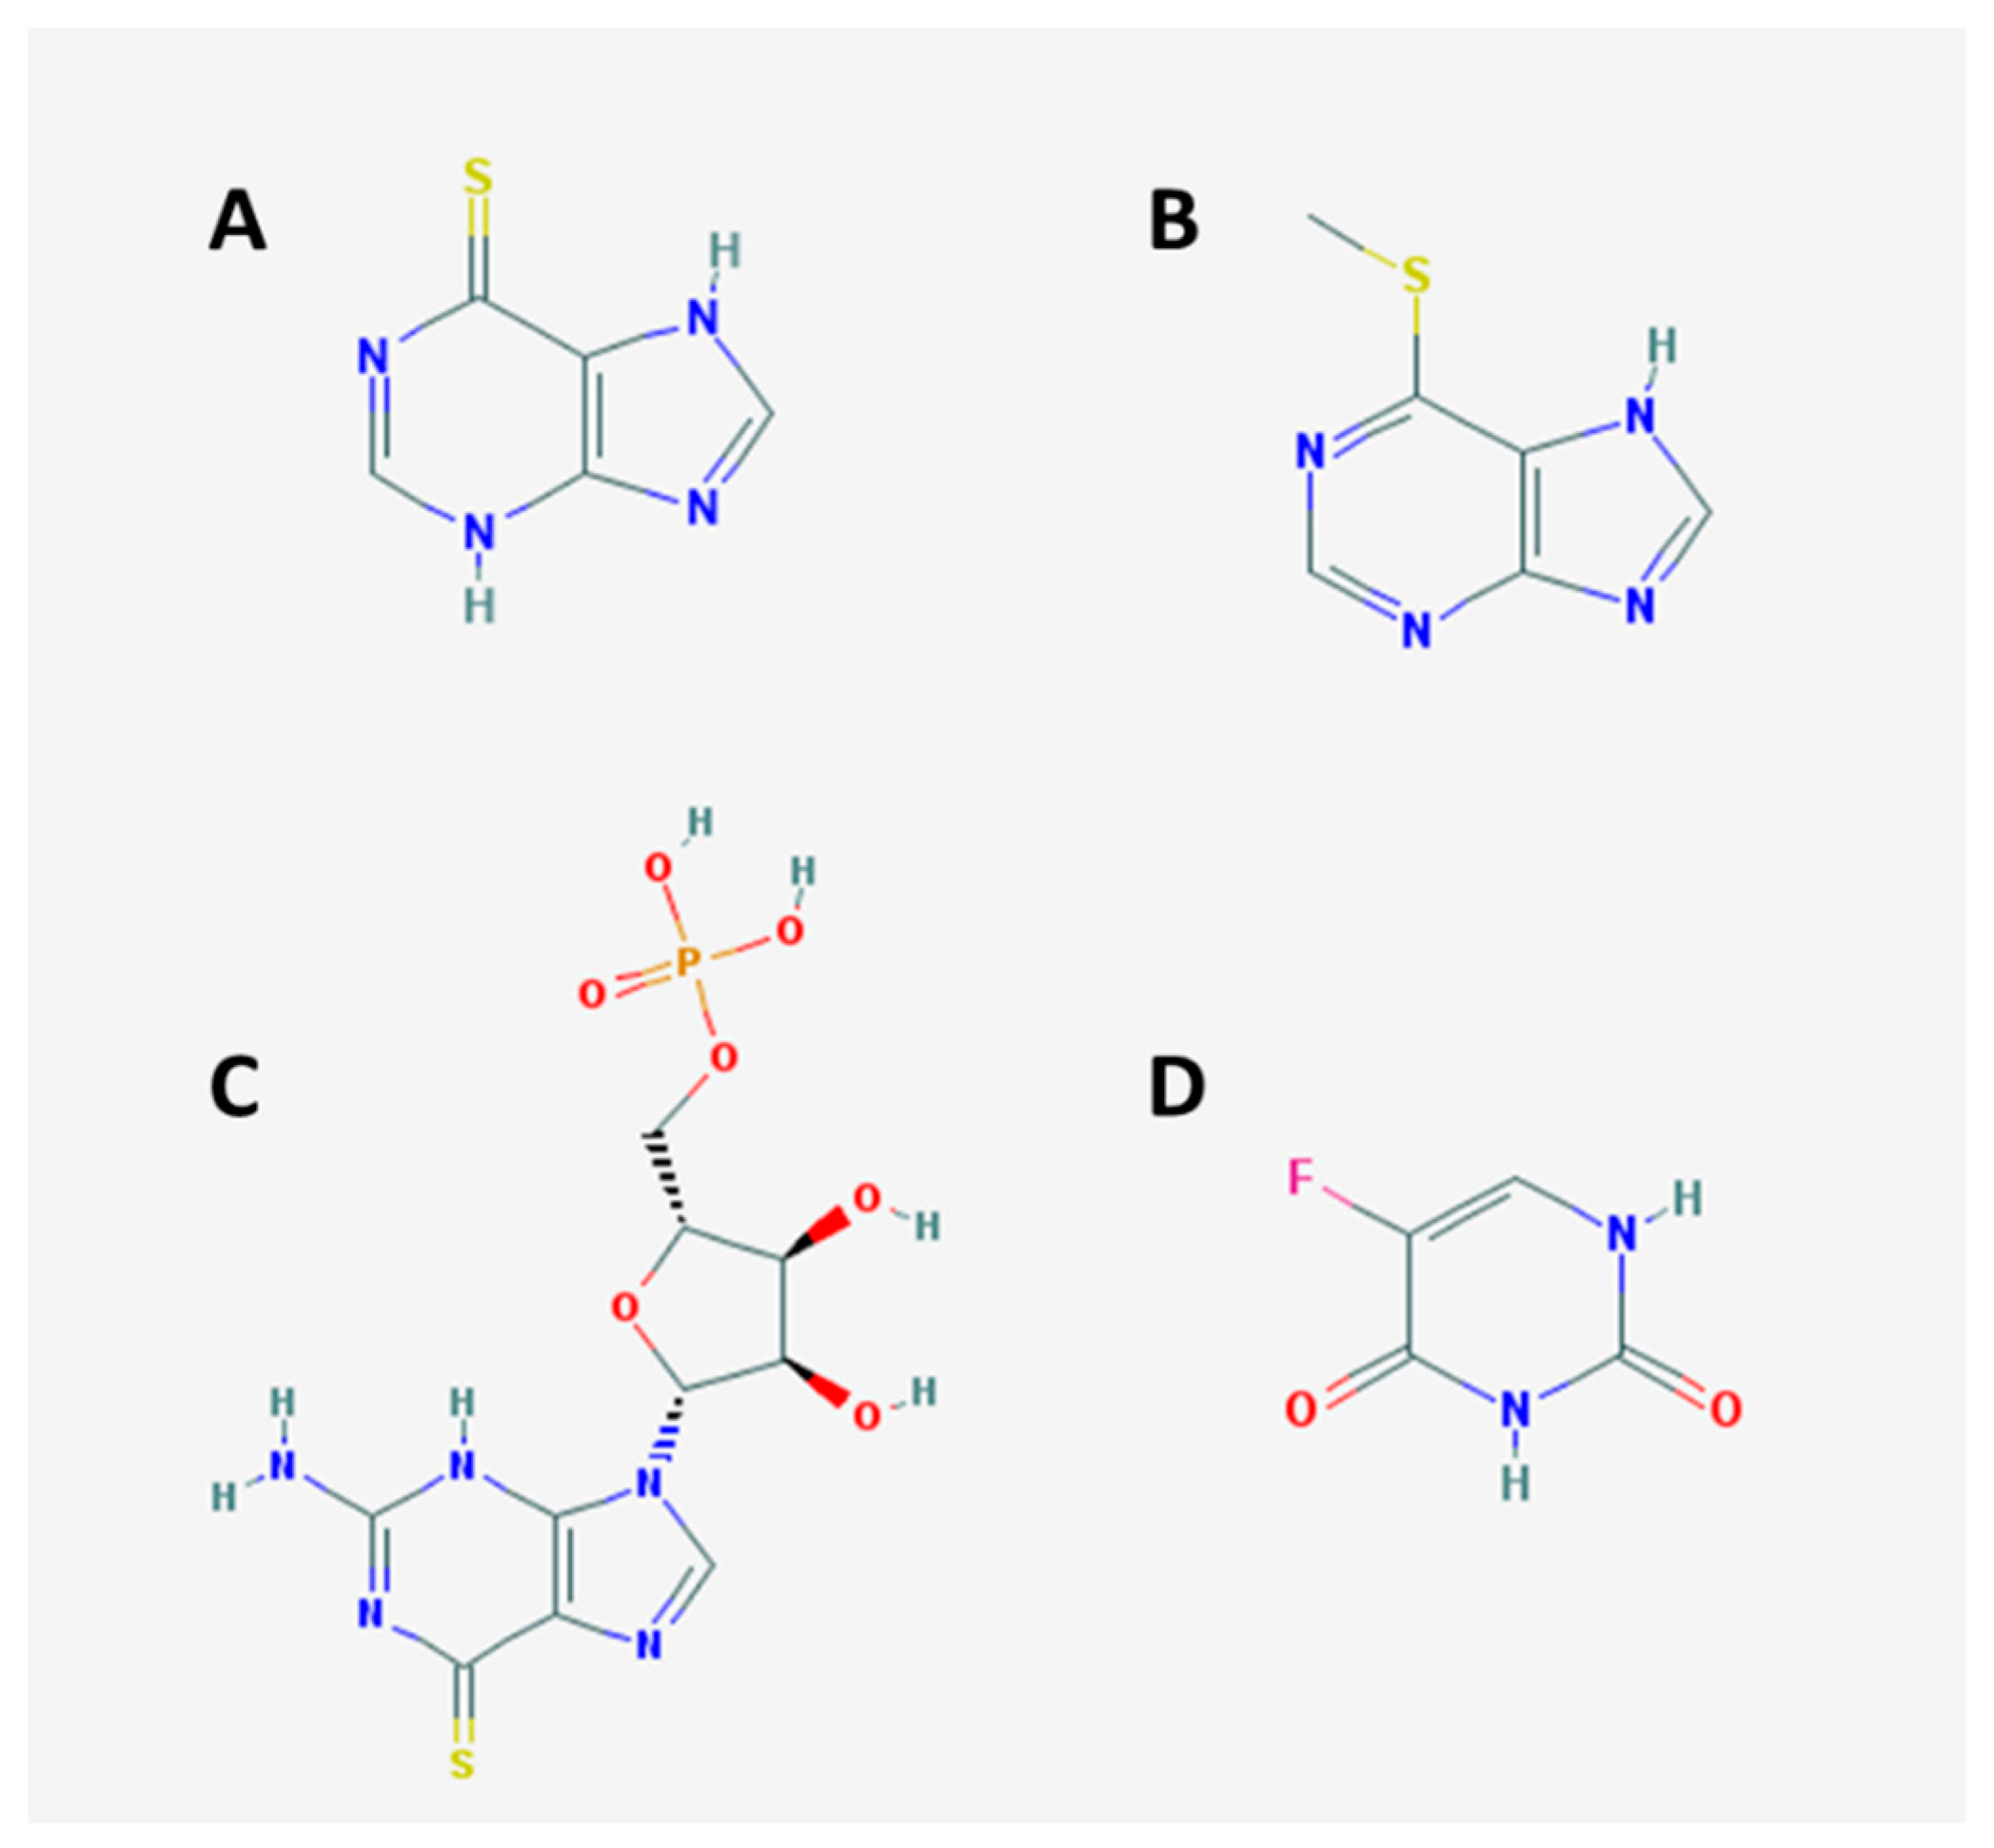
:1. Introduction
2. Materials and Methods
2.1. Reagents and Chemicals
2.2. Apparatus and Analytical Conditions
2.3. Method Validation in Dried Blood Spots
2.4. Application of the Method
- The ALL was in the maintenance phase;
- The patient received 6-MP as per a therapeutic protocol and in a steady state;
- The patient was 0–18 years old during blood collection; and
- The patient was without kidney or liver disorders.
2.5. Sample Preparation
3. Results and Discussion
3.1. Method Development and Optimization
3.2. Method Validation
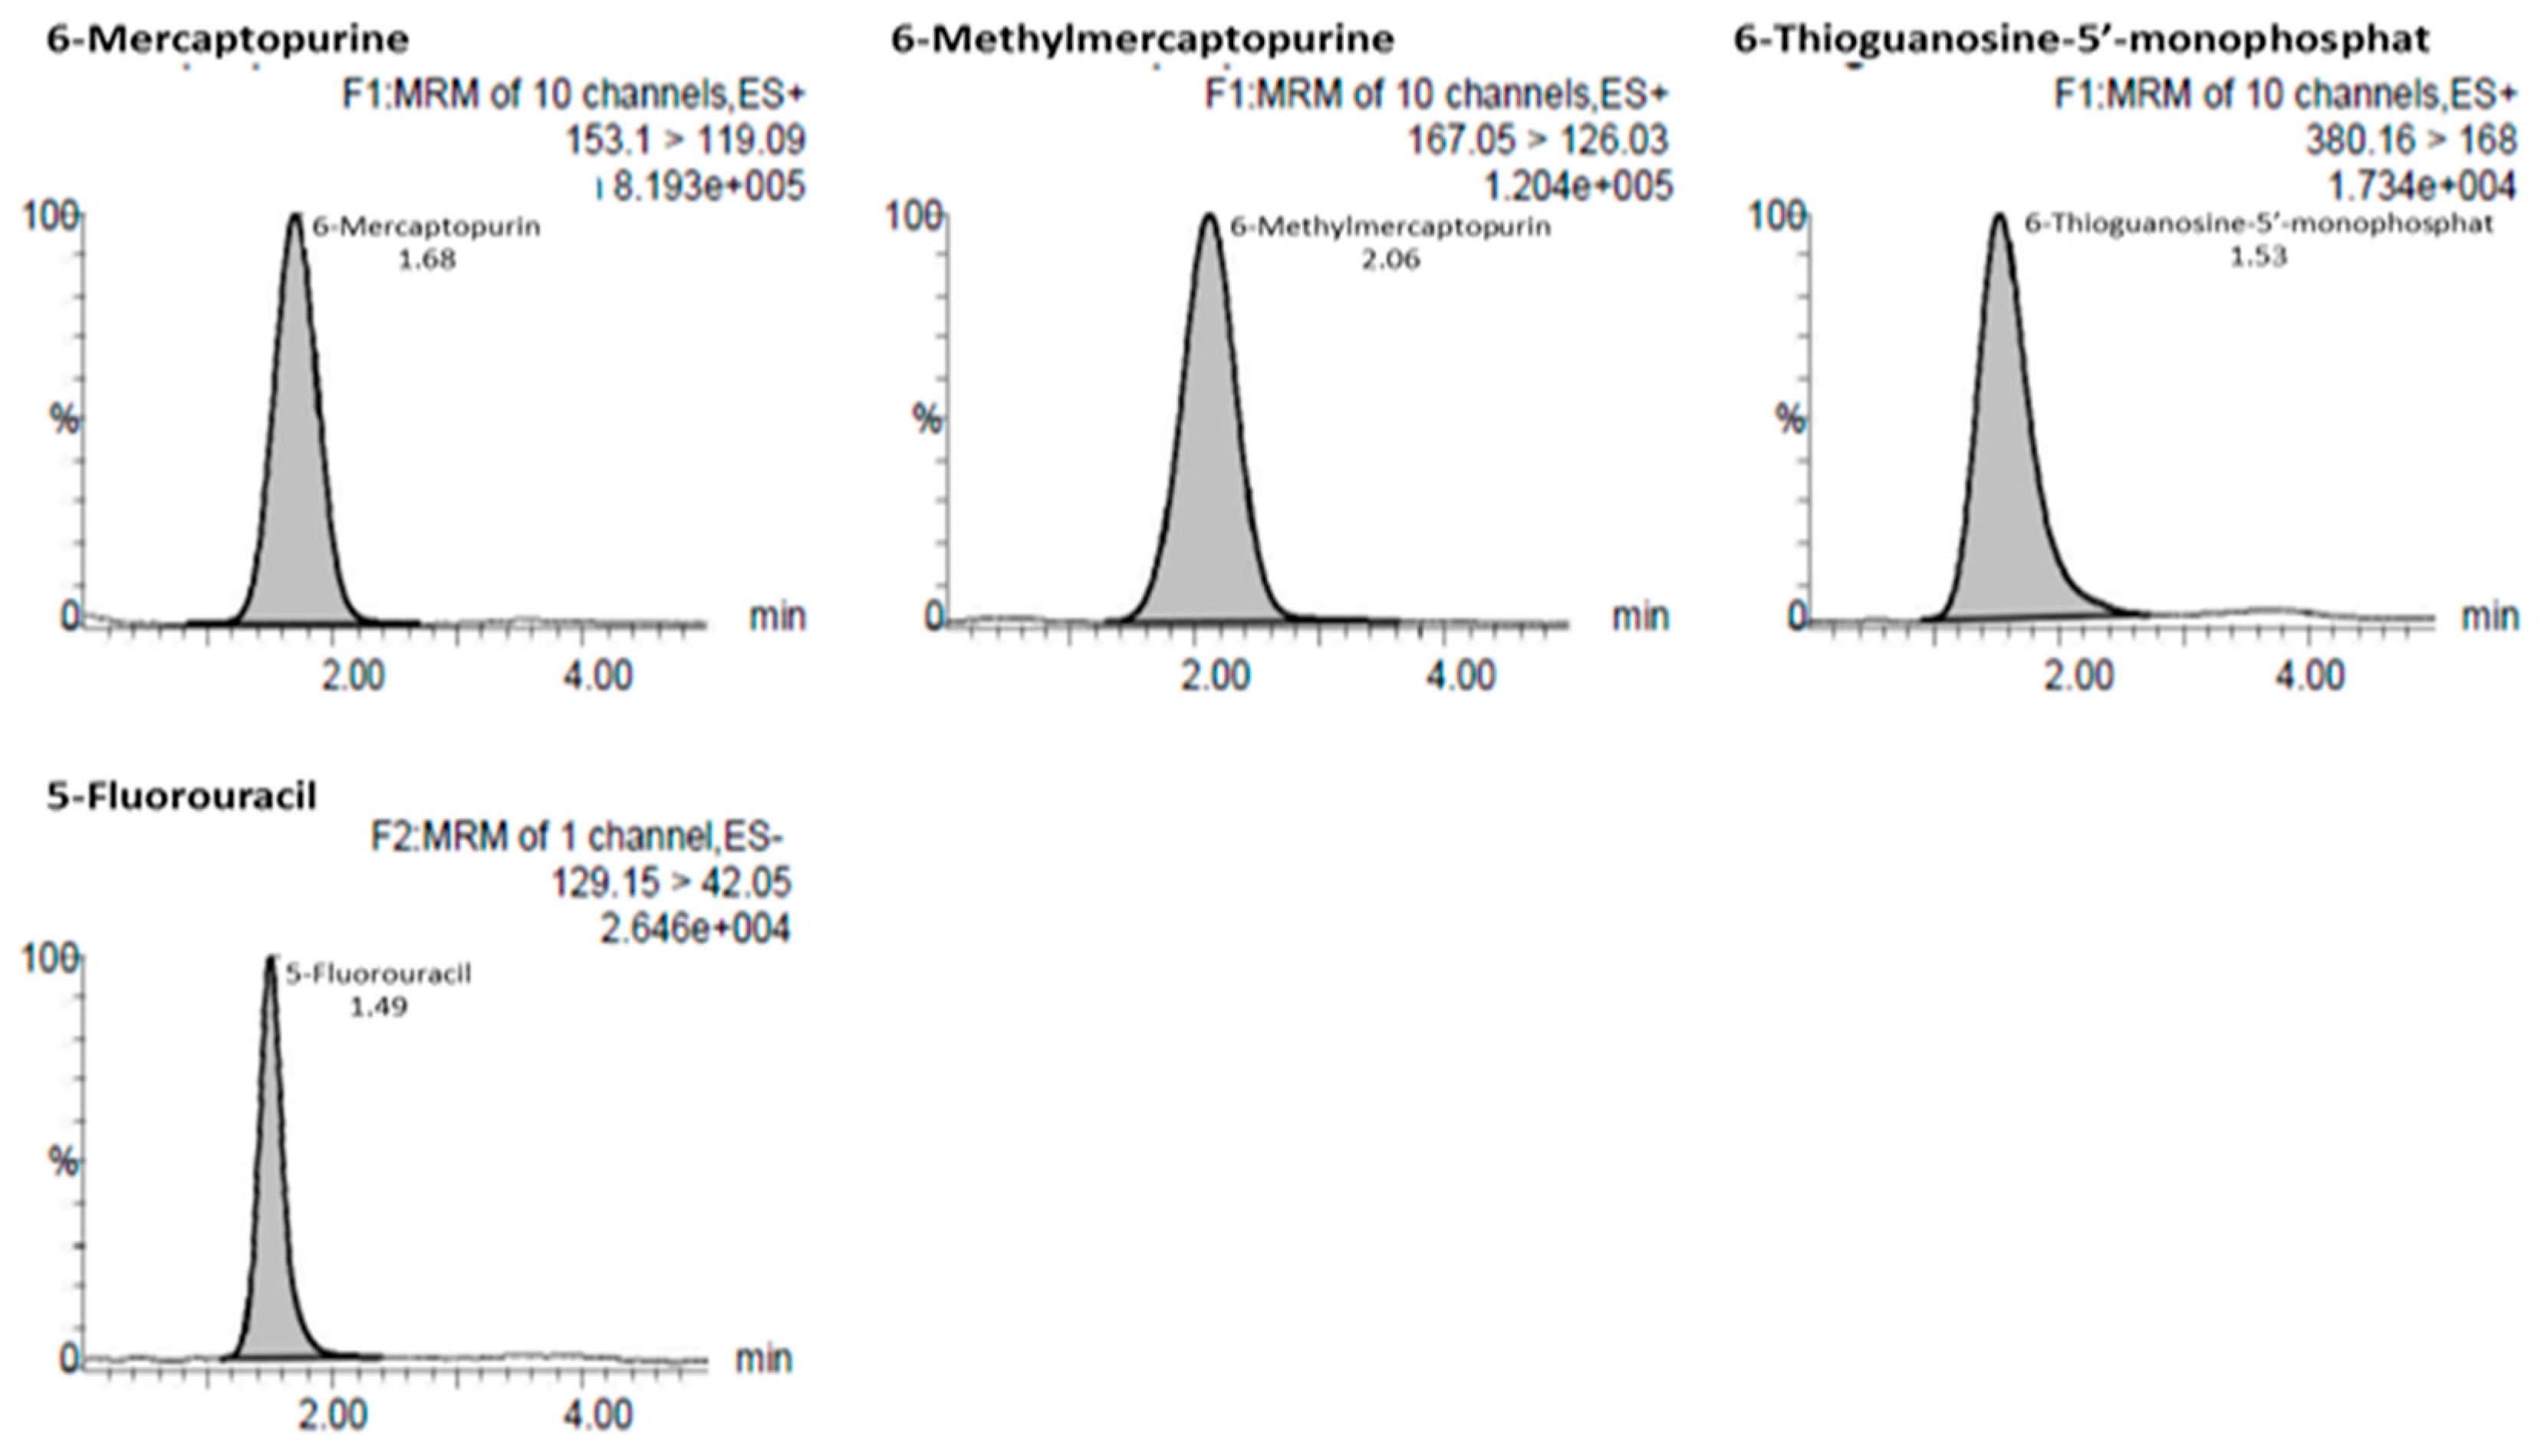
3.2.1. Selectivity
3.2.2. Linearity and the Lower Limit of Quantification
3.2.3. Accuracy and Precision
3.2.4. The Matrix Effect
3.2.5. Dilution Integrity
3.2.6. Stability
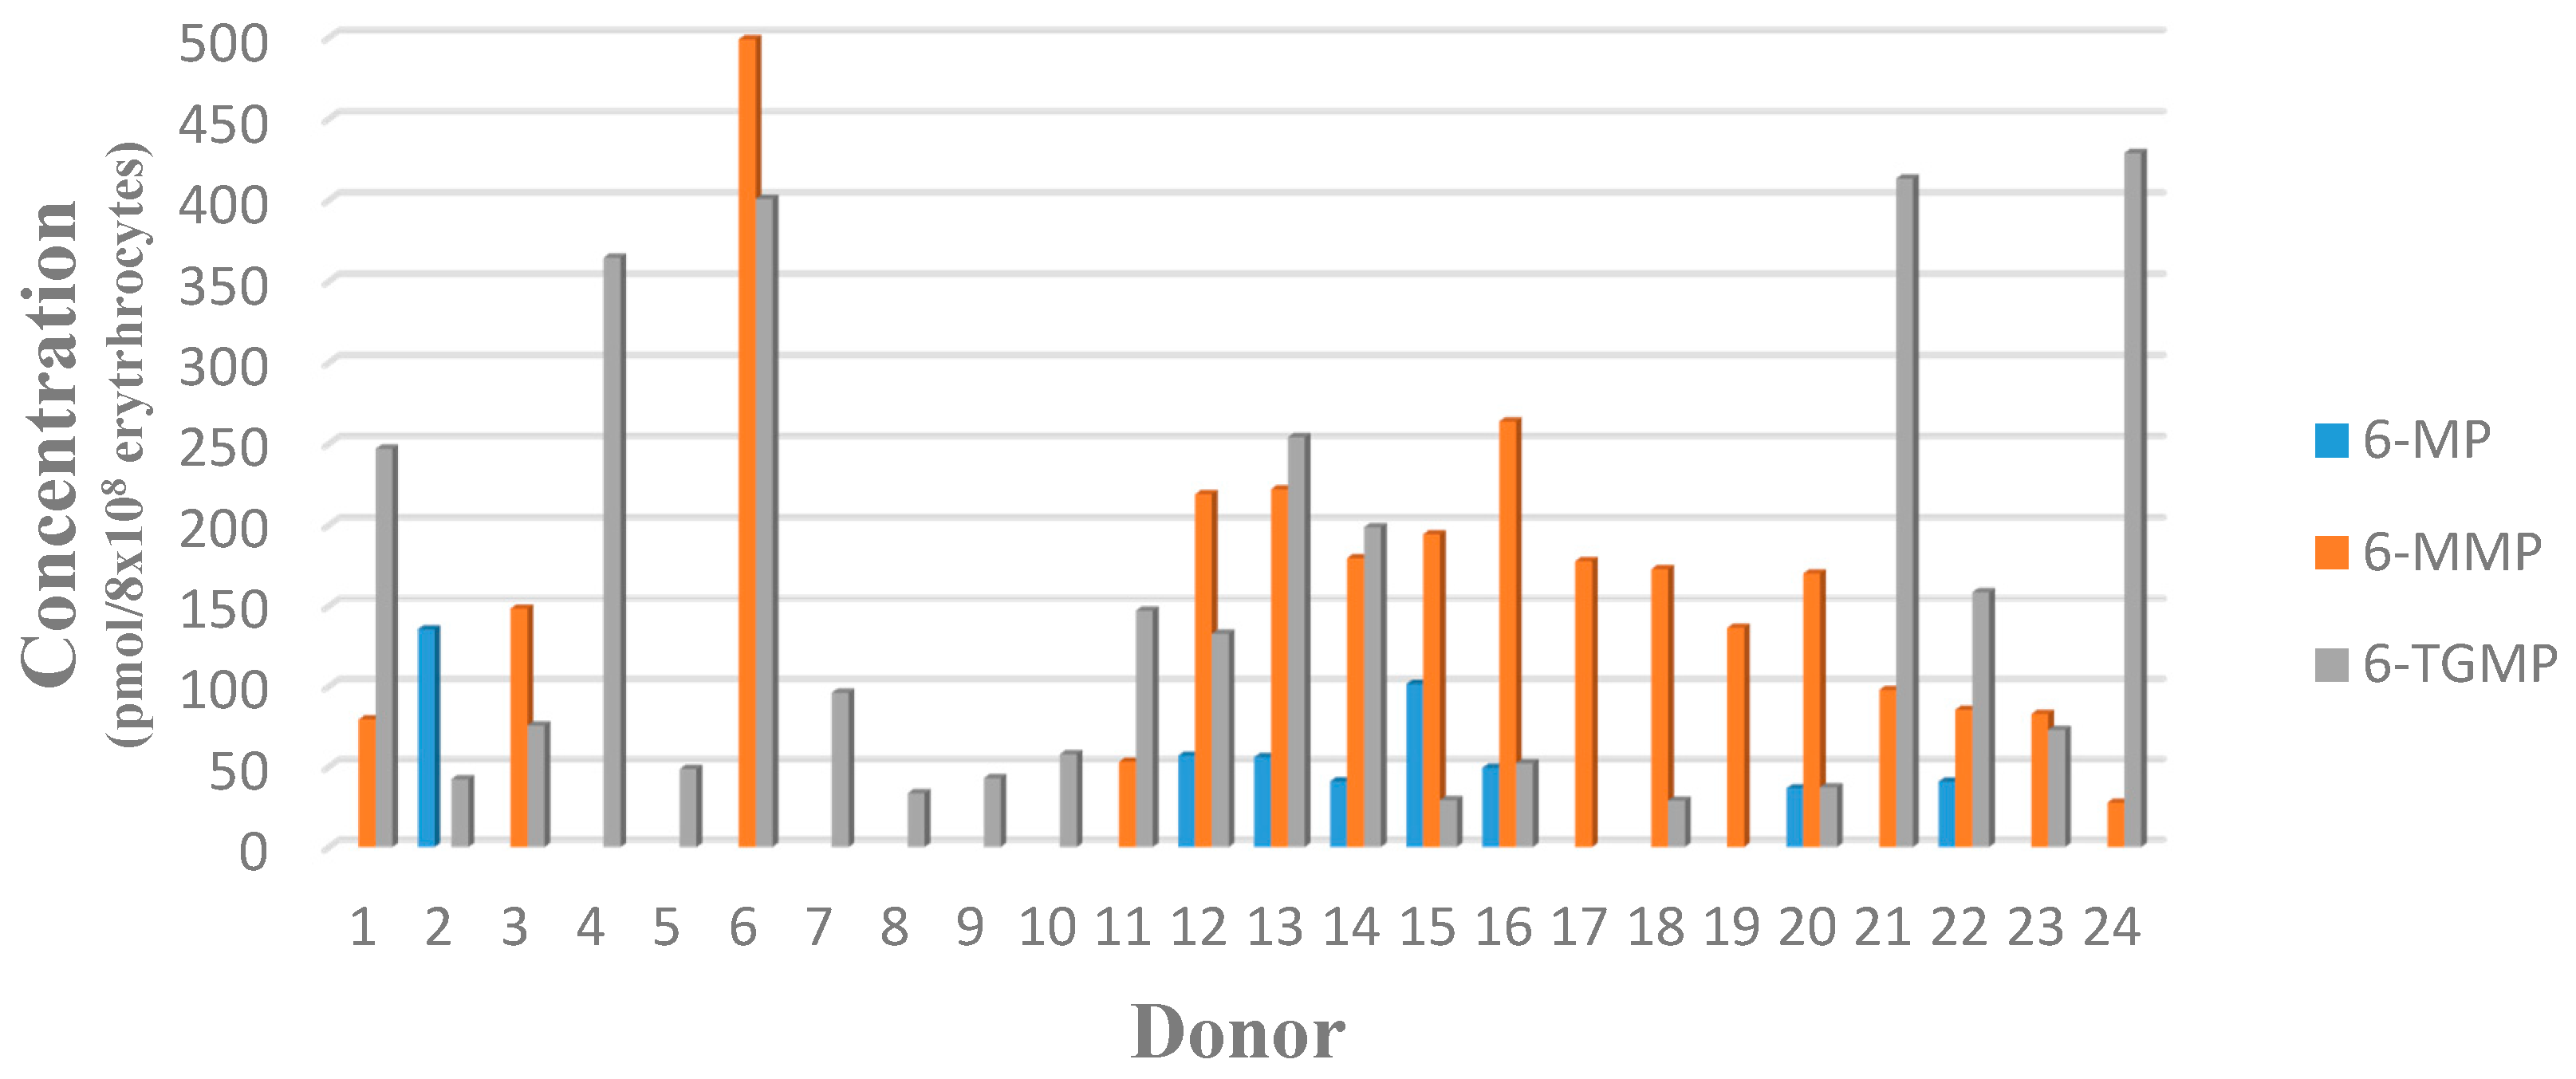
3.2.7. Analysis of Study Samples
4. Conclusions
Author Contributions
Acknowledgments
Conflicts of Interest
References
- Dipiro, J.T.; Talbert, R.L.; Yee, G.C.R.; Matzke, G.; Wells, B.G.; Michael, L.P. Pharmacotherapy a Pathophysiologic Approach, 7th ed.; The McGraw-Hill Companies: New York, NY, USA, 2008; pp. 19–20, 733–735. [Google Scholar]
- Hunger, S.P.; Mullighan, C.G. Acute lymphoblastic leukemia in children. N. Engl. J. Med. 2015, 375, 1541–1552. [Google Scholar] [CrossRef] [PubMed]
- De Nicolo, A.; Agnesod, D.; Simiele, M.; Rigan, D.; Adriani, A.; Canaparo, R.; D’Avolio, A. UPLC–MS/MS method for quantification of the azathioprine metabolites 6-mercaptoguanosine and 6-methyl mercaptopurine riboside in peripheral blood mononuclear cells. J. Pharm. Biomed. Anal. 2014, 98, 271–278. [Google Scholar] [CrossRef] [PubMed]
- Lennard, L. Implementation of TPMT testing. Br. J. Clin. Pharmacol. 2013, 77, 704–714. [Google Scholar] [CrossRef] [PubMed]
- Dervieux, T.; Meyer, G.; Barham, R.; Matsutani, M.; Barry, M.; Boulieu, R.; Seidmans, E. Liquid chromatography-tandem mass spectrometry analysis of erythrocyte thiopurine nucleotides and effect of thiopurine methyltransferase gene variants on these metabolites in patients receiving azathioprine/6-mercaptopurine therapy. Clin. Chem. 2005, 51, 2074–2084. [Google Scholar] [CrossRef] [PubMed]
- Al-Ghobashy, M.A.; Hassan, S.A.; Abdelaziz, D.H.; Elhosseiny, N.M.; Sabry, N.A.; Attia, A.S.; El-Sayed, M.H. Development and validation of LCMS/MS assay for the simultaneous determination of methotrexate, 6-mercaptopurine and its active metabolite 6-thioguanine in plasma of children with acute lymphoblastic leukemia: Correlation with genetic polymorphism. J. Chromatogr. B 2016, 1038, 88–94. [Google Scholar] [CrossRef] [PubMed]
- Wilhelm, A.J.; den-Burger, J.C.G.; Swart, E.L. Therapeutic Drug Monitoring by Dried Blood Spot: Progress to Date and Future Directions. Clin. Pharmacokinet. 2014, 53, 961–973. [Google Scholar] [CrossRef] [PubMed]
- Kirchherr, H.; Shipkova, M.; Von-ahsen, N. Improved method for therapeutic drug monitoring of 6-thioguanine nucleotides and 6-methylmercaptopurine in whole-blood by LC/MSMS using isotope-labeled internal standards. Ther. Drug Monit. 2013, 35, 313–321. [Google Scholar] [CrossRef] [PubMed]
- Weber, J.; Stefanie, O.; Andrea, B.; Klaus, T.; Rainer, L.; Georg, H. Validation of a dried blood spot method for therapeutic drug monitoring of citalopram, mirtazapine and risperidone and its active metabolite 9-hydroxyrisperidone using HPLC-MS. J. Pharm. Biomed. Anal. 2017, 140, 347–354. [Google Scholar] [CrossRef] [PubMed]
- Déglon, J.; Thomas, A.; Mangin, P.; Staub, C. Direct analysis of dried blood spots coupled with mass spectrometry: Concepts and biomedical applications. Anal. Bioanal. Chem. 2012, 402, 2485–2498. [Google Scholar] [CrossRef] [PubMed]
- Chambers, A.; Percy, A.; Yang, J.; Camenzind, A.; Borchers, C. Multiplexed quantitation of endogenous proteins in dried blood spots by multiple reaction monitoring-mass spectrometry. Mol. Cell. Proteom. 2013, 12, 781–791. [Google Scholar] [CrossRef] [PubMed]
- Hempen, C.M.; Koster, E.H.M.; Ooms, J.A. Hematocrit-independent recovery of immunosuppressants from DBS using heated flow-through desorption. Bioanalysis 2015, 7, 2019–2029. [Google Scholar] [CrossRef] [PubMed]
- Supandi, S.; Harahap, Y.; Harmita, H.; Andalusia, R.; Ika, M. Analysis of 6-mercaptopurine and 6-methylmercaptopurine in dried blood spots using liquid chromatography-tandem mass spectrometry and its application in childhood acute lymphoblastic leukemia patients. Asian J. Pharm. Clin. Res. 2017, 10, 120–125. [Google Scholar] [CrossRef]
- Supandi, S.; Harahap, Y.; Harmita, H.; Andalusia, R.; Ika, M.; Azizah, N. Simultaneous analytical method of 6-mercaptopurine and 6-methylmercaptopurine in vitro study with bio-sampling venipuncture and dried blood spot. J. Glob. Pharma Technol. 2017, 9, 77–84. [Google Scholar]
- European Medicines Agency (EMEA). Committee for Medicinal Products for Human Use (CHMP): Guideline on Bioanalytical Method Validation; European Medicines Agency: London, UK, 2011. [Google Scholar]
- Supandi, S.; Harahap, Y.; Harmita, H.; Andalusia, R. Simultaneous analysis of 6-mercaptopurine, 6-methylmercaptopurine, and 6-thioguanosine-5′-monophosphate in dried blood spot using ultra performance liquid chromatography tandem mass spectrometry. Indones. J. Chem. 2018, in press. [Google Scholar]
- Matuszewski, B.K.; Constanzer, M.L.; Chavez-Eng, C.M. Strategies for the assessment of matrix effect in quantitative bioanalytical methods based on HPLC-MS/MS. Anal. Chem. 2003, 203, 3019–3030. [Google Scholar] [CrossRef]
- Erb, N.; Haverland, U.; Harms, D.O.; Eccherich, G.; Janka-Schaub, G. High-performance liquid chromatography assay of metabolites of thioguanine and mercaptopurine in capillary blood. J. Chromatogr. B 2003, 796, 87–94. [Google Scholar] [CrossRef]
- Bhatia, S.; Landier, W.; Hageman, L.; Chen, Y.; Kim, H.; Sun, C.L.; Kornegay, N.; Evans, W.E.; Angiolillo, A.L.; Bostrom, B.; et al. Systemic exposure to thiopurines and risk of relapse in children with acute lymphoblastic leukemia: A children’s oncology group study. JAMA Oncol. 2015, 1, 287–295. [Google Scholar] [CrossRef] [PubMed]
- Beaumais, T.A.; Fakhoury, M.; Medard, Y.; Azougagh, S.; Zhang, D.; Yakouben, K.; Jacqz-Aigrain, E. Determinants of mercaptopurine toxicity in paediatric acute lymphoblastic leukemia maintenance therapy. Br. J. Clin. Pharmacol. 2010, 71, 575–584. [Google Scholar] [CrossRef] [PubMed]
- Stork, L.C.; Matloub, Y.; Broxson, E.; La, M.; Yanofsky, R.; Sather, H.; Gaynon, P.S. Oral 6-mercaptopurine versus oral 6-thioguanine and veno-occlusive disease in children with standard-risk acute lymphoblastic leukemia: Report of the Children’s Oncology Group CCG-1952 clinical trial. Blood 2010, 115, 2740–2748. [Google Scholar] [CrossRef] [PubMed]


| Donor | Mean Measured Concentration ± SD (n = 2) | |||||
|---|---|---|---|---|---|---|
| ng/mL | Pmol/8 × 108 Erythrocytes | |||||
| 6-MP | 6-MMP | 6-TGMP | 6-MP | 6-MMP | 6-TGMP | |
| SN01 | N/A | 56.5 ± 3.87 | 401.19 ± 19.53 | N/A | 79.38 | 246.89 |
| SN02 | 100.27 ± 14.81 | N/A | 78.59 ± 1.31 | 135.57 | N/A | 42.42 |
| SN03 | N/A | N/A | 148.45 ± 6.72 | N/A | N/A | 75.72 |
| SN04 | N/A | 315.09 ± 3.49 | 668.32 ± 9.19 | N/A | 392.38 | 364.52 |
| SN05 | N/A | N/A | 87.34 ± 3.87 | N/A | N/A | 48.51 |
| SN06 | N/A | 465.85 ± 9.14 | 854.01 ± 8.24 | N/A | 498.90 | 400.58 |
| SN07 | N/A | N/A | 182.02 ± 12.94 | N/A | N/A | 96.05 |
| SN08 | N/A | N/A | 182.02 ± 0.72 | N/A | N/A | 96.05 |
| SN09 | N/A | N/A | 92.20 ± 5.52 | N/A | N/A | 42.86 |
| SN10 | N/A | N/A | 112.58 ± 5.53 | N/A | N/A | 57.82 |
| SN11 | N/A | 50.52 ± 3.00 | 319.88 ± 15.89 | N/A | 53.04 | 147.11 |
| SN12 | 37.86 ± 0.59 | 158.98 ± 0.26 | 219.99 ± 17.15 | 56.93 | 218.90 | 132.67 |
| SN13 | 38.23 ± 0.74 | 164.96 ± 5.40 | 431.25 ± 12.99 | 56.35 | 222.69 | 254.98 |
| SN14 | 33.13 ± 14.99 | 158.75 ± 12.62 | 400.73 ± 19.02 | 40.93 | 179.59 | 198.56 |
| SN15 | 92.11 ± 14.98 | 192.73 ± 4.31 | 66.19 ± 13.23 | 101.42 | 194.32 | 29.23 |
| SN16 | 37.18 ± 1.50 | 217.26 ± 14.41 | 107.39 ± 0.53 | 49.28 | 263.73 | 57.09 |
| SN17 | N/A | 157.15 ± 2.24 | N/A | N/A | 177.78 | N/A |
| SN18 | N/A | 133.92 ± 8.89 | 51.13 ± 3.32 | N/A | 172.75 | 28.86 |
| SN19 | N/A | 129.91 ± 0.43 | N/A | N/A | 136.39 | N/A |
| SN20 | 30.30 ± 7.88 | 153.94 ± 9.50 | 76.83 ± 8.60 | 36.57 | 170.16 | 37.19 |
| SN21 | N/A | 83.97 ± 1.27 | 810.37 ± 13.16 | N/A | 97.74 | 413.17 |
| SN22 | 30.94 ± 5.49 | 70.91 ± 2.40 | 300.27 ± 10.15 | 40.71 | 85.43 | 158.45 |
| SN23 | N/A | 64.23 ± 0.26 | 129.14 ± 11.45 | N/A | 82.76 | 72.88 |
| SN24 | N/A | 24.06 ± 5.91 | 853.36 ± 17.40 | N/A | 27.61 | 428.88 |
© 2018 by the authors. Licensee MDPI, Basel, Switzerland. This article is an open access article distributed under the terms and conditions of the Creative Commons Attribution (CC BY) license (http://creativecommons.org/licenses/by/4.0/).
Share and Cite
Supandi, S.; Harahap, Y.; Harmita, H.; Andalusia, R. Quantification of 6-Mercaptopurine and Its Metabolites in Patients with Acute Lympoblastic Leukemia Using Dried Blood Spots and UPLC-MS/MS. Sci. Pharm. 2018, 86, 18. https://doi.org/10.3390/scipharm86020018
Supandi S, Harahap Y, Harmita H, Andalusia R. Quantification of 6-Mercaptopurine and Its Metabolites in Patients with Acute Lympoblastic Leukemia Using Dried Blood Spots and UPLC-MS/MS. Scientia Pharmaceutica. 2018; 86(2):18. https://doi.org/10.3390/scipharm86020018
Chicago/Turabian StyleSupandi, Supandi, Yahdiana Harahap, Harmita Harmita, and Rizka Andalusia. 2018. "Quantification of 6-Mercaptopurine and Its Metabolites in Patients with Acute Lympoblastic Leukemia Using Dried Blood Spots and UPLC-MS/MS" Scientia Pharmaceutica 86, no. 2: 18. https://doi.org/10.3390/scipharm86020018