Medicinal Plants: A Public Resource for Metabolomics and Hypothesis Development

Abstract
:1. Introduction
2. Results and Discussion

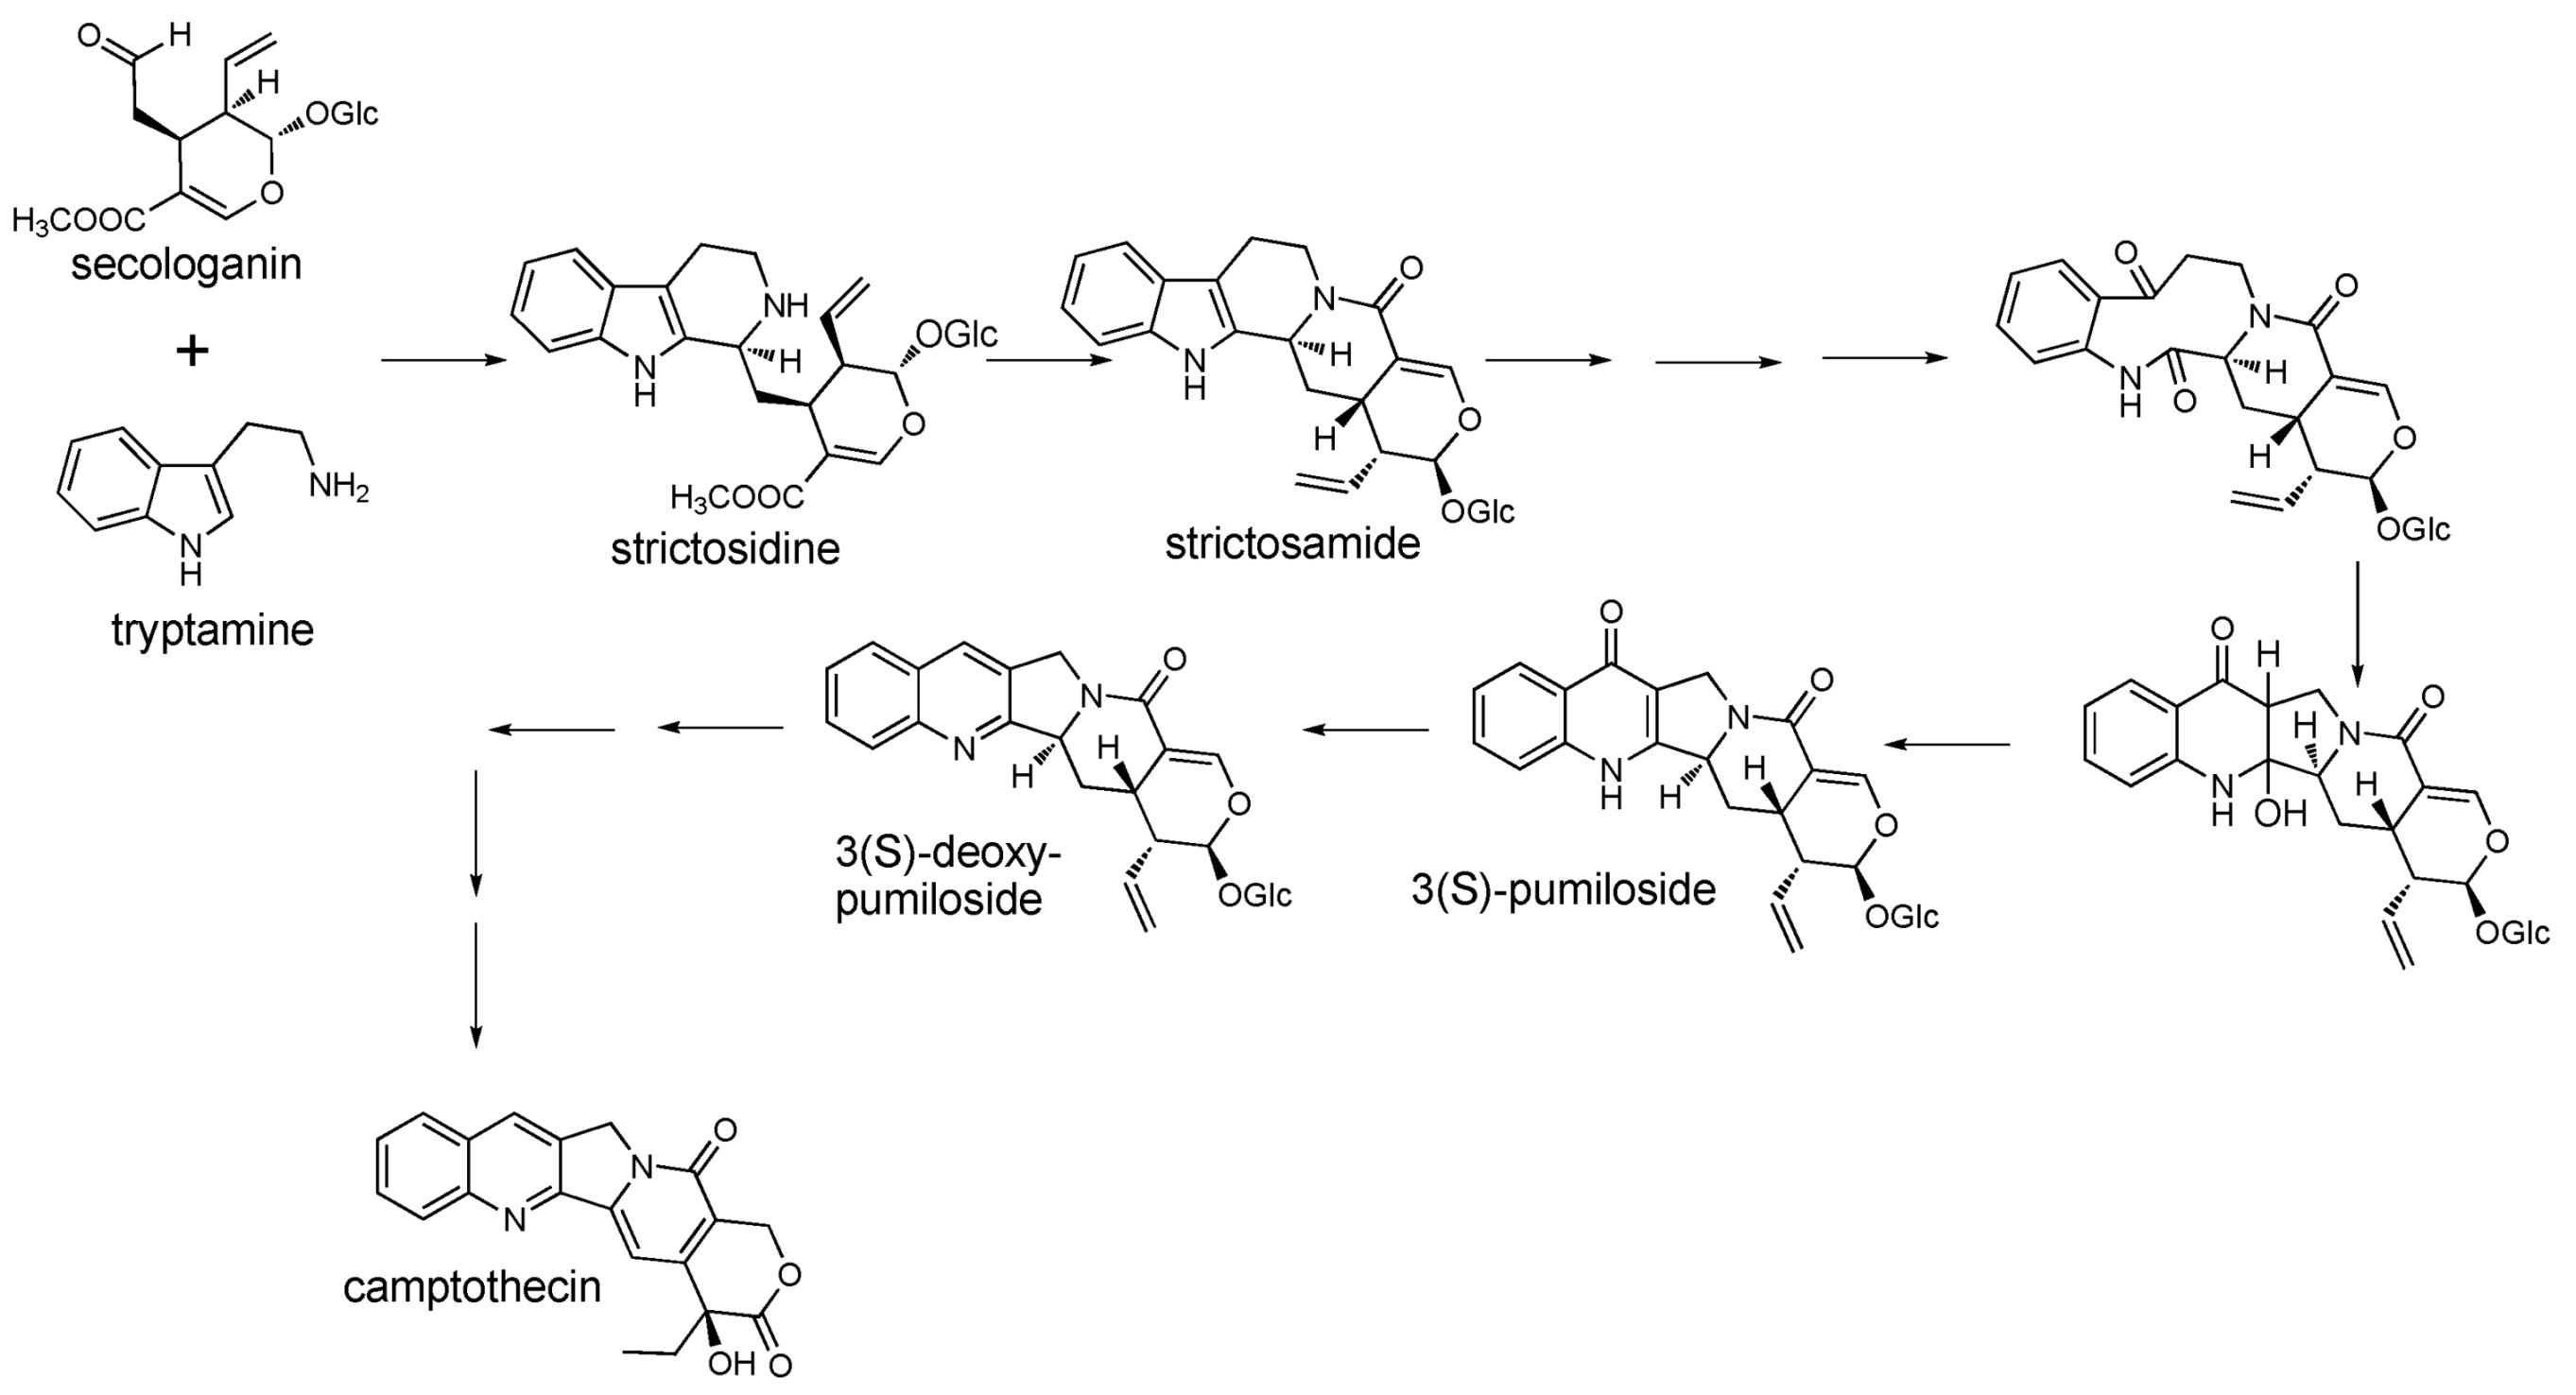
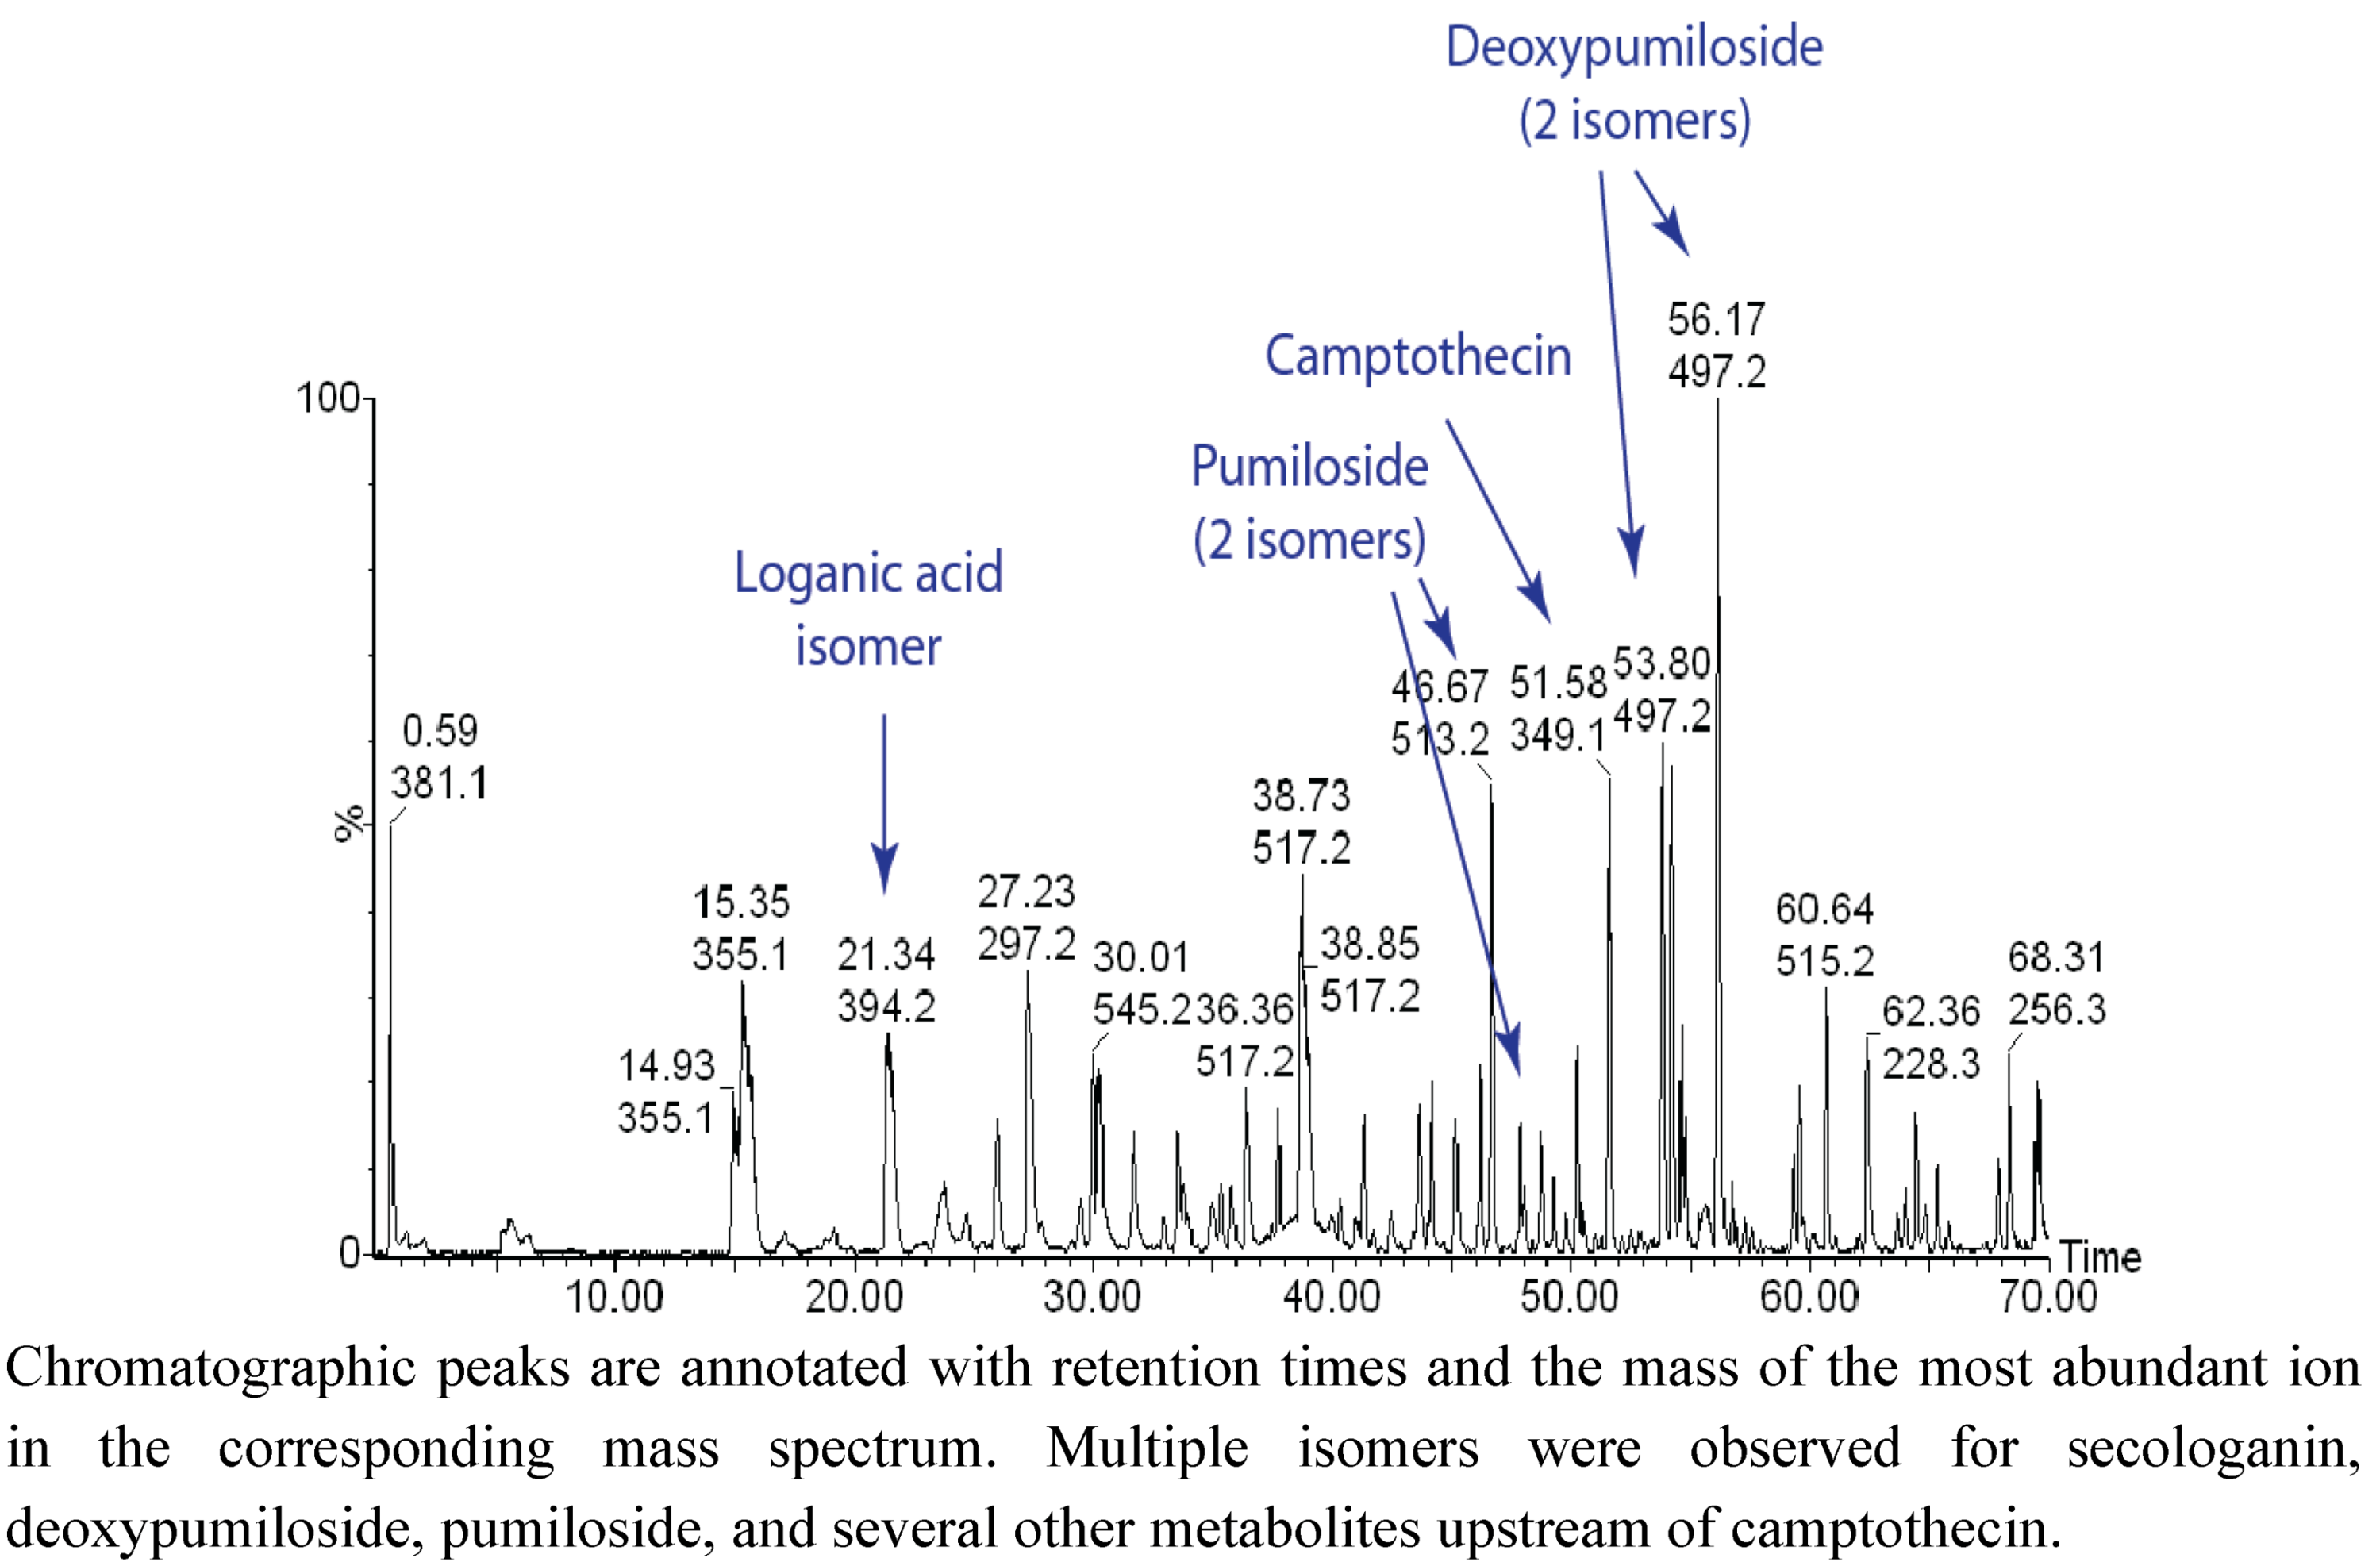
2.1. Case Study: Deep Metabolic Profiling of Camptotheca acuminata as an Approach for Development of Hypotheses about the Camptothecin Biosynthesis Network

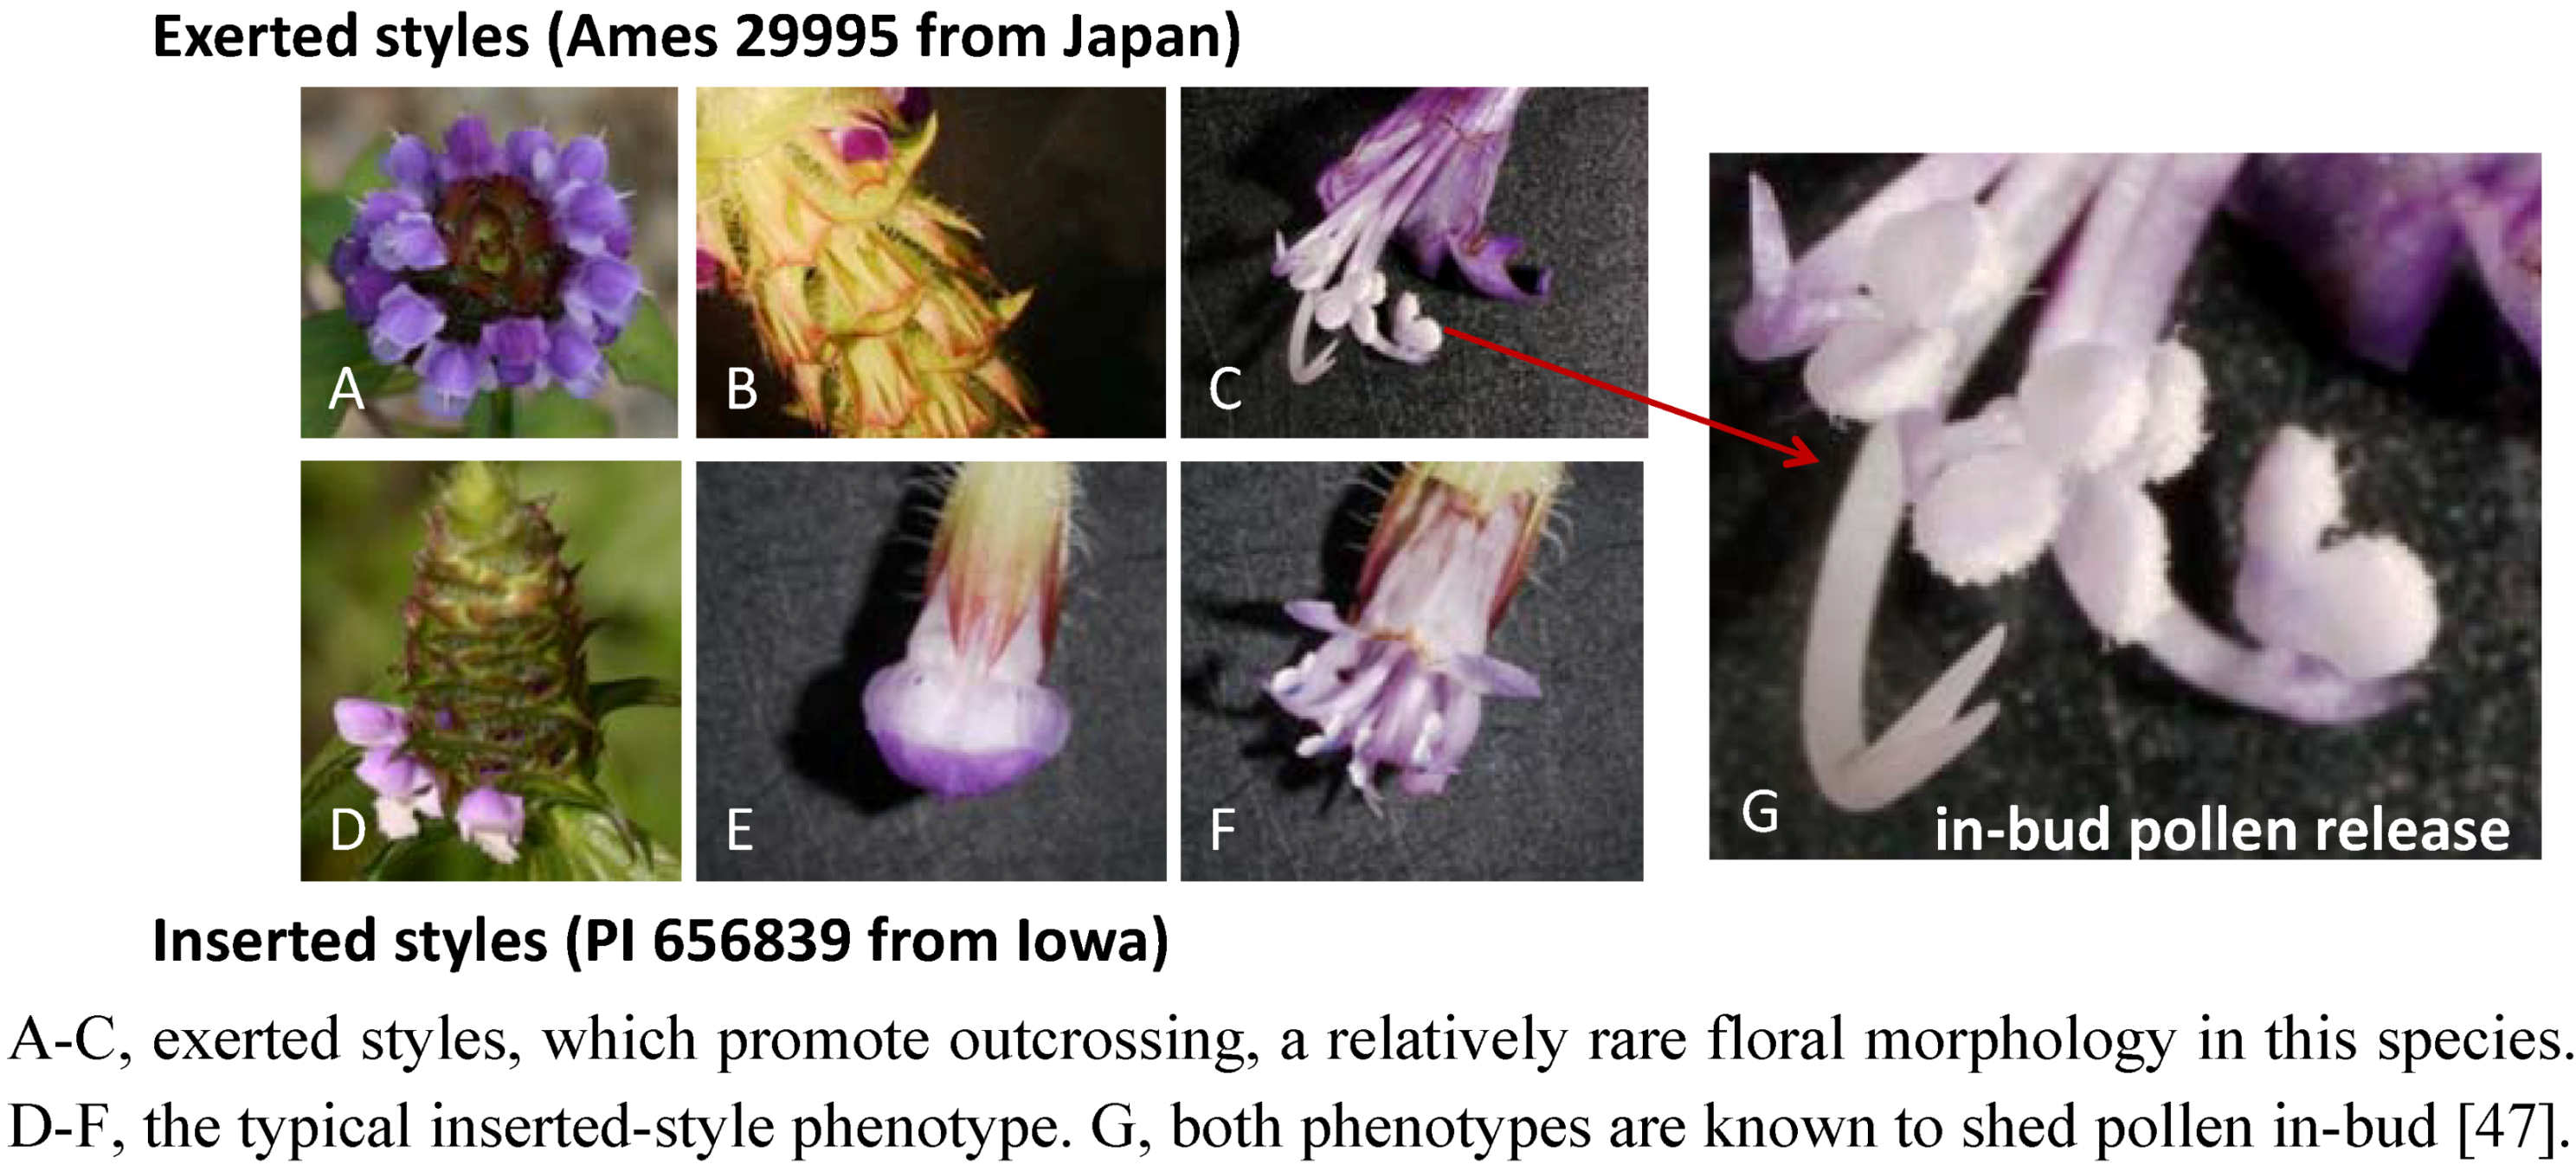
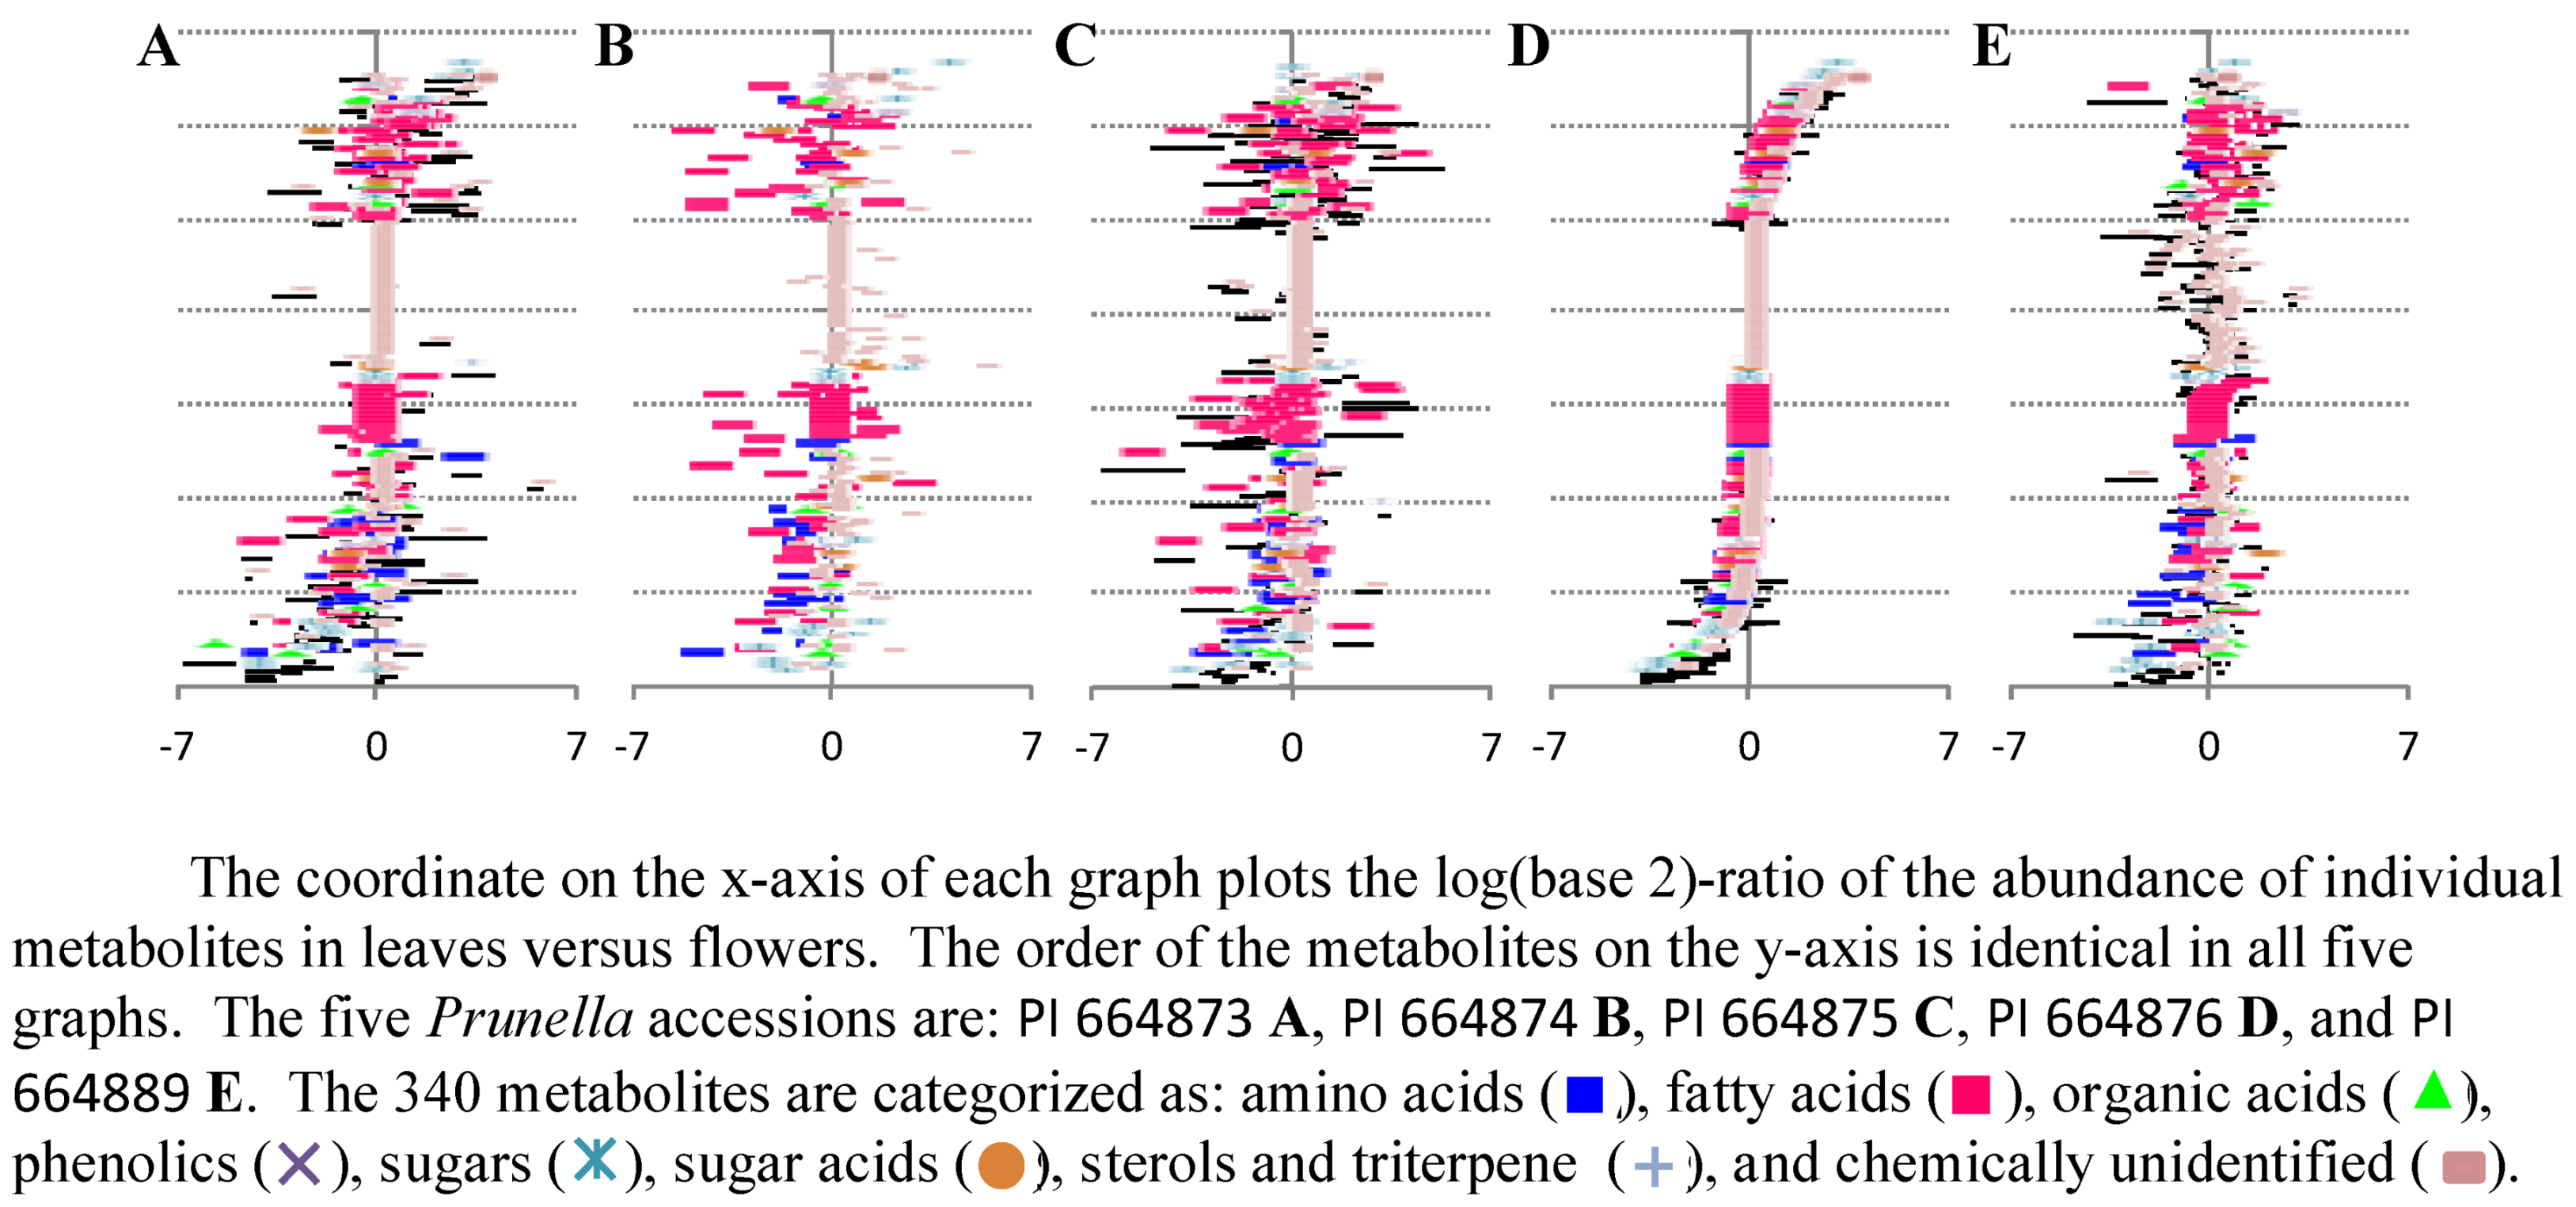
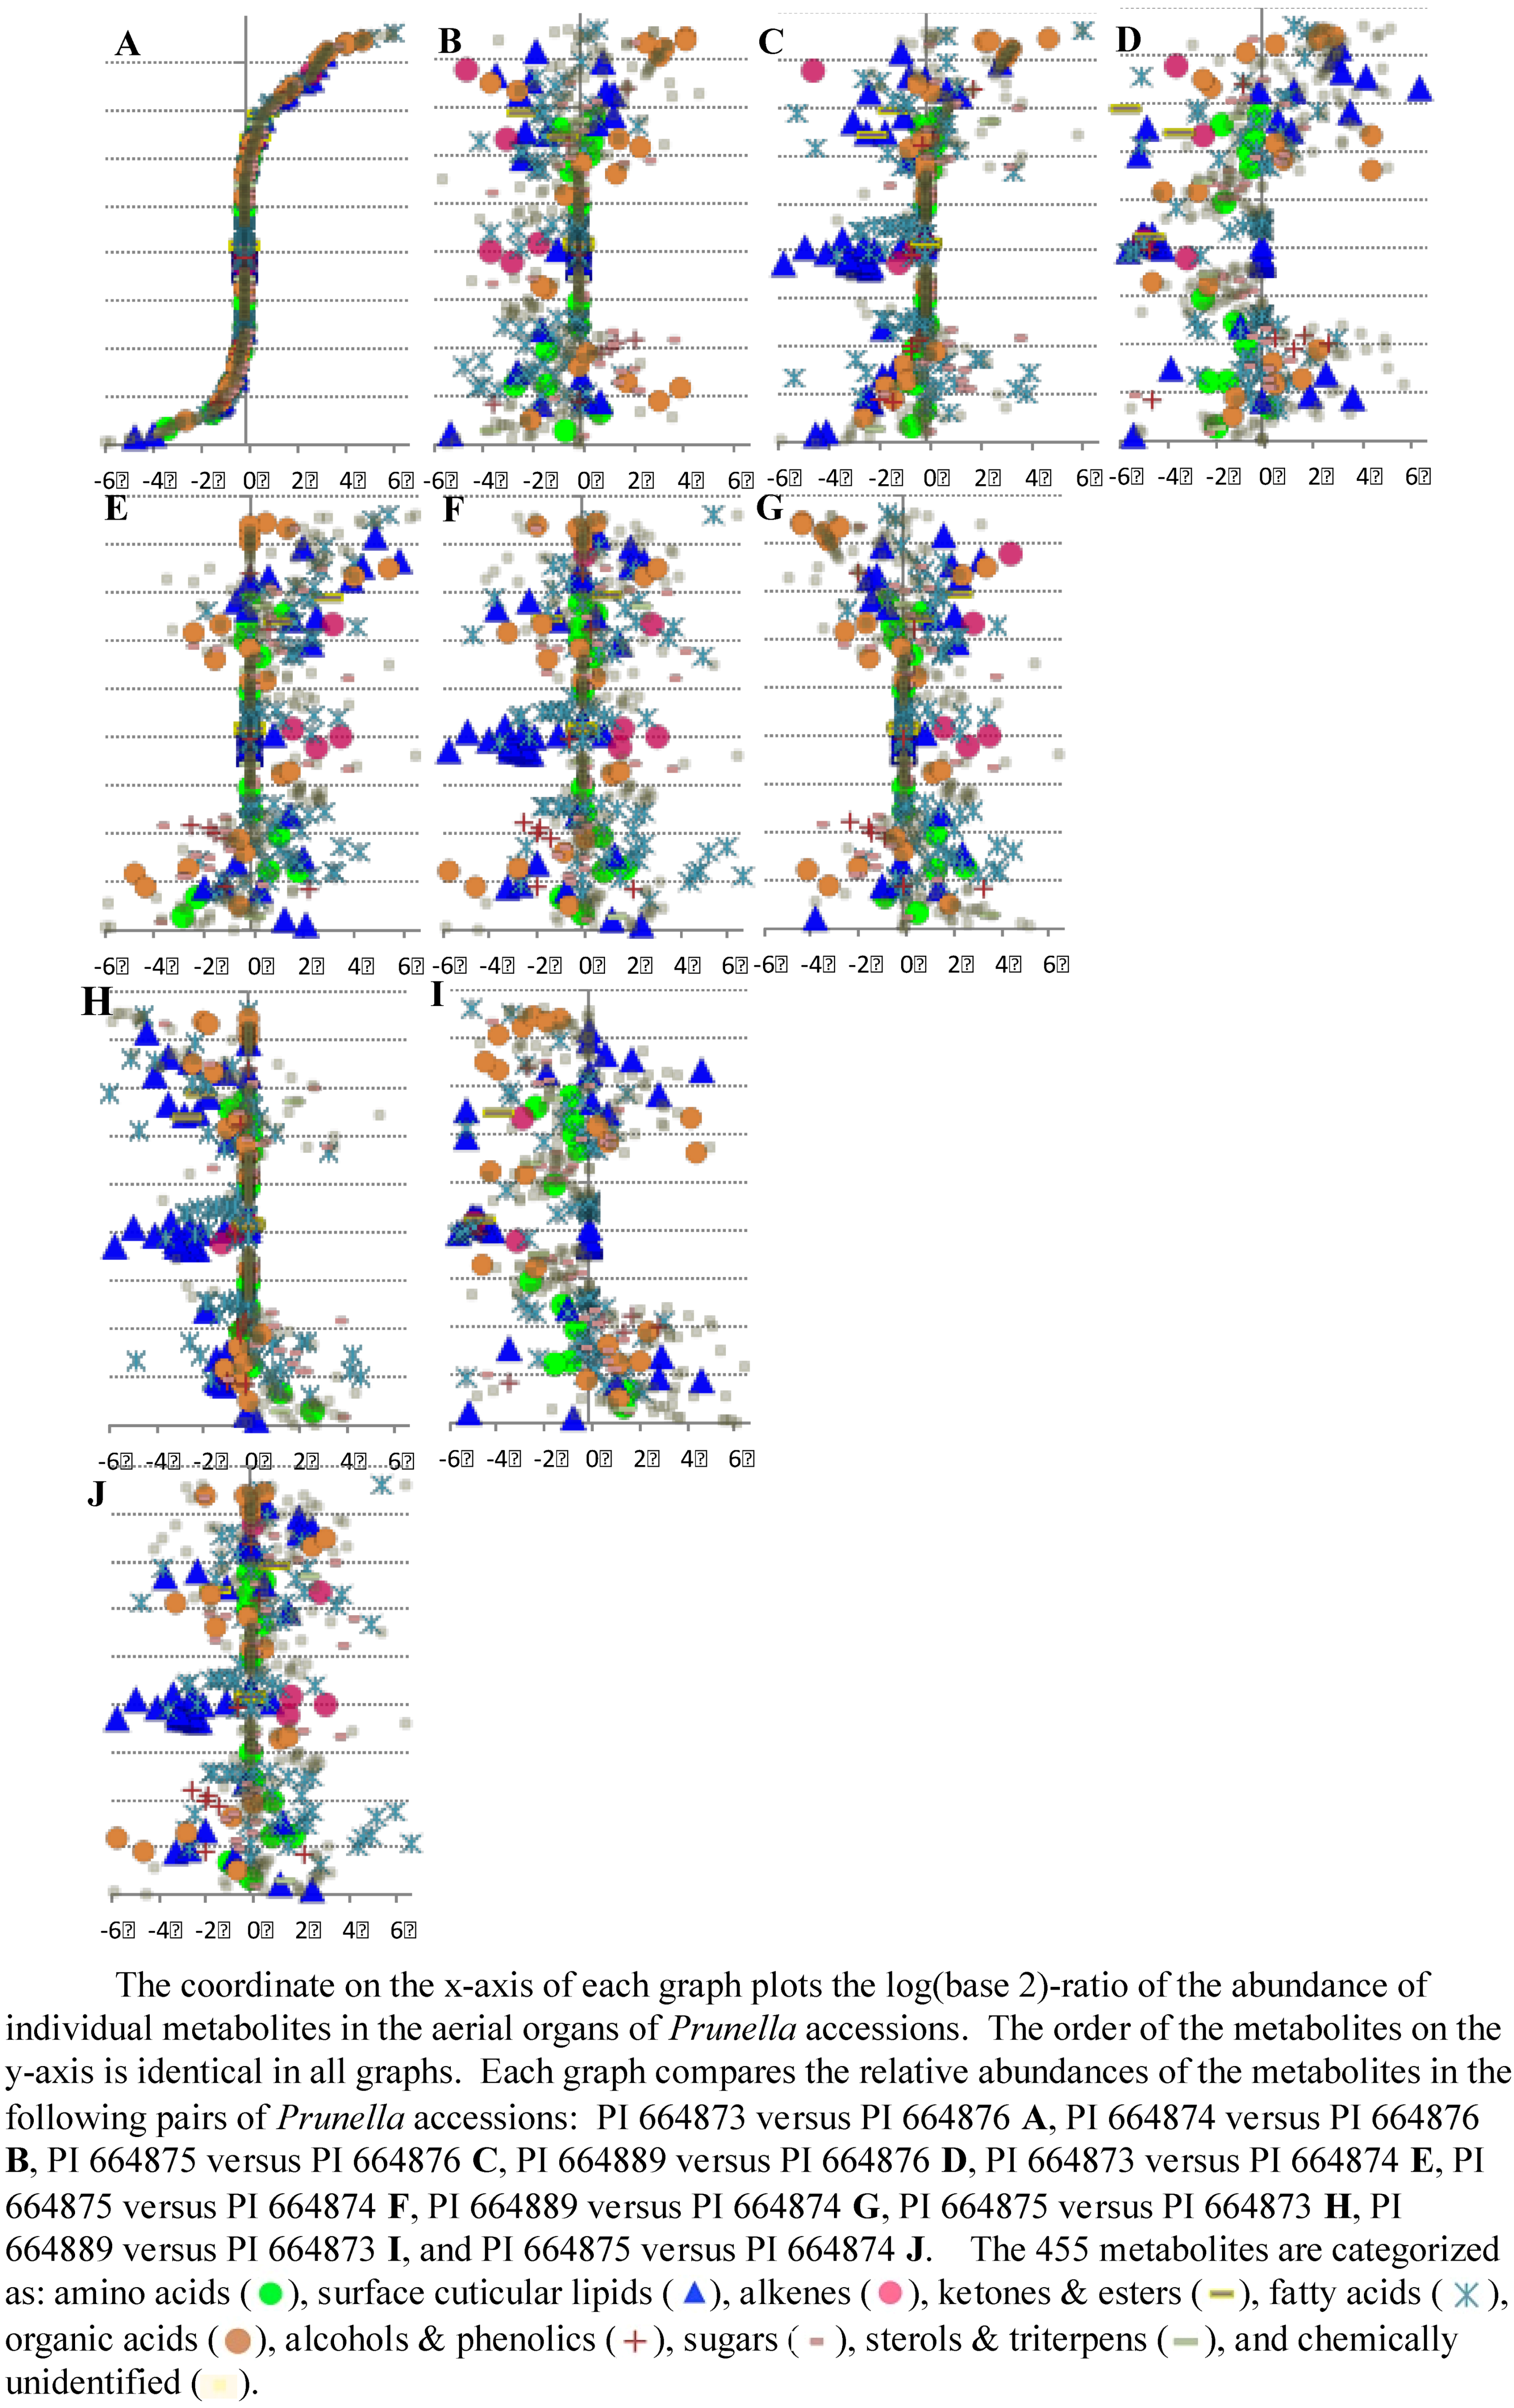
2.2. Case Study 2: Using Metabolite Levels across Accessions and Organs of Prunella vulgaris to Investigate Intraspecific Diversity

| ACNO | Place of collection | Records |
|---|---|---|
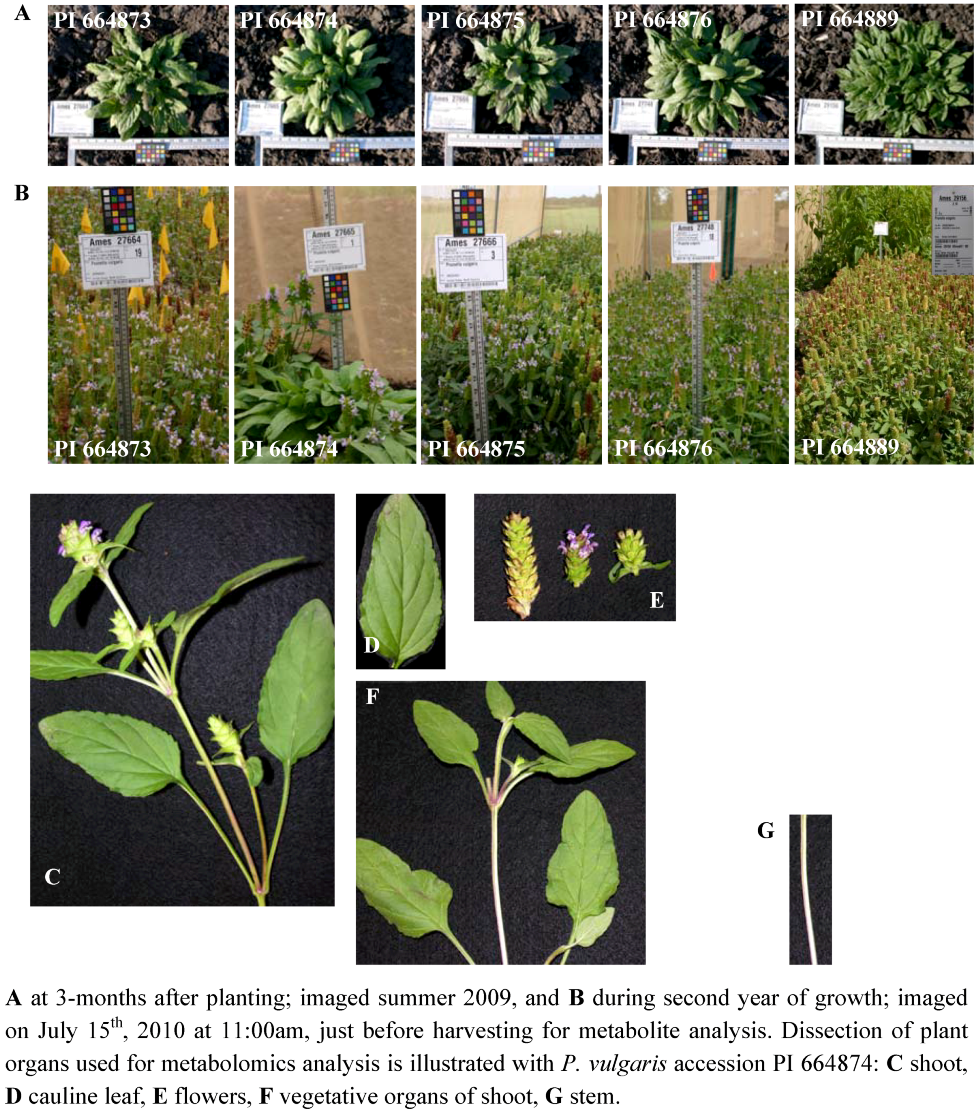
| PI 664873 (Ames 27664) | North Carolina, United States | 11/19/2004 |
| PI 664874 (Ames 27665) | North Carolina, United States | 11/19/2004 |
| PI 664875 (Ames 27666) | North Carolina, United States | 11/19/2004 |
| PI 664876 (Ames 27748) | Missouri, United States | 12/29/2004 |
| PI 664889 (Ames 29156) | South Ossetia, Georgia | 06/16/2008 |

2.2.1. Platforms Used in the Detection of Prunella Metabolites
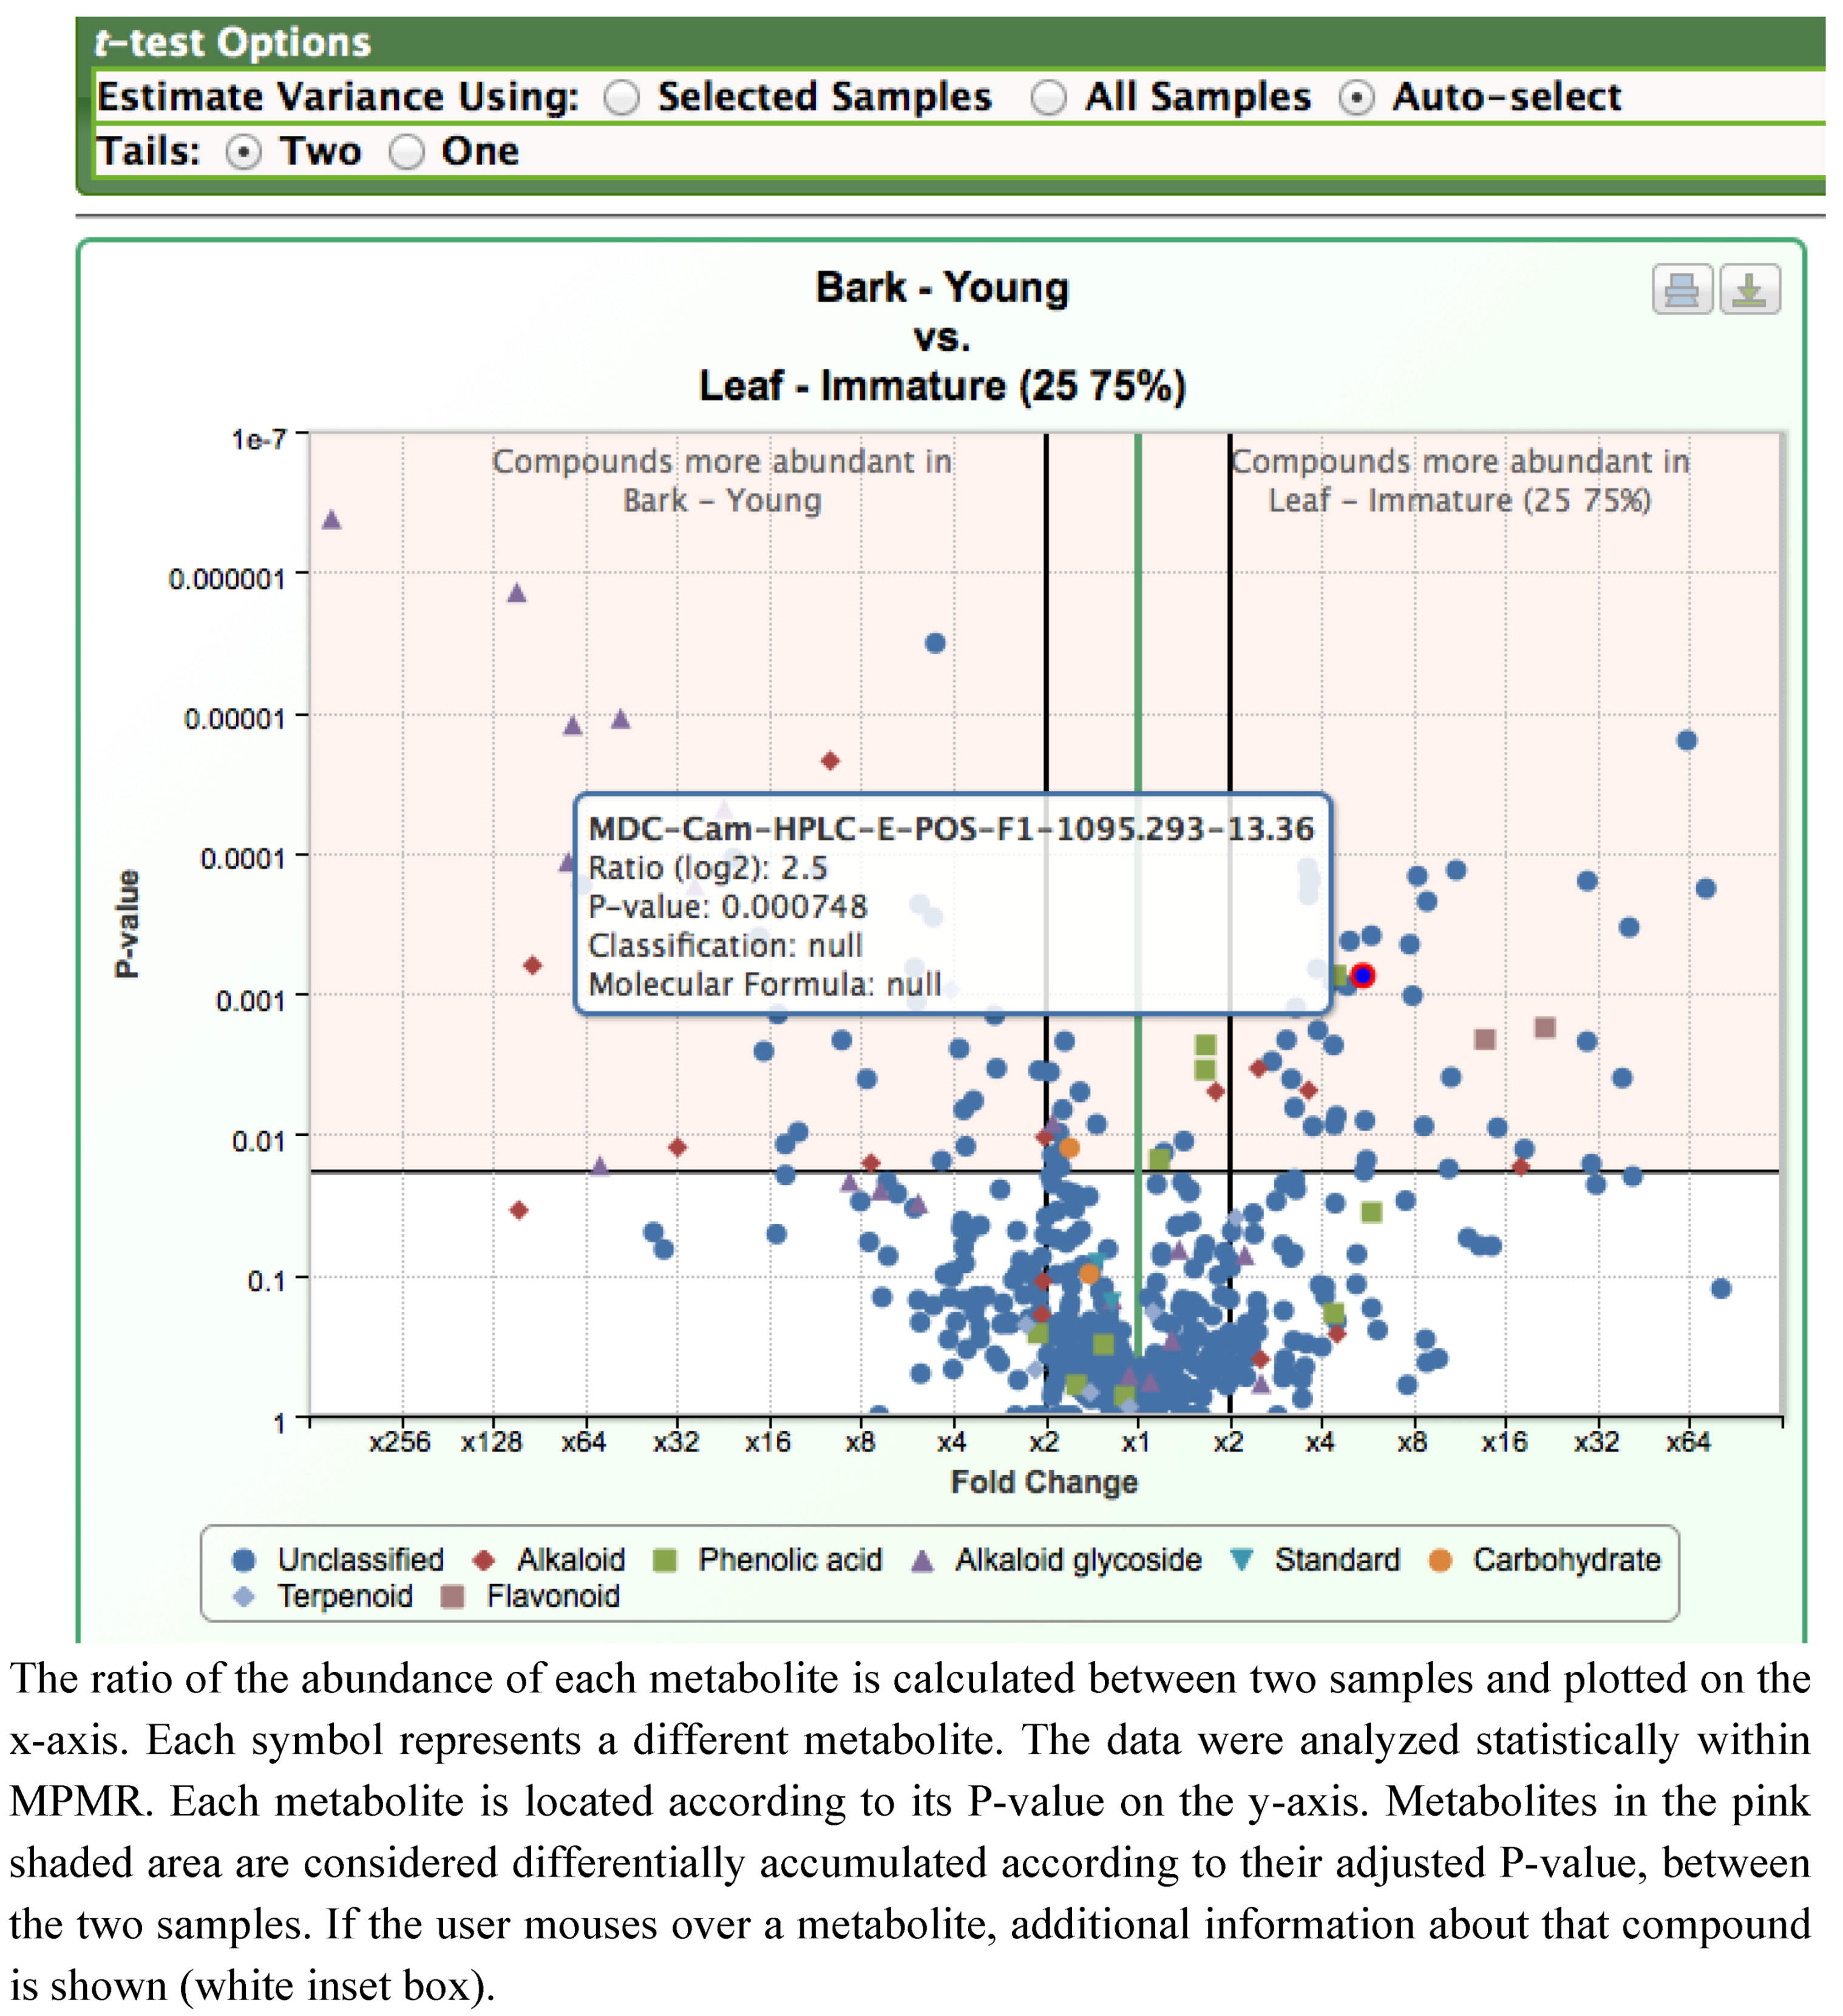
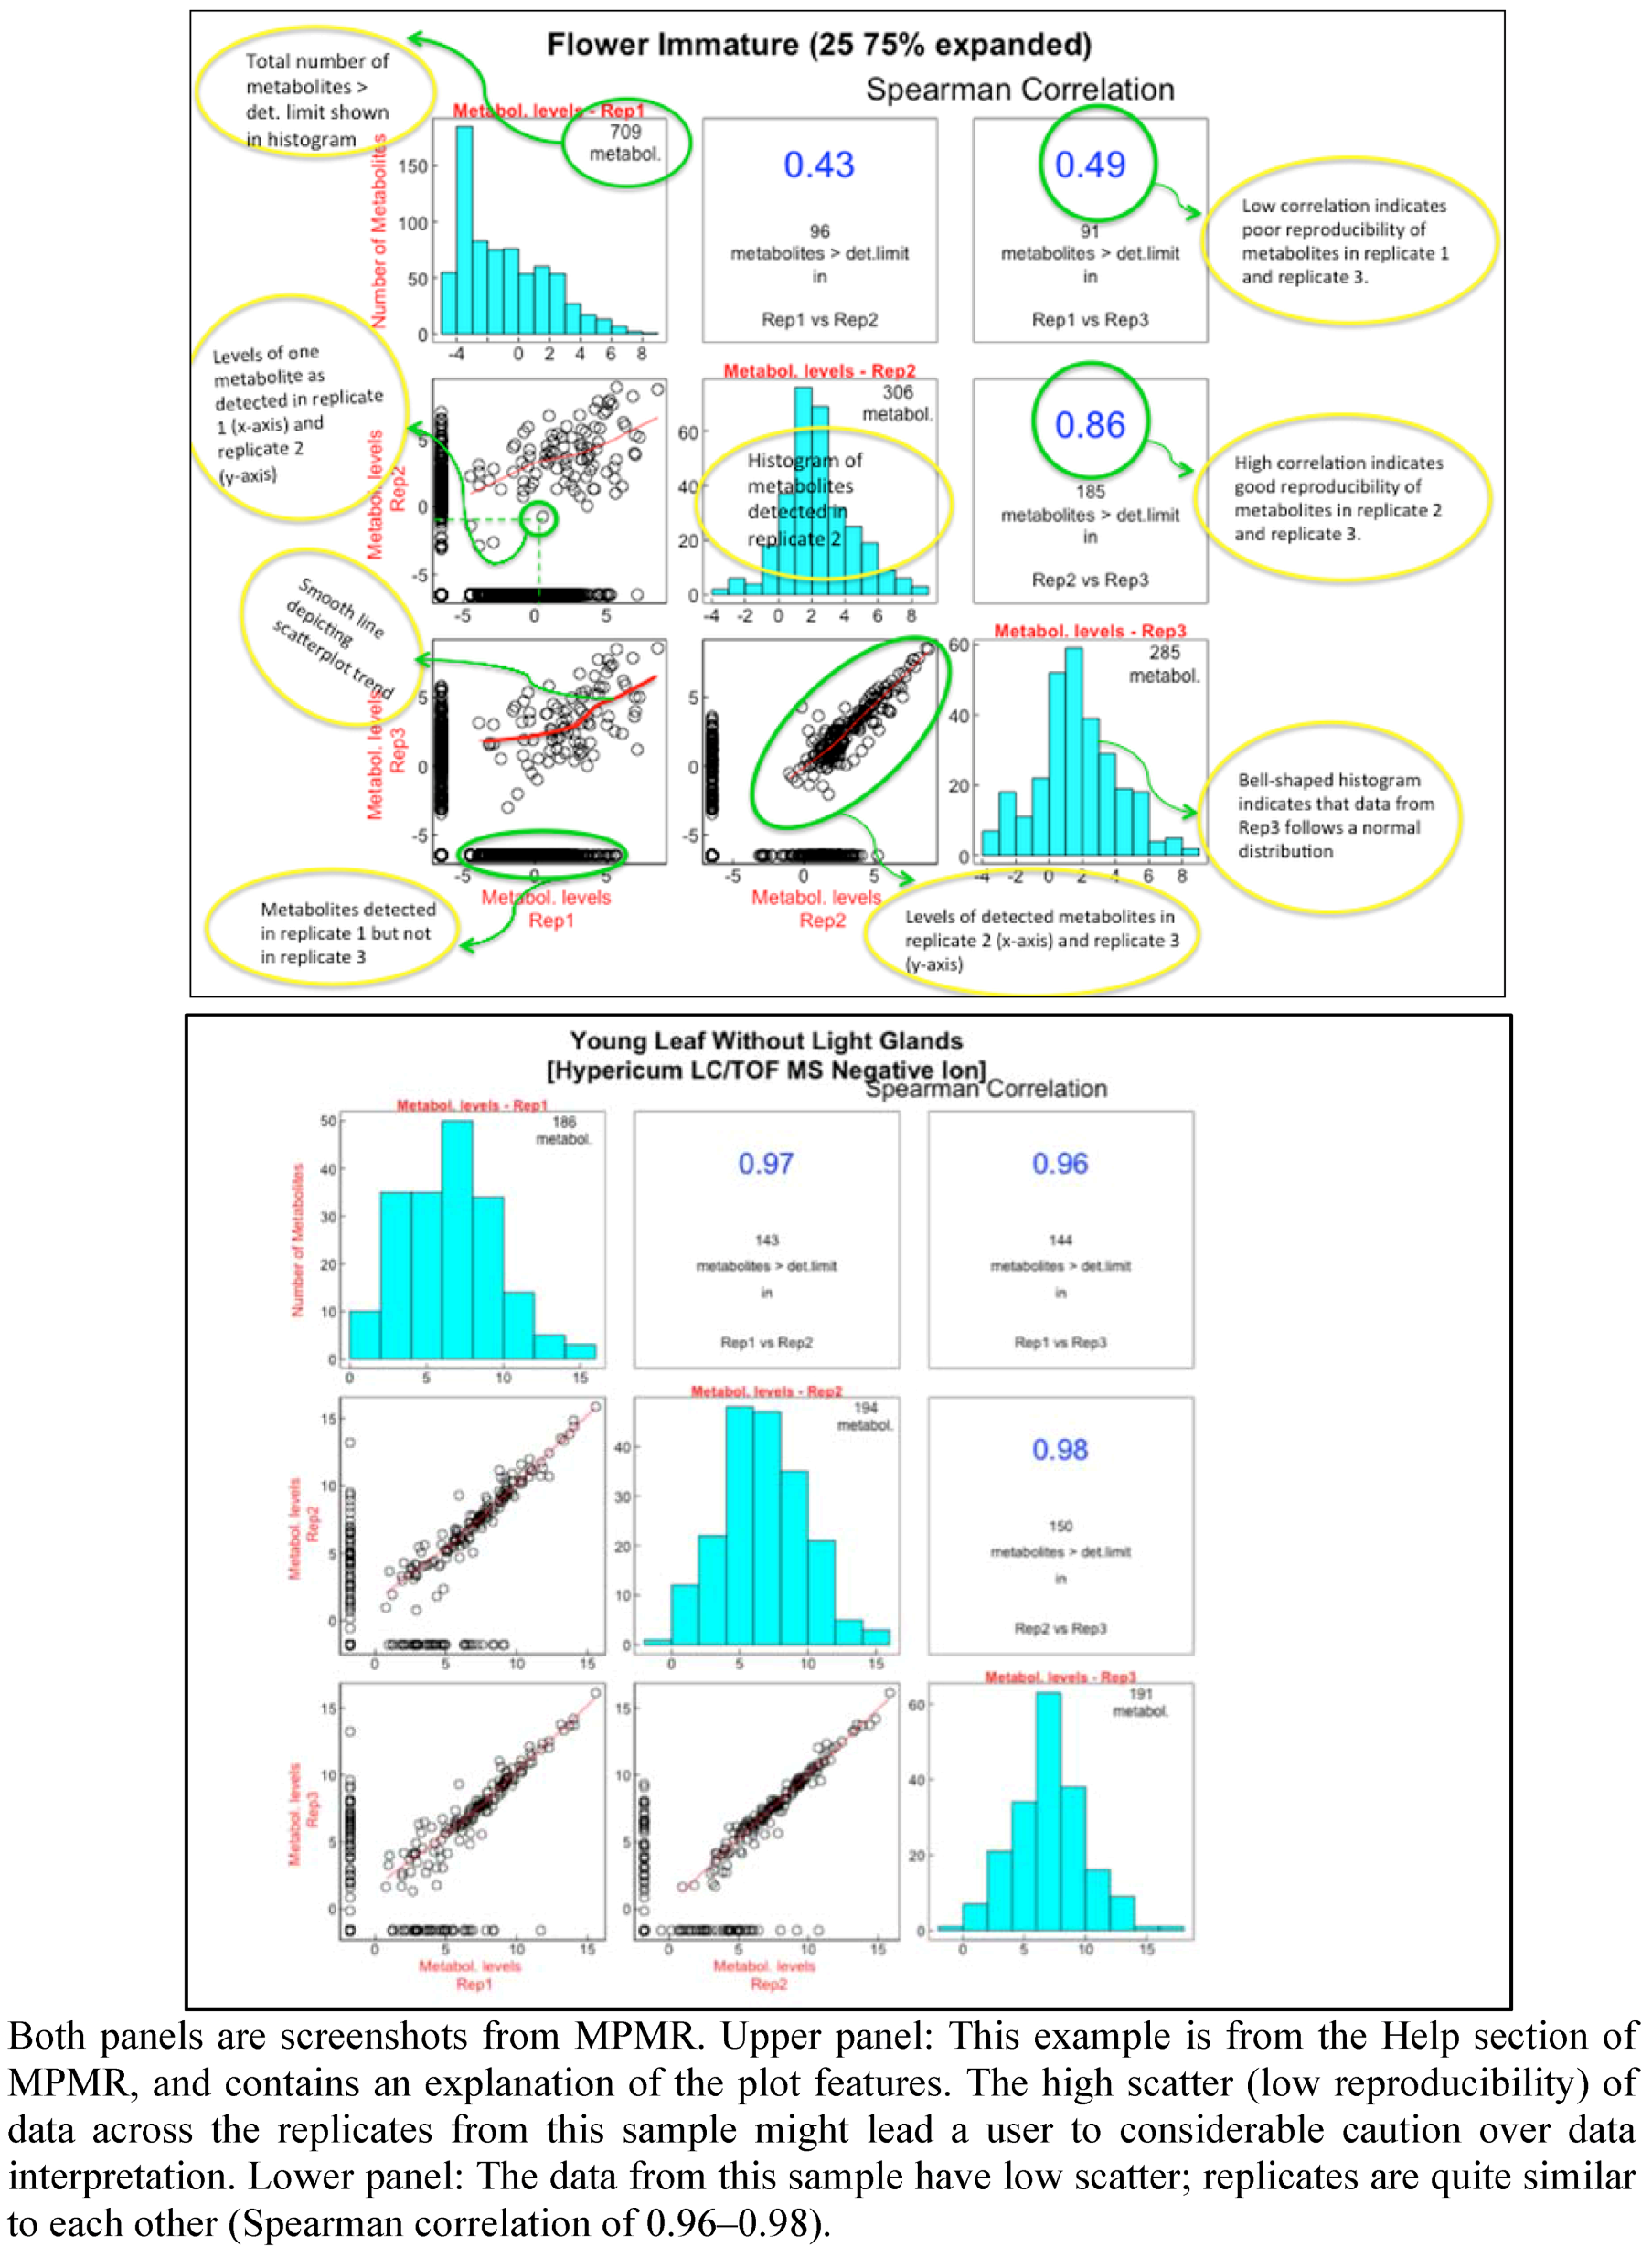
2.2.2. Data Visualization and Evaluation of Prunella vulgaris


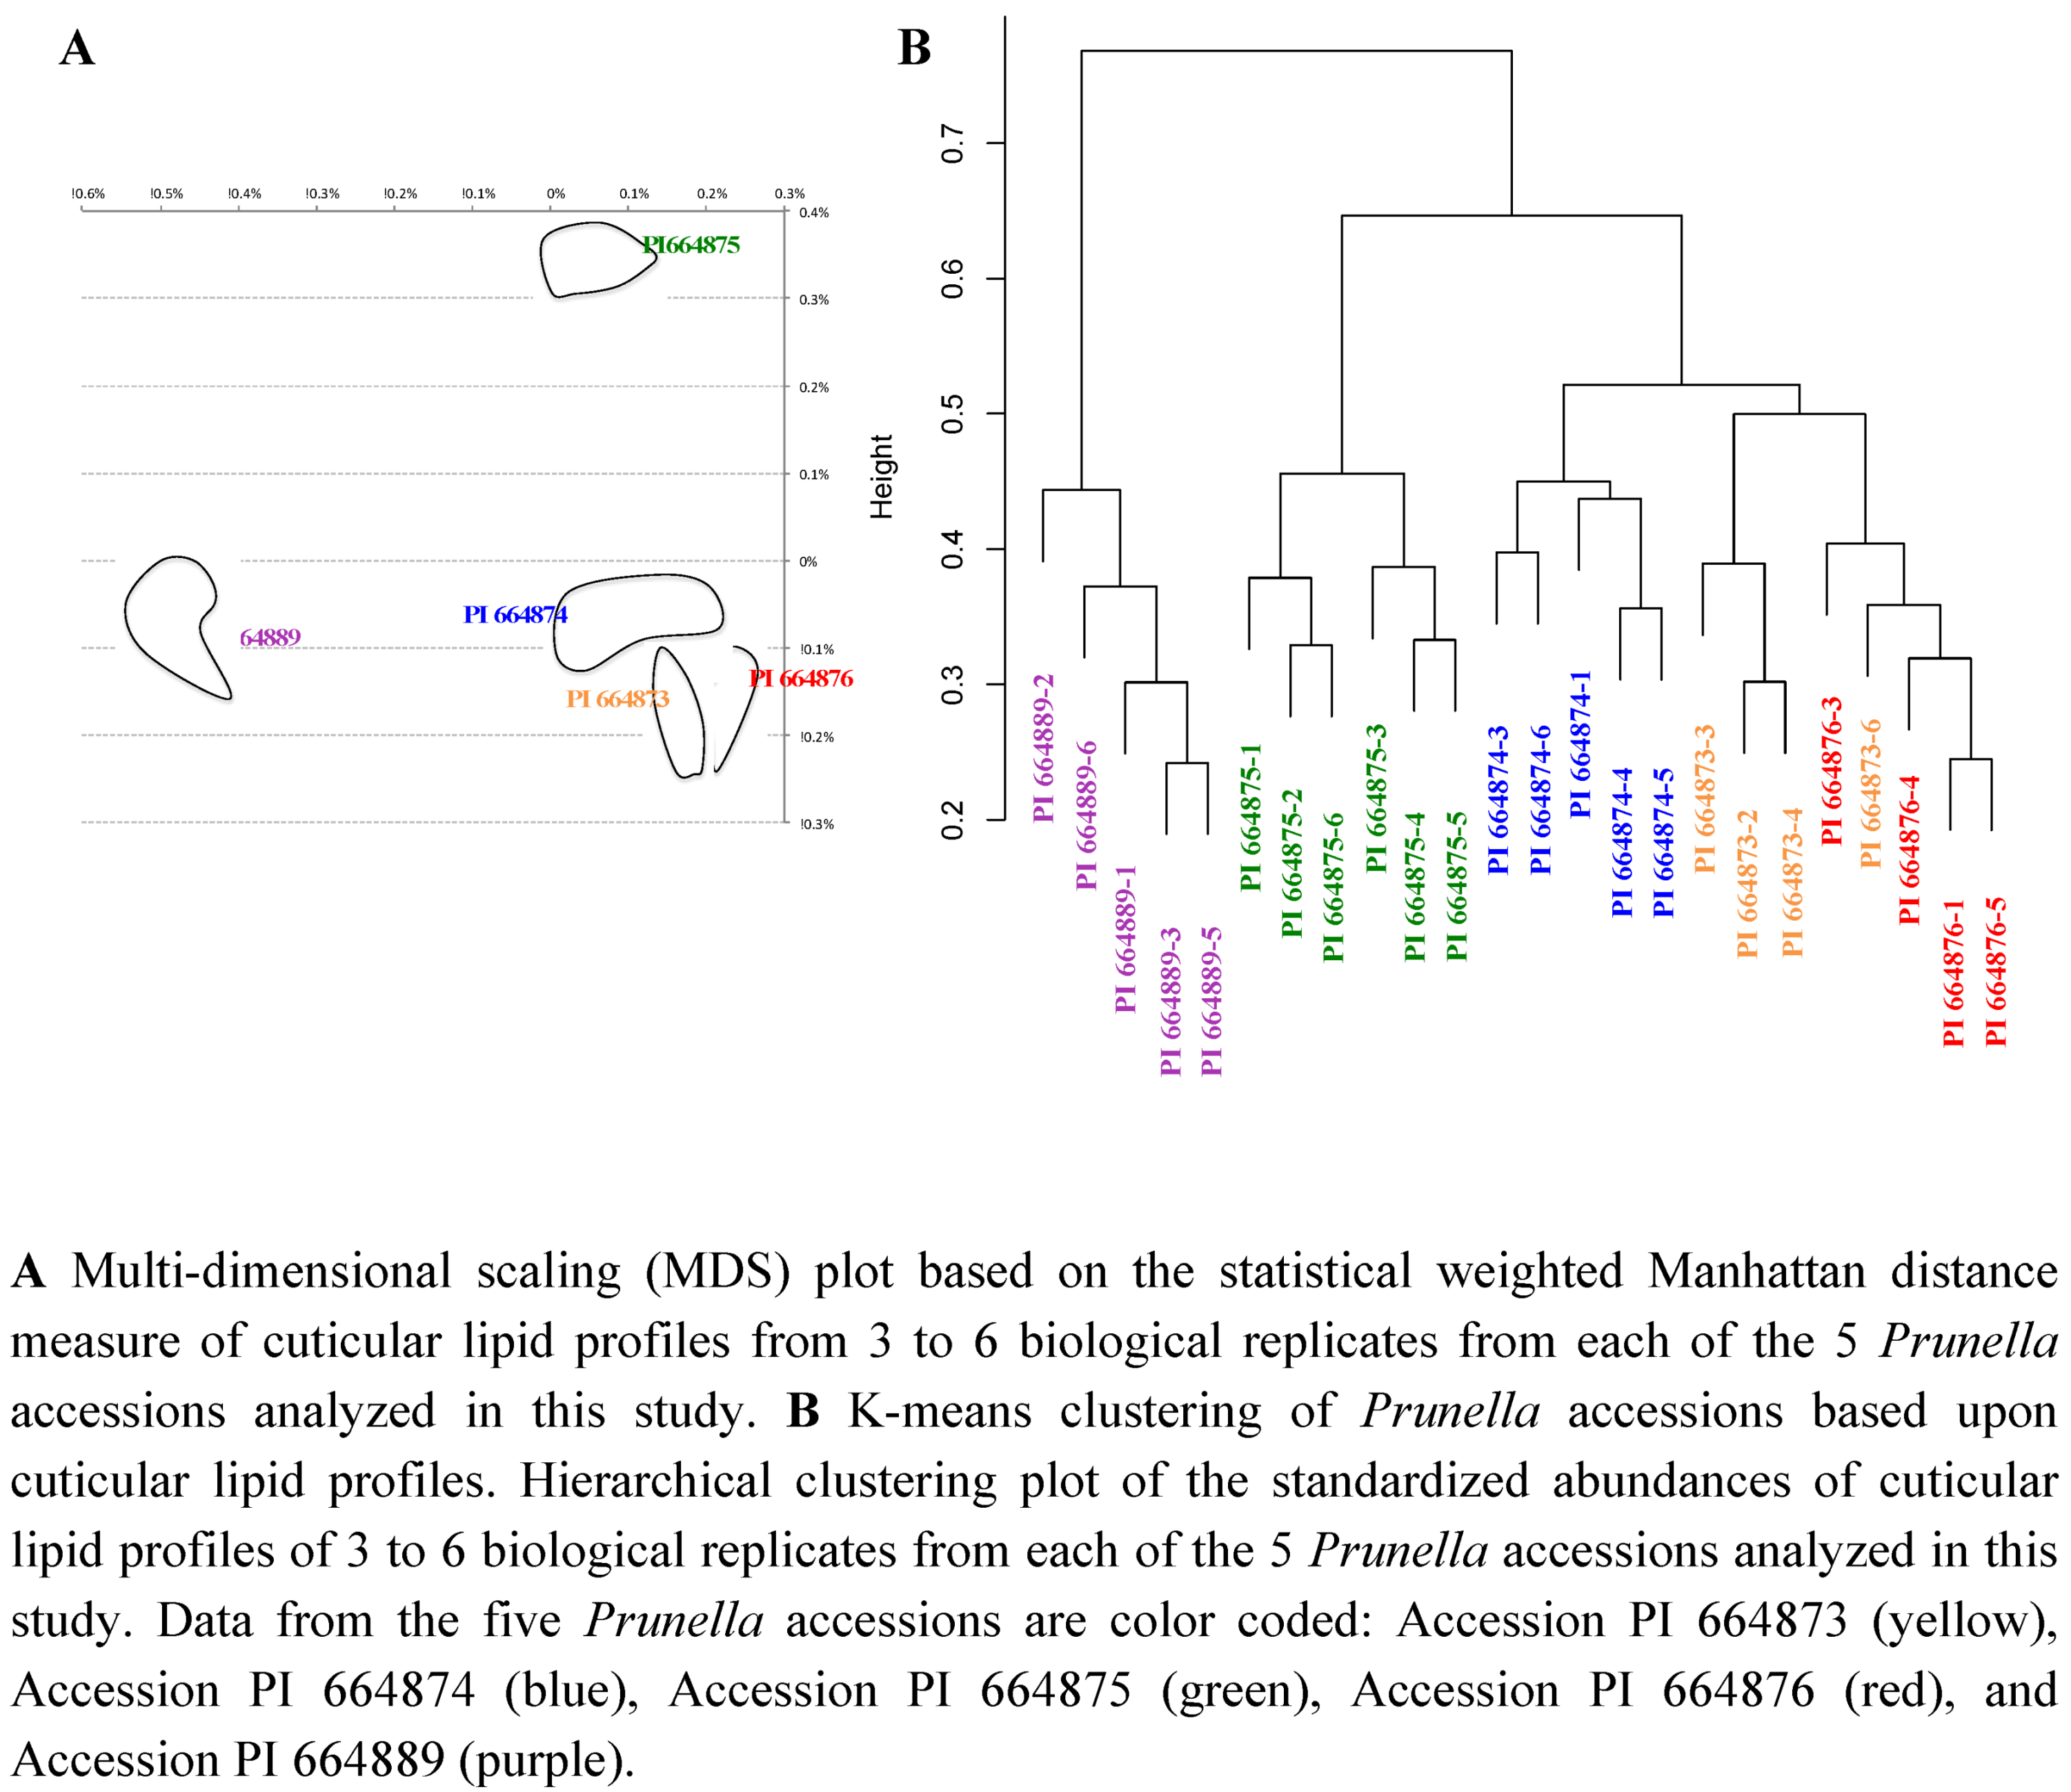
2.2.3. Statistical analysis of the metabolomics data to evaluate systematic relationships among Prunella accessions.

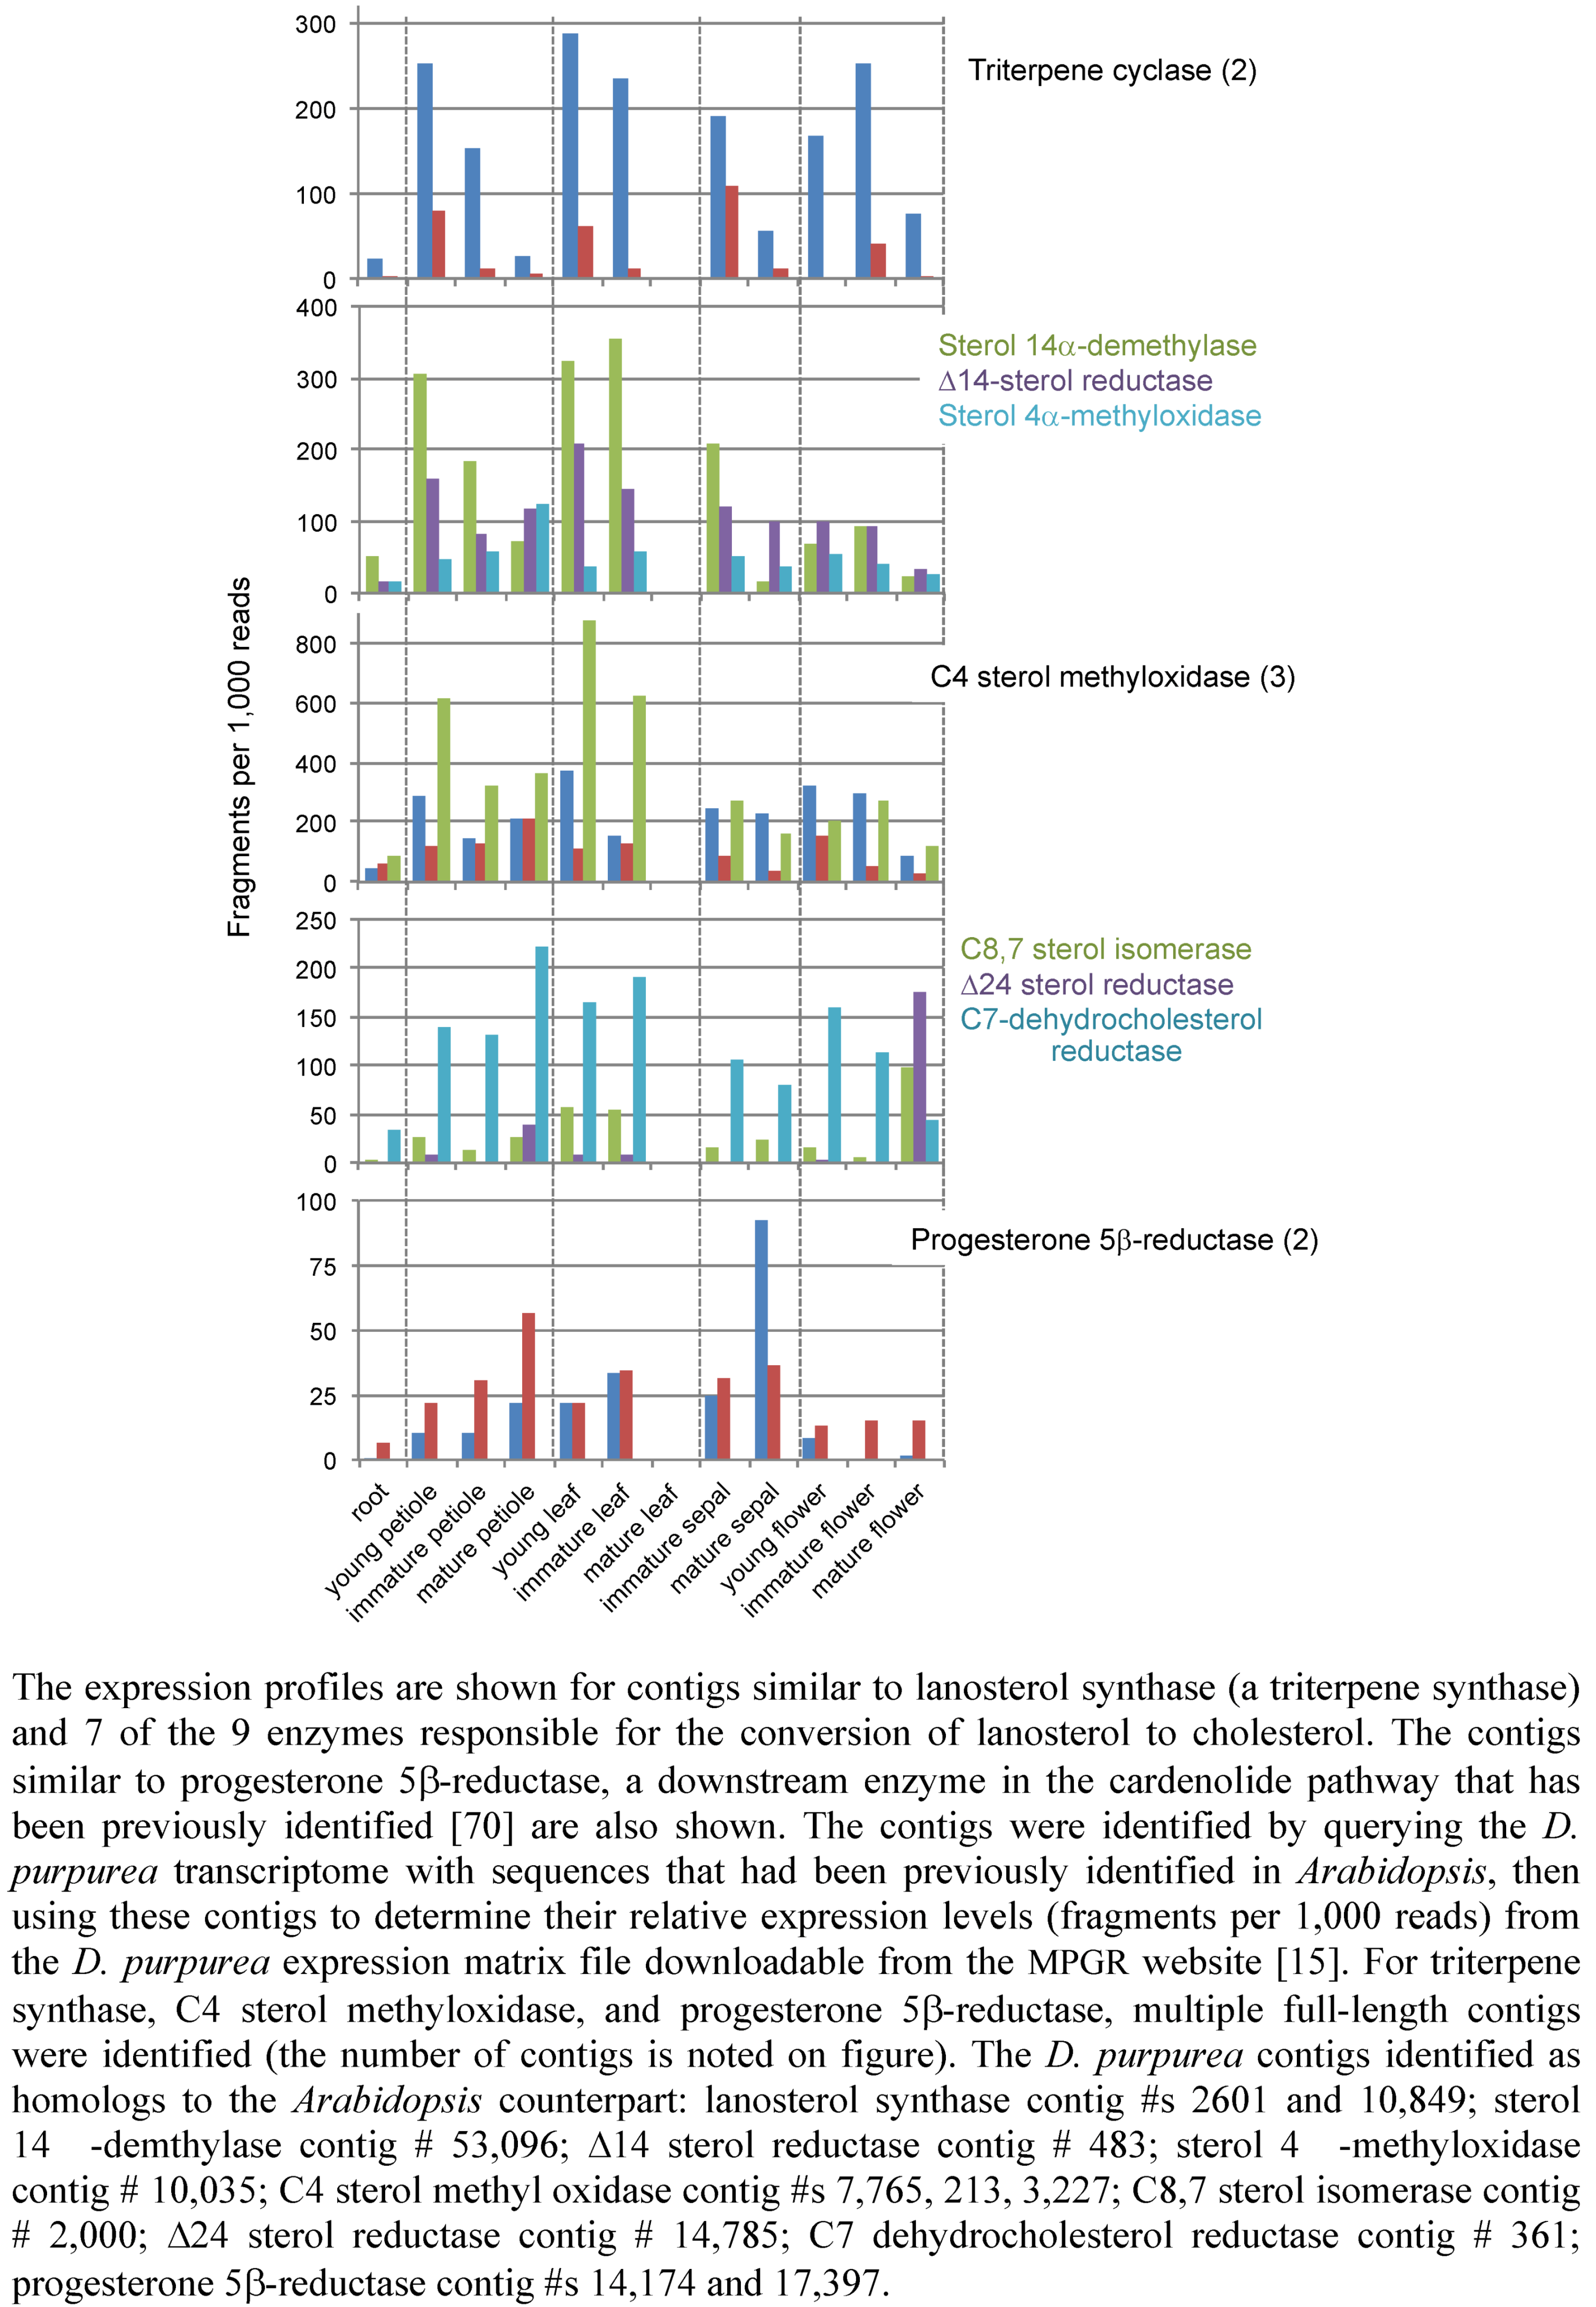
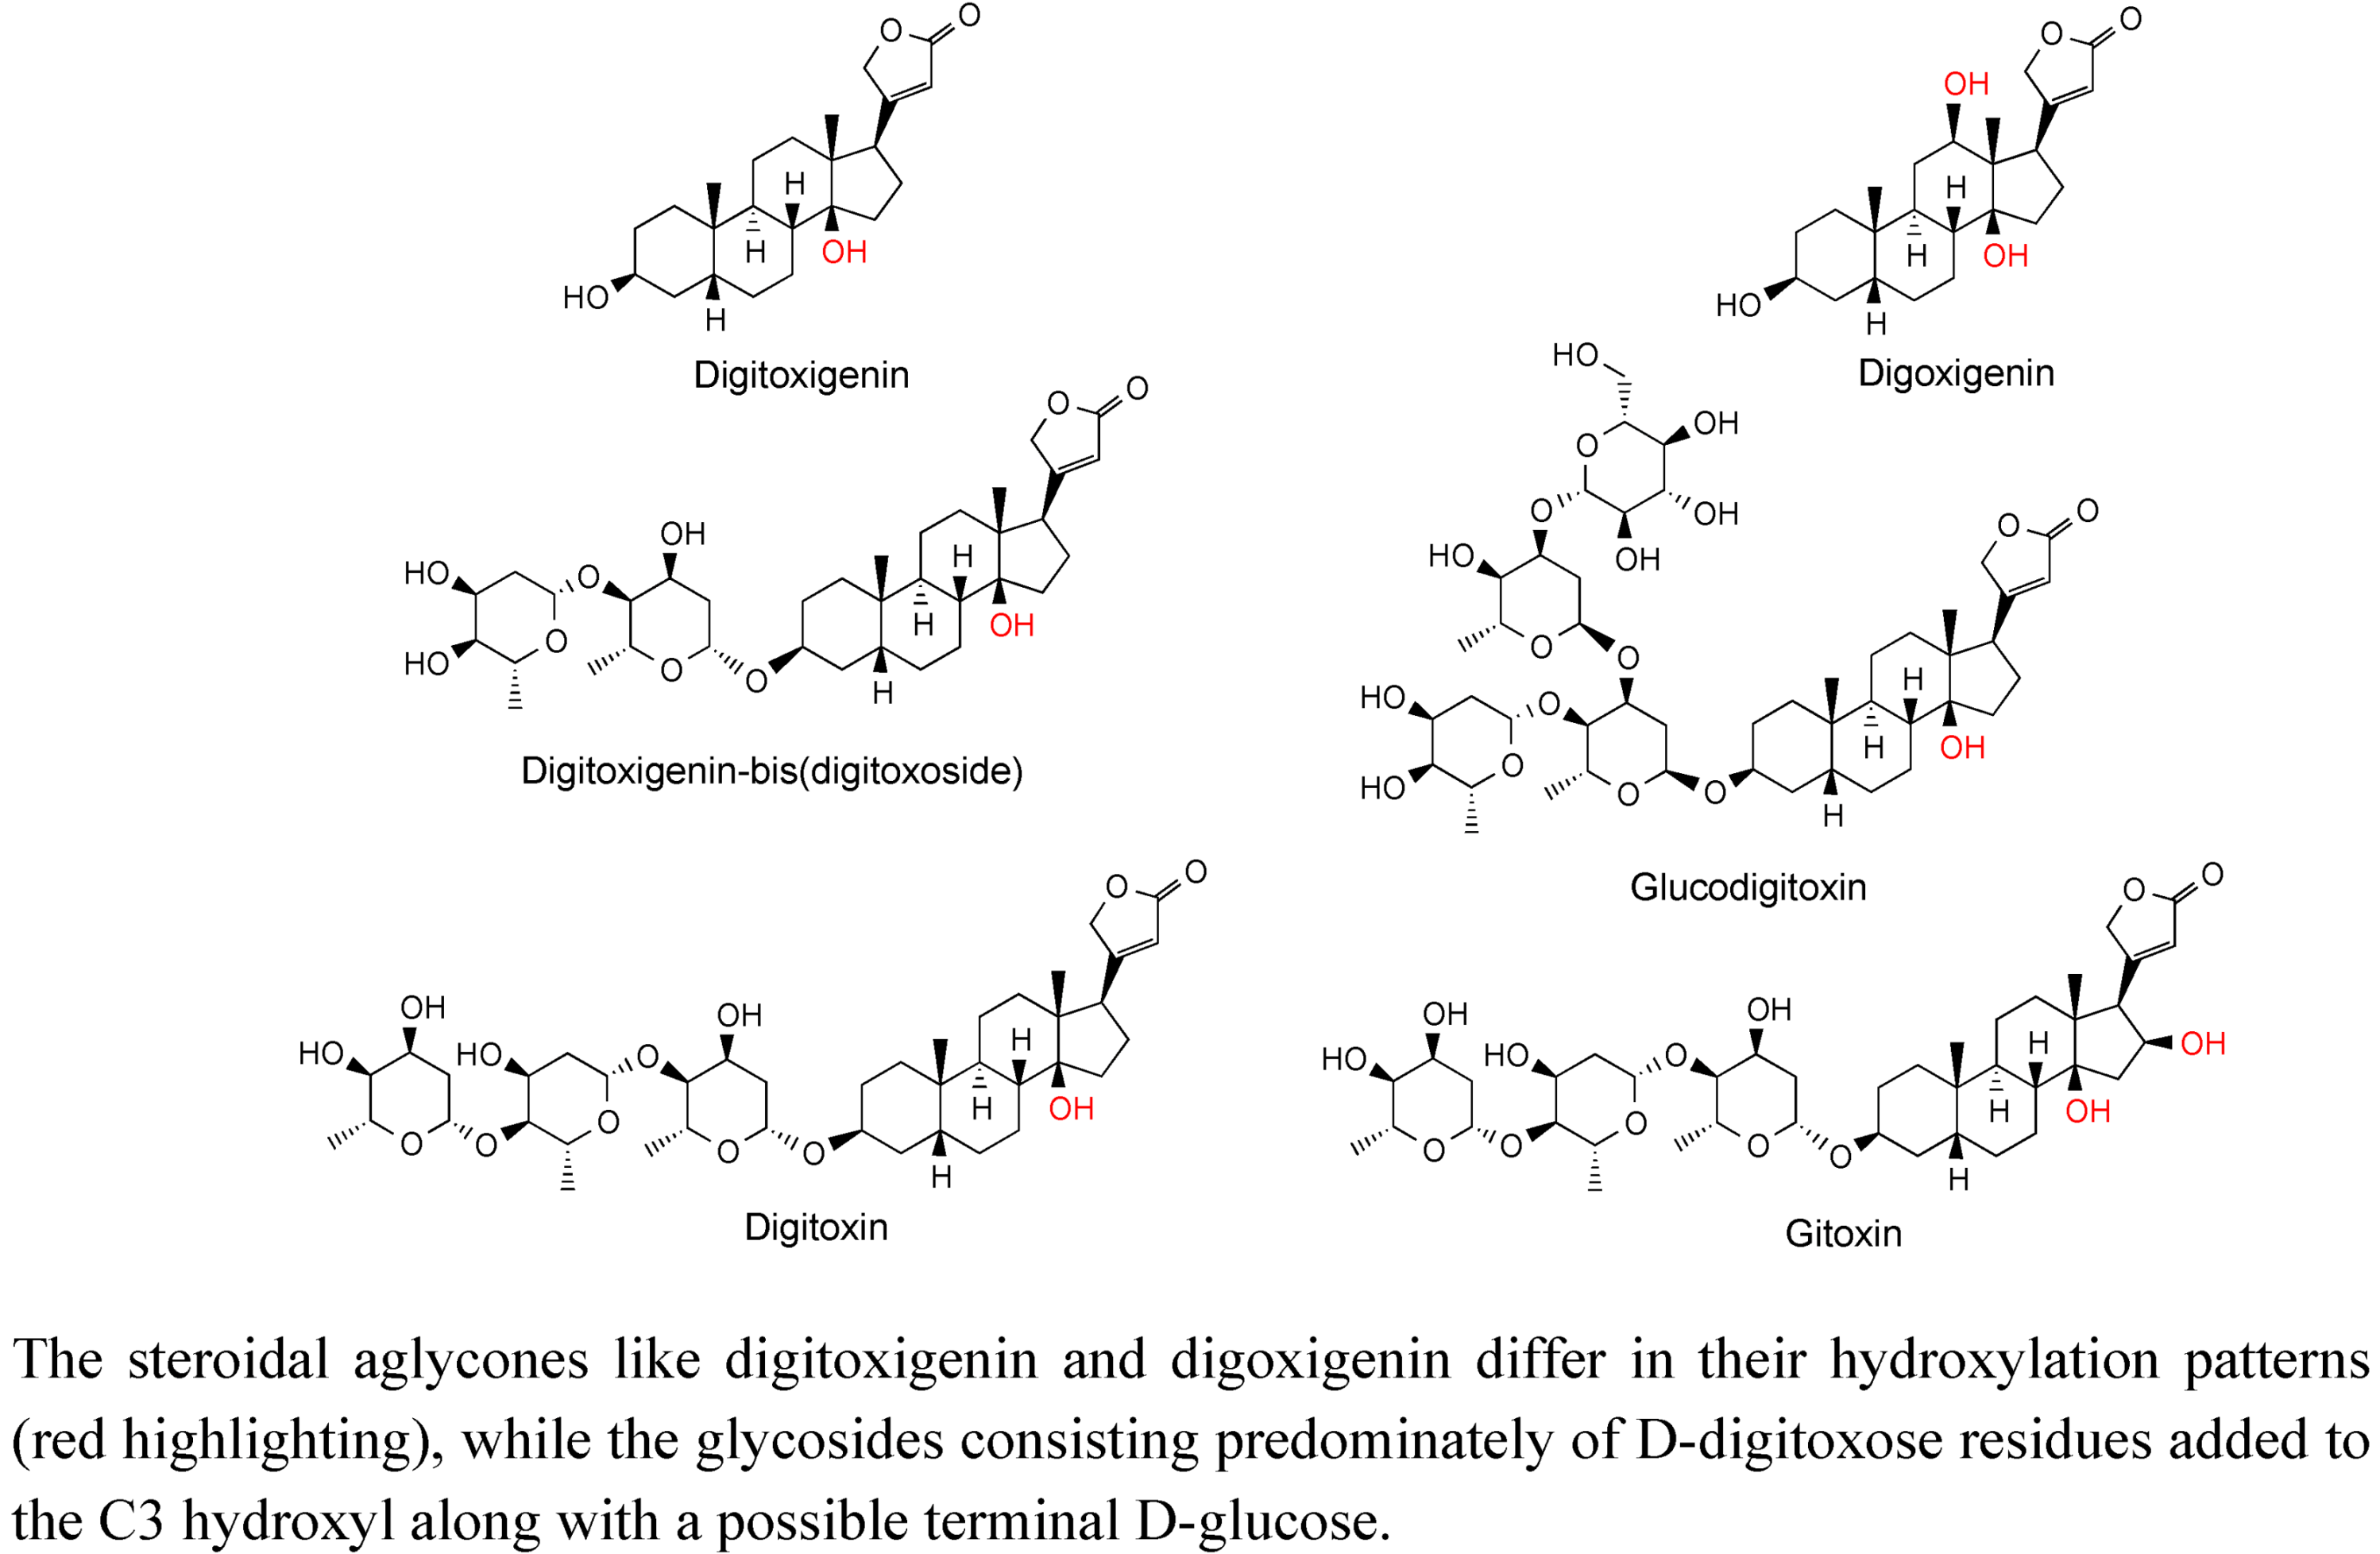
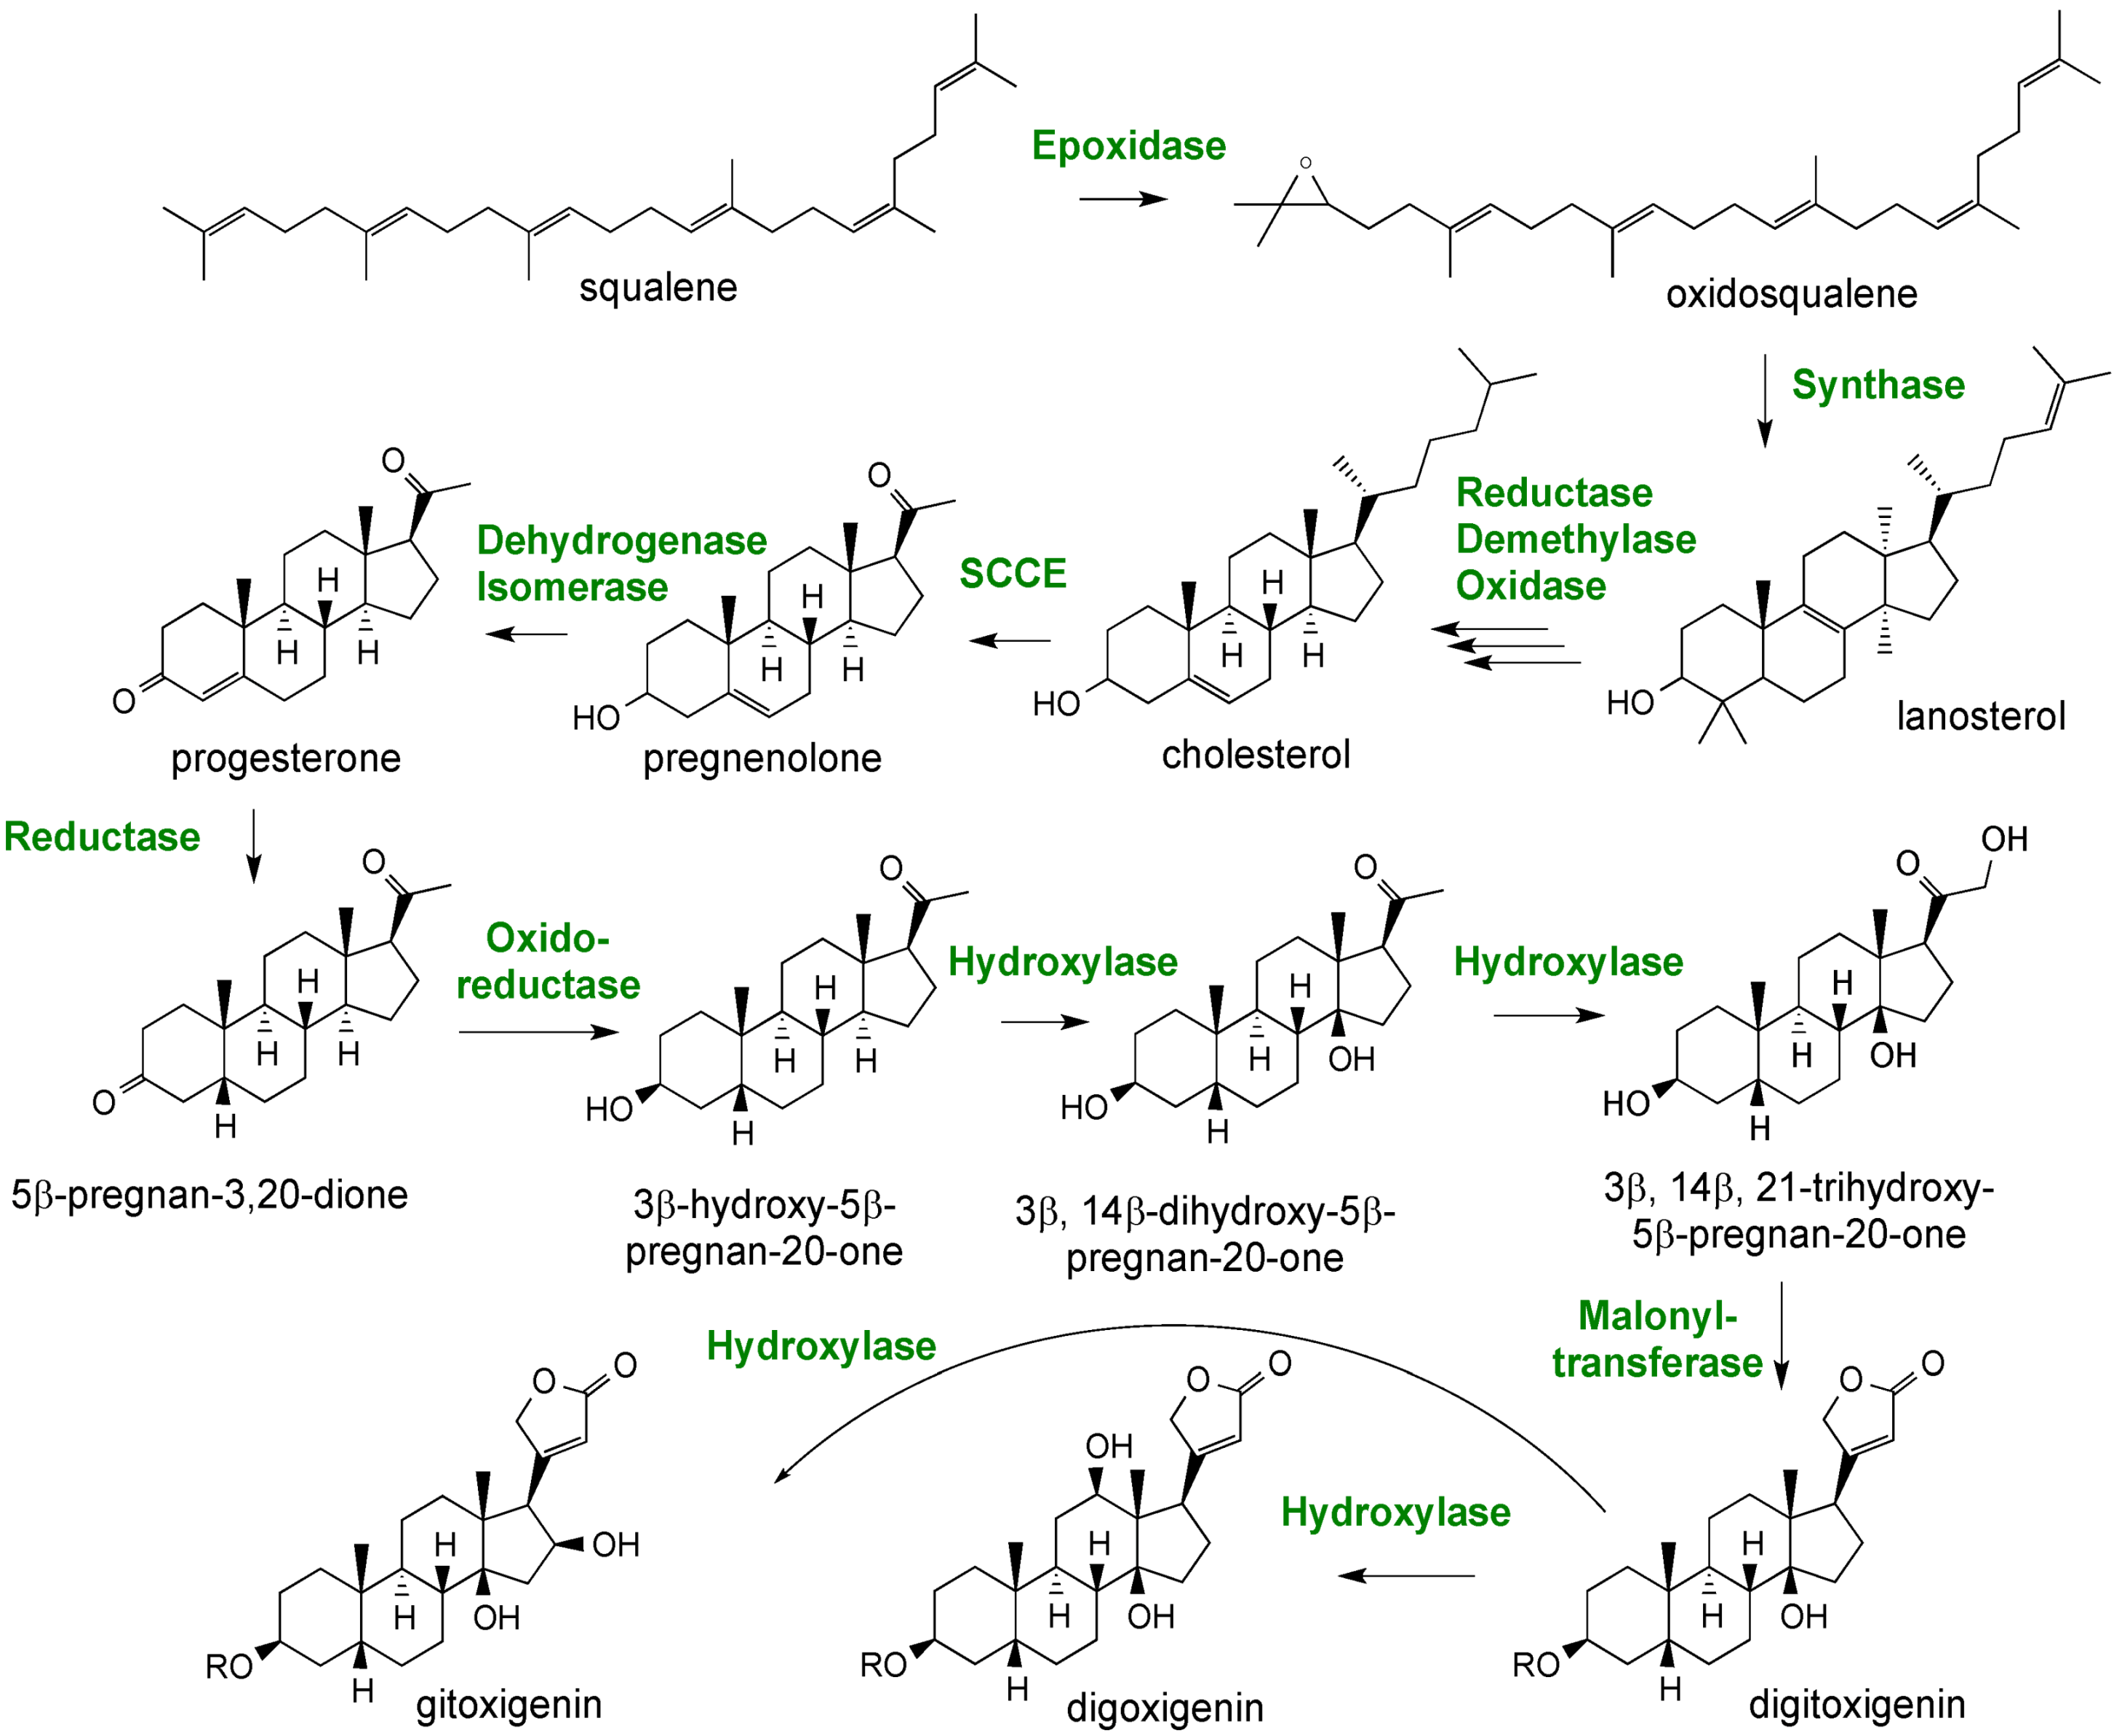
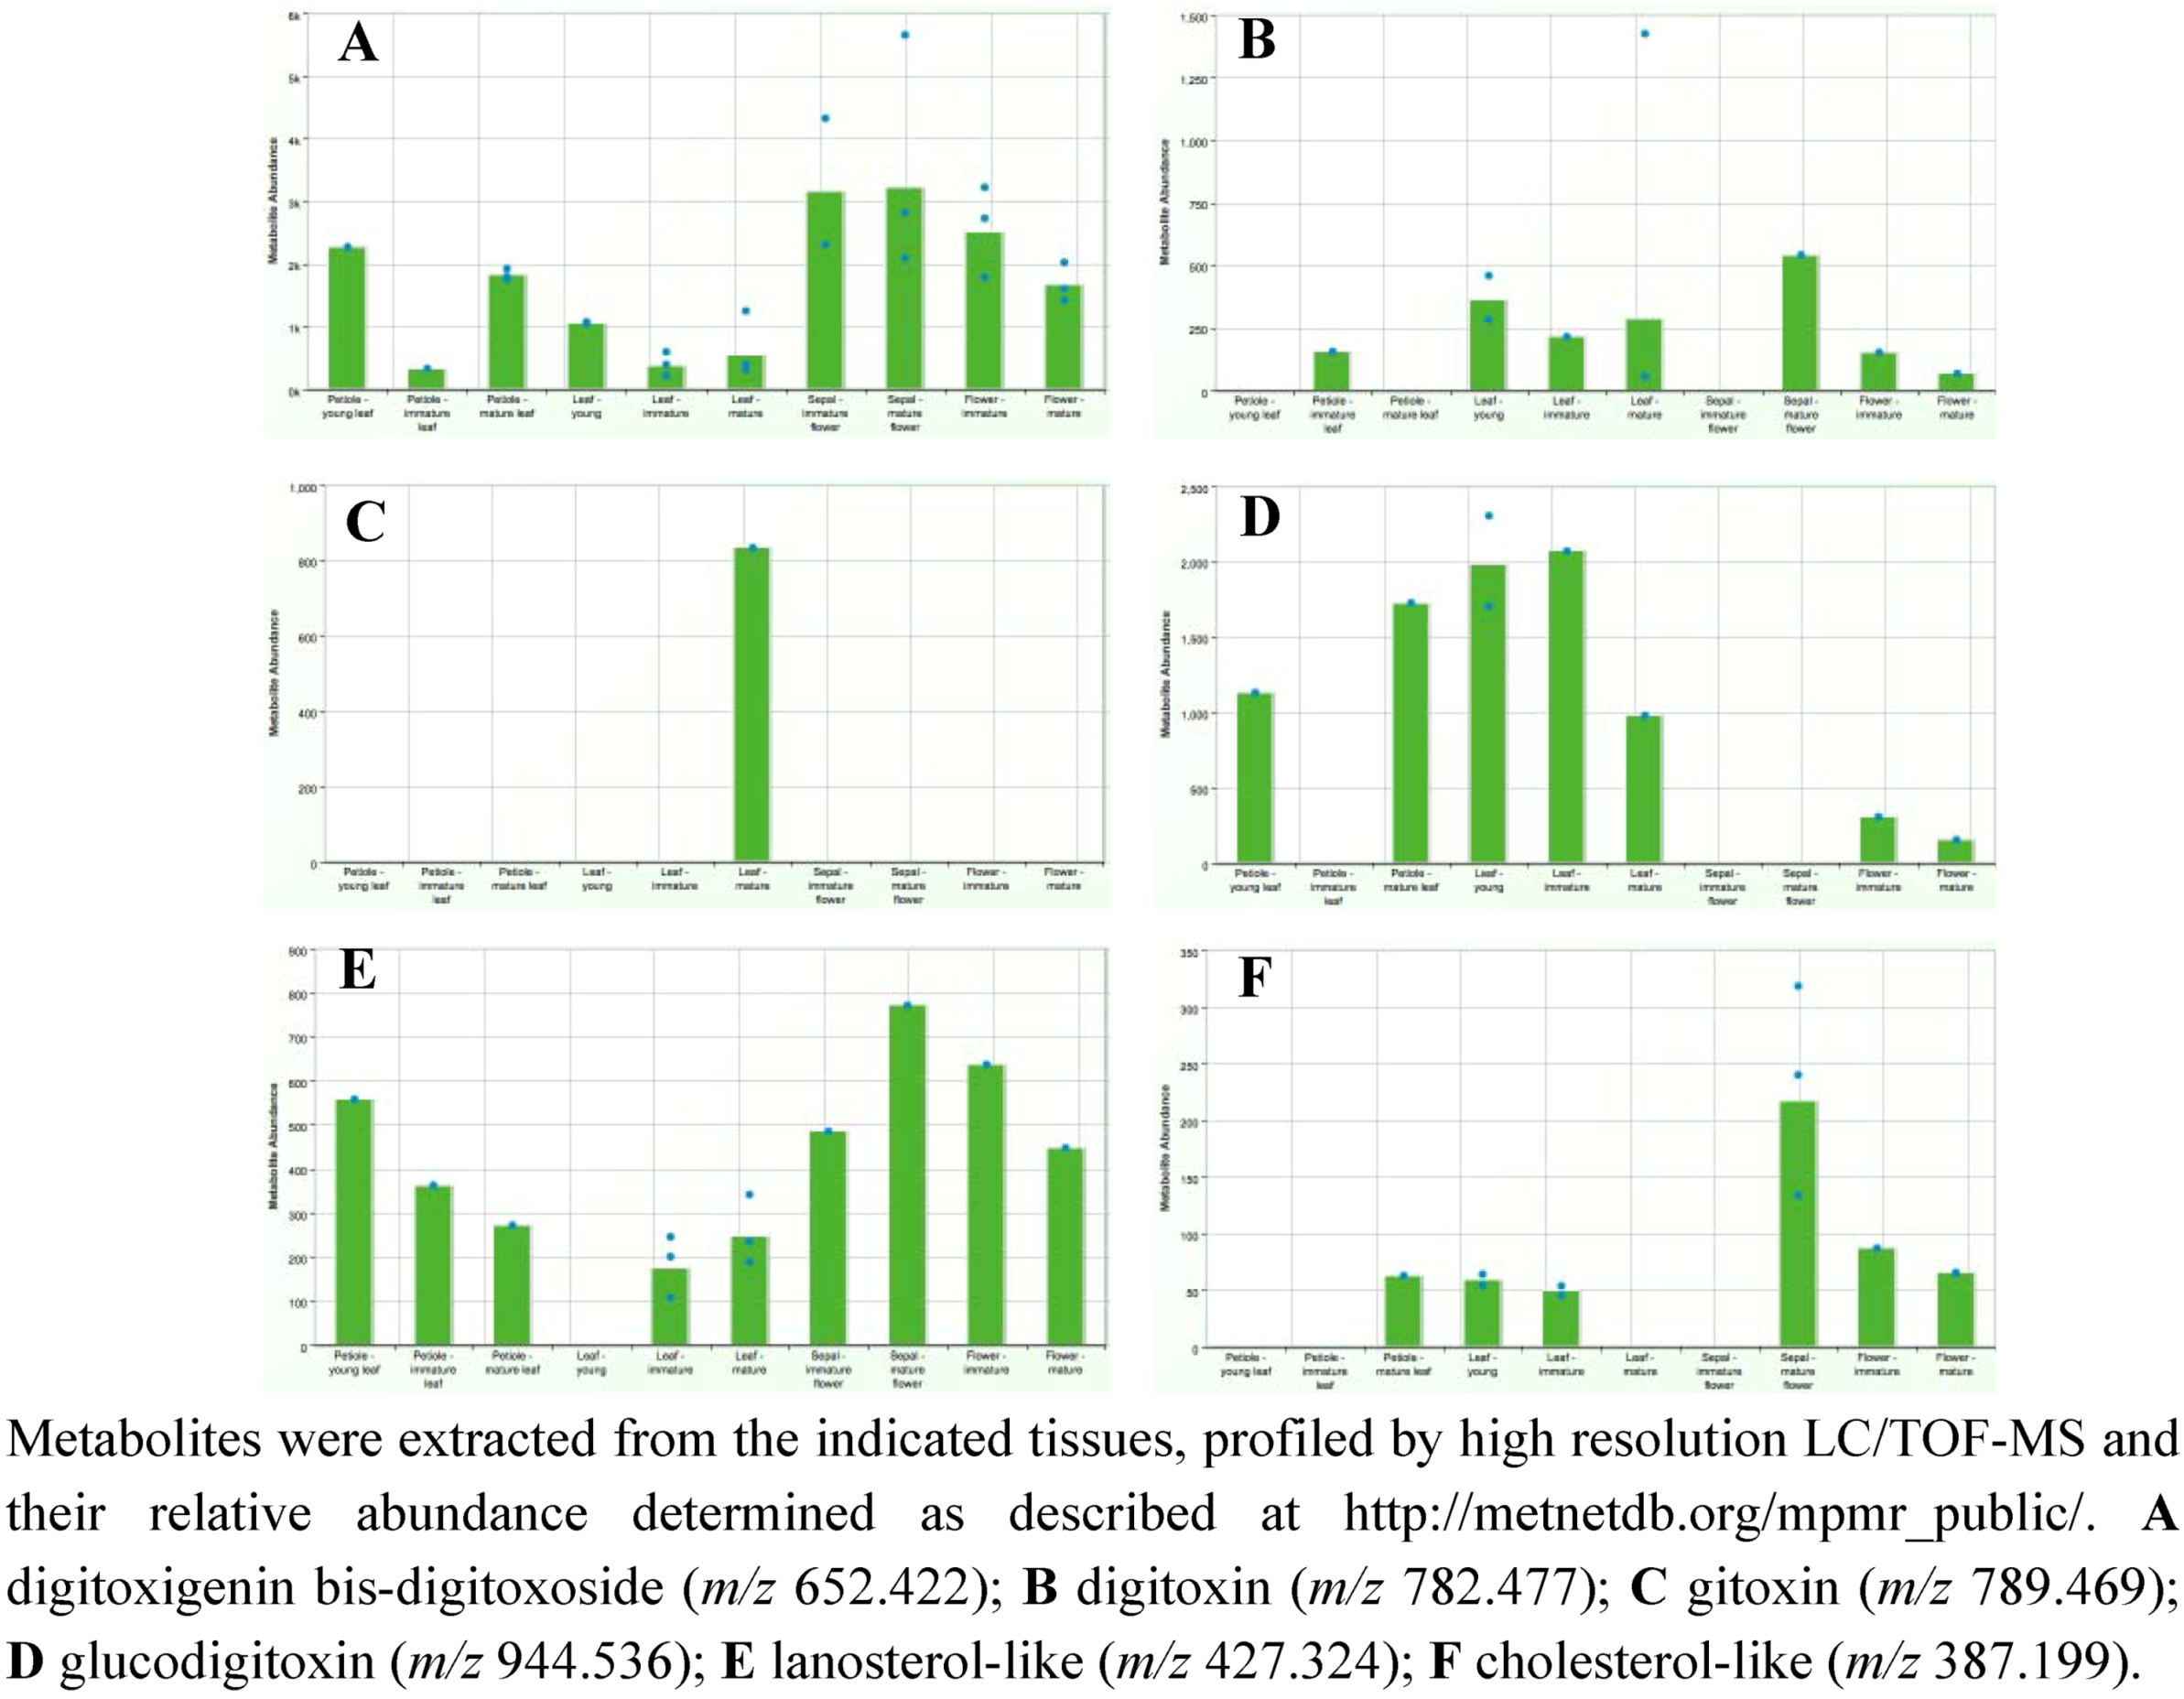
2.3. Case Study: Combined Metabolomics and Transcriptomics of Digitalis purpurea for Hypothesis Development

3. Experimental Section
4. Conclusions
Acknowledgments
Conflict of Interest
References
- Medicinal Plant Metabolomics Resource. Available online: http://metnetdb.org/mpmr_public/ (accessed on 12 November 2012).
- Zhu, F.; Shi, Z.; Qin, C.; Tao, L.; Liu, X.; Xu, F.; Zhang, L.; Song, Y.; Zhang, J.; Han, B.; et al. Therapeutic target database update 2012: A resource for facilitating target-oriented drug discovery. Nucleic Acids Res. 2012, 40, D1128–1136. [Google Scholar]
- Weng, J.K.; Philippe, R.N.; Noel, J.P. The rise of chemodiversity in plants. Science 2012, 336, 1667–1670. [Google Scholar] [CrossRef]
- Mithöfer, A.; Boland, W. Plant defense against herbivores: Chemical aspects. Annu Rev. Plant. Biol 2012, 63, 431–450. [Google Scholar]
- Balandrin, M.F.; Klocke, J.A.; Wurtele, E.S.; Bollinger, W.H. Natural plant chemicals: Sources of industrial and medicinal materials. Science 1985, 228, 1154–1160. [Google Scholar]
- Crispin, M.C.; Wurtele, E.S. Use of Metabolomics and Transcriptomics to Gain Insights into the Regulation and Biosynthesis of Medicinal Compounds: Hypericum as a Model. In Biotechnology for Medicinal Plants: Propagation and Improvement; Springer: Berlin/Heidelberg, Germany, 2013; pp. 395–411. [Google Scholar]
- De Luca, V.; Salim, V.; Atsumi, S.M.; Yu, F. Mining the biodiversity of plants: A revolution in the making. Science 2012, 336, 1658–1661. [Google Scholar] [CrossRef]
- Oliver, D.J.; Nikolau, B.; Wurtele, E.S. Functional genomics: High-throughput mRNA, protein, and metabolite analyses. Metab. Eng. 2002, 4, 98–106. [Google Scholar] [CrossRef]
- Schilmiller, A.L.; Last, R.L.; Pichersky, E. Harnessing plant trichome biochemistry for the production of useful compounds. Plant. J. 2008, 54, 702–711. [Google Scholar] [CrossRef]
- Schilmiller, A.L.; Pichersky, E.; Last, R.L. Taming the hydra of specialized metabolism: How systems biology and comparative approaches are revolutionizing plant biochemistry. Curr Opin Plant. Biol. 2012, 15, 338–344. [Google Scholar] [CrossRef]
- Lu, Y.; Savage, L.J.; Ajjawi, I.; Imre, K.M.; Yoder, D.W.; Benning, C.; Dellapenna, D.; Ohlrogge, J.B.; Osteryoung, K.W.; Weber, A.P.; et al. New connections across pathways and cellular processes: Industrialized mutant screening reveals novel associations between diverse phenotypes in Arabidopsis. Plant. Physiol. 2008, 146, 1482–1500. [Google Scholar] [CrossRef]
- Messerli, G.; Nia, V.P.; Trevisan, M.; Kolbe, A.; Schauer, N.; Geigenberger, P.; Chen, J.C.; Davison, A.C.; Fernie, A.R.; Zeeman, S.C. Rapid classification of phenotypic mutants of Arabidopsis via metabolite fingerprinting. Plant. Physiology 2007, 143, 1484–1492. [Google Scholar]
- Cottret, L.; Wildridge, D.; Vinson, F.; Barrett, M.P.; Charles, H.; Sagot, M.F.; Jourdan, F. Metexplore: A web server to link metabolomic experiments and genome-scale metabolic networks. Nucleic Acids Res. 2010, 38, W132–137. [Google Scholar]
- Quanbeck, S.M.; Brachova, L.; Campbell, A.A.; Guan, X.; Perera, A.; He, K.; Rhee, S.Y.; Bais, P.; Dickerson, J.A.; Dixon, P.; et al. Metabolomics as a hypothesis-generating functional genomics tool for the annotation of Arabidopsis thaliana genes of "unknown function". Front. Plant. Sci 2012, 3, 15. [Google Scholar]
- Medicinal Plant Genomics Resource. Available online: http://medicinalplantgenomics.msu.edu/ (accessed on 12 November 2012).
- Gu, L.; Jones, A.D.; Last, R.L. Broad connections in the arabidopsis seed metabolic network revealed by metabolite profiling of an amino acid catabolism mutant. Plant. J. 2010, 61, 579–590. [Google Scholar] [CrossRef]
- Schilmiller, A.; Shi, F.; Kim, J.; Charbonneau, A.L.; Holmes, D.; Jones, A.D.; Last, R.L. Mass spectrometry screening reveals widespread diversity in trichome specialized metabolites of tomato chromosomal substitution lines. Plant. J. 2010, 62, 391–403. [Google Scholar]
- Plumb, R.S.; Johnson, K.A.; Rainville, P.; Shockcor, J.P.; Williams, R.; Granger, J.H.; Wilson, I.D. The detection of phenotypic differences in the metabolic plasma profile of three strains of zucker rats at 20 weeks of age using ultra-performance liquid chromatography/orthogonal acceleration time-of-flight mass spectrometry. Rapid Commun. Mass. Spectrom. 2006, 20, 2800–2806. [Google Scholar] [CrossRef]
- Yamazaki, Y.; Kitajima, M.; Arita, M.; Takayama, H.; Sudo, H.; Yamazaki, M.; Aimi, N.; Saito, K. Biosynthesis of camptothecin. In silico and in vivo tracer study from [1–13c]glucose. Plant Physiol. 2004, 134, 161–170. [Google Scholar] [CrossRef]
- Montoro, P.; Maldini, M.; Piacente, S.; Macchia, M.; Pizza, C. Metabolite fingerprinting of Camptotheca acuminata and the hplc-esi-ms/ms analysis of camptothecin and related alkaloids. J. Pharm. Biomed. Anal. 2010, 51, 405–415. [Google Scholar] [CrossRef]
- Sheriha, G.M.; Rapoport, H. Biosynthesis of Camptotheca acuminata alkaloids. Phytochemistry 1976, 15, 505–508. [Google Scholar]
- Battersby, A.R.; Burnett, A.R.; Parsons, P.G. Alkaloid biosynthesis. Part xiv. Secologanin: Its conversion into ipecoside and its role as biological precursor of the indole alkaloids. J. Chem.Soc. C-Org. 1969, 1187–1192. [Google Scholar]
- Chiej, R. The Macdonald Encyclopedia of Medicinal Plant; Macdonald & Co: London, UK, 1984. [Google Scholar]
- Hamada, T. Studies on the medicinal plant in the "sambutsu-cho" of higo province possessed by the kumamoto clan (ii): On the medicina herbs. Yakushigaku Zasshi 1993, 28, 63–72. [Google Scholar]
- Mattioli, P.A. Kreuterbuch; Verlegung Sigmund Feyerabends, Peter Fischers und Heinrich Dacken: Frankfurt am main, 1586. [Google Scholar]
- Pinkas, M.; Trotin, F.; Feng, M.; Torck, M. Use, chemistry and pharmacology of ten chinese medicinal plants. Fitotherapia 1994, 65, 343–353. [Google Scholar]
- Brindley, M.A.; Widrlechner, M.P.; McCoy, J.A.; Murphy, P.; Hauck, C.; Rizshsky, L.; Nikolau, B.; Maury, W. Inhibition of lentivirus replication by aqueous extracts of Prunella vulgaris. Virol. J. 2009, 6, 8–21. [Google Scholar] [CrossRef]
- Chiu, L.C.; Zhu, W.; Ooi, V.E. A polysaccharide fraction from medicinal herb Prunella vulgaris downregulates the expression of herpes simplex virus antigen in vero cells. J. Ethnopharmacol. 2004, 93, 63–68. [Google Scholar]
- Han, E.H.; Choi, J.H.; Hwang, Y.P.; Park, H.J.; Choi, C.Y.; Chung, Y.C.; Seo, J.K.; Jeong, H.G. Immunostimulatory activity of aqueous extract isolated from Prunella vulgaris. Food Chem. Toxicol. 2009, 47, 62–69. [Google Scholar] [CrossRef]
- Hwang, S.M.; Lee, Y.J.; Yoon, J.J.; Lee, S.M.; Kim, J.S.; Kang, D.G.; Lee, H.S. Prunella vulgaris suppresses hg-induced vascular inflammation via nrf2/ho-1/enos activation. Int. J. Mol. Sci. 2012, 13, 1258–1268. [Google Scholar] [CrossRef]
- Kageyama, S.; Kurokawa, M.; Shiraki, K. Extract of Prunella vulgaris spikes inhibits hiv replication at reverse transcription in vitro and can be absorbed from intestine in vivo. Antivir. Chem. Chemother. 2000, 11, 157–164. [Google Scholar]
- Kim, S.H.; Huang, C.Y.; Tsai, C.Y.; Lu, S.Y.; Chiu, C.C.; Fang, K. The aqueous extract of Prunella vulgaris suppresses cell invasion and migration in human liver cancer cells by attenuating matrix metalloproteinases. Am. J. Chin. Med. 2012, 40, 643–656. [Google Scholar] [CrossRef]
- Psotova, J.; Kolar, M.; Sousek, J.; Svagera, Z.; Vicar, J.; Ulrichova, J. Biological activities of Prunella vulgaris extract. Phytother. Res. 2003, 17, 1082–1087. [Google Scholar]
- Zhang, Y.; But, P.P.H.; Xu, H.X.; Delaney, G.D.; Lee, S.H.S.; Lee, S.F. Chemical properties, mode of action, and in vivo anti-herpes activities of a lignin-carbohydrate complex from Prunella vulgaris. Antivir. Res. 2007, 75, 242–249. [Google Scholar] [CrossRef]
- Feng, L.; Jia, X.B.; Shi, F.; Chen, Y. Identification of two polysaccharides from Prunella vulgaris l. And evaluation on their anti-lung adenocarcinoma activity. Molecules 2010, 15, 5093–5103. [Google Scholar] [CrossRef]
- Fang, X.; Yu, M.M.; Yuen, W.H.; Zee, S.Y.; Chang, R.C. Immune modulatory effects of Prunella vulgaris l. On monocytes/macrophages. Int J. Mol. Med. 2005, 16, 1109–1116. [Google Scholar]
- Xu, H.X.; Lee, S.H.; Lee, S.F.; White, R.L.; Blay, J. Isolation and characterization of an anti-hsv polysaccharide from Prunella vulgaris. Antivir. Res. 1999, 44, 43–54. [Google Scholar] [CrossRef]
- Tabba, H.D.; Chang, R.S.; Smith, K.M. Isolation, purification, and partial characterization of prunellin, an anti-hiv component from aqueous extracts of Prunella vulgar. Antivir. Res. 1989, 11, 263–273. [Google Scholar] [CrossRef]
- Feng, L.; Jia, X.B.; Jiang, J.; Zhu, M.M.; Chen, Y.; Tan, X.B.; Shi, F. Combination of active components enhances the efficacy of Prunella in prevention and treatment of lung cancer. Molecules 2010, 15, 7893–7906. [Google Scholar] [CrossRef]
- Huang, N.; Hauck, C.; Yum, M.Y.; Rizshsky, L.; Widrlechner, M.P.; McCoy, J.A.; Murphy, P.A.; Dixon, P.M.; Nikolau, B.J.; Birt, D.F. Rosmarinic acid in Prunella vulgaris ethanol extract inhibits lipopolysaccharide-induced prostaglandin e2 and nitric oxide in raw 264.7 mouse macrophages. J. Agric. Food Chem. 2009, 57, 10579–10589. [Google Scholar]
- Skottova, N.; Kazdova, L.; Oliyarnyk, O.; Vecera, R.; Sobolova, L.; Ulrichova, J. Phenolics-rich extracts from silybum marianum and Prunella vulgaris reduce a high-sucrose diet induced oxidative stress in hereditary hypertriglyceridemic rats. Pharmacol. Res. 2004, 50, 123–130. [Google Scholar] [CrossRef]
- Zdařilová, A.; Svobodová, A.; Šimánek, V.; Ulrichová, J. Prunella vulgaris extract and rosmarinic acid suppress lipopolysaccharide-induced alteration in human gingival fibroblasts. Toxicol. In Vitro 2009, 23, 386–392. [Google Scholar]
- Du, D.; Cheng, Z.; Chen, D. A new unusual delta11(12)-oleane triterpene and anti-complementary triterpenes from Prunella vulgaris spikes. Nat. Prod. Commun 2012, 7, 501–505. [Google Scholar]
- Geuenich, S.; Goffinet, C.; Venzke, S.; Nolkemper, S.; Baumann, I.; Plinkert, P.; Reichling, J.; Keppler, O.T. Aqueous extracts from peppermint, sage and lemon balm leaves display potent anti-hiv-1 activity by increasing the virion density. Retrovirology 2008, 5, 27. [Google Scholar] [CrossRef]
- Ryu, S.Y.; Oak, M.H.; Yoon, S.K.; Cho, D.I.; Yoo, G.S.; Kim, T.S.; Kim, K.M. Anti-allergic and anti-inflammatory triterpenes from the herb of Prunella vulgaris. Planta Med. 2000, 66, 358–360. [Google Scholar] [CrossRef]
- Jun, M.S.; Kim, H.S.; Kim, Y.M.; Kim, H.J.; Park, E.J.; Lee, J.H.; Lee, K.R.; Kim, Y.S.; Chang, K.C. Ethanol extract of Prunella vulgaris var. Lilacina inhibits hmgb1 release by induction of heme oxygenase-1 in lps-activated raw 264.7 cells and clp-induced septic mice. Phytother. Res. PTR 2012, 26, 605–612. [Google Scholar] [CrossRef]
- Qu, L.; Widrlechner, M.P. Variation in the breeding system of Prunella vulgaris l. HortScience 2011, 46, 688–692. [Google Scholar]
- Charlesworth, D. Evolution of plant breeding systems. Curr. Biol. 2006, 16, R726–735. [Google Scholar] [CrossRef]
- Bocher, T. Racial divergences in Prunella vulgaris in relation to habitat and climate. New Phytologist 1949, 48, 285–314. [Google Scholar]
- Nelson, A.P. Relationships between two subspecies in a population of Prunella vulgaris l. Evolution 1963, 18, 43–51. [Google Scholar] [CrossRef]
- Schmid, B. Clonal growth in grassland perennials iii. Genetic variation and plasticity between and within populations of bellis perennis and Prunella vulgaris. J. Ecol. 1985, 73, 819–830. [Google Scholar] [CrossRef]
- Winn, A.; Gross, K. Latitudinal variation in seed weight and flower number in Prunella vulgaris. Oecologia 1993, 93, 55–62. [Google Scholar]
- Brindley, M.A.; Widrlechner, M.P.; McCoy, J.A.; Murphy, P.; Hauck, C.; Rizshsky, L.; Nikolau, B.; Maury, W. Inhibition of lentivirus replication by aqueous extracts of Prunella vulgaris. Virol. J. 2009, 6, 8. [Google Scholar] [CrossRef]
- Chen, Y.; Guo, Q.; Zhu, Z.; Zhang, L. Changes in bioactive components related to the harvest time from the spicas of Prunella vulgaris. Pharm. Biol. 2012, 50, 1118–1122. [Google Scholar] [CrossRef]
- Center for Research on Botanical Dietary Supplements. Available online: http://www.nwrc.iastate.edu/botanical/ (accessed on 12 November 2012).
- USDA-ARS GRIN. Available online: http://www.ars-grin.gov/npgs/index.html (accessed on 12 November 2012).
- Dehaven, C.D.; Evans, A.M.; Dai, H.; Lawton, K.A. Organization of gc/ms and lc/ms metabolomics data into chemical libraries. J. Cheminform. 2010, 2, 9. [Google Scholar] [CrossRef]
- Kind, T.; Fiehn, O. Advances in structure elucidation of small molecules using mass spectrometry. Bioanal. Rev. 2010, 2, 23–60. [Google Scholar] [CrossRef]
- Dixon, P.M.; Wu, L.; Widrlechner, M.P.; Wurtele, E.S. Weighted Distance Measures for Metabolomic Data; Iowa State University: Ames, IA, 2009; pp. 1–8. [Google Scholar]
- Bais, P.; Moon-Quanbeck, S.M.; Nikolau, B.J.; Dickerson, J.A. Plantmetabolomics.Org: Mass spectrometry-based arabidopsis metabolomics--database and tools update. Nucleic Acids Res. 2012, 40, D1216–1220. [Google Scholar] [CrossRef]
- Perera, M.A.; Qin, W.; Yandeau-Nelson, M.; Fan, L.; Dixon, P.; Nikolau, B.J. Biological origins of normal-chain hydrocarbons: A pathway model based on cuticular wax analyses of maize silks. Plant. J. 2010, 64, 618–632. [Google Scholar]
- MacQueen, J. Some Methods for Classification and Analysis of Multivariate Observations; Fifth Berkeley Symposium on Mathematical Statistics and Probability, Statistical Laboratory of the University of California, Berkeley, 1967; Cam, L.M.L., Neyman, J., Eds.; University of California Press: Berkeley, CL, USA; pp. 281–297.
- Dobler, S.; Petschenka, G.; Pankoke, H. Coping with toxic plant compounds--the insect's perspective on iridoid glycosides and cardenolides. Phytochemistry 2011, 72, 1593–1604. [Google Scholar] [CrossRef]
- Schoner, W.; Scheiner-Bobis, G. Endogenous and exogenous cardiac glycosides and their mechanisms of action. Am. J. Cardiovasc. Drugs 2007, 7, 173–189. [Google Scholar] [CrossRef]
- Withering, W. An account of the foxglove and some of its medical uses: With practical remarks on dropsy and other diseases. In The Classics of Medicine Library; Adams, L.B., Jr., Ed.; Division of Gryphone Editions, Ltd.: Birmingham, Alabama, USA, 1785. [Google Scholar]
- Wiegrebe, H.; Wichtl, M. High-performance liquid-chromatographic determination of cardenolides in Digitalis leaves after solid-phase extraction. J. Chromatogr. 1993, 630, 402–407. [Google Scholar] [CrossRef]
- Krenn, L.; Kopp, B. Bufadienolides from animal and plant sources. Phytochemistry 1998, 48, 1–29. [Google Scholar]
- Heasley, B. Chemical synthesis of the cardiotonic steroid glycosides and related natural products. Chemistry 2012, 18, 3092–3120. [Google Scholar] [CrossRef]
- Kreis, W.; Hensel, A.; Stuhlemmer, U. Cardenolide biosynthesis in foxglove. Planta Medica 1998, 64, 491–499. [Google Scholar] [CrossRef]
- Herl, V.; Fischer, G.; Müller-Uri, F.; Kreis, W. Molecular cloning and heterologous expression of progesterone 5beta-reductase from Digitalis lanata ehrh. Phytochemistry 2006, 67, 225–231. [Google Scholar] [CrossRef]
- Ohyama, K.; Suzuki, M.; Kikuchi, J.; Saito, K.; Muranaka, T. Dual biosynthetic pathways to phytosterol via cycloartenol and lanosterol in arabidopsis. Proc. Natl. Acad. Sci. USA 2009, 106, 725–730. [Google Scholar]
- Risley, J.M. Cholesterol biosynthesis: Lanosterol to cholesterol. J. Chem.Edu. 2002, 79, 377–384. [Google Scholar] [CrossRef]
- Yeo, Y.S.; Nybo, E.; Chittiboyina, A.G.; Weerasooriya, A.D.; Wang, Y.H.; Góngora-Castillo, E.; Vaillancourt, B.; Buell, C.R.; Penna, D.; Celiz, M.D.; et al. Functional identification of valerena-1,10-diene synthase, a terpene synthase catalyzing a unique chemical cascade in the biosynthesis of biologically active sesquiterpenes in Valeriana officinalis. J. Bio. Chem. 2012. Submitted for publication. [Google Scholar]
- Javascript charting package Highcharts. Available online: http://www.highcharts.com/ (accessed on 12 November 2012).
- JQuery. Available online: http://jquery.org/ (accessed on 12 November 2012).
- Asynchronous Javascript and XML. Available online: http://developer.mozilla.org/en-US/docs/AJAX (accessed on 12 November 2012).
- Lee, J.W.; Na, D.; Park, J.M.; Lee, J.; Choi, S.; Lee, S.Y. Systems metabolic engineering of microorganisms for natural and non-natural chemicals. Nat. Chem. Biol. 2012, 8, 536–546. [Google Scholar] [CrossRef]
© 2012 by the authors; licensee MDPI, Basel, Switzerland. This article is an open-access article distributed under the terms and conditions of the Creative Commons Attribution license (http://creativecommons.org/licenses/by/3.0/).
Share and Cite
Wurtele, E.S.; Chappell, J.; Jones, A.D.; Celiz, M.D.; Ransom, N.; Hur, M.; Rizshsky, L.; Crispin, M.; Dixon, P.; Liu, J.; et al. Medicinal Plants: A Public Resource for Metabolomics and Hypothesis Development. Metabolites 2012, 2, 1031-1059. https://doi.org/10.3390/metabo2041031
Wurtele ES, Chappell J, Jones AD, Celiz MD, Ransom N, Hur M, Rizshsky L, Crispin M, Dixon P, Liu J, et al. Medicinal Plants: A Public Resource for Metabolomics and Hypothesis Development. Metabolites. 2012; 2(4):1031-1059. https://doi.org/10.3390/metabo2041031
Chicago/Turabian StyleWurtele, Eve Syrkin, Joe Chappell, A. Daniel Jones, Mary Dawn Celiz, Nick Ransom, Manhoi Hur, Ludmila Rizshsky, Matthew Crispin, Philip Dixon, Jia Liu, and et al. 2012. "Medicinal Plants: A Public Resource for Metabolomics and Hypothesis Development" Metabolites 2, no. 4: 1031-1059. https://doi.org/10.3390/metabo2041031