Changes in Primary and Secondary Metabolite Levels in Response to Gene Targeting-Mediated Site-Directed Mutagenesis of the Anthranilate Synthase Gene in Rice

 and
and
Abstract
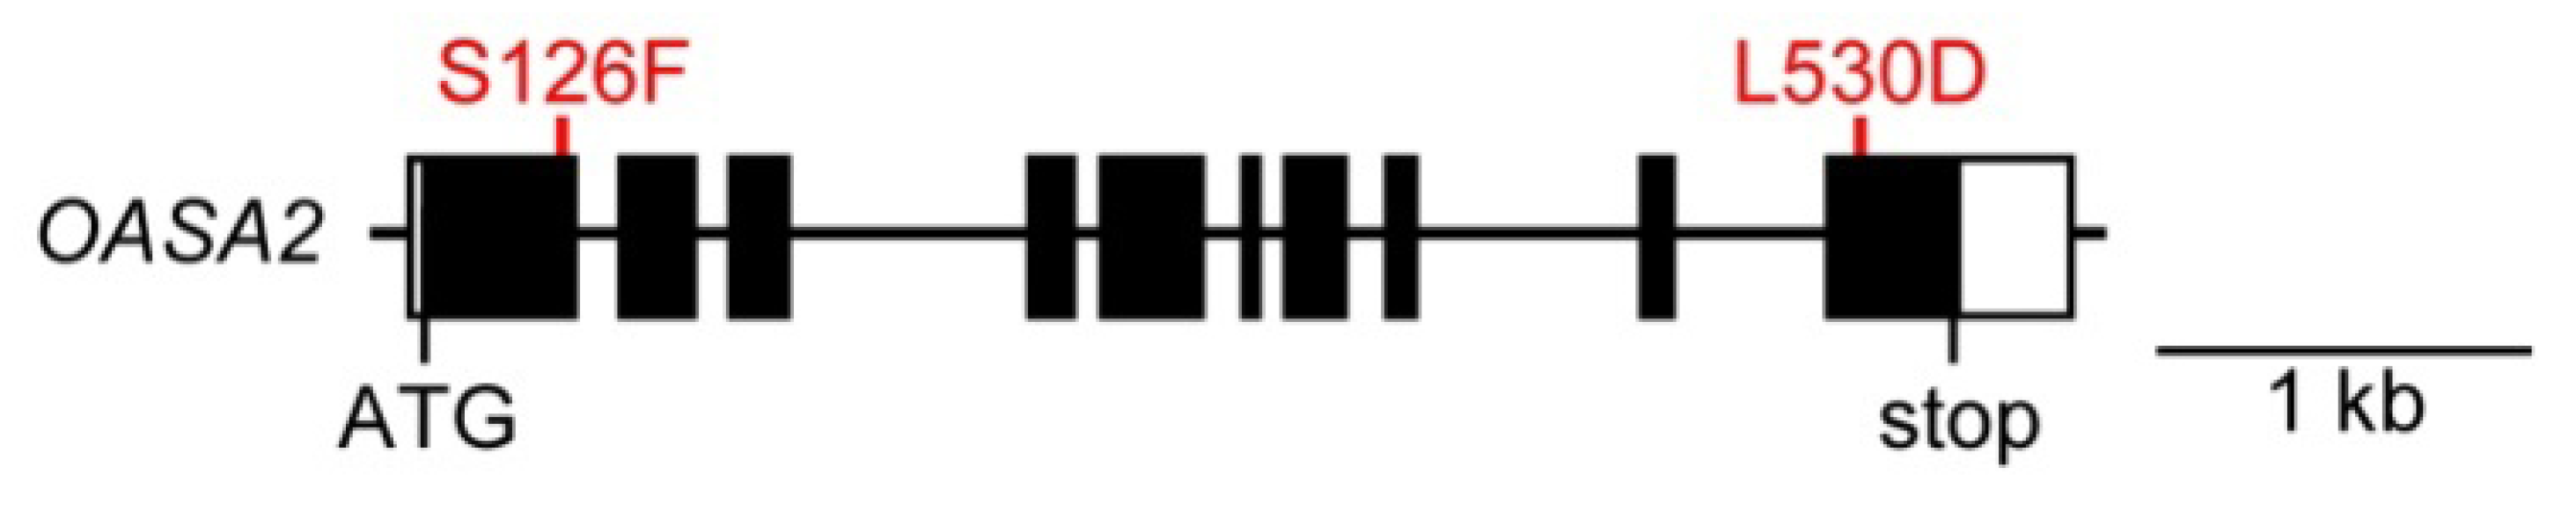
:1. Introduction

2. Results
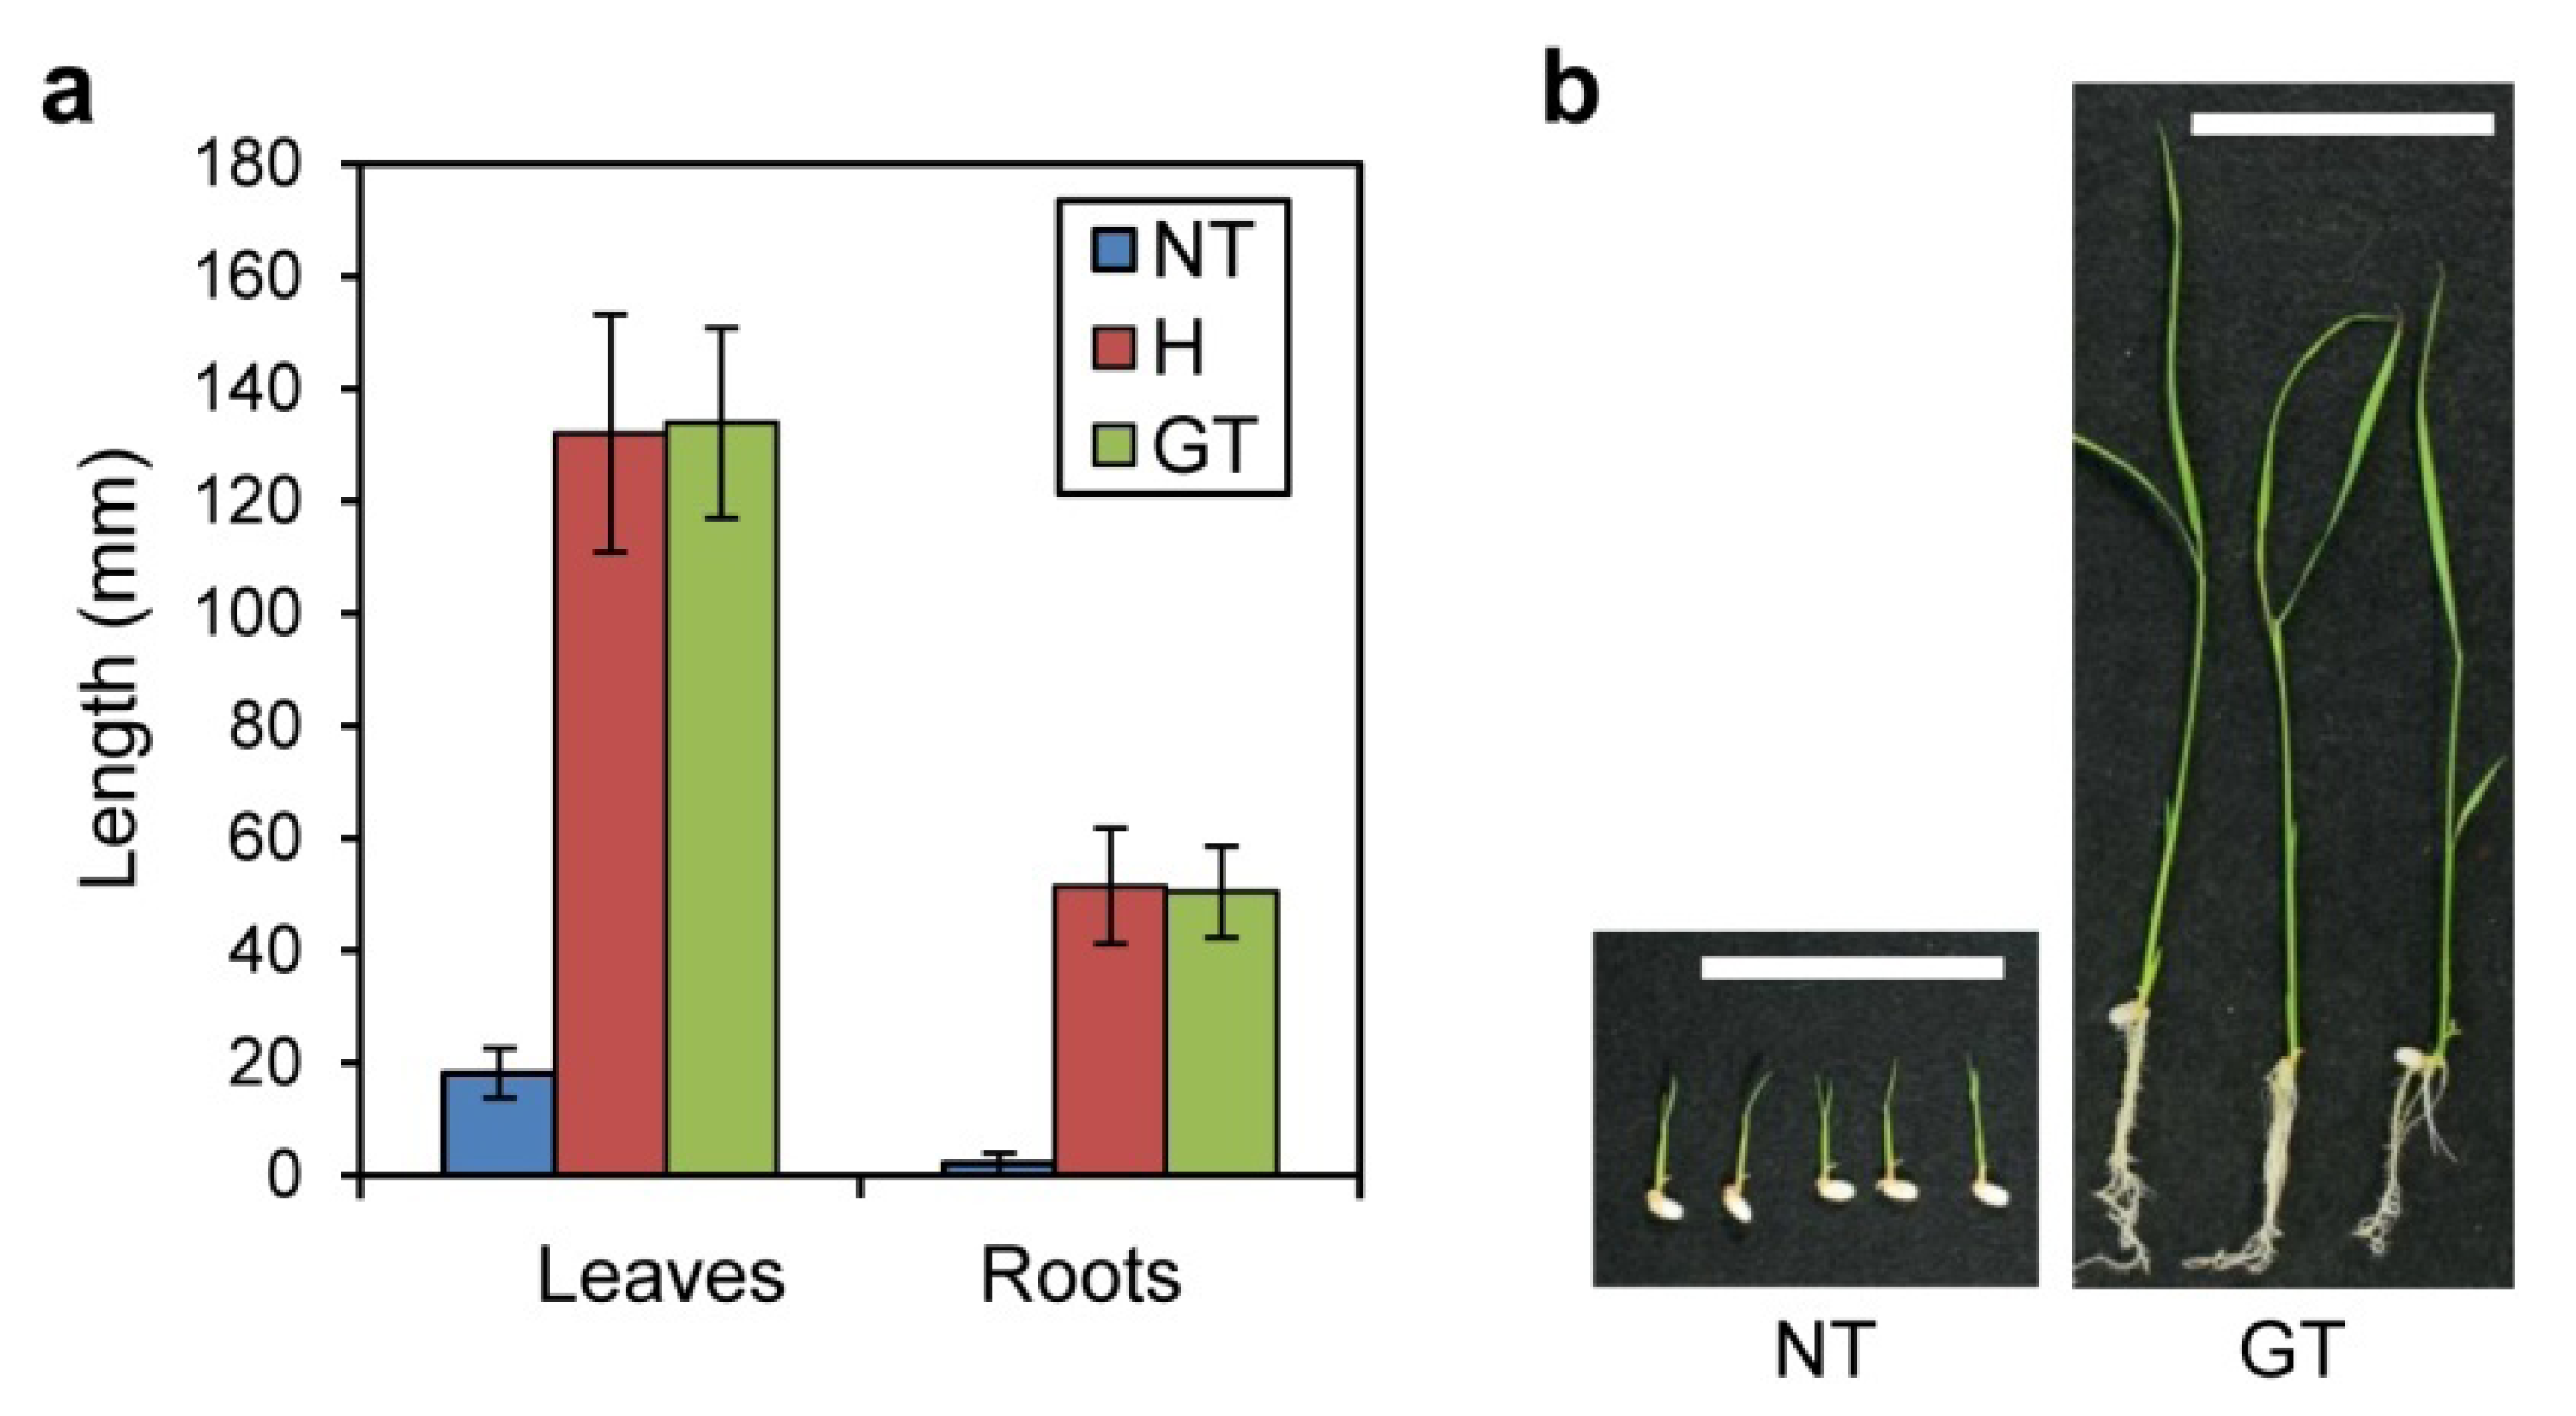
2.1. 5MT Sensitivity of GT Plants

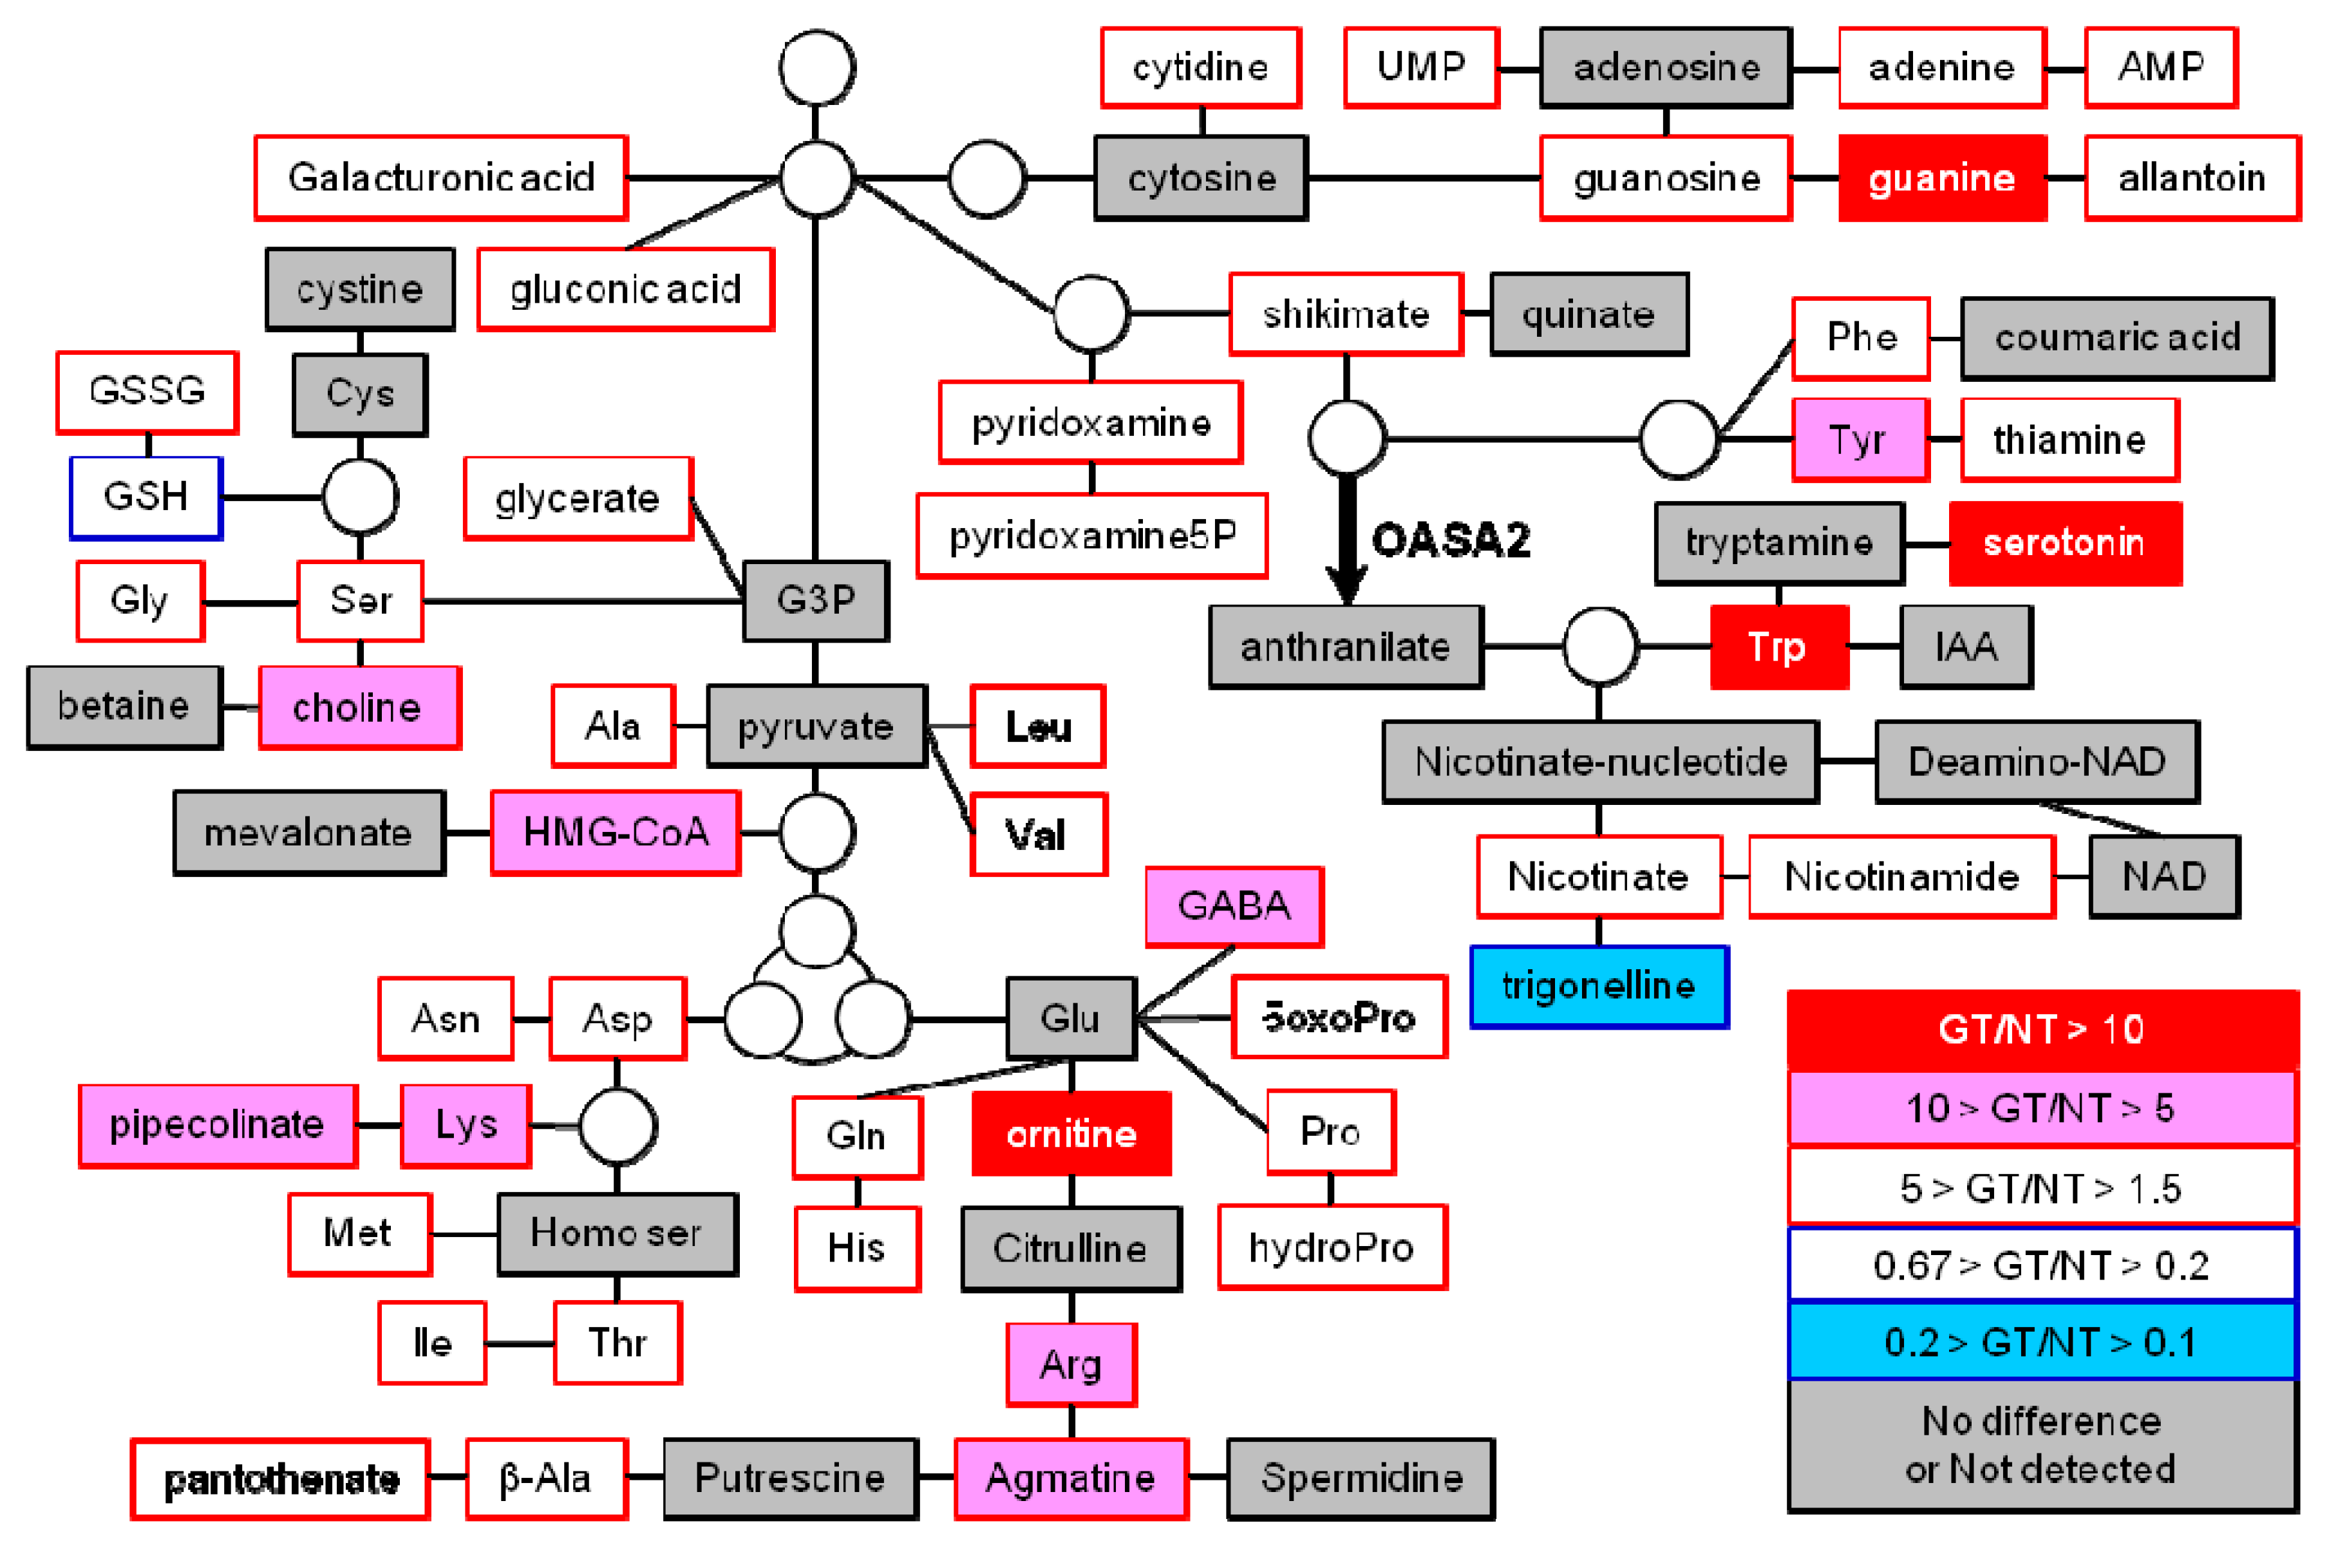
2.2. Primary and Secondary Metabolites Involved in Amino Acid Metabolism in GT Plants


| metabolites | Mature seeds | Leaves | ||||||||||||
| NT1 | GT1 | Fold change2 | NT1 | GT1 | Fold change2 | |||||||||
| Arg | 0.702 | ± | 0.316 | 5.802 | ± | 1.985 | 8.27 | 17.506 | ± | 5.638 | 29.345 | ± | 5.385 | 1.68 |
| Asn | 4.249 | ± | 2.034 | 11.190 | ± | 0.740 | 2.63 | 34.053 | ± | 8.110 | 51.133 | ± | 11.145 | 1.50 |
| Ile | 0.158 | ± | 0.036 | 0.342 | ± | 0.038 | 2.16 | 6.838 | ± | 1.382 | 12.030 | ± | 3.354 | 1.76 |
| Leu | 0.156 | ± | 0.047 | 0.320 | ± | 0.032 | 2.06 | 4.613 | ± | 0.861 | 9.353 | ± | 2.143 | 2.03 |
| Lys | 0.154 | ± | 0.060 | 1.471 | ± | 0.654 | 9.55 | 4.848 | ± | 1.581 | 11.085 | ± | 2.262 | 2.29 |
| Met | 0.05 | ± | 0.021 | 0.080 | ± | 0.033 | 1.61 | 0.575 | ± | 0.257 | 0.980 | ± | 0.453 | 1.71 |
| Trp | 0.456 | ± | 0.275 | 26.286 | ± | 16.105 | 57.59 | 5.270 | ± | 1.563 | 34.481 | ± | 4.896 | 6.54 |
| Val | 0.414 | ± | 0.071 | 1.434 | ± | 0.284 | 3.47 | 12.244 | ± | 1.805 | 19.670 | ± | 4.225 | 1.61 |
| Ornithine | 0.002 | ± | 0.003 | 0.034 | ± | 0.013 | 16.16 | 0.248 | ± | 0.114 | 1.116 | ± | 0.492 | 4.50 |
| Agmatine | 0.001 | ± | 0.002 | 0.011 | ± | 0.005 | 8.82 | 0.021 | ± | 0.010 | 0.123 | ± | 0.050 | 5.84 |
| Pyridoxamine | 0.002 | ± | 0.002 | 0.008 | ± | 0.003 | 4.10 | 0.015 | ± | 0.002 | 0.025 | ± | 0.008 | 1.67 |
| Thiamine | 0.054 | ± | 0.006 | 0.092 | ± | 0.012 | 1.71 | 0.128 | ± | 0.021 | 0.214 | ± | 0.037 | 1.68 |
| 5-OxoPro | 0.047 | ± | 0.011 | 0.087 | ± | 0.024 | 1.85 | 0.264 | ± | 0.152 | 0.559 | ± | 0.247 | 2.12 |
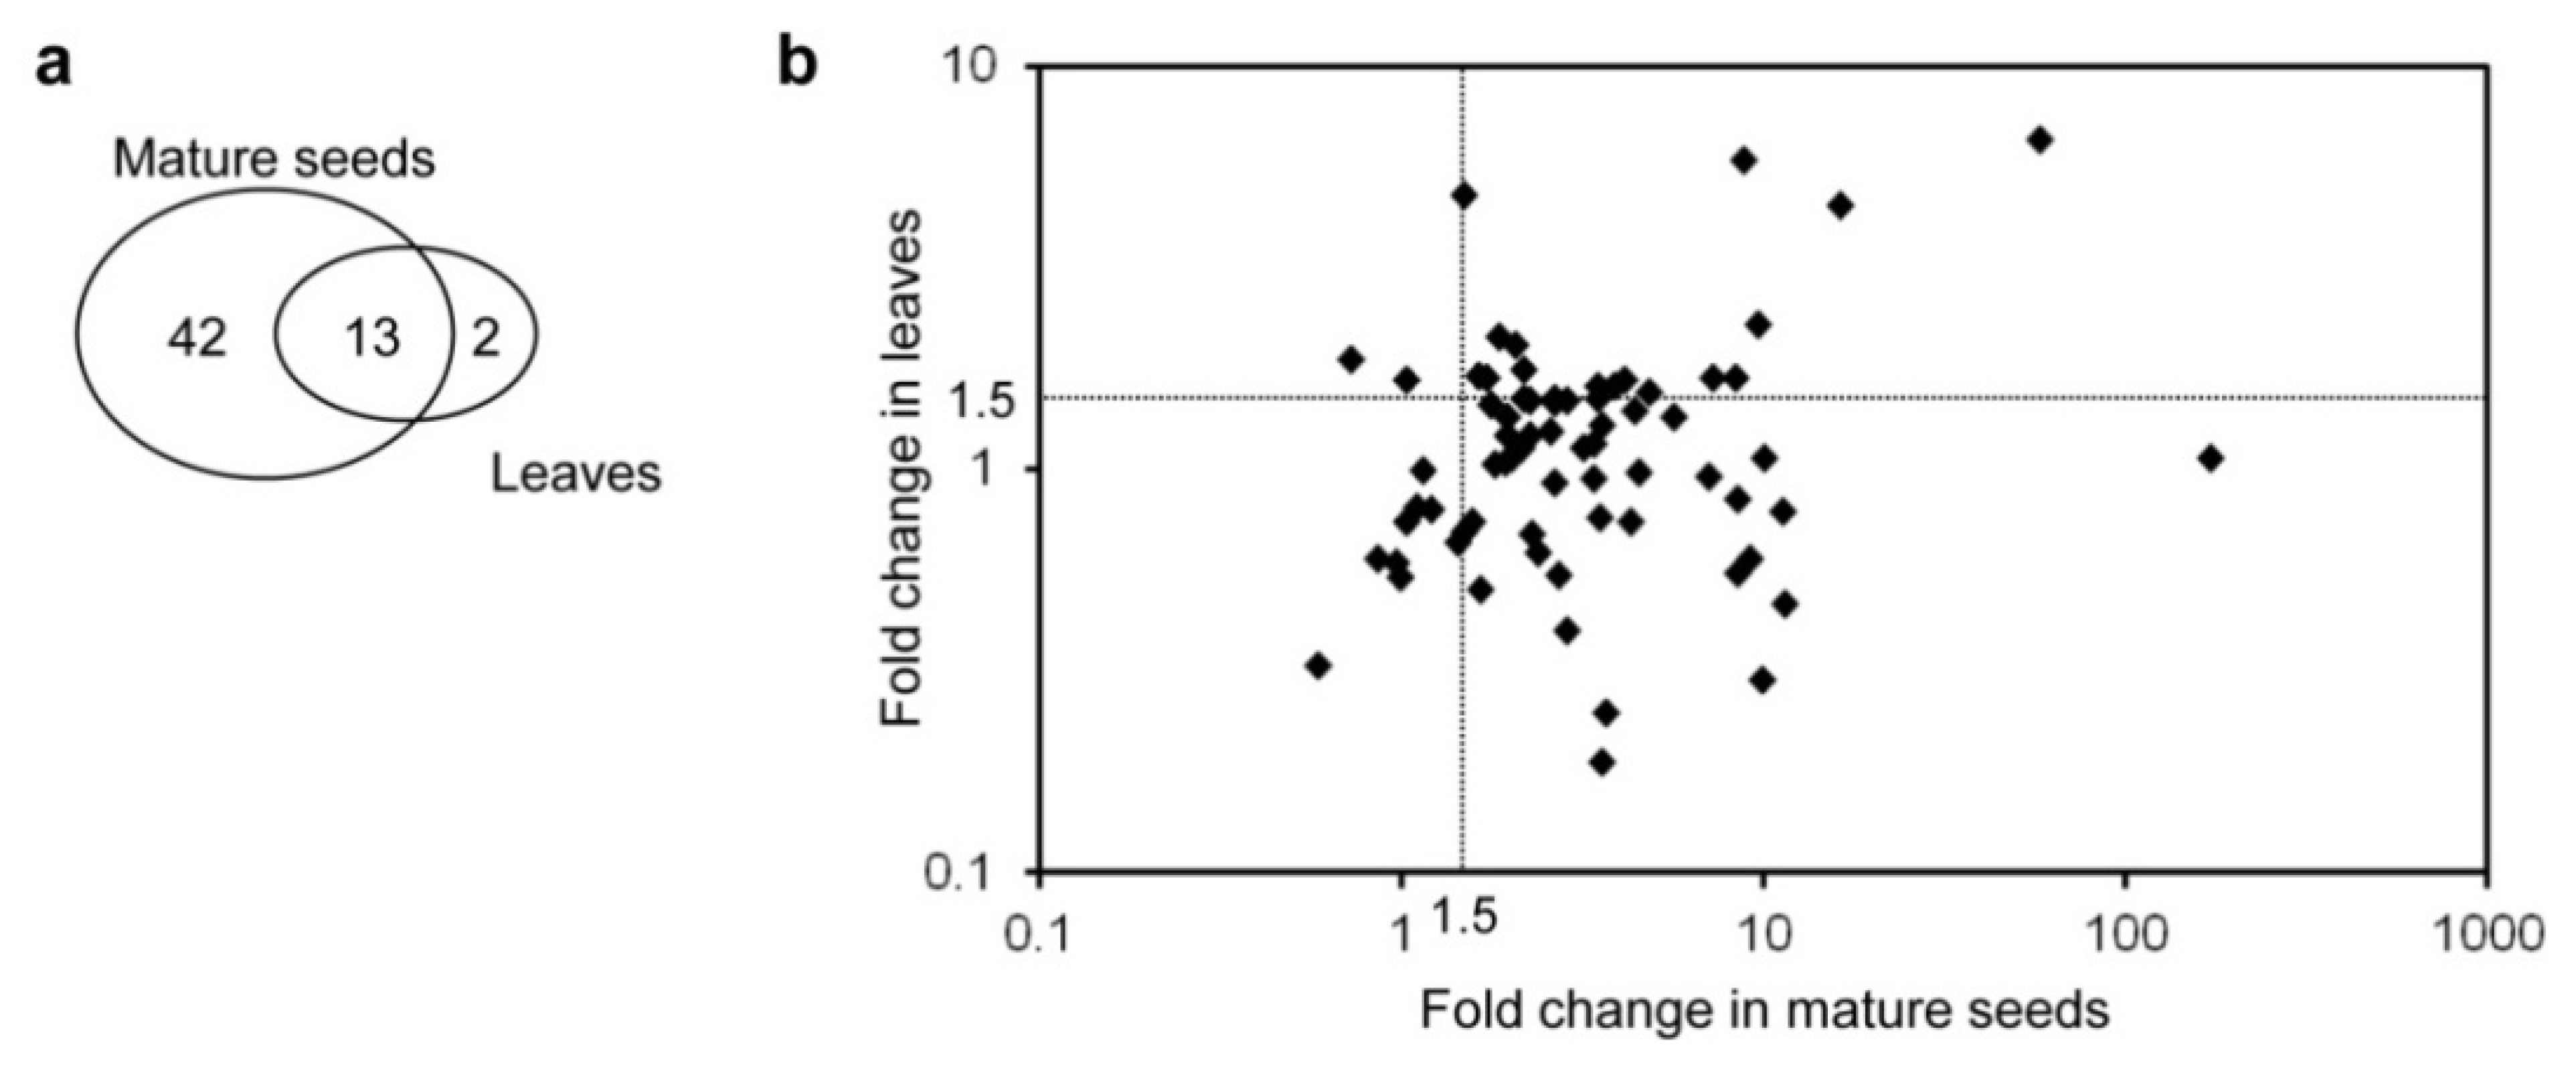
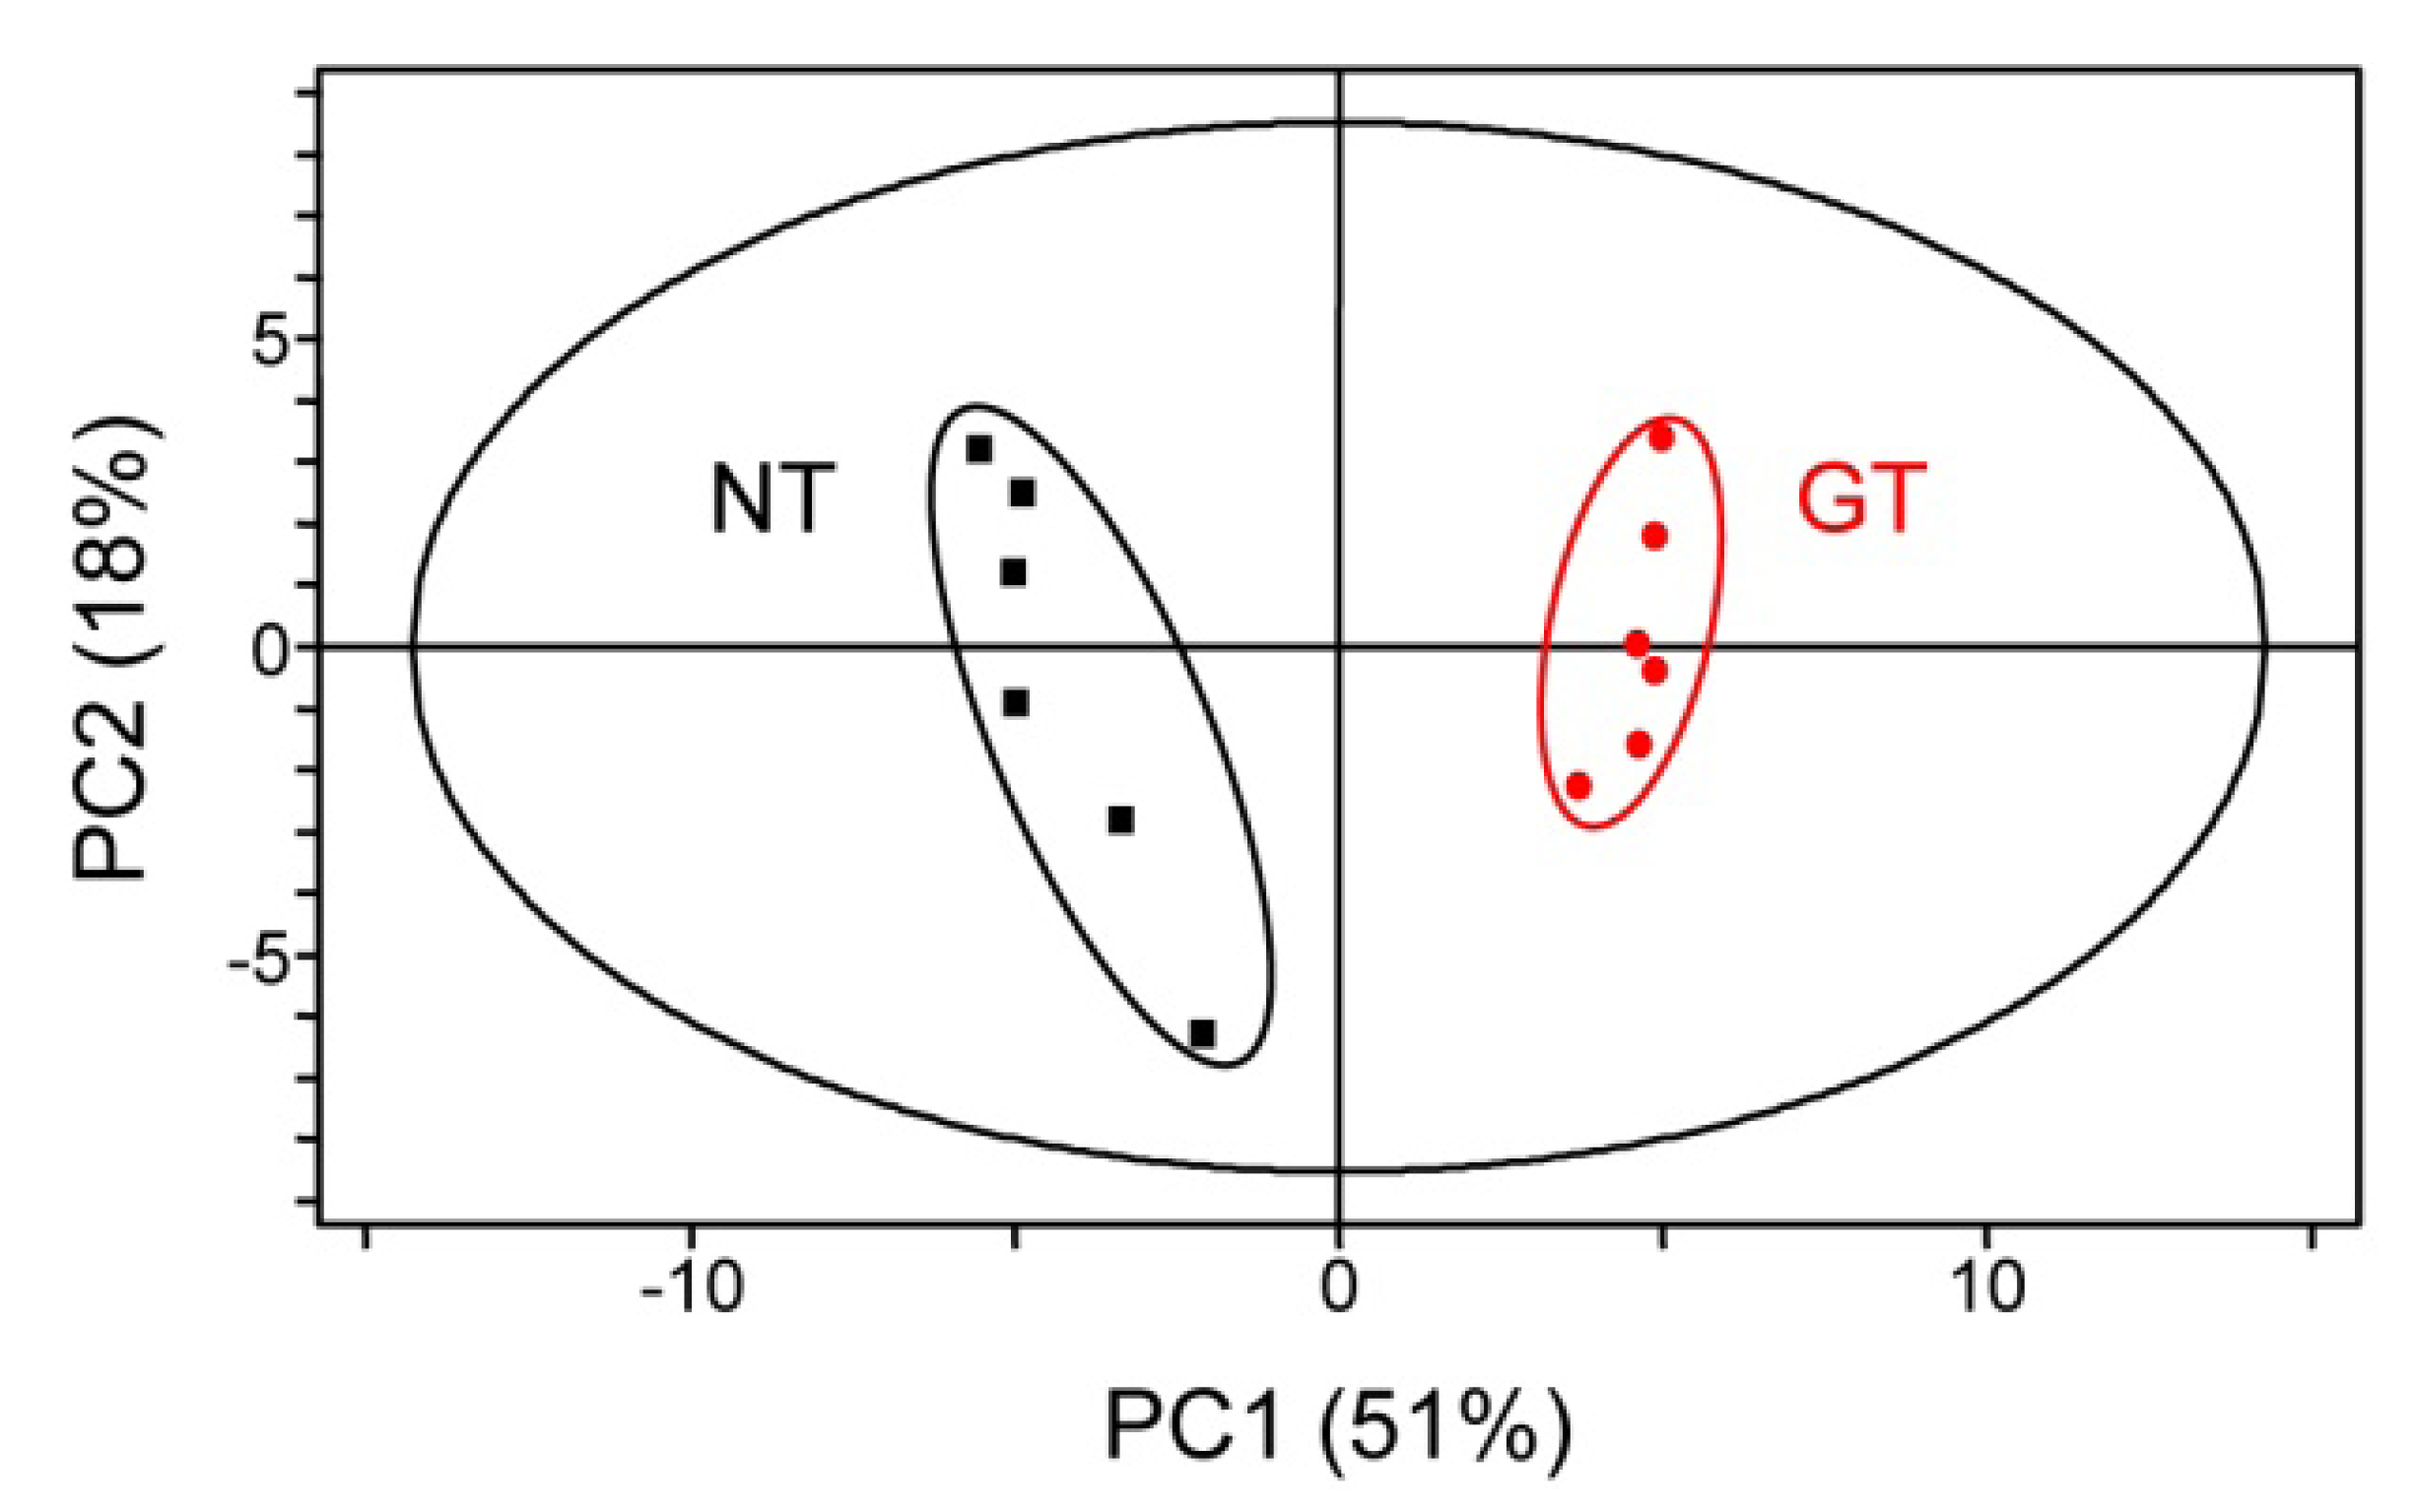
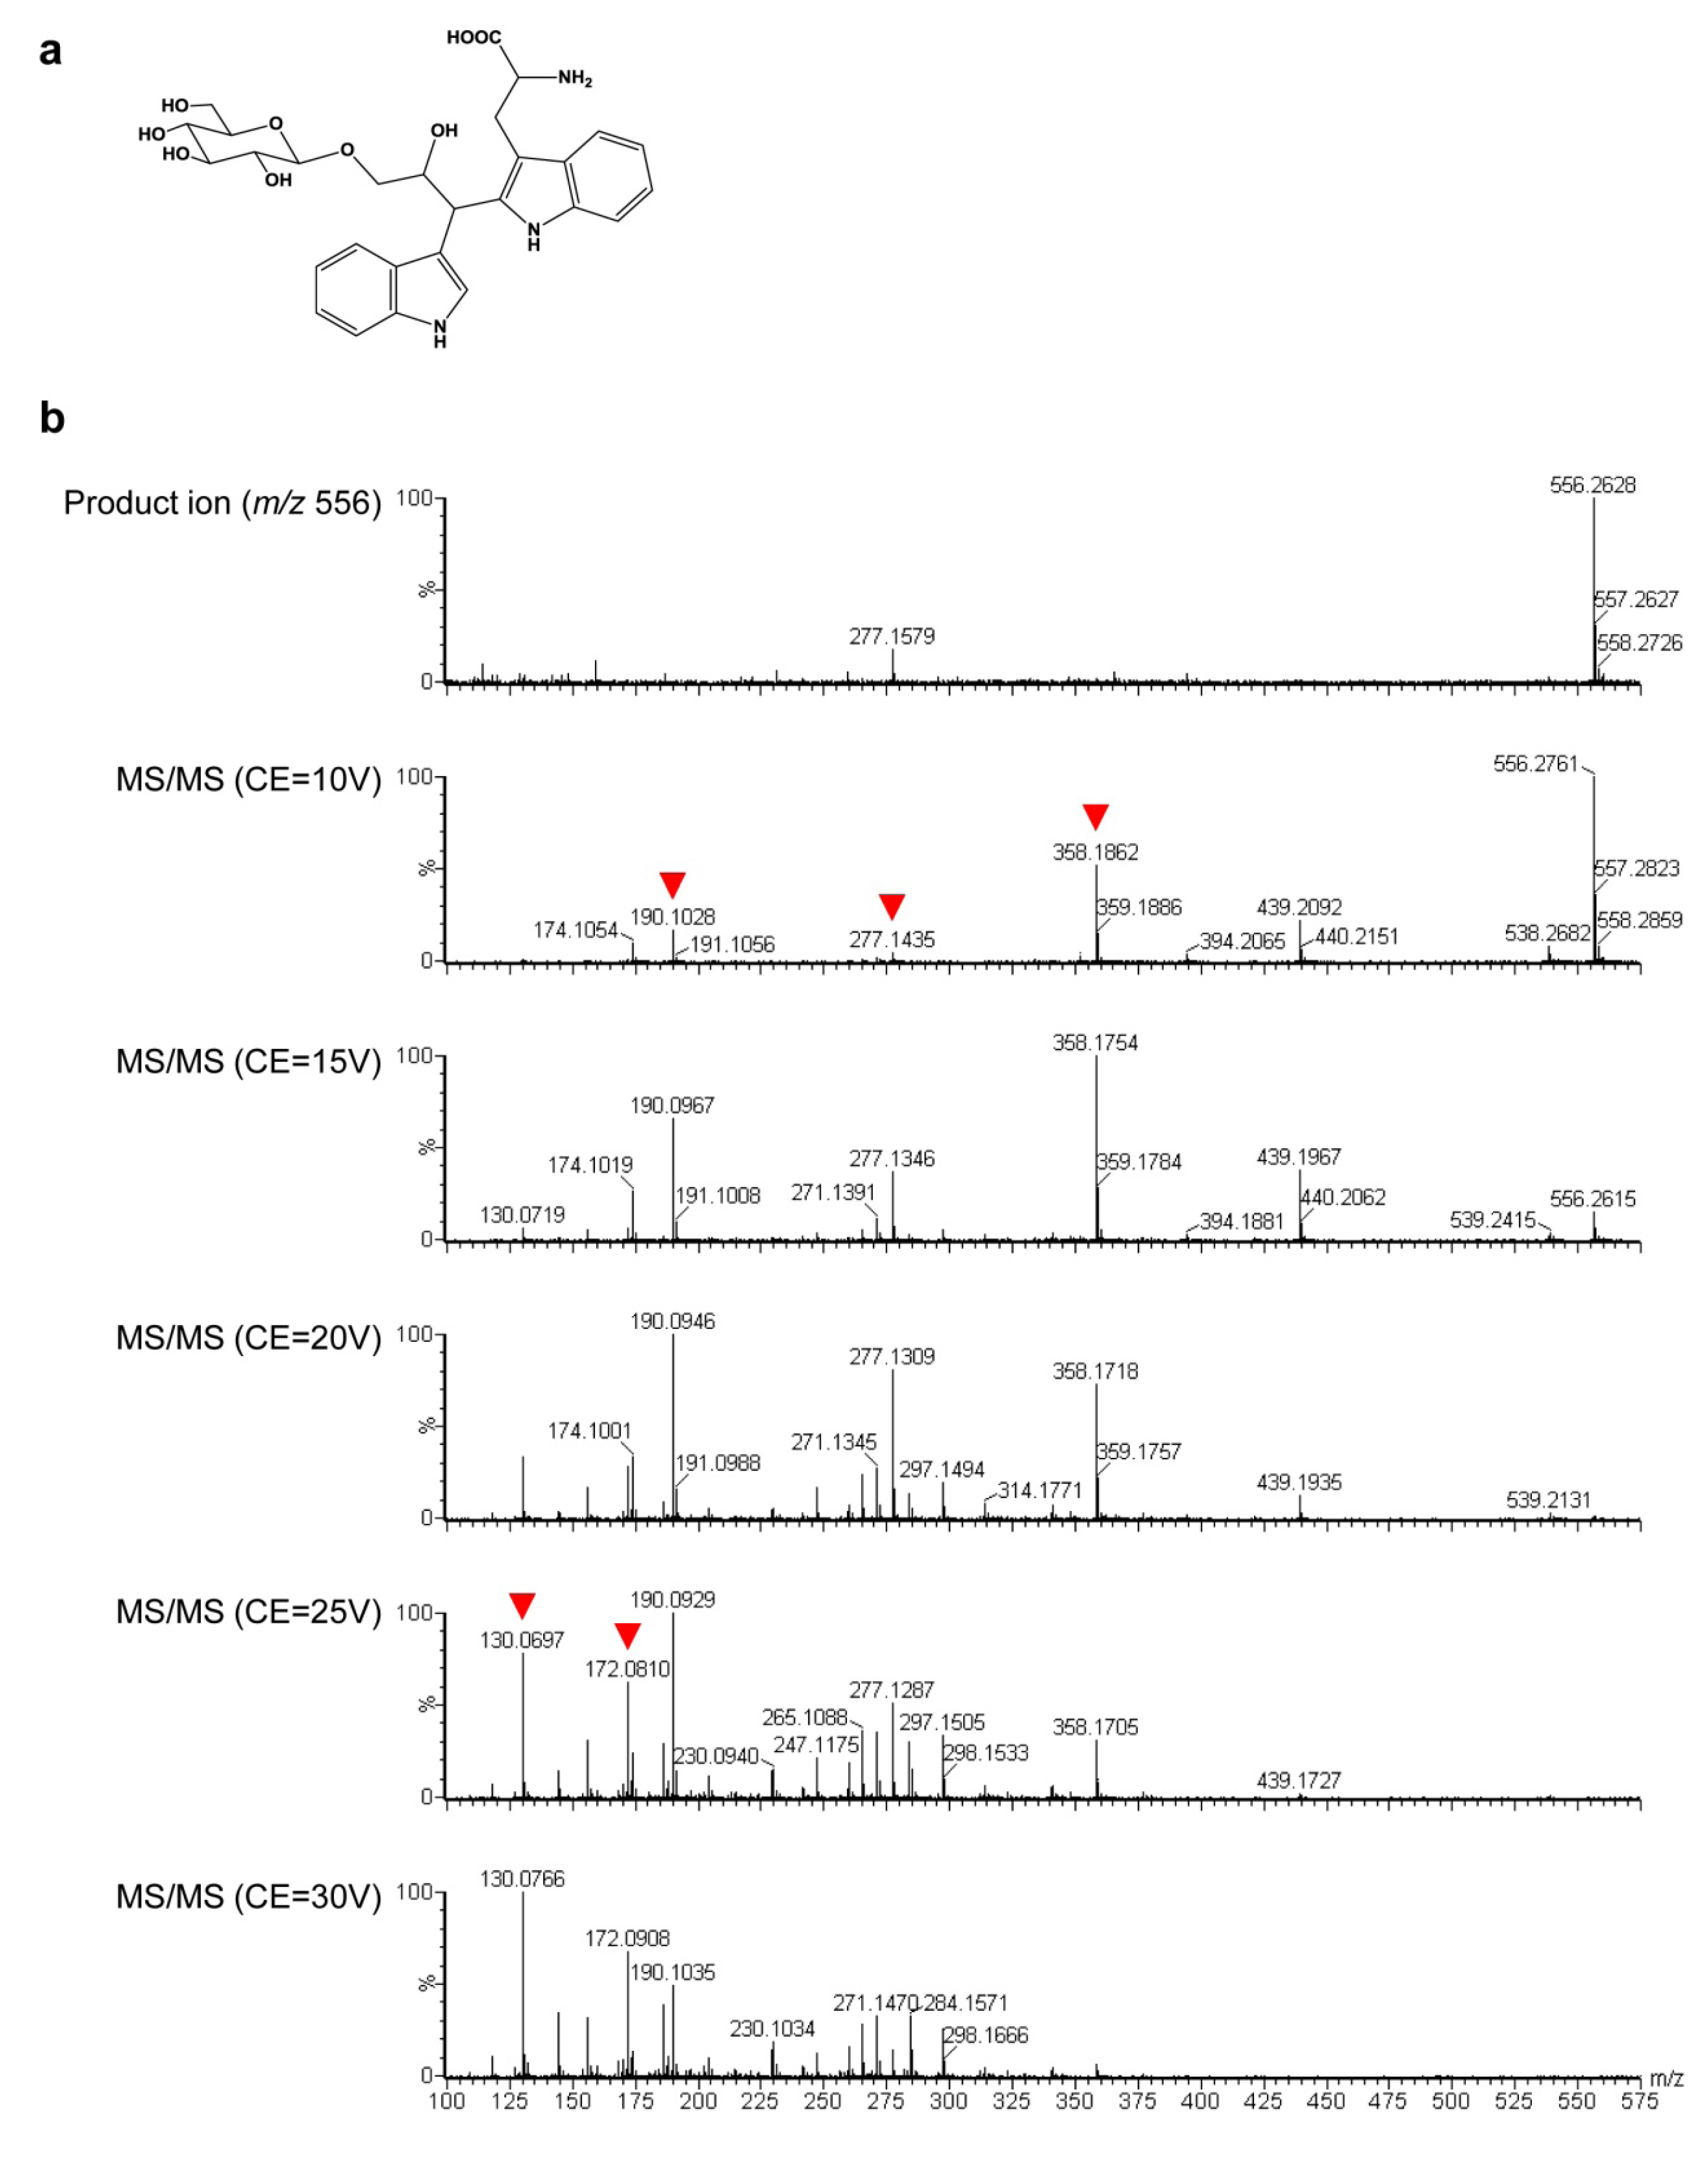
2.3. Untargeted LC-MS Metabolic Profiling Analysis in GT Plants


3. Discussion
4. Experimental Section
4.1. Plant Materials
4.2. 5MT Sensitivity Test
4.3. Metabolome Analysis Using CE-MS and Measurement of Amino Acid Contents
4.4. Untargeted Metabolome Analysis Using LC-MS
5. Conclusions
Acknowledgments
Conflict of Interest
References
- Lim, E.K.; Bowles, D. Plant production systems for bioactive small molecules. Curr. Opin. Biotechnol. 2012, 23, 271–277. [Google Scholar] [CrossRef]
- Ye, X.D.; Al-Babili, S.; Kloti, A.; Zhang, J.; Lucca, P.; Beyer, P.; Potrykus, I. Engineering the provitamin A (β-carotene) biosynthetic pathway into (carotenoid-free) rice endosperm. Science 2000, 287, 303–305. [Google Scholar]
- Tozawa, Y.; Hasegawa, H.; Terakawa, T.; Wakasa, K. Characterization of rice anthranilate synthase alpha-subunit genes OASA1 and OASA2. Tryptophan accumulation in transgenic rice expressing mutant of OASA1. Plant Physiol. 2001, 126, 1493–1506. [Google Scholar] [CrossRef]
- Saika, H.; Oikawa, A.; Matsuda, F.; Onodera, H.; Saito, K.; Toki, S. Application of gene targeting to designed mutation breeding of high-tryptophan rice. Plant Physiol. 2011, 156, 1269–1277. [Google Scholar] [CrossRef]
- Wakasa, K.; Widholm, J.M. A 5-methyltryptophan resistant rice mutant, MTR1, selected in tissue-culture. Theor. Appl. Genet. 1987, 74, 49–54. [Google Scholar] [CrossRef]
- Lee, H.Y.; Kameya, T. Selection and characterization of a rice mutant resistant to 5-methyltryptophan. Theor. Appl. Genet. 1991, 82, 405–408. [Google Scholar] [CrossRef]
- Kim, D.S.; Lee, I.S.; Jang, C.S.; Kang, S.Y.; Seo, Y.W. Characterization of the altered anthranilate synthase in 5-methyltryptophan-resistant rice mutants. Plant Cell Rep. 2005, 24, 357–365. [Google Scholar]
- Chun, J.B.; Ha, B.K.; Jang, D.S.; Song, M.; Lee, K.J.; Kim, J.B.; Kim, S.H.; Kang, S.Y.; Lee, G.J.; Seo, Y.W.; et al. Identification of mutations in OASA1 gene from a gamma-irradiated rice mutant population. Plant Breed. 2012, 131, 276–281. [Google Scholar] [CrossRef]
- Wakasa, K.; Hasegawa, H.; Nemoto, H.; Matsuda, F.; Miyazawa, H.; Tozawa, Y.; Morino, K.; Komatsu, A.; Yamada, T.; Terakawa, T.; et al. High-level tryptophan accumulation in seeds of transgenic rice and its limited effects on agronomic traits and seed metabolite profile. J. Exp. Bot. 2006, 57, 3069–3078. [Google Scholar]
- Dubouzet, J.G.; Ishihara, A.; Matsuda, F.; Miyagawa, H.; Iwata, H.; Wakasa, K. Integrated metabolomic and transcriptomic analyses of high-tryptophan rice expressing a mutant anthranilate synthase alpha subunit. J. Exp. Bot. 2007, 58, 3309–3321. [Google Scholar]
- Morino, K.; Matsuda, F.; Miyazawa, H.; Sukegawa, A.; Miyagawa, H.; Wakasa, K. Metabolic profiling of tryptophan-overproducing rice calli that express a feedback-insensitive alpha subunit of anthranilate synthase. Plant Cell Physiol. 2005, 46, 514–521. [Google Scholar] [CrossRef]
- Matsuda, F.; Ishihara, A.; Takanashi, K.; Morino, K.; Miyazawa, H.; Wakasa, K.; Miyagawa, H. Metabolic profiling analysis of genetically modified rice seedlings that overproduce tryptophan reveals the occurrence of its inter-tissue translocation. Plant Biotechnol. 2010, 27, 17–27. [Google Scholar] [CrossRef]
- Kanno, T.; Kasai, K.; Ikejiri-Kanno, Y.; Wakasa, K.; Tozawa, Y. In vitro reconstitution of rice anthranilate synthase: Distinct functional properties of the alpha subunits OASA1 and OASA2. Plant Mol. Biol. 2004, 54, 11–23. [Google Scholar] [CrossRef]
- Kanno, T.; Komatsu, A.; Kasai, K.; Dubouzet, J.G.; Sakurai, M.; Ikejiri-Kanno, Y.; Wakasa, K.; Tozawa, Y. Structure-based in vitro engineering of the anthranilate synthase, a metabolic key enzyme in the plant tryptophan pathway. Plant Physiol. 2005, 138, 2260–2268. [Google Scholar] [CrossRef]
- Terada, R.; Urawa, H.; Inagaki, Y.; Tsugane, K.; Iida, S. Efficient gene targeting by homologous recombination in rice. Nat. Biotechnol. 2002, 20, 1030–1034. [Google Scholar] [CrossRef]
- Ono, A.; Yamaguchi, K.; Fukada-Tanaka, S.; Terada, R.; Mitsui, T.; Iida, S. A null mutation of ROS1a for DNA demethylation in rice is not transmittable to progeny. Plant J. 2012, 71, 564–574. [Google Scholar] [CrossRef]
- Terada, R.; Johzuka-Hisatomi, Y.; Saitoh, M.; Asao, H.; Iida, S. Gene targeting by homologous recombination as a biotechnological tool for rice functional genomics. Plant Physiol. 2007, 144, 846–856. [Google Scholar] [CrossRef]
- Yamauchi, T.; Johzuka-Hisatomi, Y.; Fukada-Tanaka, S.; Terada, R.; Nakamura, I.; Iida, S. Homologous recombination-mediated knock-in targeting of the MET1a gene for a maintenance DNA methyltransferase reproducibly reveals dosage-dependent spatiotemporal gene expression in rice. Plant J. 2009, 60, 386–396. [Google Scholar] [CrossRef]
- Moritoh, S.; Eun, C.H.; Ono, A.; Asao, H.; Okano, Y.; Yamaguchi, K.; Shimatani, Z.; Koizumi, A.; Terada, R. Targeted disruption of an orthologue of DOMAINS REARRANGED METHYLASE 2, OsDRM2, impairs the growth of rice plants by abnormal DNA methylation. Plant J. 2012, 71, 85–98. [Google Scholar] [CrossRef]
- Ozawa, K.; Wakasa, Y.; Ogo, Y.; Matsuo, K.; Kawahigashi, H.; Takaiwa, F. Development of an efficient agrobacterium-mediated gene targeting system for rice and analysis of rice knockouts lacking granule-bound starch synthase (Waxy) and beta 1,2-Xylosyltransferase. Plant Cell Physiol. 2012, 53, 755–761. [Google Scholar] [CrossRef]
- Endo, M.; Osakabe, K.; Ono, K.; Handa, H.; Shimizu, T.; Toki, S. Molecular breeding of a novel herbicide-tolerant rice by gene targeting. Plant J. 2007, 52, 157–166. [Google Scholar] [CrossRef]
- Wakasa, K.; Ishihara, A. Metabolic engineering of the tryptophan and phenylalanine biosynthetic pathways in rice. Plant Biotechnol. 2009, 26, 523–533. [Google Scholar] [CrossRef]
- Yamada, T.; Matsuda, F.; Kasai, K.; Fukuoka, S.; Kitamura, K.; Tozawa, Y.; Miyagawa, H.; Wakasa, K. Mutation of a rice gene encoding a phenylalanine biosynthetic enzyme results in accumulation of phenylalanine and tryptophan. Plant Cell 2008, 20, 1316–1329. [Google Scholar] [CrossRef]
- Ishihara, A.; Hashimoto, Y.; Tanaka, C.; Dubouzet, J.G.; Nakao, T.; Matsuda, F.; Nishioka, T.; Miyagawa, H.; Wakasa, K. The tryptophan pathway is involved in the defense responses of rice against pathogenic infection via serotonin production. Plant J. 2008, 54, 481–495. [Google Scholar] [CrossRef]
- Kang, S.; Kang, K.; Lee, K.; Back, K. Characterization of rice tryptophan decarboxylases and their direct involvement in serotonin biosynthesis in transgenic rice. Planta 2007, 227, 263–272. [Google Scholar] [CrossRef]
- Kanjanaphachoat, P.; Wei, B.Y.; Lo, S.F.; Wang, I.W.; Wang, C.S.; Yu, S.M.; Yen, M.L.; Chiu, S.H.; Lai, C.C.; Chen, L.J. Serotonin accumulation in transgenic rice by overexpressing tryptophan decarboxlyase results in a dark brown phenotype and stunted growth. Plant Mol. Biol. 2012, 78, 525–543. [Google Scholar] [CrossRef] [Green Version]
- Ishikawa, Y.; Park, J.H.; Kisaka, H.; Lee, H.Y.; Kanno, A.; Kameya, T. A 5-methyltryptophan resistant mutant of rice has an altered regulation of anthranilate synthase gene expression. Plant Sci. 2003, 164, 1037–1045. [Google Scholar] [CrossRef]
- Sato, Y.; Antonio, B.; Namiki, N.; Motoyama, R.; Sugimoto, K.; Takehisa, H.; Minami, H.; Kamatsuki, K.; Kusaba, M.; Hirochika, H.; Nagamura, Y. Field transcriptome revealed critical developmental and physiological transitions involved in the expression of growth potential in japonica rice. BMC Plant Biol. 2011, 11. [Google Scholar]
- Sato, Y.; Antonio, B.A.; Namiki, N.; Takehisa, H.; Minami, H.; Kamatsuki, K.; Sugimoto, K.; Shimizu, Y.; Hirochika, H.; Nagamura, Y. RiceXPro: A platform for monitoring gene expression in japonica rice grown under natural field conditions. Nucleic Acids Res. 2011, 39, D1141–D1148. [Google Scholar]
- Takada, R.; Otsuka, M. Effects of feeding high tryptophan GM-rice on growth performance of chickens. Int. J. Poult. Sci. 2007, 6, 524–526. [Google Scholar] [CrossRef]
- Kusano, M.; Tabuchi, M.; Fukushima, A.; Funayama, K.; Diaz, C.; Kobayashi, M.; Hayashi, N.; Tsuchiya, Y.N.; Takahashi, H.; Kamata, A.; Yamaya, T.; et al. Metabolomics data reveal a crucial role of cytosolic glutamine synthetase 1;1 in coordinating metabolic balance in rice. Plant J. 2011, 66, 456–466. [Google Scholar] [CrossRef]
- Murashige, T.; Skoog, F. A revised medium for rapid growth and bioassays with tobacco tissue cultures. Physiol. Plant. 1962, 15, 473–497. [Google Scholar] [CrossRef]
- Akama, K.; Takaiwa, F. C-terminal extension of rice glutamate decarboxylase (OsGAD2) functions as an autoinhibitory domain and overexpression of a truncated mutant results in the accumulation of extremely high levels of GABA in plant cells. J. Exp. Bot. 2007, 58, 2699–2707. [Google Scholar] [CrossRef]
- Akama, K.; Kanetou, J.; Shimosaki, S.; Kawakami, K.; Tsuchikura, S.; Takaiwa, F. Seed-specific expression of truncated OsGAD2 produces GABA-enriched rice grains that influence a decrease in blood pressure in spontaneously hypertensive rats. Transgenic Res. 2009, 18, 865–876. [Google Scholar] [CrossRef]
- Kawakatsu, T.; Takaiwa, F. Differences in transcriptional regulatory mechanisms functioning for free lysine content and seed storage protein accumulation in rice grain. Plant Cell Physiol. 2010, 51, 1964–1974. [Google Scholar] [CrossRef]
- Toki, S. Rapid and efficient Agrobacterium-mediated transformation in rice. Plant Mol. Biol. Rep. 1997, 15, 16–21. [Google Scholar] [CrossRef]
- Ohkama-Ohtsu, N.; Oikawa, A.; Zhao, P.; Xiang, C.; Saito, K.; Oliver, D.J. A gamma-Glutamyl transpeptidase-independent pathway of glutathione catabolism to glutamate via 5-Oxoproline in arabidopsis. Plant Physiol. 2008, 148, 1603–1613. [Google Scholar] [CrossRef]
- Matsuda, F.; Yonekura-Sakakibara, K.; Niida, R.; Kuromori, T.; Shinozaki, K.; Saito, K. MS/MS spectral tag-based annotation of non-targeted profile of plant secondary metabolites. Plant J. 2009, 57, 555–577. [Google Scholar] [CrossRef]
Supplementary Files
© 2012 by the authors; licensee MDPI, Basel, Switzerland. This article is an open-access article distributed under the terms and conditions of the Creative Commons Attribution license (http://creativecommons.org/licenses/by/3.0/).
Share and Cite
Saika, H.; Oikawa, A.; Nakabayashi, R.; Matsuda, F.; Saito, K.; Toki, S. Changes in Primary and Secondary Metabolite Levels in Response to Gene Targeting-Mediated Site-Directed Mutagenesis of the Anthranilate Synthase Gene in Rice. Metabolites 2012, 2, 1123-1138. https://doi.org/10.3390/metabo2041123
Saika H, Oikawa A, Nakabayashi R, Matsuda F, Saito K, Toki S. Changes in Primary and Secondary Metabolite Levels in Response to Gene Targeting-Mediated Site-Directed Mutagenesis of the Anthranilate Synthase Gene in Rice. Metabolites. 2012; 2(4):1123-1138. https://doi.org/10.3390/metabo2041123
Chicago/Turabian StyleSaika, Hiroaki, Akira Oikawa, Ryo Nakabayashi, Fumio Matsuda, Kazuki Saito, and Seiichi Toki. 2012. "Changes in Primary and Secondary Metabolite Levels in Response to Gene Targeting-Mediated Site-Directed Mutagenesis of the Anthranilate Synthase Gene in Rice" Metabolites 2, no. 4: 1123-1138. https://doi.org/10.3390/metabo2041123