Determining Enzyme Kinetics for Systems Biology with Nuclear Magnetic Resonance Spectroscopy


Abstract
:
1. Introduction
2. Results and Discussion
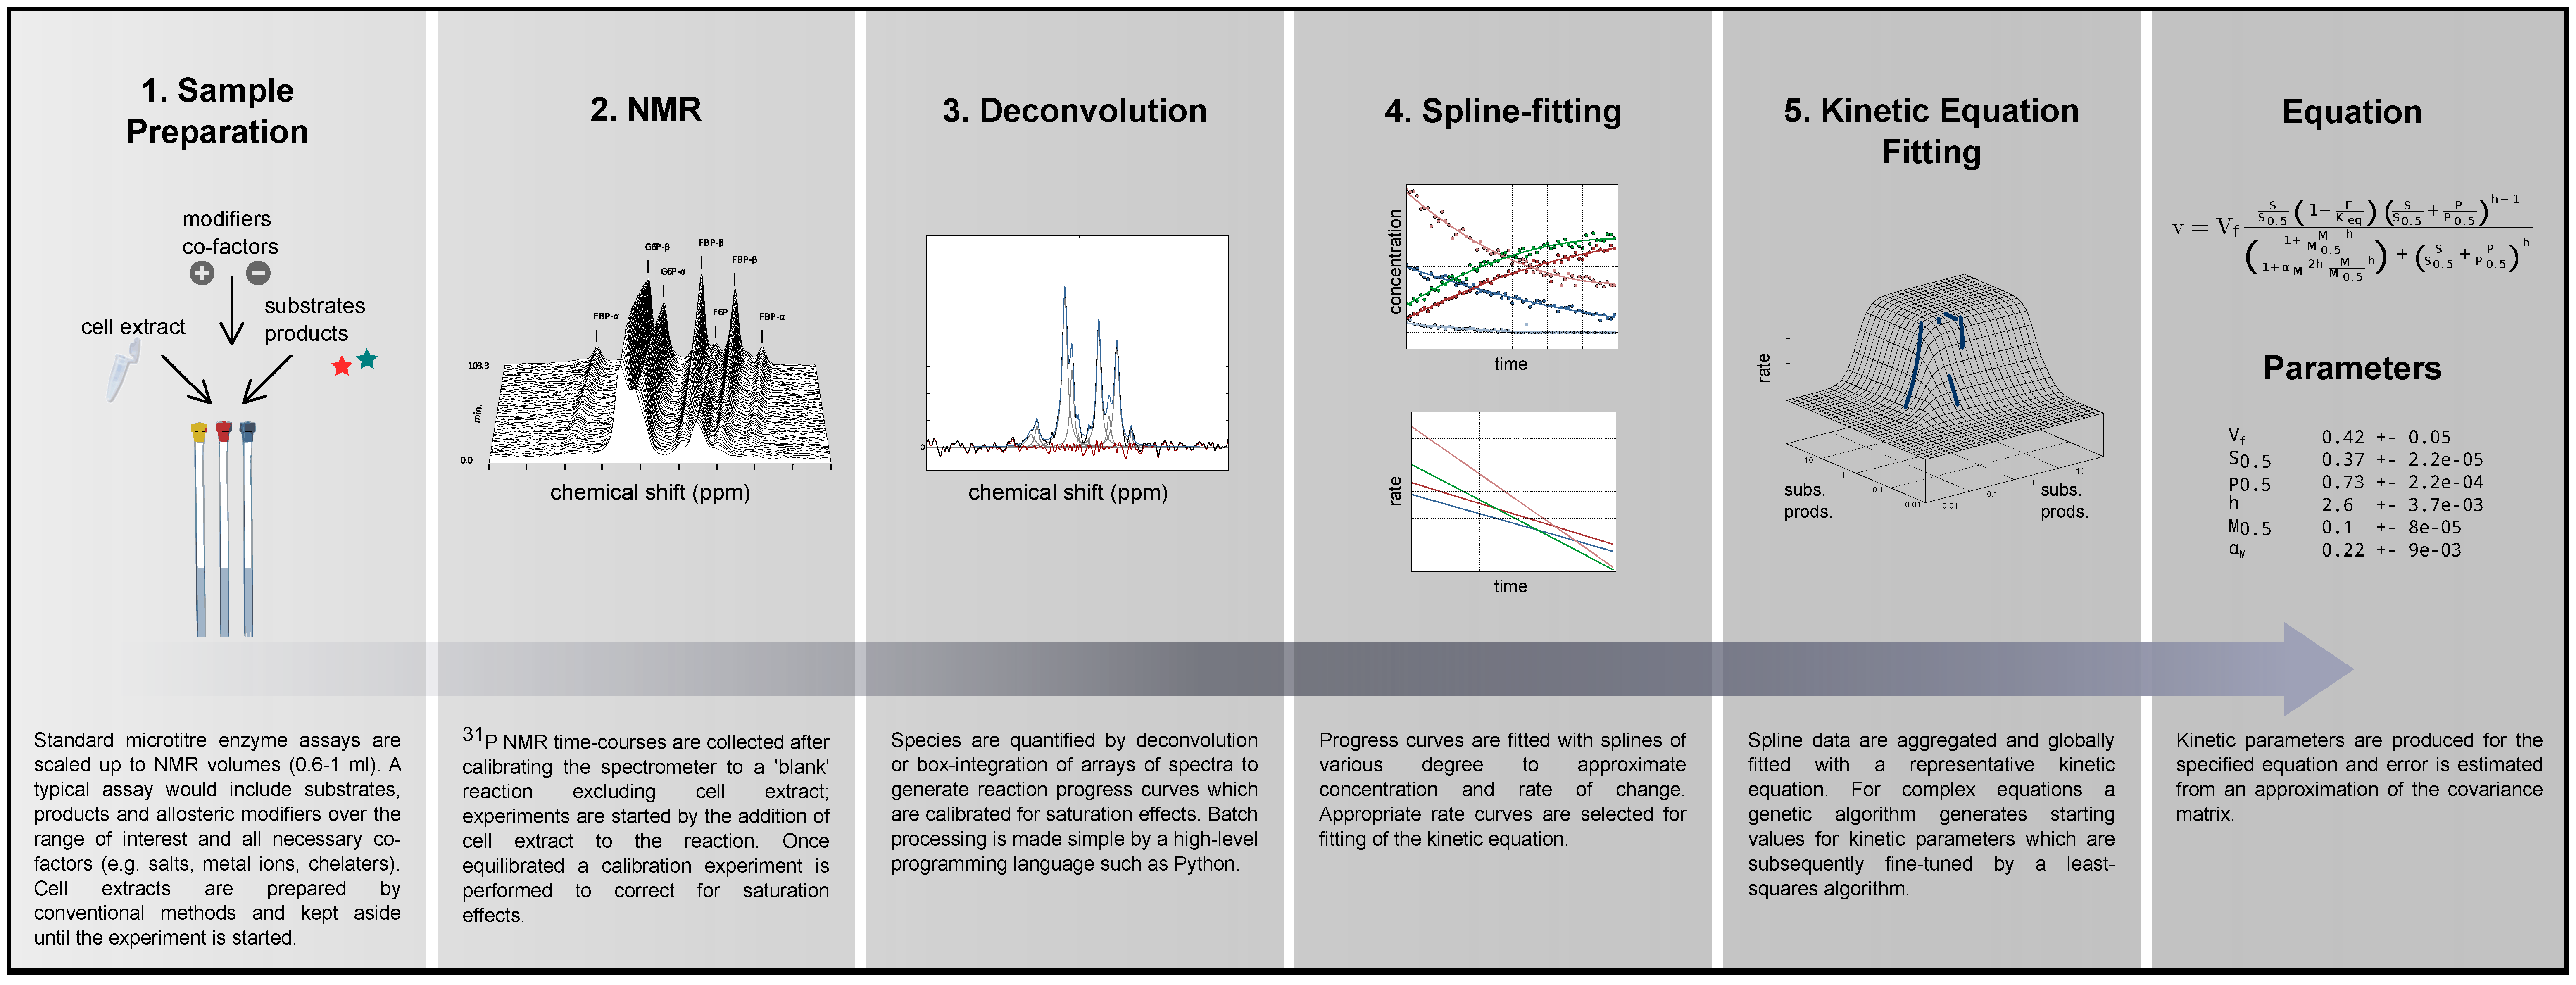
2.1. Method Outline and Technical Considerations
2.1.1. Method Outline
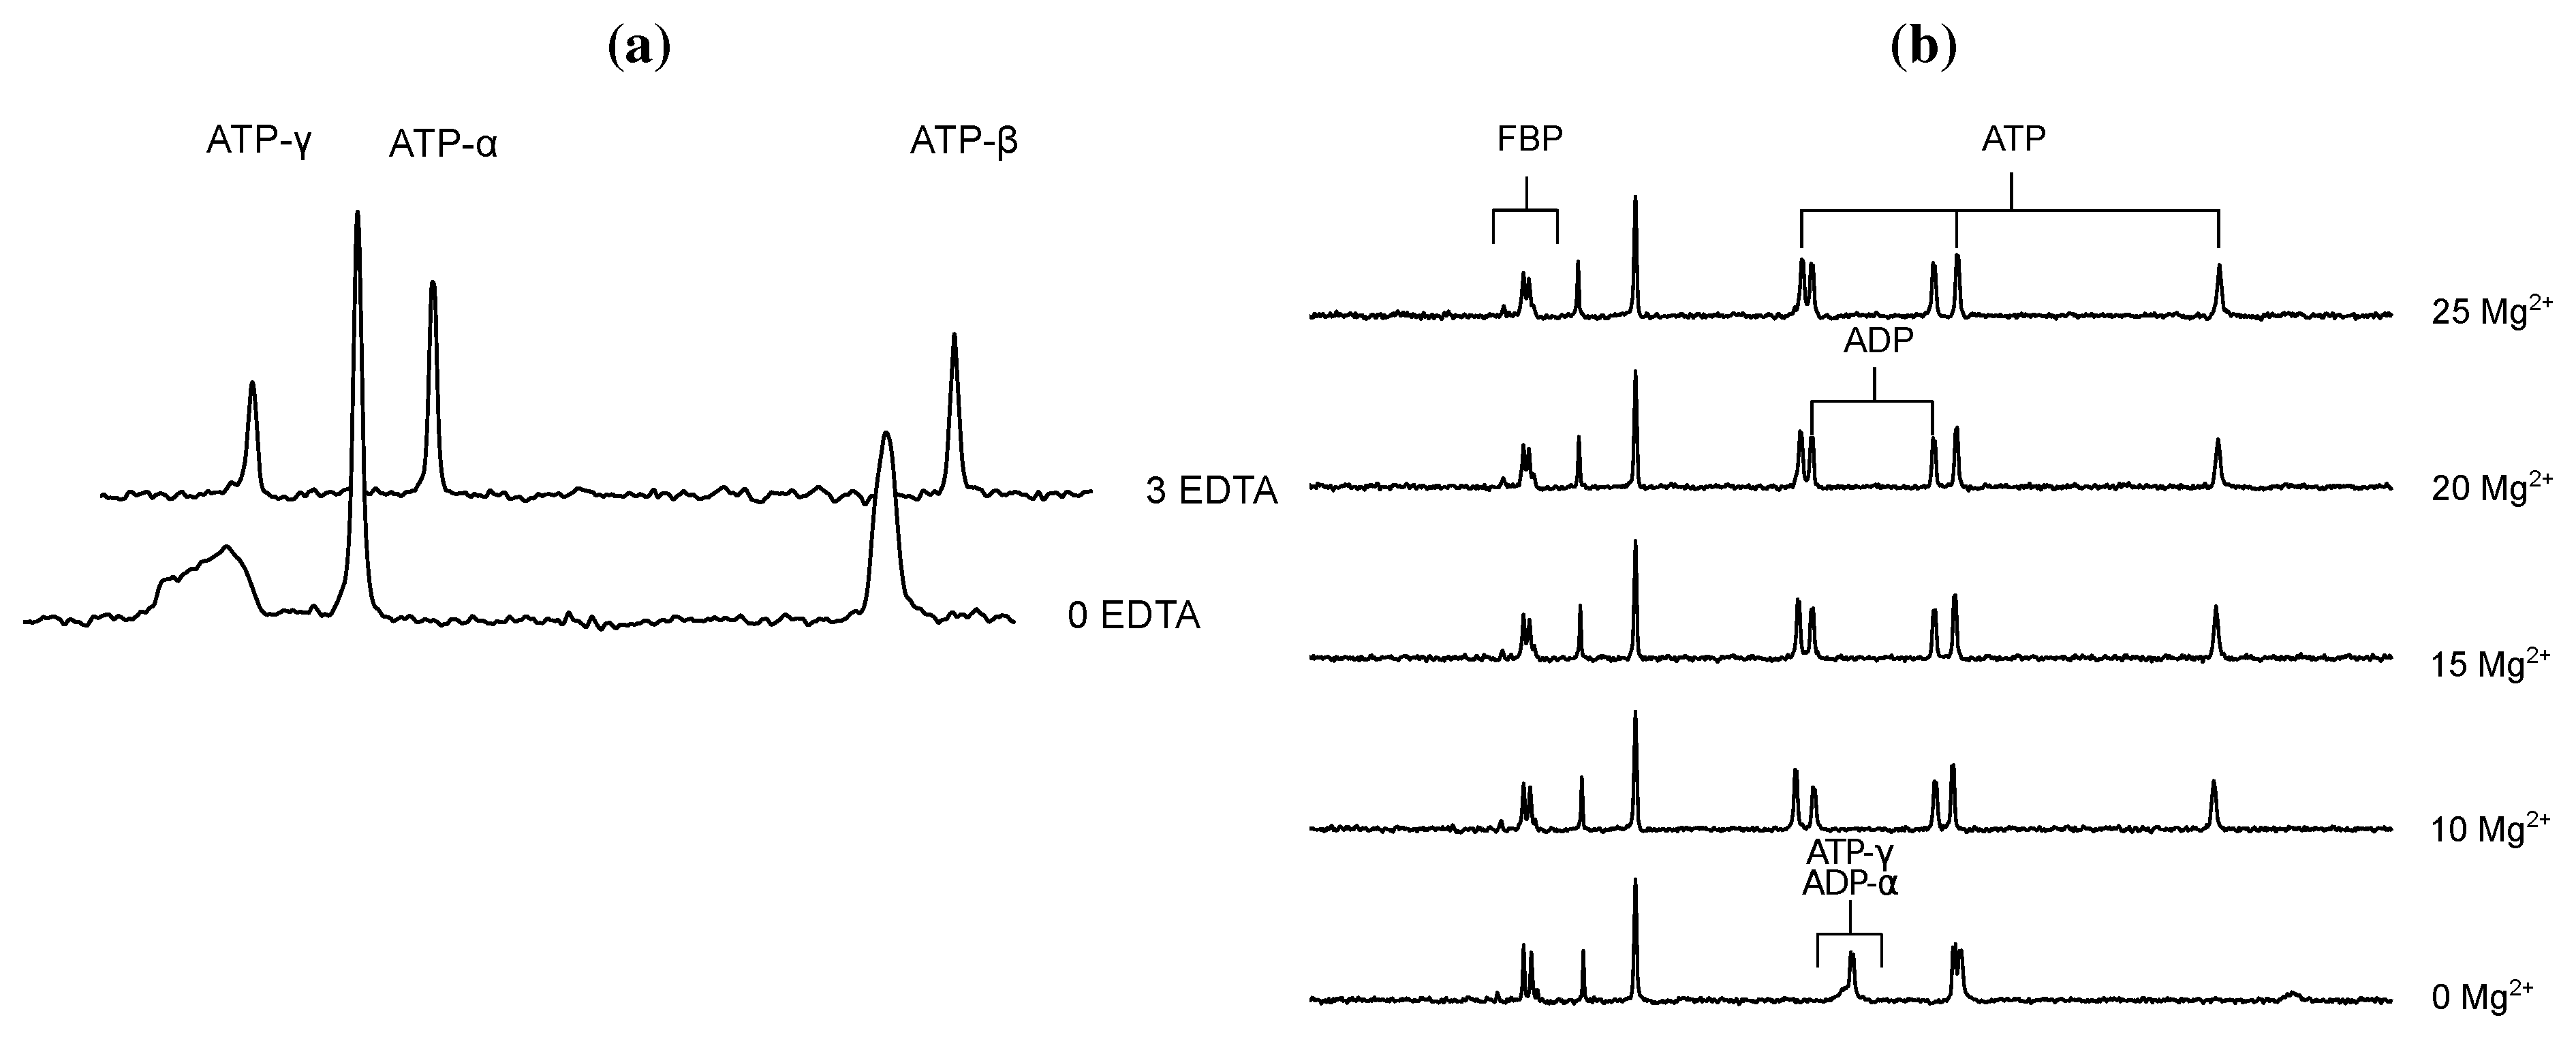
2.1.2. 31P NMR Spectroscopy of Nucleoside Phosphates
2.1.3. Maximal Rate Normalisation

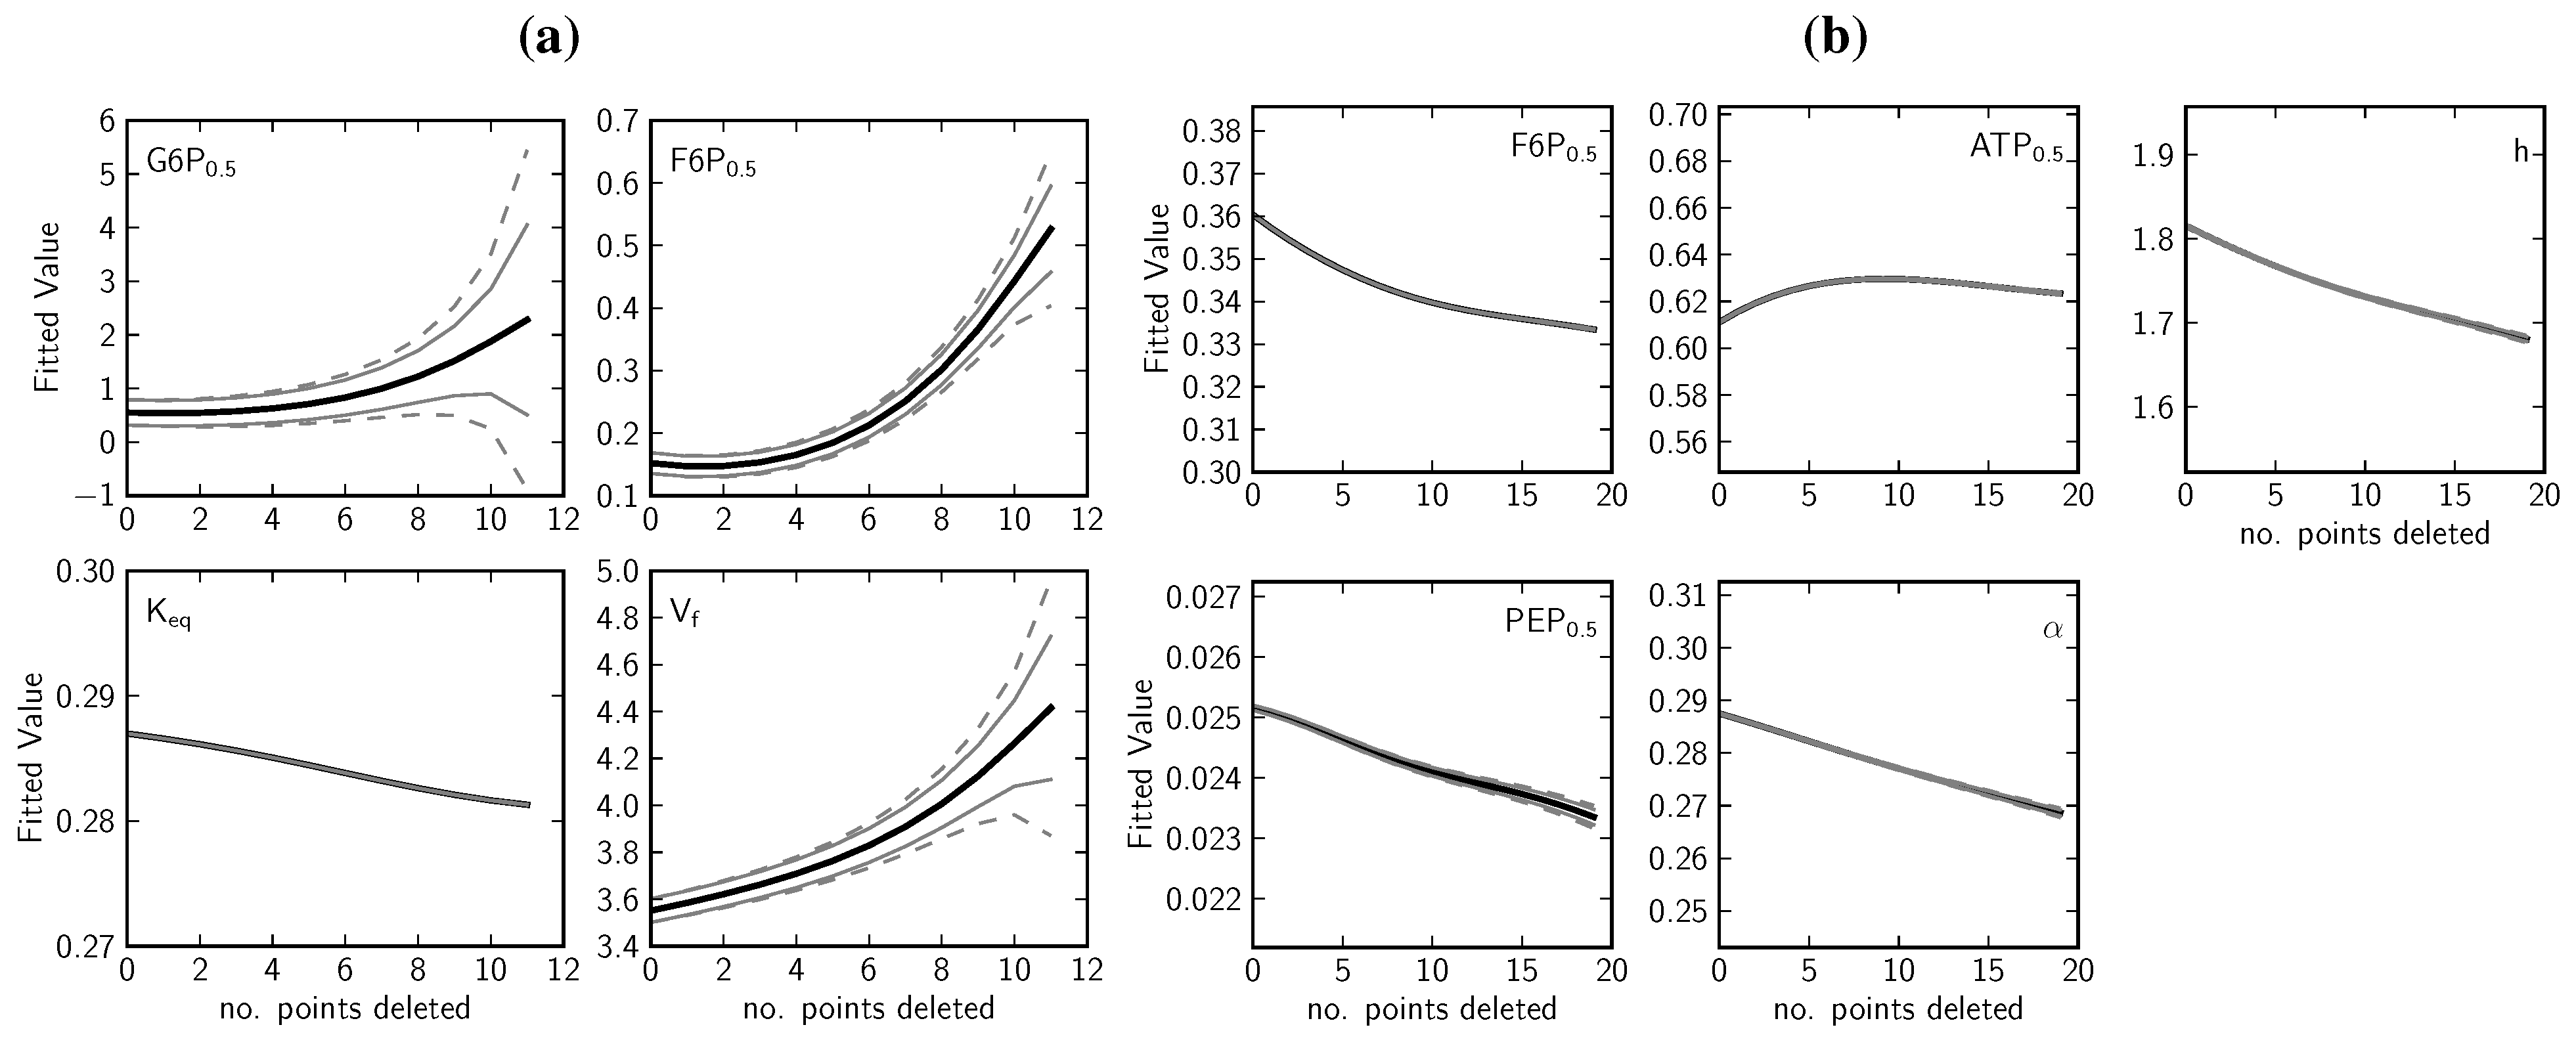
2.1.4. Data Redundancy and Model Validation
 , ATP
, ATP  , FBP
, FBP  , ADP
, ADP  , PEP
, PEP  ) are fitted with splines (G6P
  , F6P
, F6P  , ATP
, ATP  , FBP
, FBP  , ADP
, ADP  , PEP
, PEP  ). Inhibitor assays containing PEP are shown in the last two blocks. Note that with the exception of the second-last assay, F6P concentrations are inferred from equilibrium with G6P via PGI. Bottom row: Respective rates derived from spline-fitted NMR data. Dual colour lines indicate an average of two respective rates. For comparison, the rate calculated by the irreversible Hill equation (---, Table 1: PFK) at the specific substrate, product and effector concentrations is shown. The Hill equation parameters were the same throughout and obtained from a global fit of all the time courses shown. Rates are normalised to total protein. Raw NMR FID data, as well as NMR peak integrals and spline data, are included as supplementary material.
, ATP , FBP , ADP , PEP ) are fitted with splines (G6P , F6P , ATP , FBP , ADP , PEP ). Inhibitor assays containing PEP are shown in the last two blocks. Note that with the exception of the second-last assay, F6P concentrations are inferred from equilibrium with G6P via PGI. Bottom row: Respective rates derived from spline-fitted NMR data. Dual colour lines indicate an average of two respective rates. For comparison, the rate calculated by the irreversible Hill equation (---, Table 1: PFK) at the specific substrate, product and effector concentrations is shown. The Hill equation parameters were the same throughout and obtained from a global fit of all the time courses shown. Rates are normalised to total protein. Raw NMR FID data, as well as NMR peak integrals and spline data, are included as supplementary material.
). Inhibitor assays containing PEP are shown in the last two blocks. Note that with the exception of the second-last assay, F6P concentrations are inferred from equilibrium with G6P via PGI. Bottom row: Respective rates derived from spline-fitted NMR data. Dual colour lines indicate an average of two respective rates. For comparison, the rate calculated by the irreversible Hill equation (---, Table 1: PFK) at the specific substrate, product and effector concentrations is shown. The Hill equation parameters were the same throughout and obtained from a global fit of all the time courses shown. Rates are normalised to total protein. Raw NMR FID data, as well as NMR peak integrals and spline data, are included as supplementary material.
, ATP , FBP , ADP , PEP ) are fitted with splines (G6P , F6P , ATP , FBP , ADP , PEP ). Inhibitor assays containing PEP are shown in the last two blocks. Note that with the exception of the second-last assay, F6P concentrations are inferred from equilibrium with G6P via PGI. Bottom row: Respective rates derived from spline-fitted NMR data. Dual colour lines indicate an average of two respective rates. For comparison, the rate calculated by the irreversible Hill equation (---, Table 1: PFK) at the specific substrate, product and effector concentrations is shown. The Hill equation parameters were the same throughout and obtained from a global fit of all the time courses shown. Rates are normalised to total protein. Raw NMR FID data, as well as NMR peak integrals and spline data, are included as supplementary material. 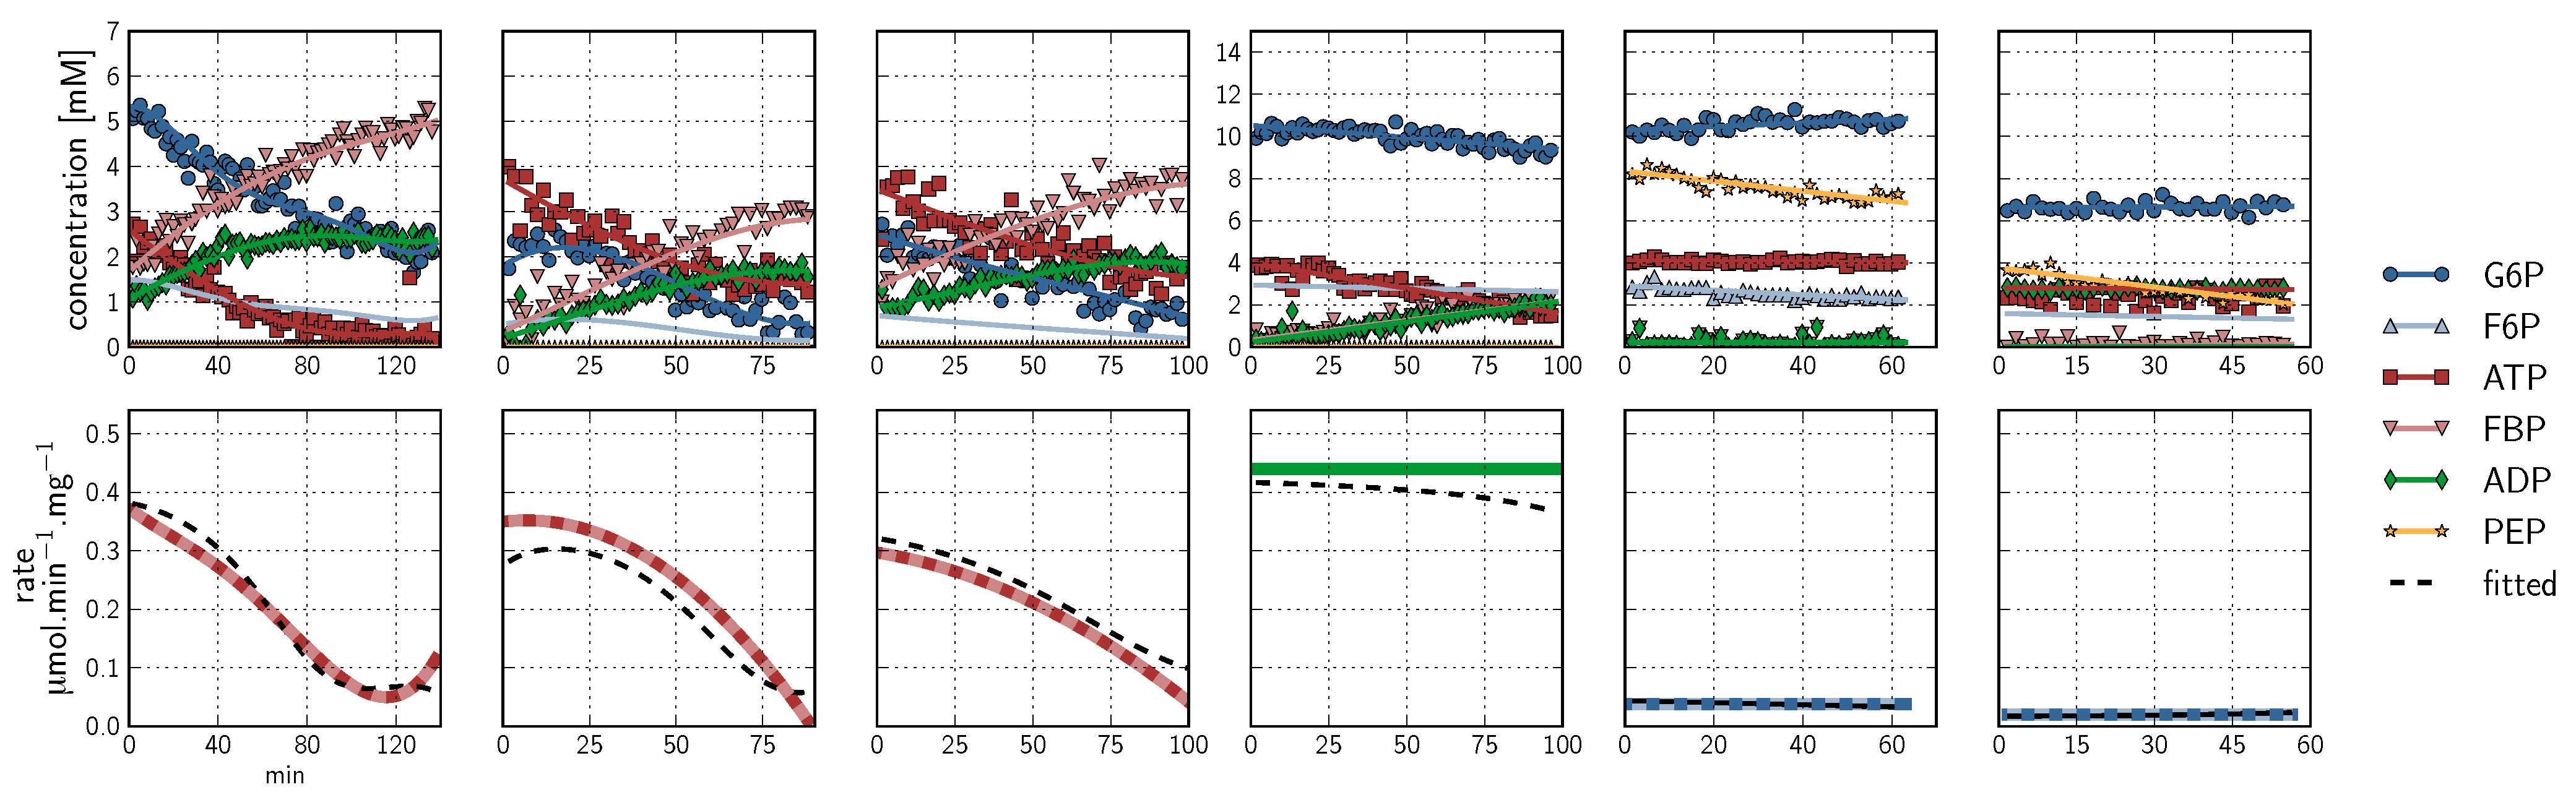

| Kinetic Equations a | Fitted parameters b | |||
|---|---|---|---|---|
| PGI |  uni-uni, reversible Michaelis–Menten c [15] uni-uni, reversible Michaelis–Menten c [15] | Vf | 3.551 ± 0.050 (Vr = 3.431) e | μmol:min-1:mg-1 |
| G6P0.5 | 0.550 ± 0.236 | mM | ||
| G6P0.5 | 0.152 ± 0.017 | mM | ||
| Keq | 0.286 ± 8 × 10⁻⁶ | μmol:min-1:mg-1 | ||
| PFK |  allosteric modifier: ⊝PEP bi-substrate, irreversible Hill [48] allosteric modifier: ⊝PEP bi-substrate, irreversible Hill [48] | Vf | 0.4435 ±0.0001 | mM |
| F6P0.5 | 0.4174 ±0.00006 | mM | ||
| ATP0.5 | 0.5444 ±0.0003d | mM | ||
| PEP0.5 | 0.0863 ±0.0001 | |||
| α | 0.3797 ±0.0001 | |||
| h | 1.883 ±0.002 | |||
 . Γ is the mass action ratio of unscaled concentrations:
  ; b Error is Standard Error of the Mean (S.E.M.): variance in parameter ×
  . A covariance matrix is derived from a Jacobian (a matrix of first-order partial derivatives) approximation to the Hessian matrix (a matrix of second-order partial derivatives describing the curvature of the objective function) around the solution and the associated variance in the fitted parameters is scaled by the residual variance. This correction of the estimated variance produces an unbiased estimator of the spread of the fitted parameters by scaling the residuals so that they are in units of standard deviations as described in the scipy.optimize.leastsq documentation [49]. For a fuller treatment of the Levenberg-Marquardt algorithm see Press et al. [50]; c In the case of no cooperativity (h = 1), the reversible Hill equation reduces to the reversible Michaelis-Menten; d Correcting for low Mg2+ value as used in this study (see Results and Discussion) gives 0.1089 ± 1 × 10⁻⁵; e Inferred from the Haldane relationship [15].
 2.2. Kinetic Characterisation of Phosphoglucose Isomerase and Phosphofructokinase
2.2.1. Phosphoglucose Isomerase Kinetic Parameters
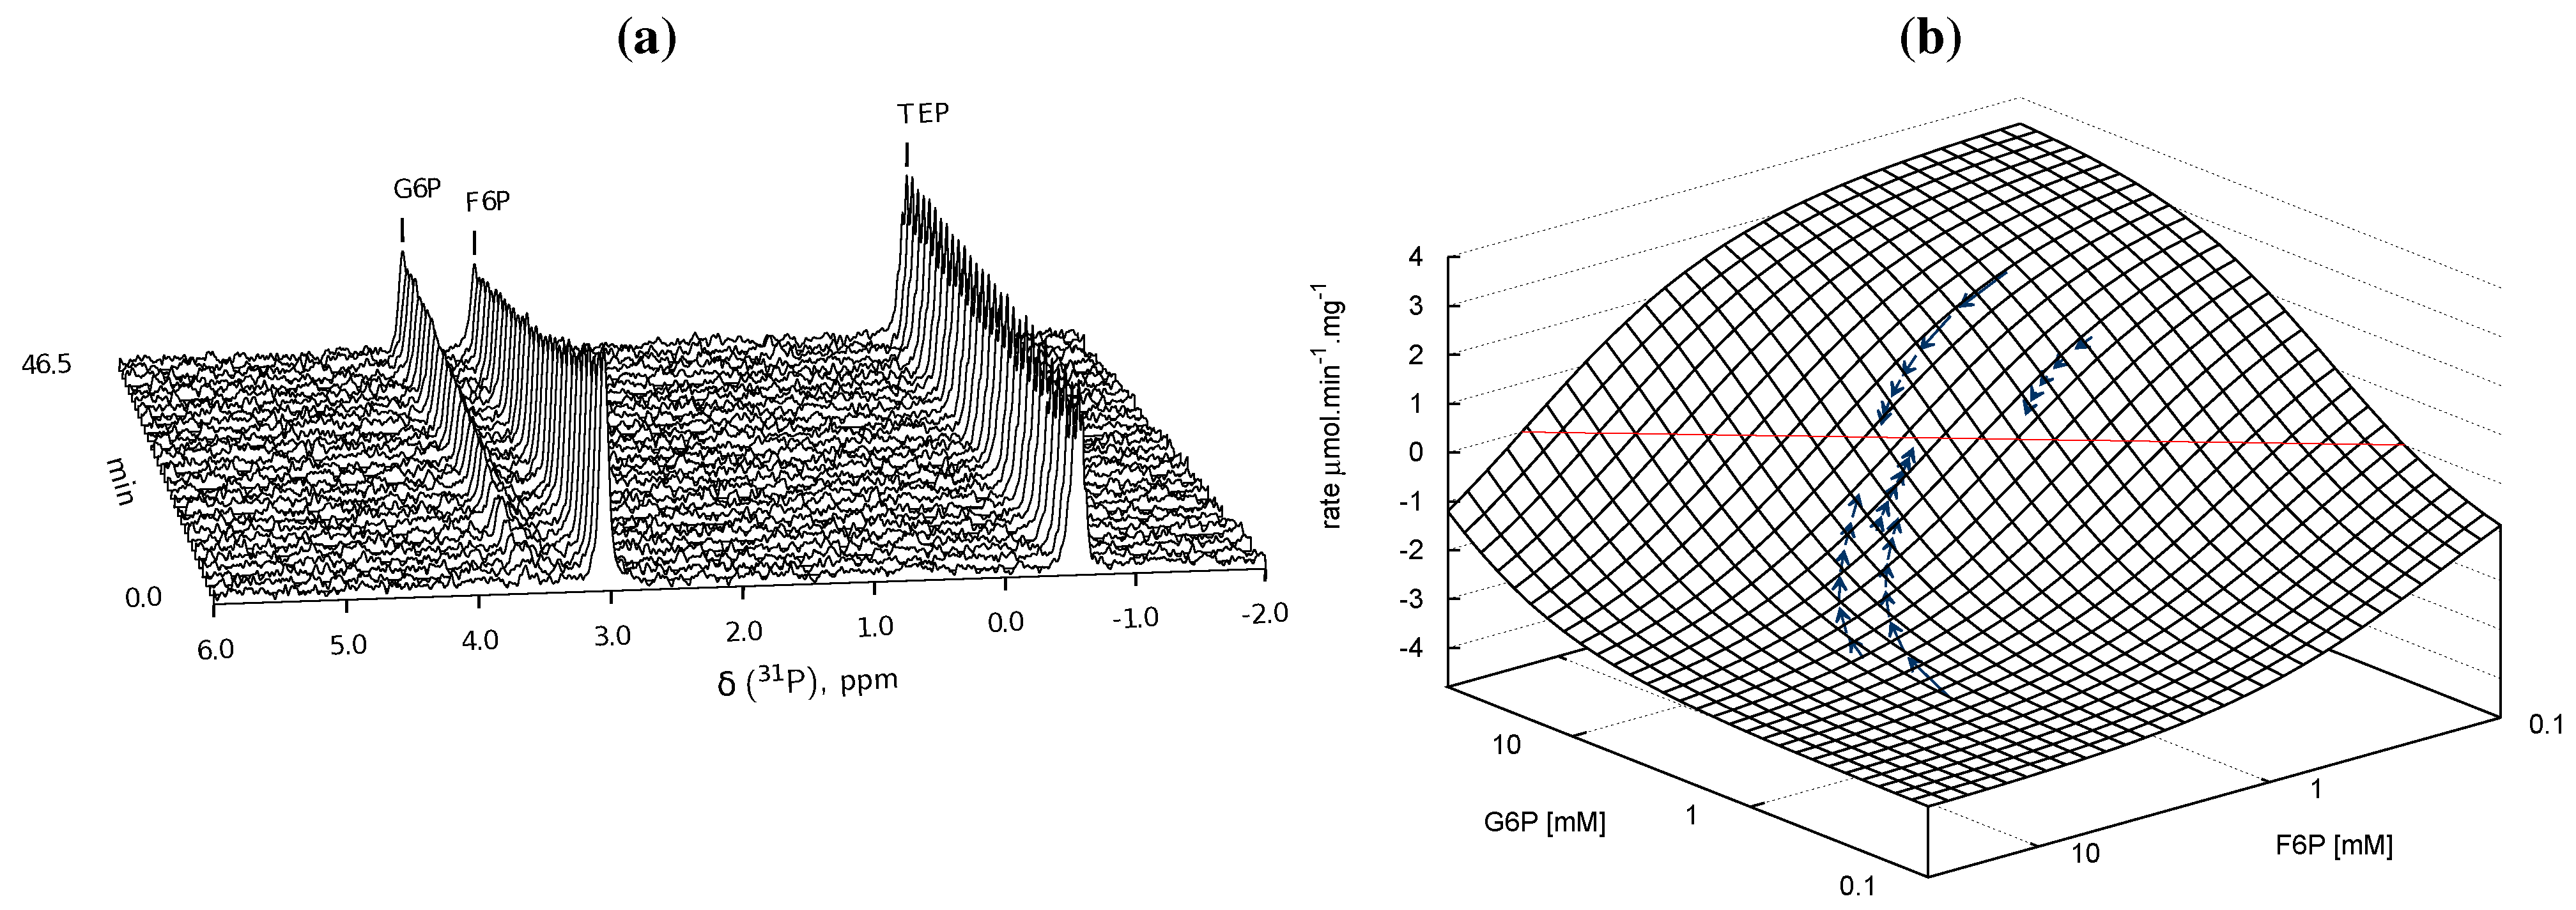
G6P ⇌ F6P
 ), arrows indicate both the metabolite concentrations and the direction of reaction as each time course progresses towards equilibrium (→→→). The rate was normalised to total protein concentration. Substrate and product concentration axes are in logarithmic scale. R2= 0.99.
), arrows indicate both the metabolite concentrations and the direction of reaction as each time course progresses towards equilibrium (→→→). The rate was normalised to total protein concentration. Substrate and product concentration axes are in logarithmic scale. R2= 0.99.
), arrows indicate both the metabolite concentrations and the direction of reaction as each time course progresses towards equilibrium (→→→). The rate was normalised to total protein concentration. Substrate and product concentration axes are in logarithmic scale. R2= 0.99.
 ) and product F6P (
  ) and monitoring reaction progress using 31P NMR with a 90° pulse angle and 1 s repetition time (1.0 s acquisition, 0.0 s relaxation) with 80 transients per FID. Other parameters are as described in Section 3.3. Progress curves derived from NMR peak integrals were fitted with splines (G6P
  , F6P
, F6P  ). Bottom row: The respective averaged rates of the fitted splines are plotted (dual colours indicate average of two respective rates) with the rate of the fitted kinetic equation included (---, Table 1: PGI). Rates were normalised to total protein content. Raw NMR FID data, as well as NMR peak integrals and spline data, are included as supplementary material.
) and product F6P ( ) and monitoring reaction progress using 31P NMR with a 90° pulse angle and 1 s repetition time (1.0 s acquisition, 0.0 s relaxation) with 80 transients per FID. Other parameters are as described in Section 3.3. Progress curves derived from NMR peak integrals were fitted with splines (G6P , F6P ). Bottom row: The respective averaged rates of the fitted splines are plotted (dual colours indicate average of two respective rates) with the rate of the fitted kinetic equation included (---, Table 1: PGI). Rates were normalised to total protein content. Raw NMR FID data, as well as NMR peak integrals and spline data, are included as supplementary material.
). Bottom row: The respective averaged rates of the fitted splines are plotted (dual colours indicate average of two respective rates) with the rate of the fitted kinetic equation included (---, Table 1: PGI). Rates were normalised to total protein content. Raw NMR FID data, as well as NMR peak integrals and spline data, are included as supplementary material.
) and product F6P ( ) and monitoring reaction progress using 31P NMR with a 90° pulse angle and 1 s repetition time (1.0 s acquisition, 0.0 s relaxation) with 80 transients per FID. Other parameters are as described in Section 3.3. Progress curves derived from NMR peak integrals were fitted with splines (G6P , F6P ). Bottom row: The respective averaged rates of the fitted splines are plotted (dual colours indicate average of two respective rates) with the rate of the fitted kinetic equation included (---, Table 1: PGI). Rates were normalised to total protein content. Raw NMR FID data, as well as NMR peak integrals and spline data, are included as supplementary material. 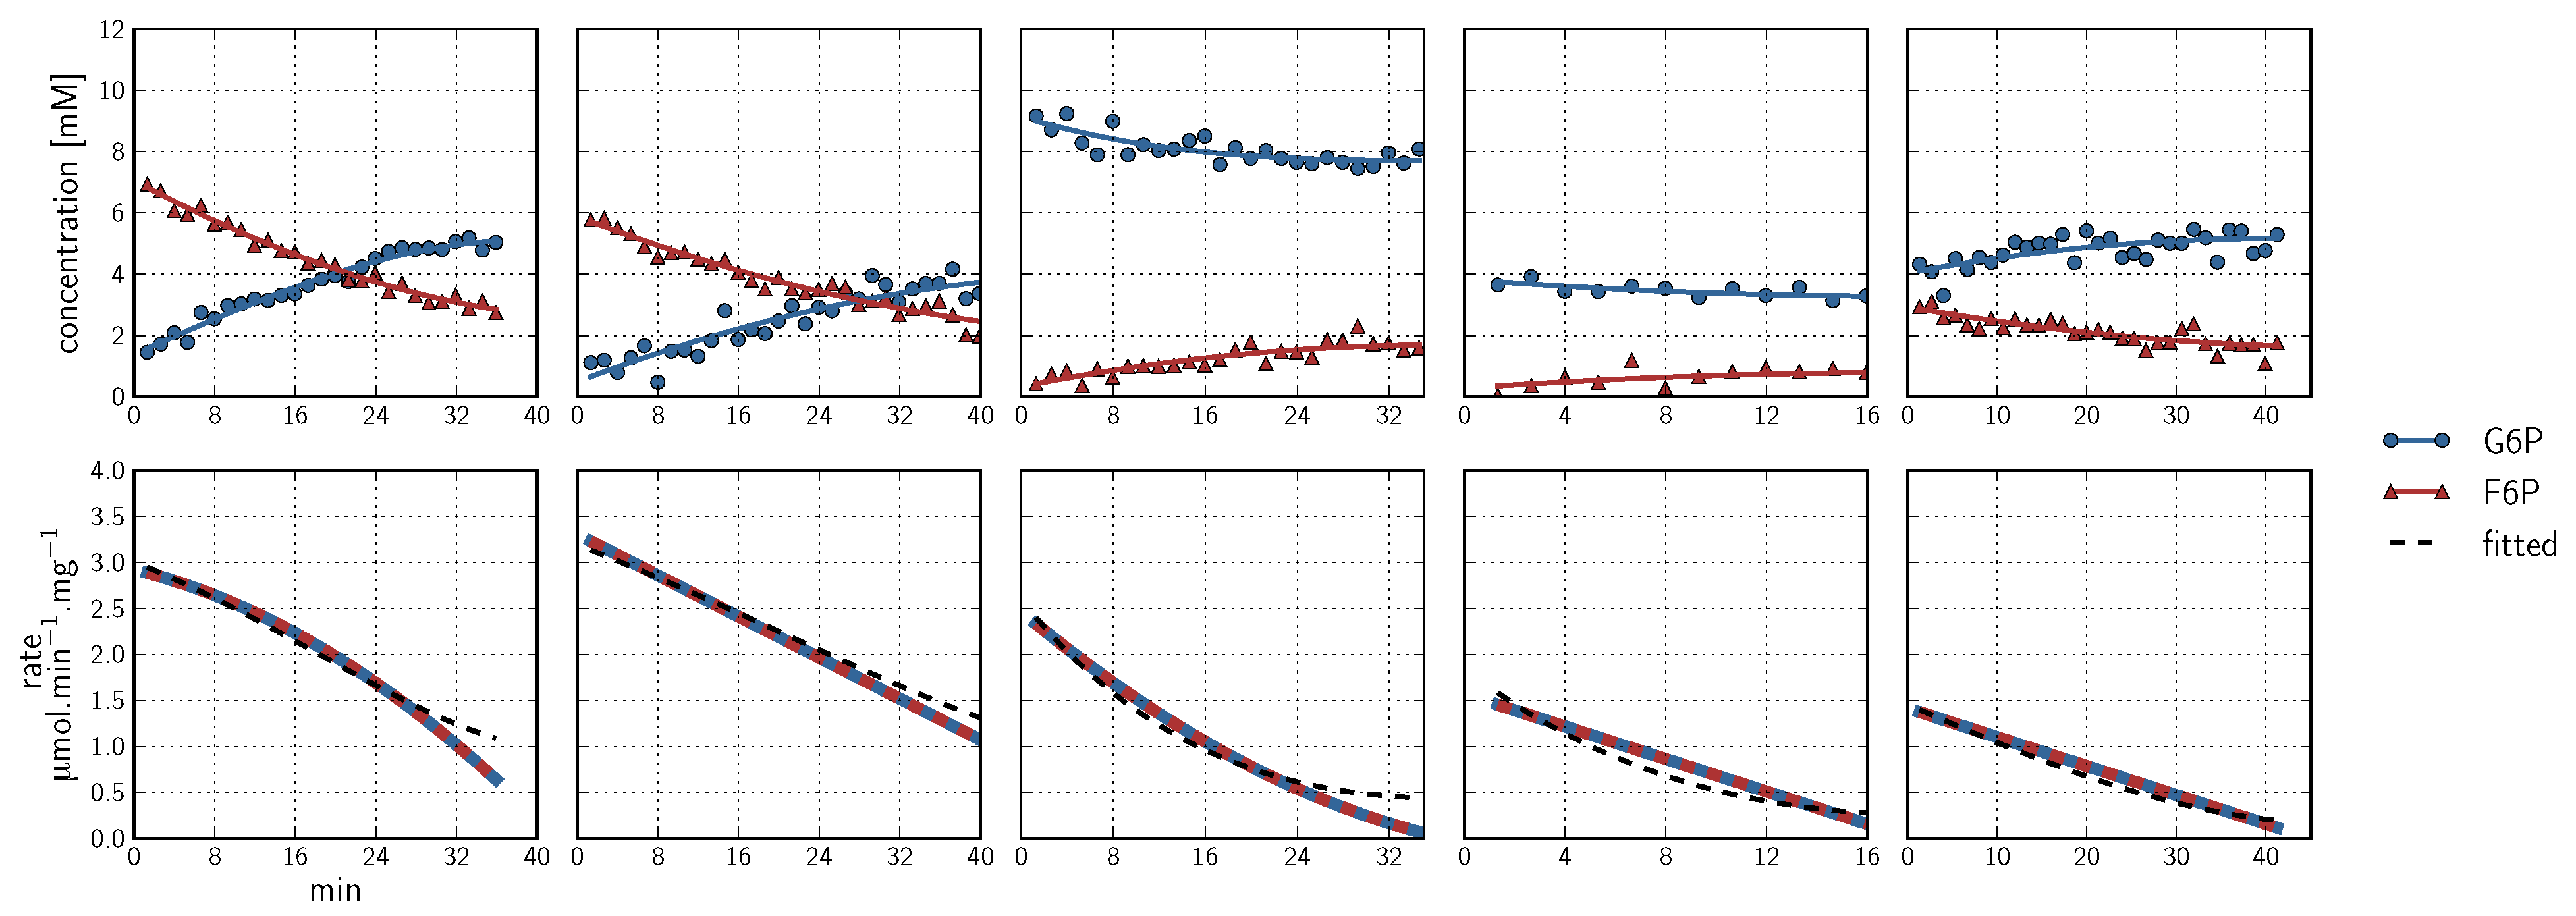
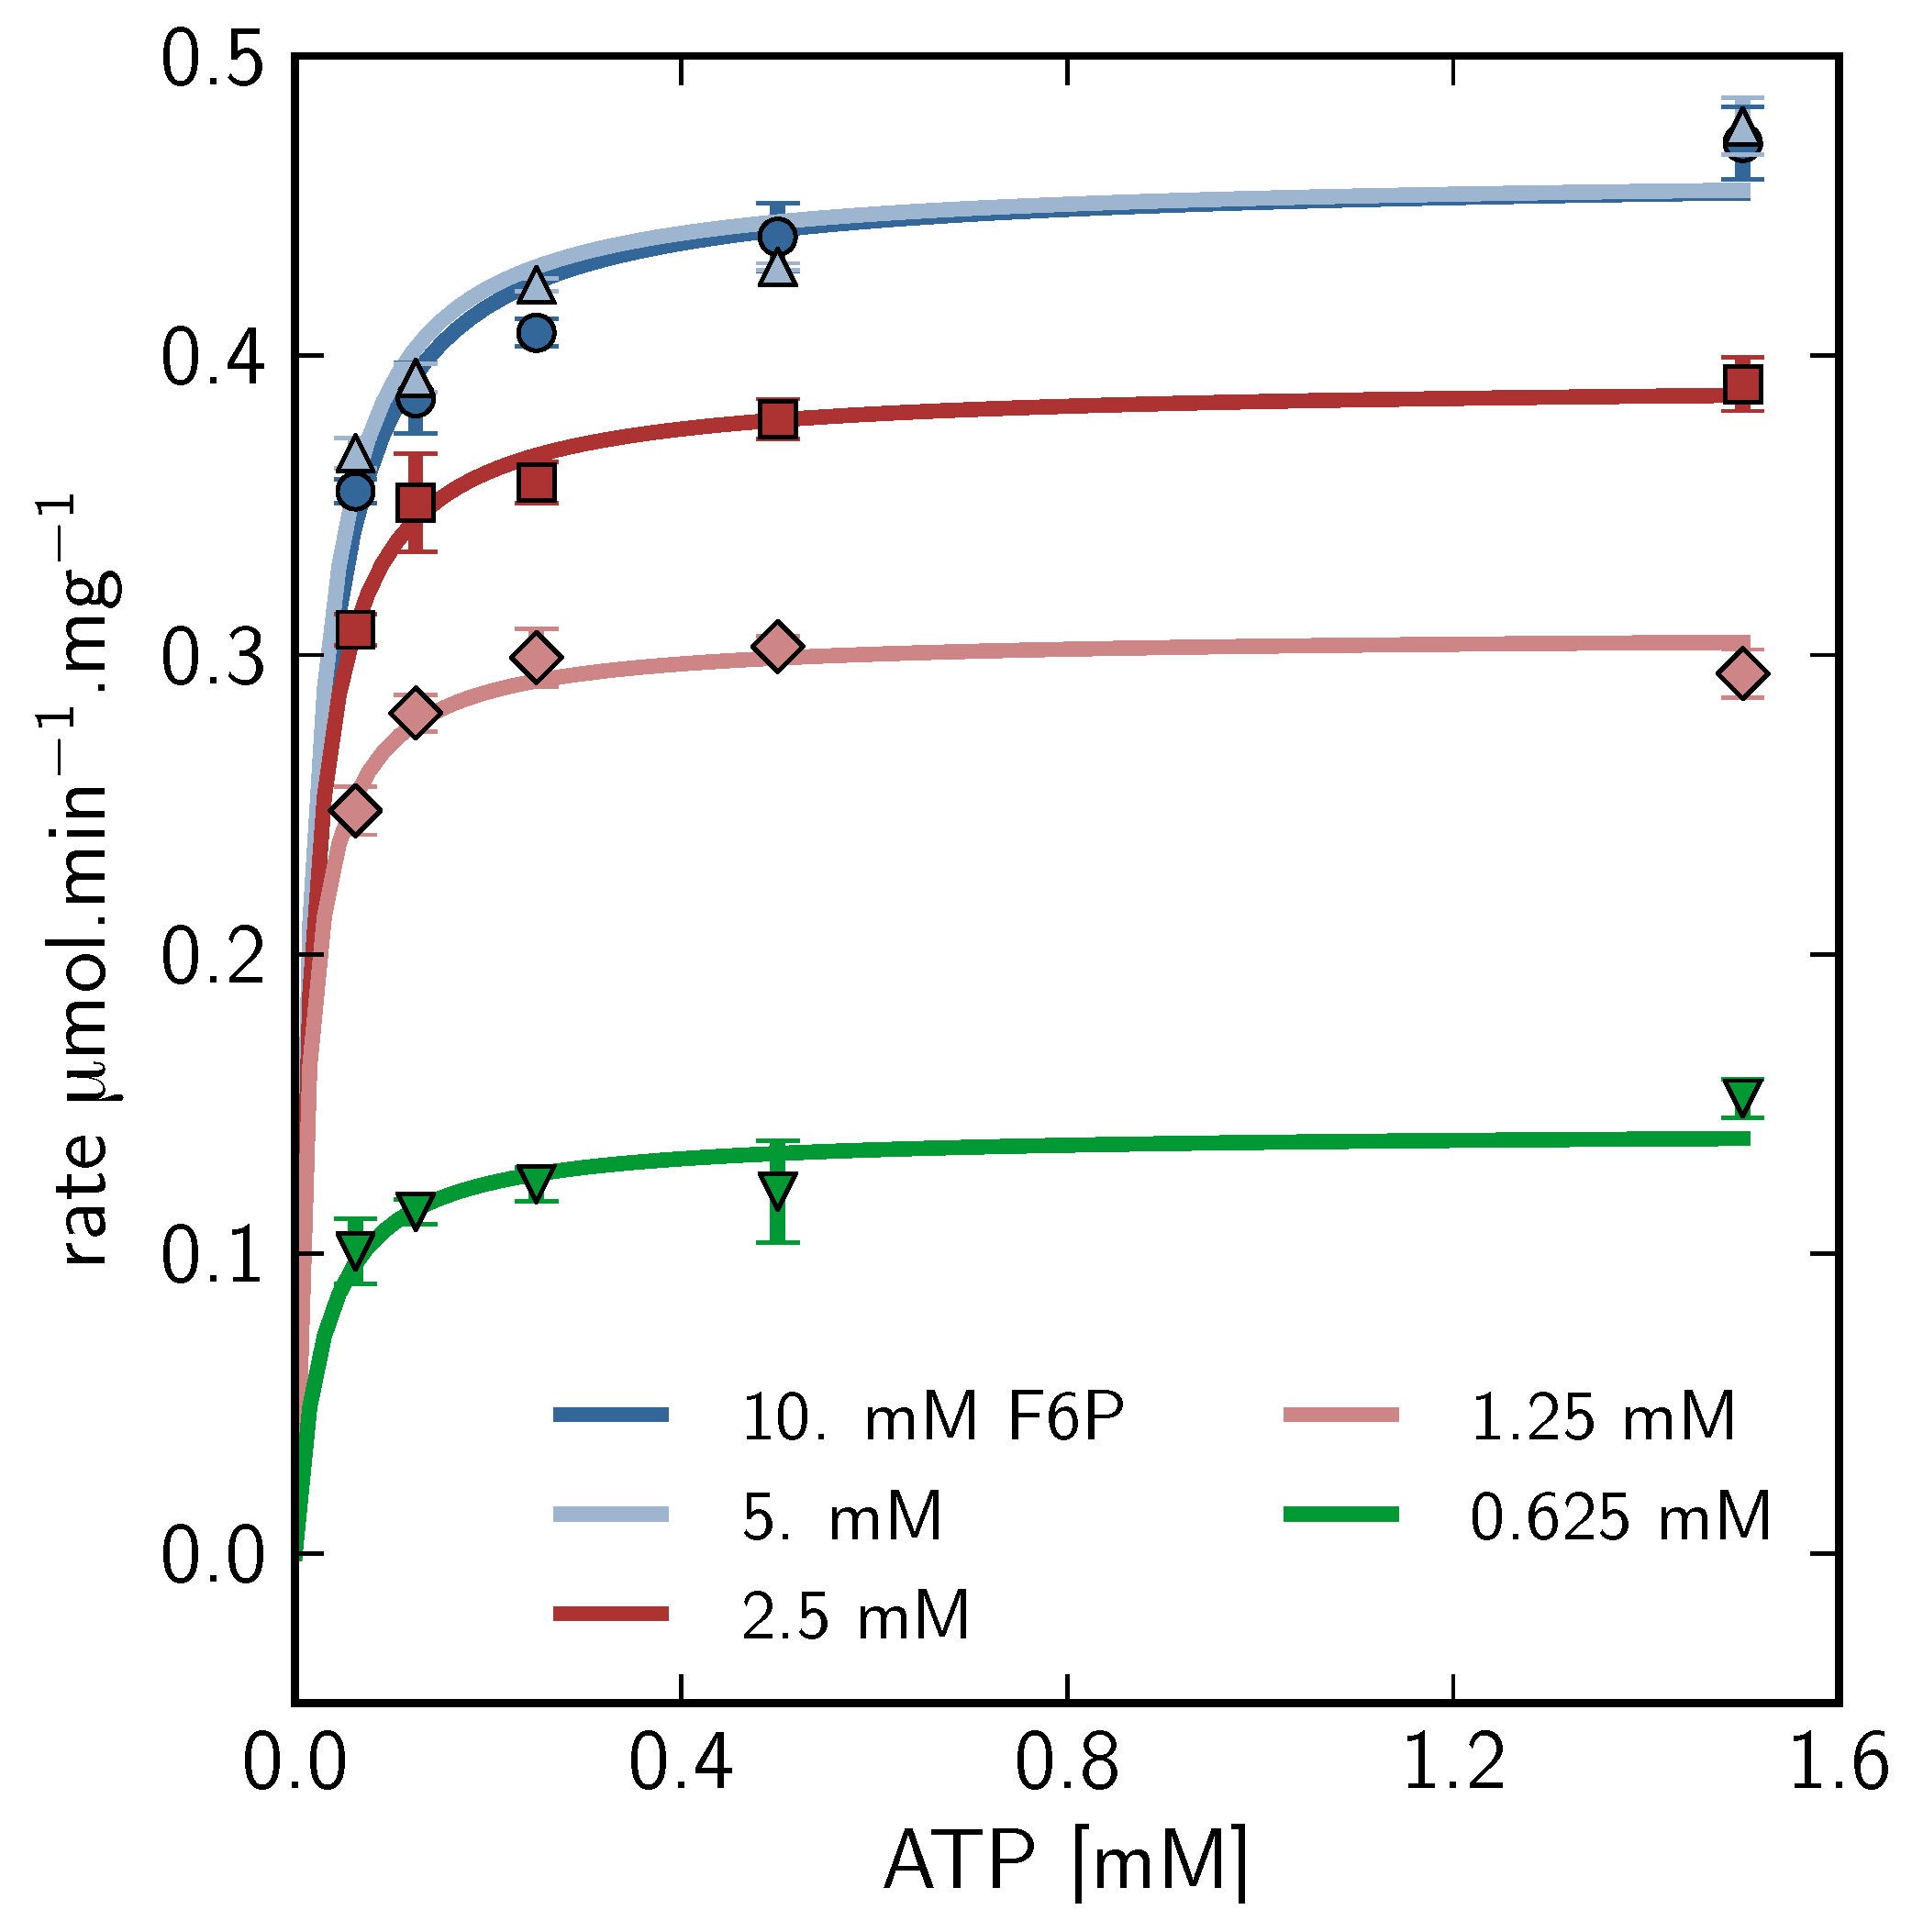
2.2.2. Phosphofructokinase Kinetic Parameters
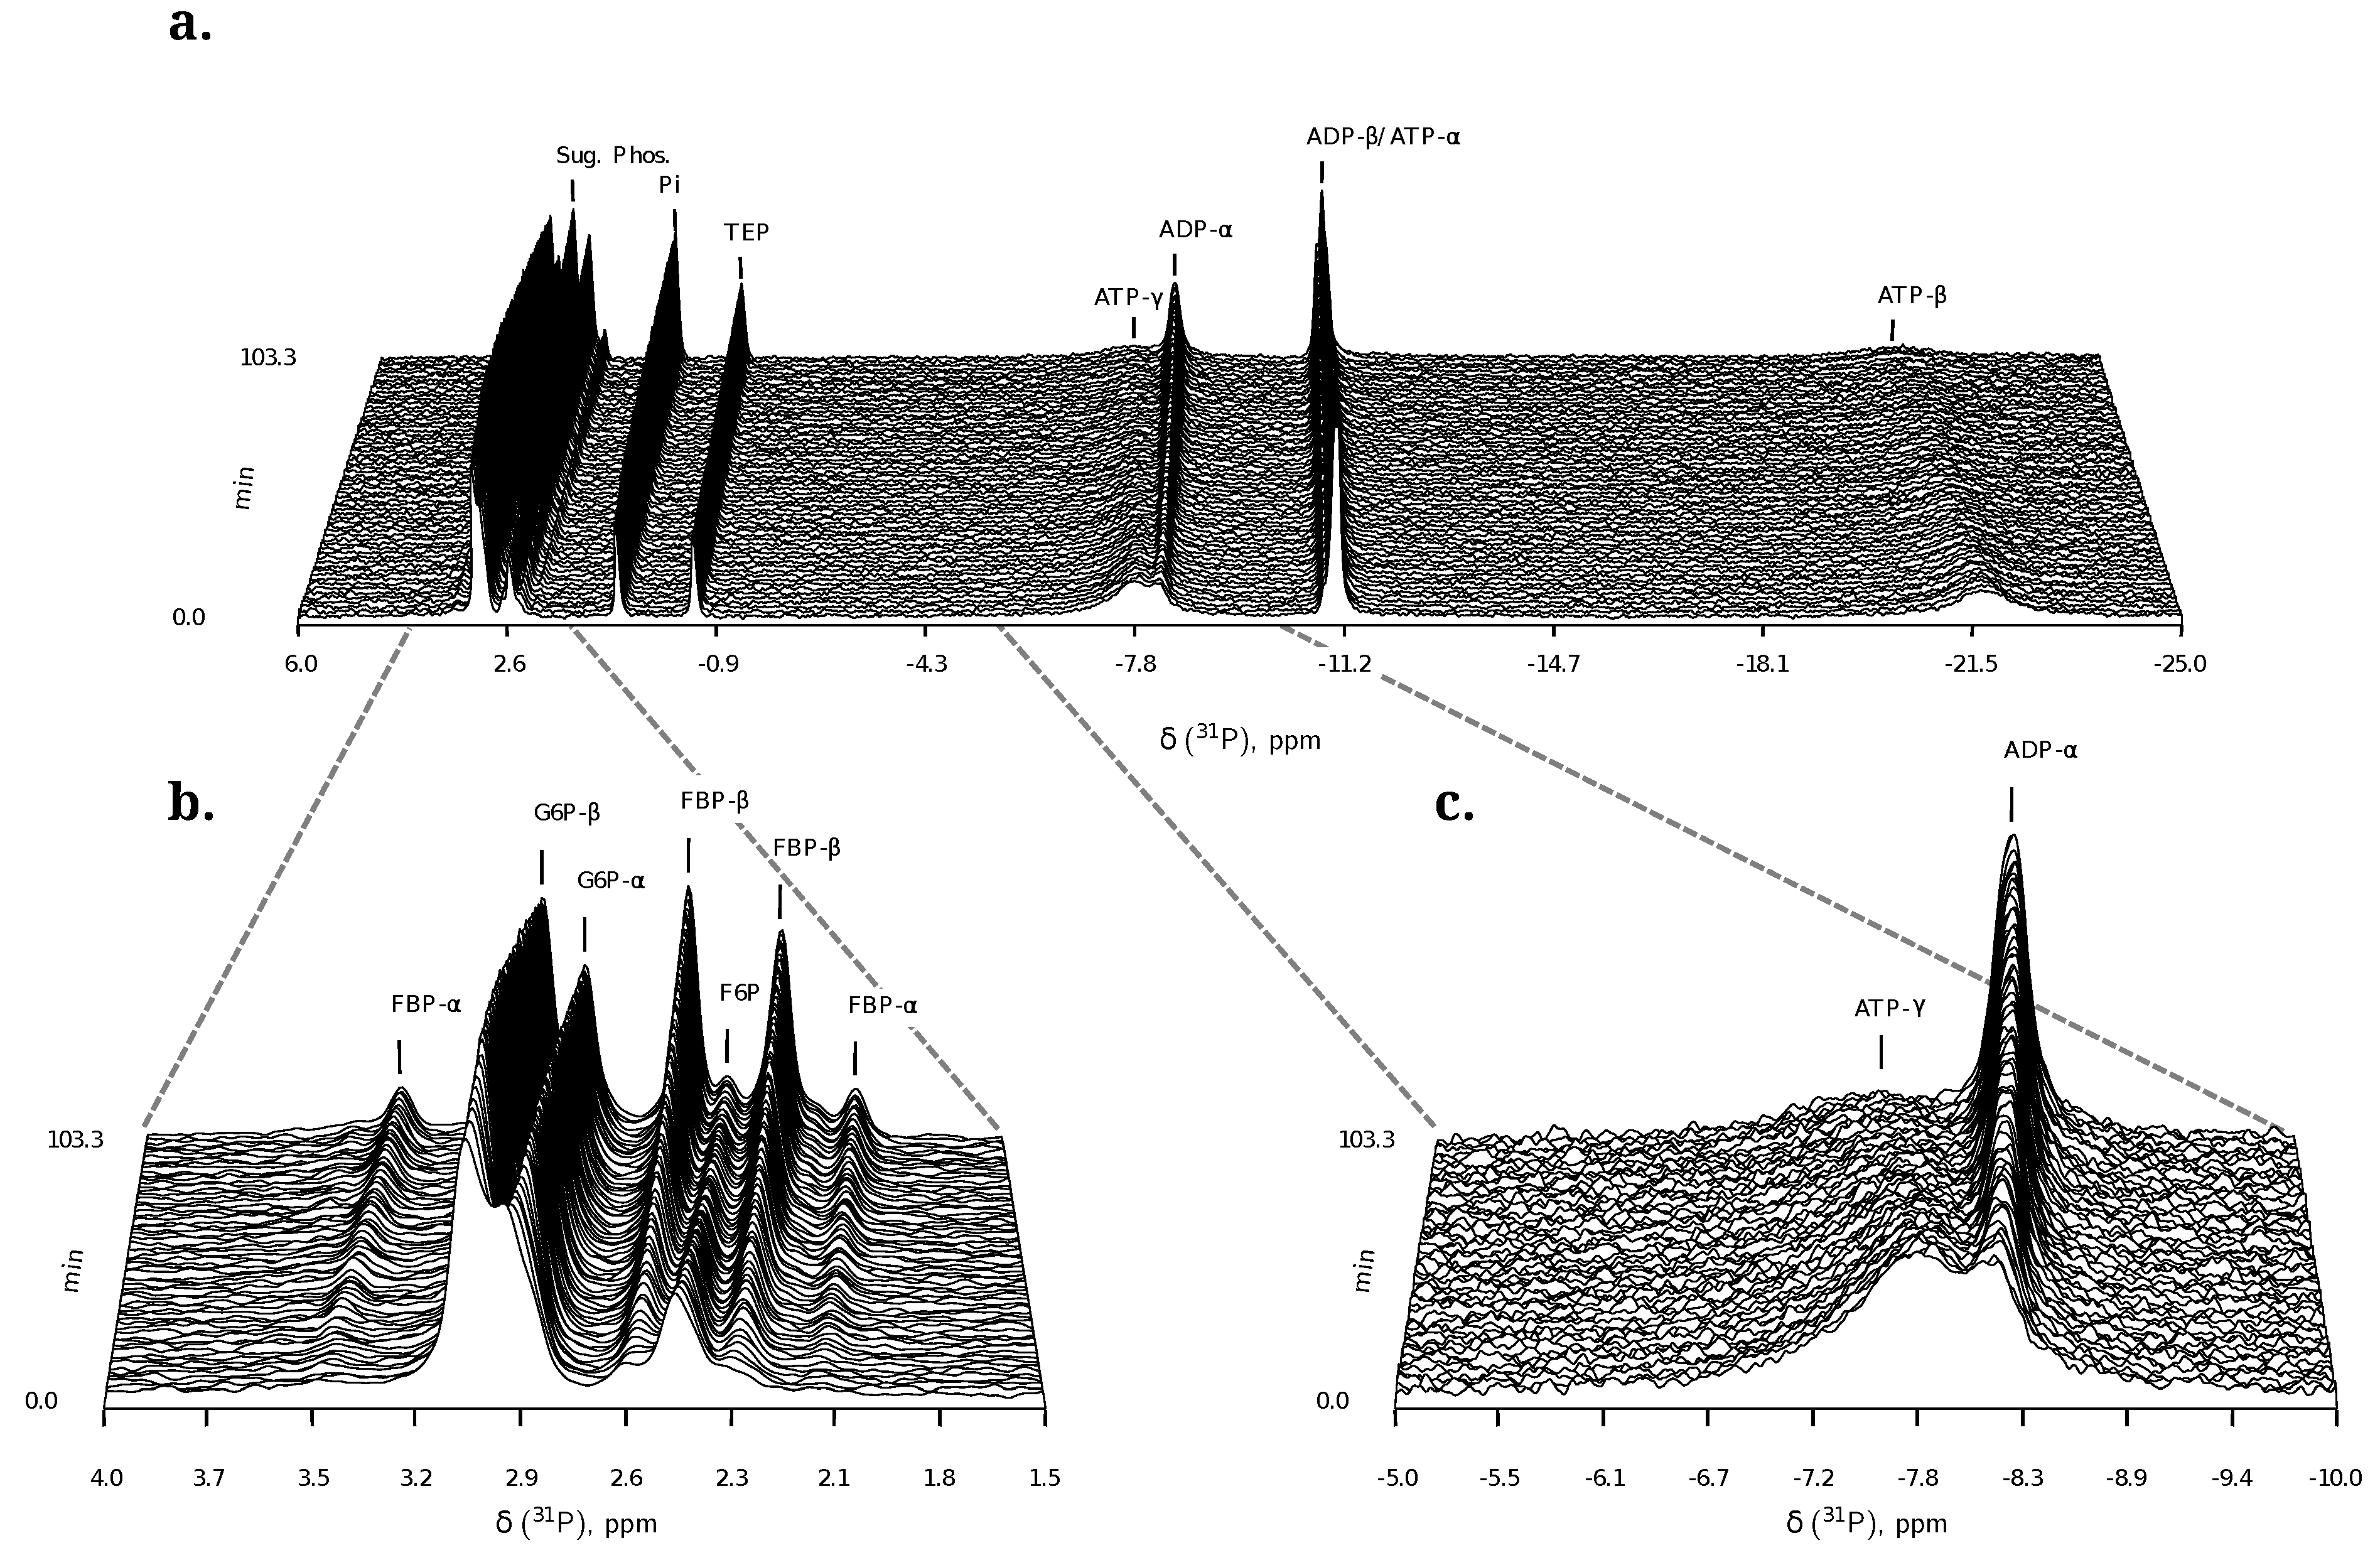
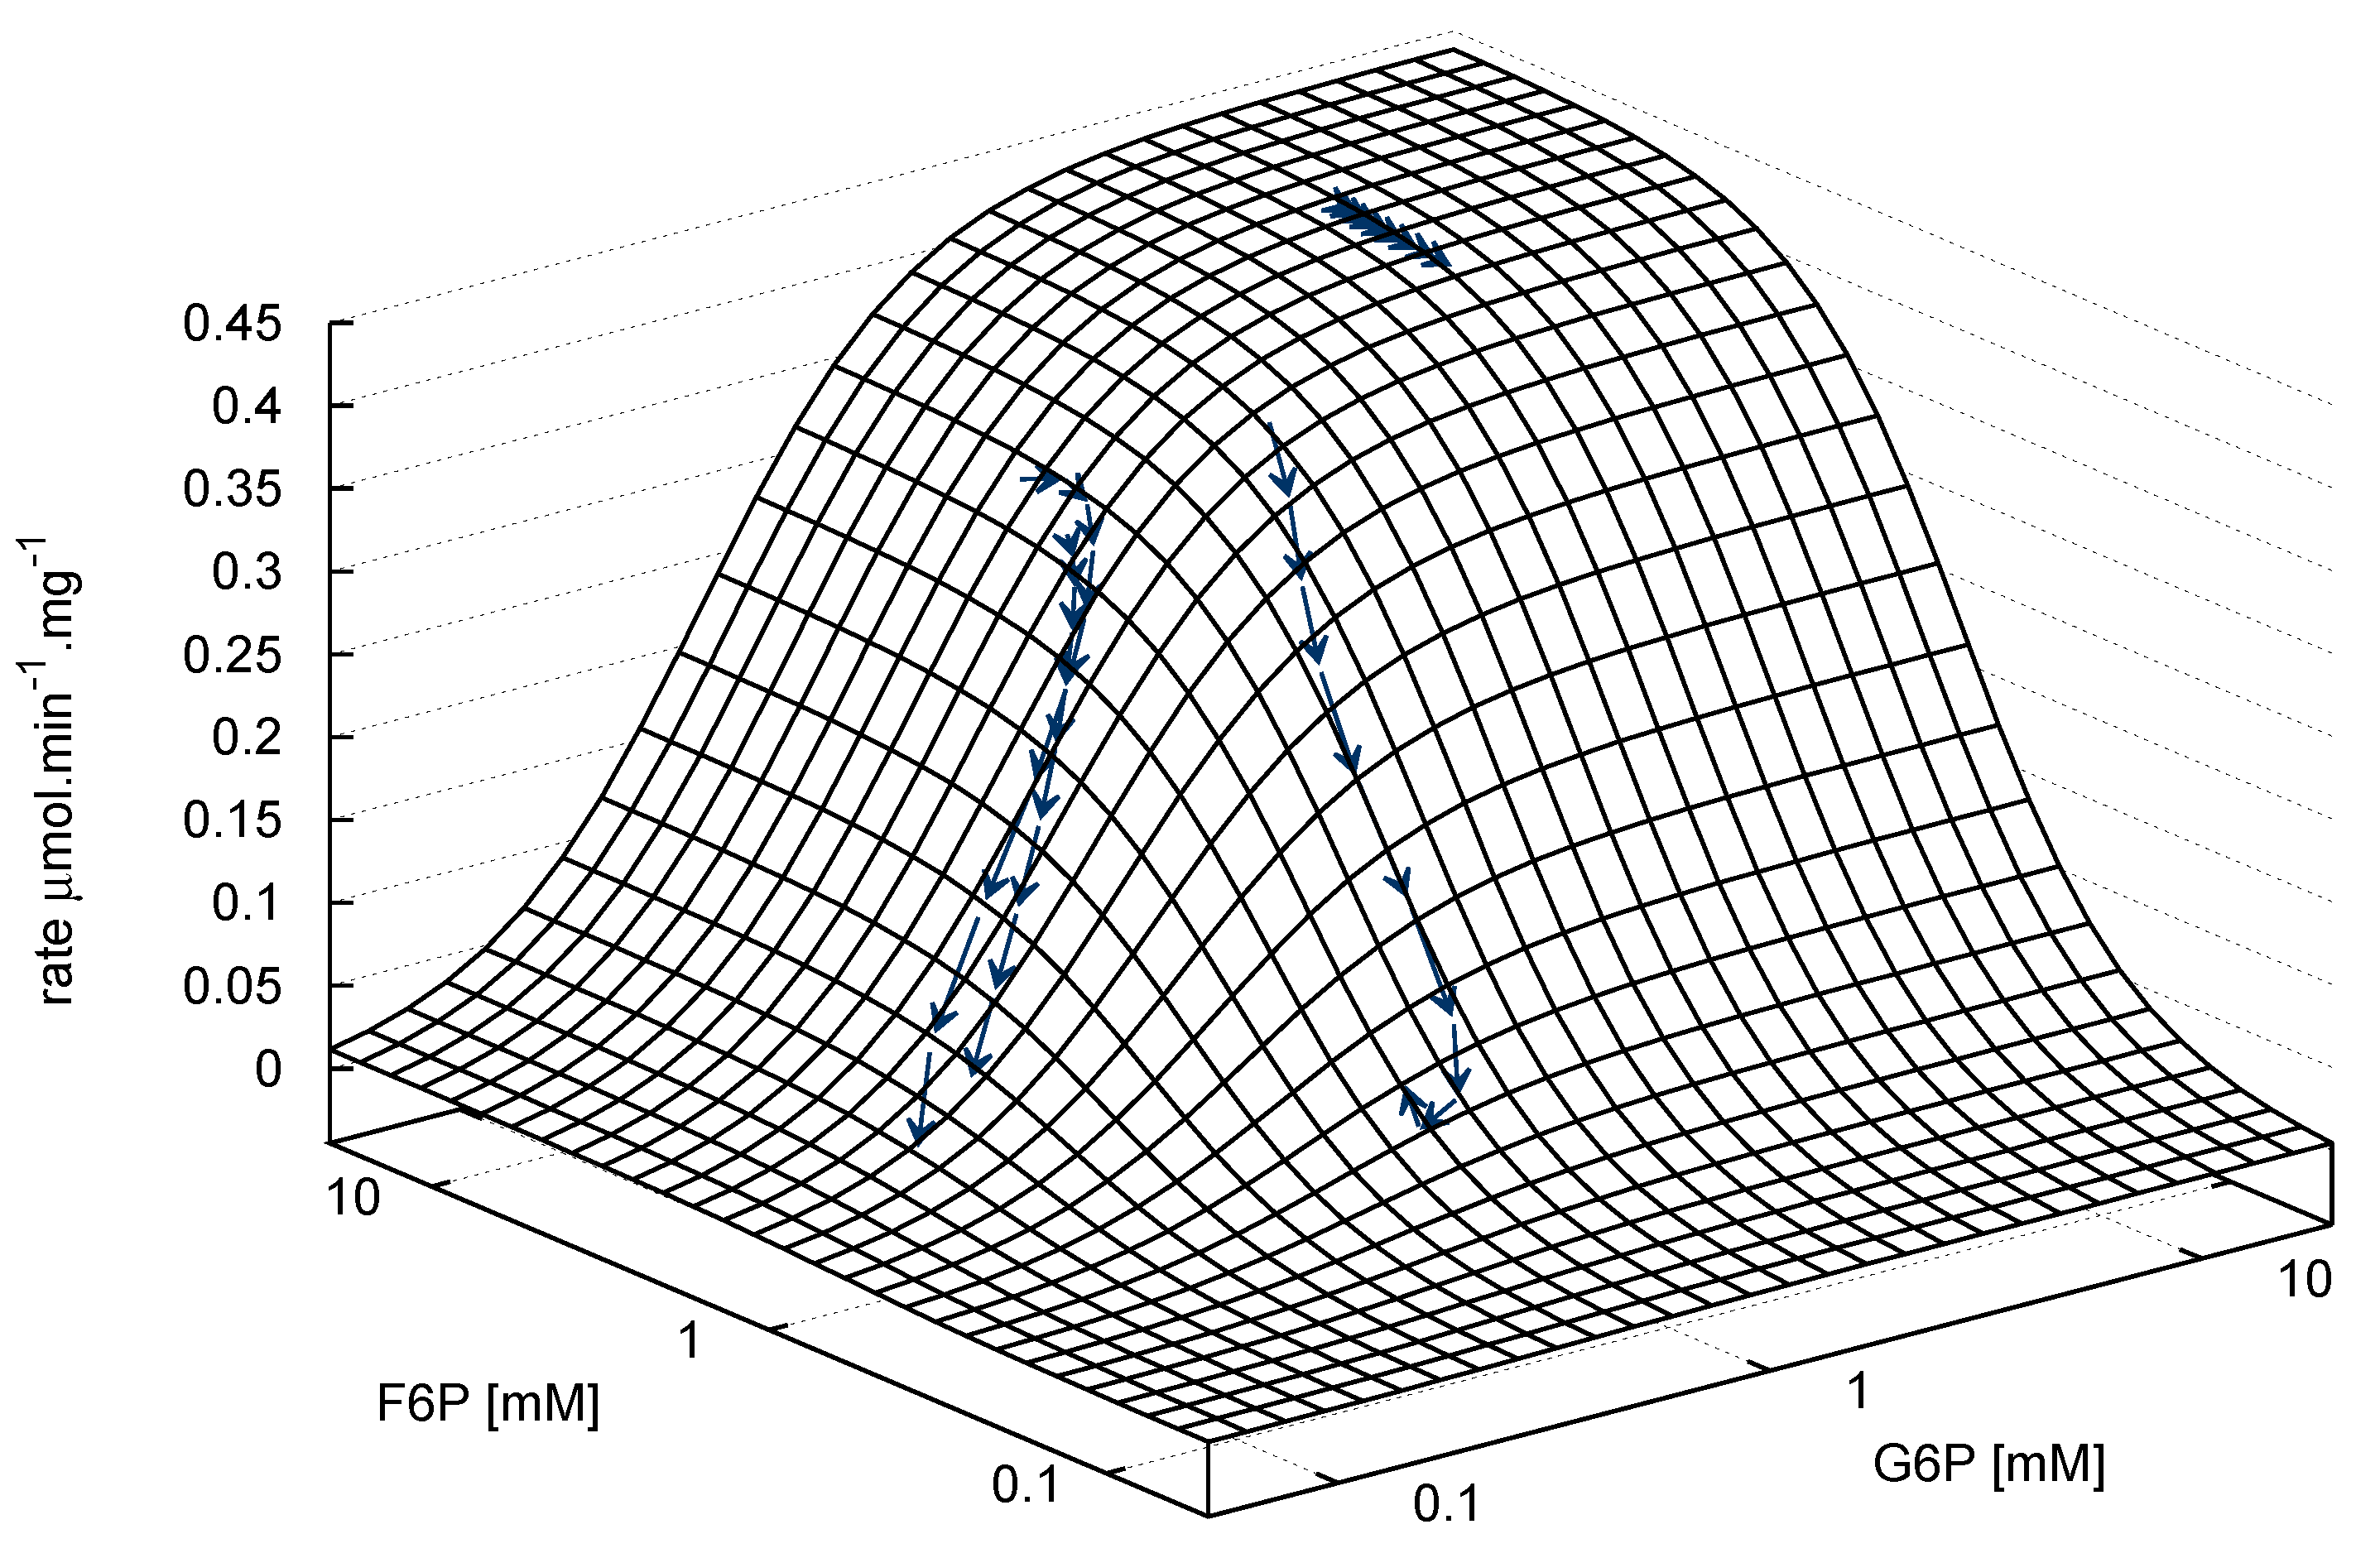
F6P + ATP ⇌ FBP + ADP
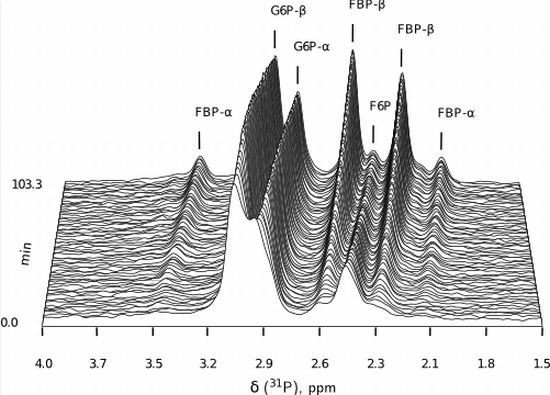
- Similarly to G6P, fructose 1,6-bisphosphate (FBP) exists as a pair of anomers in solution with the β-anomer predominating [53]. However, because of the two phosphate moieties, each anomer gives rise to two phosphorus peaks, and thus the molecule is observed as a quartet in the 31P-NMR spectrum (Figure 6b).
- An additional complexity is that F6P appears between the two peaks (2.6, 2.3 ppm) of the FBP β-anomer at ∼2.4 ppm. At low F6P and high FBP concentrations, typical of late-stage PFK time courses, F6P is obscured by the FBP peaks and has to be estimated by assuming equilibrium with the easily quantifiable G6P via the much faster PGI reaction. This is a reasonable approximation provided that the PGI reaction is allowed to equilibrate before data acquisition (the maximal rate of PGI is ∼7.5 times that of PFK). In all experiments, PGI was active, and thus to maintain higher concentrations of F6P, at times near-equilibrium concentrations of G6P were added. Data collected before PGI equilibration were excluded from fitting, reserving them for validation (Section 2.3).
- FBP-aldolase activity was not observed. This was to be expected as aldolase from E. coli is strictly Zn2+-dependent [54] and Zn2+ was excluded from assay mixtures.


 ), 5mM (
  ), 2.5mM (
  ), 1.25mM (
  ), 0.625 mM (
  ).
), 5mM ( ), 2.5mM ( ), 1.25mM ( ), 0.625 mM ( ).
).
), 5mM ( ), 2.5mM ( ), 1.25mM ( ), 0.625 mM ( ). 
2.3. Method Validation: A Minimal Model of Coupled Reactions
 , F6P
, F6P  , ATP
, ATP  , FBP
, FBP  , ADP
, ADP  ) compared with experimental time course data (G6P
  , F6P
, F6P  ., ATP
  , FBP
, FBP  , ADP
, ADP  ). The time course started with only F6P and ATP present as substrates. Note: for parameter fitting, F6P was assumed to be in equilibrium with G6P via the PGI reaction, and as such no quantified F6P data are included in this figure, except for an initial concentration. AMP and orthophosphate are not shown.
, F6P , ATP , FBP , ADP ) compared with experimental time course data (G6P , F6P ., ATP , FBP , ADP ). The time course started with only F6P and ATP present as substrates. Note: for parameter fitting, F6P was assumed to be in equilibrium with G6P via the PGI reaction, and as such no quantified F6P data are included in this figure, except for an initial concentration. AMP and orthophosphate are not shown.
). The time course started with only F6P and ATP present as substrates. Note: for parameter fitting, F6P was assumed to be in equilibrium with G6P via the PGI reaction, and as such no quantified F6P data are included in this figure, except for an initial concentration. AMP and orthophosphate are not shown.
, F6P , ATP , FBP , ADP ) compared with experimental time course data (G6P , F6P ., ATP , FBP , ADP ). The time course started with only F6P and ATP present as substrates. Note: for parameter fitting, F6P was assumed to be in equilibrium with G6P via the PGI reaction, and as such no quantified F6P data are included in this figure, except for an initial concentration. AMP and orthophosphate are not shown. 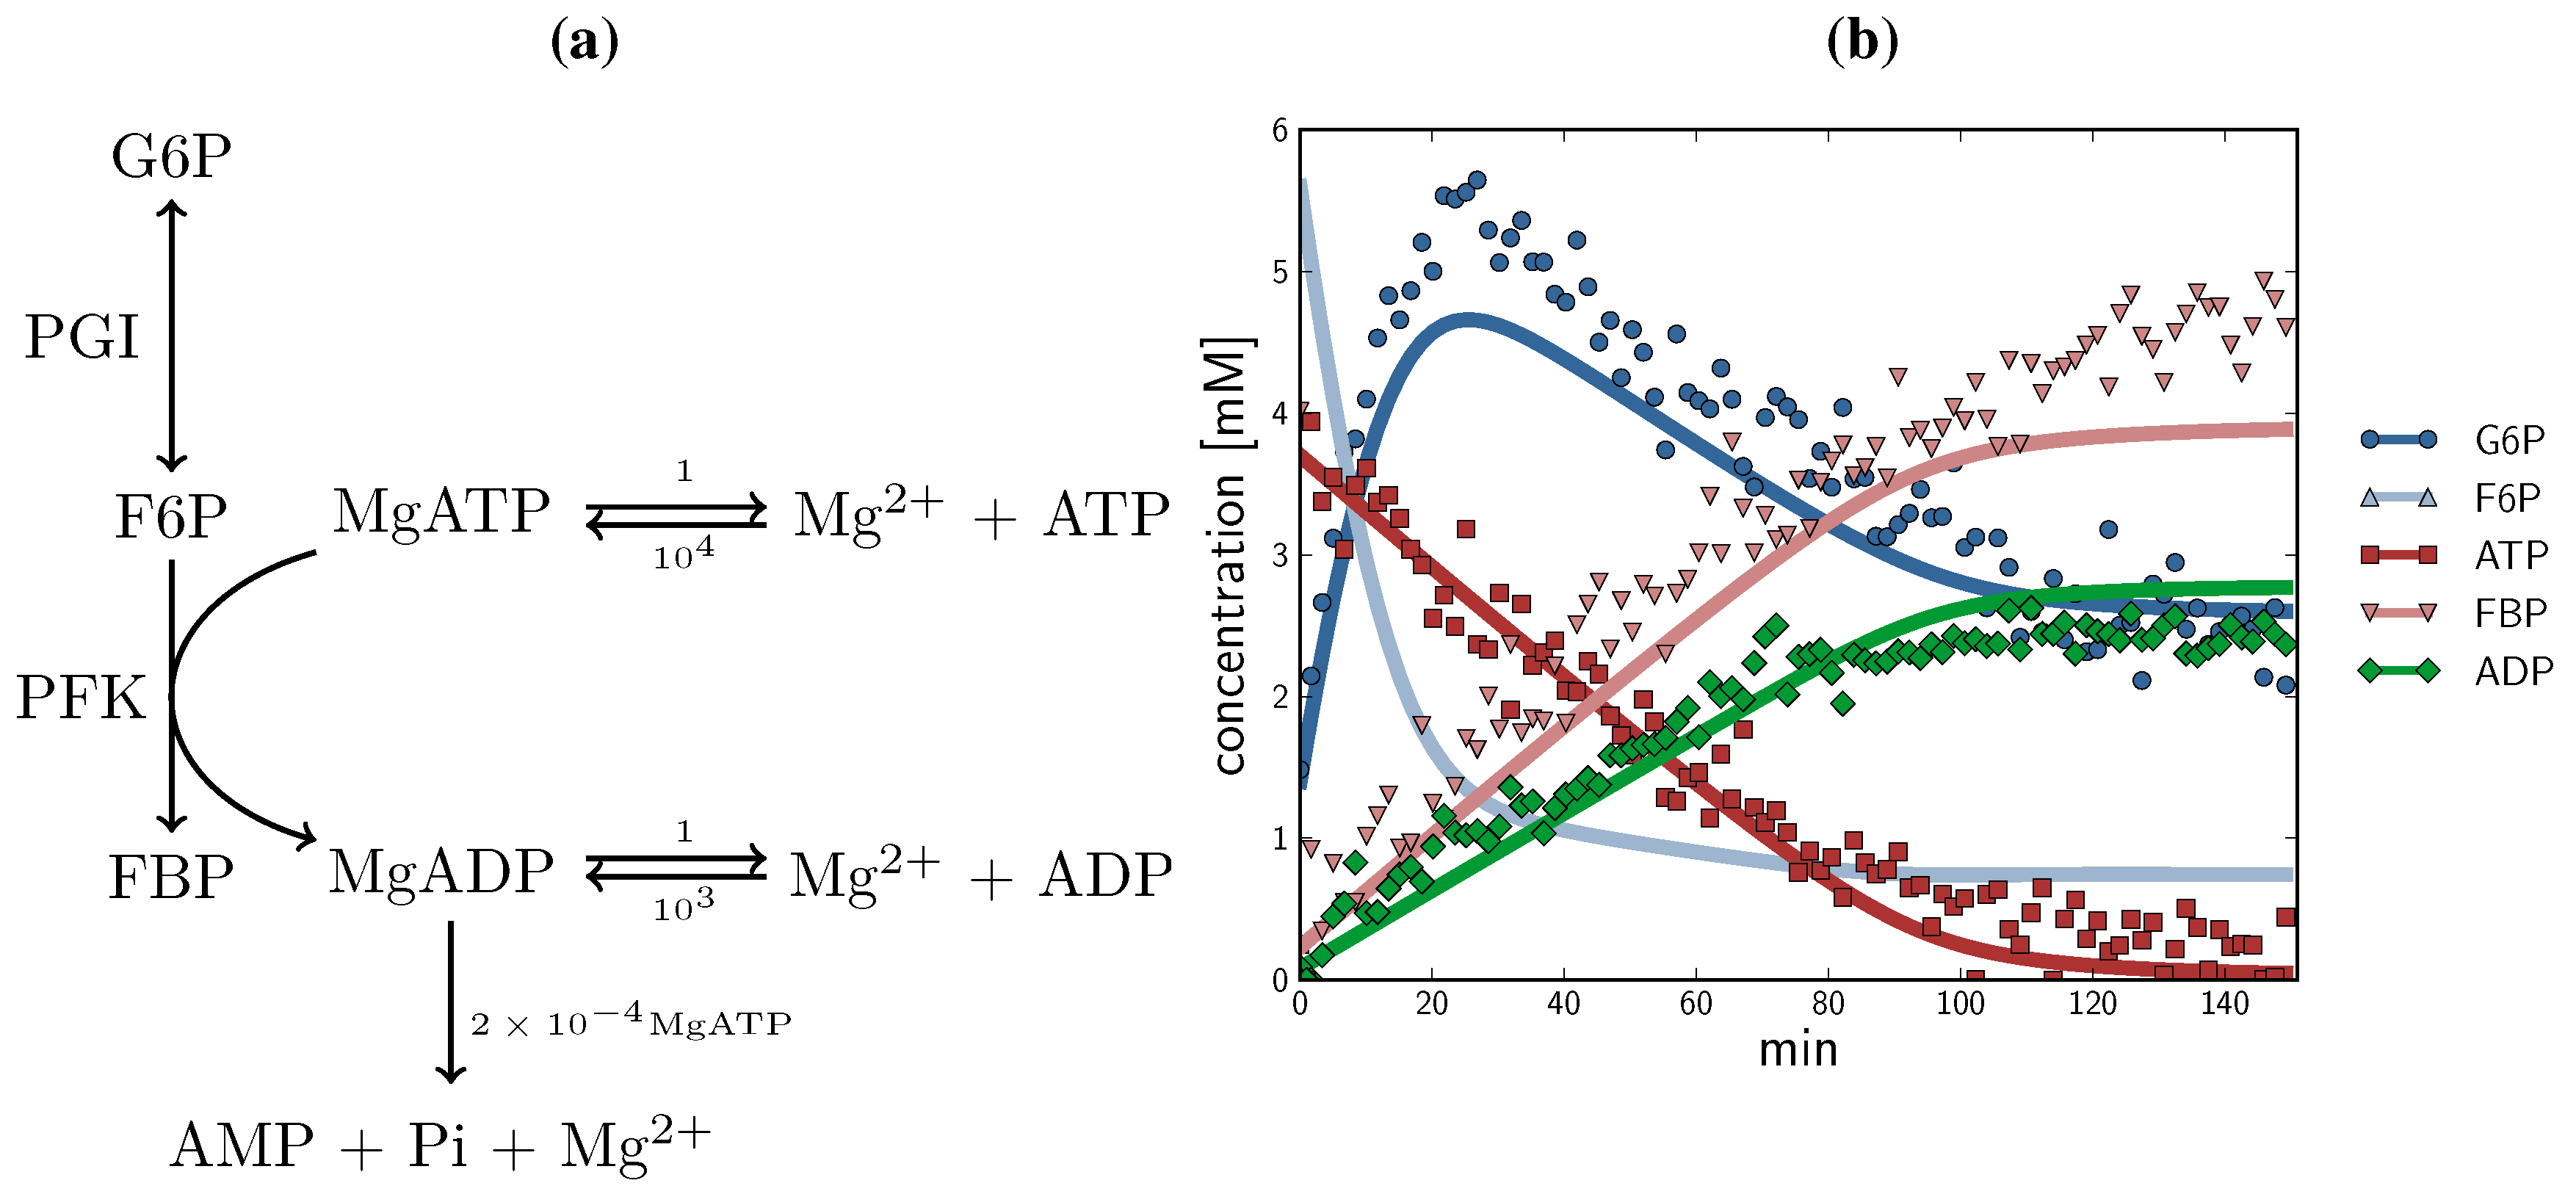
2.4. Comparison with Other Approaches
- (1) A single assay can be designed to produce rate and substrate concentration data for multiple enzymatic reactions, reducing time, cost and labour. In this study, a number of the datasets used in parameter fitting of the PFK reaction are time courses of both the PGI and PFK reactions.
- (2) Provided an NMR-sensitive nucleus is present (31P in this instance), all substrates, products and effectors can be quantified in real time. This simultaneous quantification of all metabolites circumvents an important caveat of traditional enzyme kinetics. Often metabolites and effectors will be consumed or produced by ancillary reactions mediated by enzymes other than those being studied (or simply uncatalysed reactions), a phenomenon mostly invisible to traditional enzyme assay techniques. In this study, the PFK datasets exhibited this phenomenon: F6P was consumed in reverse by the preceding glycolytic enzyme PGI producing G6P; ADP, which is both a product of the PFK reaction and exhibits a complex allosteric relationship to the PFK enzyme, was consumed by a proposed hydrolytic reaction scheme, producing AMP and orthophosphate; the allosteric inhibitor PEP was consumed both in reverse by the enolase and phosphoglycerate mutase reactions producing 2-phosphoglycerate and 3-phosphoglycerate, and in the forward direction by the pyruvate kinase reaction as ADP was released from the PFK reaction, maintaining ATP levels and generating pyruvate. Though these ancillary reactions are also taking place in the NMR time course assays, they are observable and can be taken into account during the data analysis.
- (3) When the concentration of an allosteric modifier changes during the experiment, this reduces the amount of data needed to fit allosteric kinetic equations by essentially providing an innate perturbation of effector concentration. In comparison, initial-rate enzyme assays require many reactions over a range of effector concentrations to achieve the same result, a difficulty that is exponentially compounded by the presence of multiple effectors.

3. Experimental Section
3.1. Growth Conditions and Media
3.2. Extraction
3.2.1. Sonication
3.2.2. Glass-bead Extraction
3.3. NMR Spectroscopy
3.4. Data Processing
3.5. Enzyme Assays
Supplementary Materials
Acknowledgments
Conflict of Interest
References
- Bruggeman, F.; Westerhoff, H. The nature of systems biology. Trends Microbiol. 2007, 15, 45–50. [Google Scholar] [CrossRef]
- Karr, J.R.; Sanghvi, J.C.; Macklin, D.N.; Gutschow, M.V.; Jacobs, J.M.; Bolival, B.; Assad-Garcia, N.; Glass, J.I.; Covert, M.W. A whole-cell computational model predicts phenotype from genotype. Cell 2012, 150, 389–401. [Google Scholar] [CrossRef]
- Teusink, B.; Walsh, M.; van Dam, K.; Westerhoff, H. The danger of metabolic pathways with turbo design. Trends Biochem. Sci. 1998, 23, 162–169. [Google Scholar] [CrossRef]
- Teusink, B.; Passarge, J.; Reijenga, C.; Esgalhado, E.; van der Weijden, C.; Schepper, M.; Walsh, M.; Bakker, B.; van Dam, K.; Westerhoff, H.; et al. Can yeast glycolysis be understood in terms of in vitro kinetics of the constituent enzymes? Testing biochemistry. Eur. J. Biochem. 2000, 267, 5313–5329. [Google Scholar] [CrossRef]
- Rohwer, J.M.; Botha, F.C. Analysis of sucrose accumulation in the sugar cane culm on the basis of in vitro kinetic data. Biochem. J. 2001, 358, 437–445. [Google Scholar] [CrossRef]
- Uys, L.; Botha, F.C.; Hofmeyr, J.H.S.; Rohwer, J.M. Kinetic model of sucrose accumulation in maturing sugarcane culm tissue. Phytochemistry 2007, 68, 2375–2392. [Google Scholar] [CrossRef]
- Du Preez, F.B.; Conradie, R.; Penkler, G.P.; Holm, K.; van Dooren, F.L.J.; Snoep, J.L. A comparative analysis of kinetic models of erythrocyte glycolysis. J. Theor. Biol. 2008, 252, 488–496. [Google Scholar] [CrossRef]
- Mulquiney, P.J.; Bubb, W.A.; Kuchel, P.W. Model of 2,3-bisphosphoglycerate metabolism in the human erythrocyte based on detailed enzyme kinetic equations: In vivo kinetic characterization of 2,3-bisphosphoglycerate synthase/phosphatase using 13C and 31P NMR. Biochem. J. 1999, 342 (Pt 3), 567–580. [Google Scholar]
- Snoep, J.; Penkler, G.; Rautenbach, M. Construction and validation of a detailed kinetic model for glycolysis in the asexual stage of Plasmodium falciparum: Application for drug target identification. New Biotechnol. 2009, 25, S354. [Google Scholar]
- Pillay, C.S.; Hofmeyr, J.H.S.; Rohwer, J.M. The logic of kinetic regulation in the thioredoxin system. BMC Syst. Biol. 2011, 5, 15. [Google Scholar] [CrossRef]
- Bakker, B.M.; Michels, P.A.; Opperdoes, F.R.; Westerhoff, H.V. Glycolysis in bloodstream form Trypanosoma brucei can be understood in terms of the kinetics of the glycolytic enzymes. J. Biol. Chem. 1997, 272, 3207–3215. [Google Scholar] [CrossRef]
- Albert, M.A.; Haanstra, J.R.; Hannaert, V.; Roy, J.V.; Opperdoes, F.R.; Bakker, B.M.; Michels, P.A.M. Experimental and in silico analyses of glycolytic flux control in bloodstream form Trypanosoma brucei. J. Biol. Chem. 2005, 280, 28306–28315. [Google Scholar]
- Scheer, M.; Grote, A.; Chang, A.; Schomburg, I.; Munaretto, C.; Rother, M.; Söhngen, C.; Stelzer, M.; Thiele, J.; Schomburg, D. BRENDA, the enzyme information system in 2011. Nucleic Acids Res. 2011, 39, D670–D676. [Google Scholar] [CrossRef]
- Krebs, O.; Golebiewski, M.; Kania, R.; Mir, S.; Saric, J.; Weidemann, A.; Wittig, U.; Rojas, I. SABIO-RK: A data warehouse for biochemical reactions and their kinetics. J. Integr. Bioinf. 2007, 4, 49. [Google Scholar]
- Hofmeyr, J.H.; Cornish-Bowden, A. The reversible Hill equation: How to incorporate cooperative enzymes into metabolic models. Comput. Appl. Biosci. 1997, 13, 377–385. [Google Scholar]
- Hanekom, A. Generic kinetic equations for modelling multisubstrate reactions in computational systems biology. Master’s thesis; University of Stellenbosch, Stellenbosch: South Africa, 2006. Available online: http://hdl.handle.net/10019.1/1659/ (accessed on 30 July 2012).
- Michaelis, L.; Menten, M. Die Kinetik der Invertinwirkung. Biochem. Z. 1913, 49, 333–369. [Google Scholar]
- Henri, V. Lois générales de l’action des diastases; Librairie Scientifique A. Hermann: Paris, France, 1903. [Google Scholar]
- Briggs, G.E.; Haldane, J.B. A note on the kinetics of enzyme action. Biochem. J. 1925, 19, 338–339. [Google Scholar]
- Hill, A. The possible effects of the aggregation of the molecules of haemoglobin on its dissociation curves. J. Physiol. 1910, 40. [Google Scholar]
- Schnell, S.; Chappell, M.; Evans, N.; Roussel, M. The mechanism distinguishability problem in biochemical kinetics: The single-enzyme, single-substrate reaction as a case study. C. R. Biol. 2006, 329, 51–61. [Google Scholar] [CrossRef]
- Fernley, H.N. Statistical estimations in enzyme kinetics: The integrated Michaelis equation. Eur. J. Biochem. 1974, 43, 377–378. [Google Scholar] [CrossRef]
- Duggleby, R.G. Analysis of enzyme progress curves by nonlinear regression. Methods Enzymol. 1995, 249, 61–90. [Google Scholar] [CrossRef]
- Michaelis, L.; Menten, M.L.; Johnson, K.A.; Goody, R.S. The original Michaelis constant: Translation of the 1913 Michaelis-Menten paper. Biochemistry 2011, 50, 8264–8269. [Google Scholar] [CrossRef]
- Schnell, S.; Mendoza, C. Time-dependent closed form solutions for fully competitive enzyme reactions. Bull. Math. Biol. 2000, 62, 321–336. [Google Scholar] [CrossRef]
- Goudar, C.; Harris, S.; McInerney, M.; Suflita, J. Progress curve analysis for enzyme and microbial kinetic reactions using explicit solutions based on the Lambert W function. J. Microbiol. Methods 2004, 59, 317–326. [Google Scholar] [CrossRef]
- Barshop, B.A.; Wrenn, R.F.; Frieden, C. Analysis of numerical methods for computer simulation of kinetic processes: Development of KINSIM-a flexible, portable system. Anal. Biochem. 1983, 130, 134–145. [Google Scholar] [CrossRef]
- Orsi, B.A.; Tipton, K.F. Kinetic analysis of progress curves. Methods Enzymol. 1979, 63, 159–183. [Google Scholar]
- Gibon, Y.; Blaesing, O.E.; Hannemann, J.; Carillo, P.; Hhne, M.; Hendriks, J.H.M.; Palacios, N.; Cross, J.; Selbig, J.; Stitt, M.; et al. A Robot-based platform to measure multiple enzyme activities in Arabidopsis using a set of cycling assays: comparison of changes of enzyme activities and transcript levels during diurnal cycles and in prolonged darkness. Plant Cell 2004, 16, 3304–3325. [Google Scholar] [CrossRef]
- Oldham, K.G. Radiometric Methods of Enzyme Assay; John Wiley & Sons, Inc.: Hoboken, NJ, USA, 2006; pp. 191–286. [Google Scholar]
- Greis, K.D. Mass spectrometry for enzyme assays and inhibitor screening: An emerging application in pharmaceutical research. Mass Spectrom. Rev. 2007, 26, 324–339. [Google Scholar] [CrossRef]
- Exnowitz, F.; Meyer, B.; Hackl, T. NMR for direct determination of Km and Vmax of enzyme reactions based on the Lambert W function-analysis of progress curves. Biochim. Biophys. Acta 2012, 1824, 443–449. [Google Scholar]
- James, T. Fundamentals of NMR. 1998. Available online: http://www.ias.ac.in/initiat/sci - ed/resources/chemistry/James.T.pdf (accessed on 5 November 2012).
- Ardenkjaer-Larsen, J.H.; Fridlund, B.; Gram, A.; Hansson, G.; Hansson, L.; Lerche, M.H.; Servin, R.; Thaning, M.; Golman, K. Increase in signal-to-noise ratio of > 10,000 times in liquid-state NMR. Proc. Natl. Acad. Sci.USA 2003, 100, 10158–10163. [Google Scholar]
- Meier, S.; Jensen, P.R.; Duus, J.O. Real-time detection of central carbon metabolism in living Escherichia coli and its response to perturbations. FEBS Lett. 2011, 585, 3133–3138. [Google Scholar] [CrossRef]
- Hua, Q.; Yang, C.; Baba, T.; Mori, H.; Shimizu, K. Responses of the central metabolism in Escherichia coli to phosphoglucose isomerase and glucose-6-phosphate dehydrogenase knockouts. J. Bacteriol. 2003, 185, 7053–7067. [Google Scholar] [CrossRef]
- Schreyer, R.; Böck, A. Phosphoglucose isomerase from Escherischia coli K10: Purification, properties and formation under aerobic and anaerobic conditions. Arch. Microbiol. 1980, 127, 289–296. [Google Scholar] [CrossRef]
- Peng, L.; Shimizu, K. Global metabolic regulation analysis for Escherichia coli K12 based on protein expression by 2-dimensional electrophoresis and enzyme activity measurement. Appl. Microbiol. Biotechnol. 2003, 61, 163–178. [Google Scholar]
- Neidhardt, F.C. Escherichia Coli and Salmonella: Cellular and Molecular Biology; American Society for Microbiology: Washington, DC, 1996. [Google Scholar]
- Blangy, D. Phosphofructokinase from E. coli: Evidence for a tetrameric structure of the enzyme. FEBS Lett. 1968, 2, 109–111. [Google Scholar] [CrossRef]
- Kemerer, V.R.; Griffin, C.C.; Brand, L. Phosphofructokinase from Escherichia coli. Methods Enzymol. 1975, 42, 91–98. [Google Scholar] [CrossRef]
- Blangy, D.; Buc, H.; Monod, J. Kinetics of the allosteric interactions of phosphofructokinase from Escherichia coli. J. Mol. Biol. 1968, 31, 13–35. [Google Scholar] [CrossRef]
- Doelle, H.; Manderson, G. Comparative studies of fructose 1, 6-diphosphate aldolase from Escherichia coli 518 and Lactobacillus casei var. rhamnosus ATCC 7469. Anton. Leeuw. 1971, 37, 21–31. [Google Scholar] [CrossRef]
- Deville-Bonne, D.; Laine, R.; Garel, J. Substrate antagonism in the kinetic mechanism of E. coli phosphofructokinase-1. FEBS Lett. 1991, 290, 173–176. [Google Scholar] [CrossRef]
- Peskov, K.; Goryanin, I.; Demin, O. Kinetic model of phosphofructokinase-1 from Escherichia coli. J. Bioinform. Comput. Biol. 2008, 6, 843–867. [Google Scholar] [CrossRef]
- Glonek, T. 31P NMR of Mg-ATP in dilute solutions: Complexation and exchange. Int. J. Biochem. 1992, 24, 1533–1559. [Google Scholar] [CrossRef]
- Bock, J.L. The binding of metal ions to ATP: a proton and phosphorus nmr investigation of diamagnetic metal-ATP complexes. J. Inorg. Biochem. 1980, 12, 119–130. [Google Scholar] [CrossRef]
- Rohwer, J.M.; Hanekom, A.J.; Hofmeyr, J.H.S. A universal rate equation for systems biology. Experimental Standard Conditions of Enzyme Characterizations. In Proceedings of the 2nd International Beilstein Workshop, R¨udesheim am Rhein, Germany, 19-23 March 2006; Hicks, M.G., Kettner, C., Eds.; Beilstein-Institut zur Fö rderung der Chemischen Wissenschaften: Frankfurt, Germany, 2007; pp. 175–187. [Google Scholar]
- Jones, E.; Oliphant, T.; Peterson, P. SciPy: Open source scientific tools for Python. 2001. Available online: http://www.scipy.org/ (accessed on 1 November 2012).
- Press, W.; Vetterling, W.; Flannery, B.; Teukolsky, S. Numerical Recipes in C: The Art of Scientific Computing, 2nd ed; Cambridge University Press: Cambridge, UK, 1993; Volume 1, pp. 2–3. [Google Scholar]
- Wurster, B.; Schneider, F. Kinetics of glucosephosphate isomerase (EC 5.3.1.9) from yeast in vitro and its application to flux calculations for the fermentation pathway of anaerobic yeast cells. H.-S. Z. Physiol. Chem. 1970, 351, 961. [Google Scholar] [CrossRef]
- Gao, H.; Chen, Y.; Leary, J. Kinetic measurements of phosphoglucose isomerase and phosphomannose isomerase by direct analysis of phosphorylated aldose-ketose isomers using tandem mass spectrometry. Int. J. Mass Spectrom. 2005, 240, 291–299. [Google Scholar] [CrossRef]
- Midelfort, C.; Gupta, R.; Rose, I. Fructose 1, 6-bisphosphate: isomeric composition, kinetics, and substrate specificity for the aldolas. Biochemistry 1976, 15, 2178–2185. [Google Scholar] [CrossRef]
- Horecker, B.L.; Tsolas, O.; Lai, C.Y. Aldolases. The Enzymes 1972, 7, 213–258. [Google Scholar] [CrossRef]
- Böhme, H.J.; Schellenberger, W.; Hofmann, E. Microcalorimetric determination of thermochemical parameters of the phosphofructokinase reaction. Acta Biol. Med. Ger. 1975, 34, 15–20. [Google Scholar]
- Olivier, B.G.; Rohwer, J.M.; Hofmeyr, J.H.S. Modelling cellular systems with PySCeS. Bioinformatics 2005, 21, 560–561. [Google Scholar] [CrossRef]
- Frey, C.M.; Stuehr, J.E. Interactions of divalent metal ions with inorganic and nucleoside phosphates. I. Thermodynamics. J. Am. Chem. Soc. 1972, 94, 8898–8904. [Google Scholar] [CrossRef]
- Frey, C.M.; Banyasz, J.L.; Stuehr, J.E. Interactions of divalent metal ions with inorganic and nucleoside phosphates. II. Kinetics of magnesium(II) with HP3O104−, ATP, CTP, HP2O73−, ADP, and CDP. J. Am. Chem. Soc. 1972, 94, 9198–9204. [Google Scholar]
- Selwyn, M.J. A simple test for inactivation of an enzyme during assay. Biochim. Biophys. Acta 1965, 105, 193–195. [Google Scholar] [CrossRef]
- Ugurbil, K.; Rottenberg, H.; Glynn, P.; Shulman, R. 31P nuclear magnetic resonance studies of bioenergetics and glycolysis in anaerobic Escherichia coli cells. Proc. Natl. Acad. Sci. USA 1978, 75, 2244. [Google Scholar] [CrossRef]
- Bradford, M. A rapid and sensitive method for the quantitation of microgram quantities of protein utilizing the principle of protein-dye binding. Anal. Biochem. 1976, 72, 248–254. [Google Scholar] [CrossRef]
- Song, D.; Jacques, N. Cell disruption of Escherichia coli by glass bead stirring for the recovery of recombinant proteins. Anal. Biochem. 1997, 248, 300–301. [Google Scholar] [CrossRef]
- Strohh¨acker, J.; Graaf, A.; Schoberth, S.; Wittig, R.; Sahm, H. 31P Nuclear magnetic resonancestudies of ethanol inhibition in Zymomonas mobilis. Arch. Microbiol. 1993, 159, 484–490. [Google Scholar] [CrossRef]
- Helmus, J.J.; Jaroniec, C.P. NMRglue. 2012. Available online: http://code.google.com/p/nmrglue/ (accessed on 31 July 2012).
- Hunter, J.D. Matplotlib: A 2D graphics environment. Comput. Sci. Eng. 2007, 9, 90–95. [Google Scholar] [CrossRef]
- Williams, T.; Kelley, C.; Bröker, H-B.; Campbell, J.; Cunningham, R.; Denholm, D.; Elber, E.; Fearick, R.; Grammes, C.; Hart, L. Gnuplot 4.4: an interactive plotting program. 2011. Available online: http://gnuplot.sourceforge.net/ (accessed on 31 July 2012).
- Inkscape: An Open Source vector graphics editor. Available online: http://www.inkscape.org/ (accessed on 31 July 2012).
Supplementary Files
© 2012 by the authors; licensee MDPI, Basel, Switzerland. This article is an open-access article distributed under the terms and conditions of the Creative Commons Attribution license (http://creativecommons.org/licenses/by/3.0/).
Share and Cite
Eicher, J.J.; Snoep, J.L.; Rohwer, J.M. Determining Enzyme Kinetics for Systems Biology with Nuclear Magnetic Resonance Spectroscopy. Metabolites 2012, 2, 818-843. https://doi.org/10.3390/metabo2040818
Eicher JJ, Snoep JL, Rohwer JM. Determining Enzyme Kinetics for Systems Biology with Nuclear Magnetic Resonance Spectroscopy. Metabolites. 2012; 2(4):818-843. https://doi.org/10.3390/metabo2040818
Chicago/Turabian StyleEicher, Johann J., Jacky L. Snoep, and Johann M. Rohwer. 2012. "Determining Enzyme Kinetics for Systems Biology with Nuclear Magnetic Resonance Spectroscopy" Metabolites 2, no. 4: 818-843. https://doi.org/10.3390/metabo2040818