Global Metabolomics Reveals Urinary Biomarkers of Breast Cancer in a MCF-7 Xenograft Mouse Model

Abstract
:1. Introduction
2. Results and Discussion
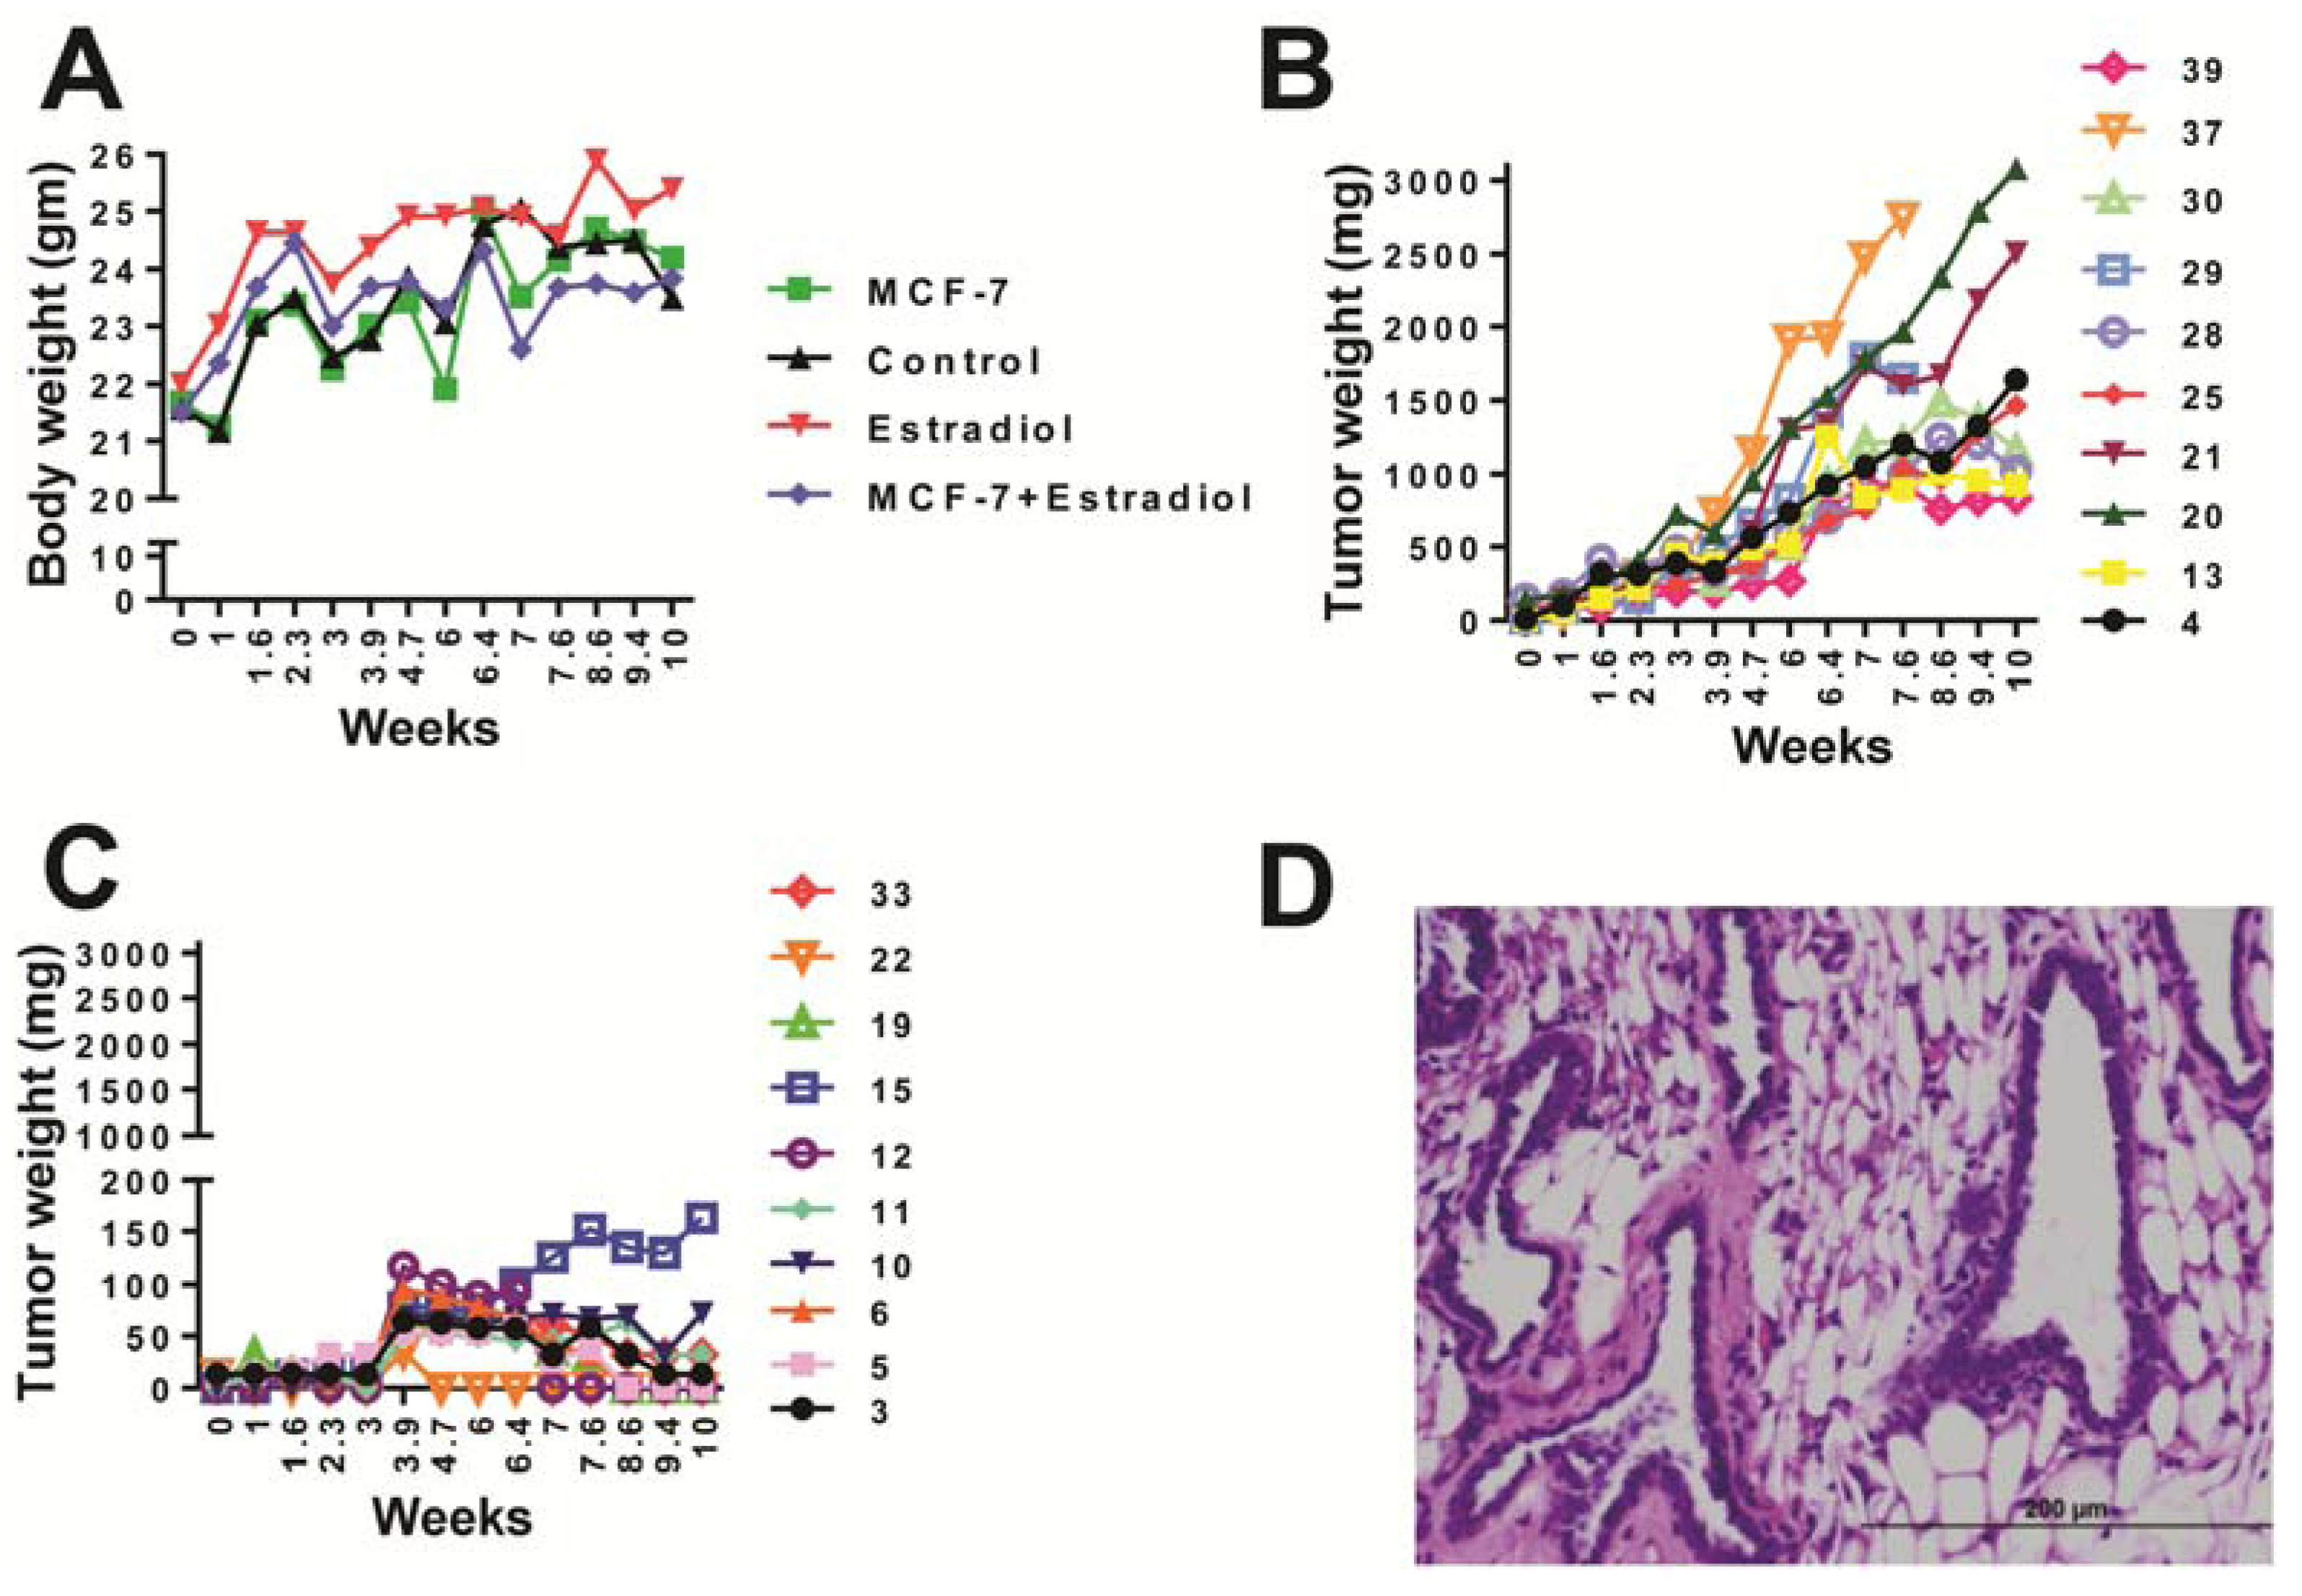
2.1. Animal Health

2.2. UPLC-ESI-QTOFMS-Based Metabolomics Analysis
 estradiol only,
  MCF-7 cells only,
  estradiol plus MCF-7 cells. These plots show increased intra-group clustering and inter-group separation at later time points. (D) PLS-DA scores plot of mouse urine samples analyzed by UPLC-ESI-QTOFMS ESI- 9.5 weeks after dosing.
estradiol only, MCF-7 cells only, estradiol plus MCF-7 cells. These plots show increased intra-group clustering and inter-group separation at later time points. (D) PLS-DA scores plot of mouse urine samples analyzed by UPLC-ESI-QTOFMS ESI- 9.5 weeks after dosing.
estradiol plus MCF-7 cells. These plots show increased intra-group clustering and inter-group separation at later time points. (D) PLS-DA scores plot of mouse urine samples analyzed by UPLC-ESI-QTOFMS ESI- 9.5 weeks after dosing.
estradiol only, MCF-7 cells only, estradiol plus MCF-7 cells. These plots show increased intra-group clustering and inter-group separation at later time points. (D) PLS-DA scores plot of mouse urine samples analyzed by UPLC-ESI-QTOFMS ESI- 9.5 weeks after dosing.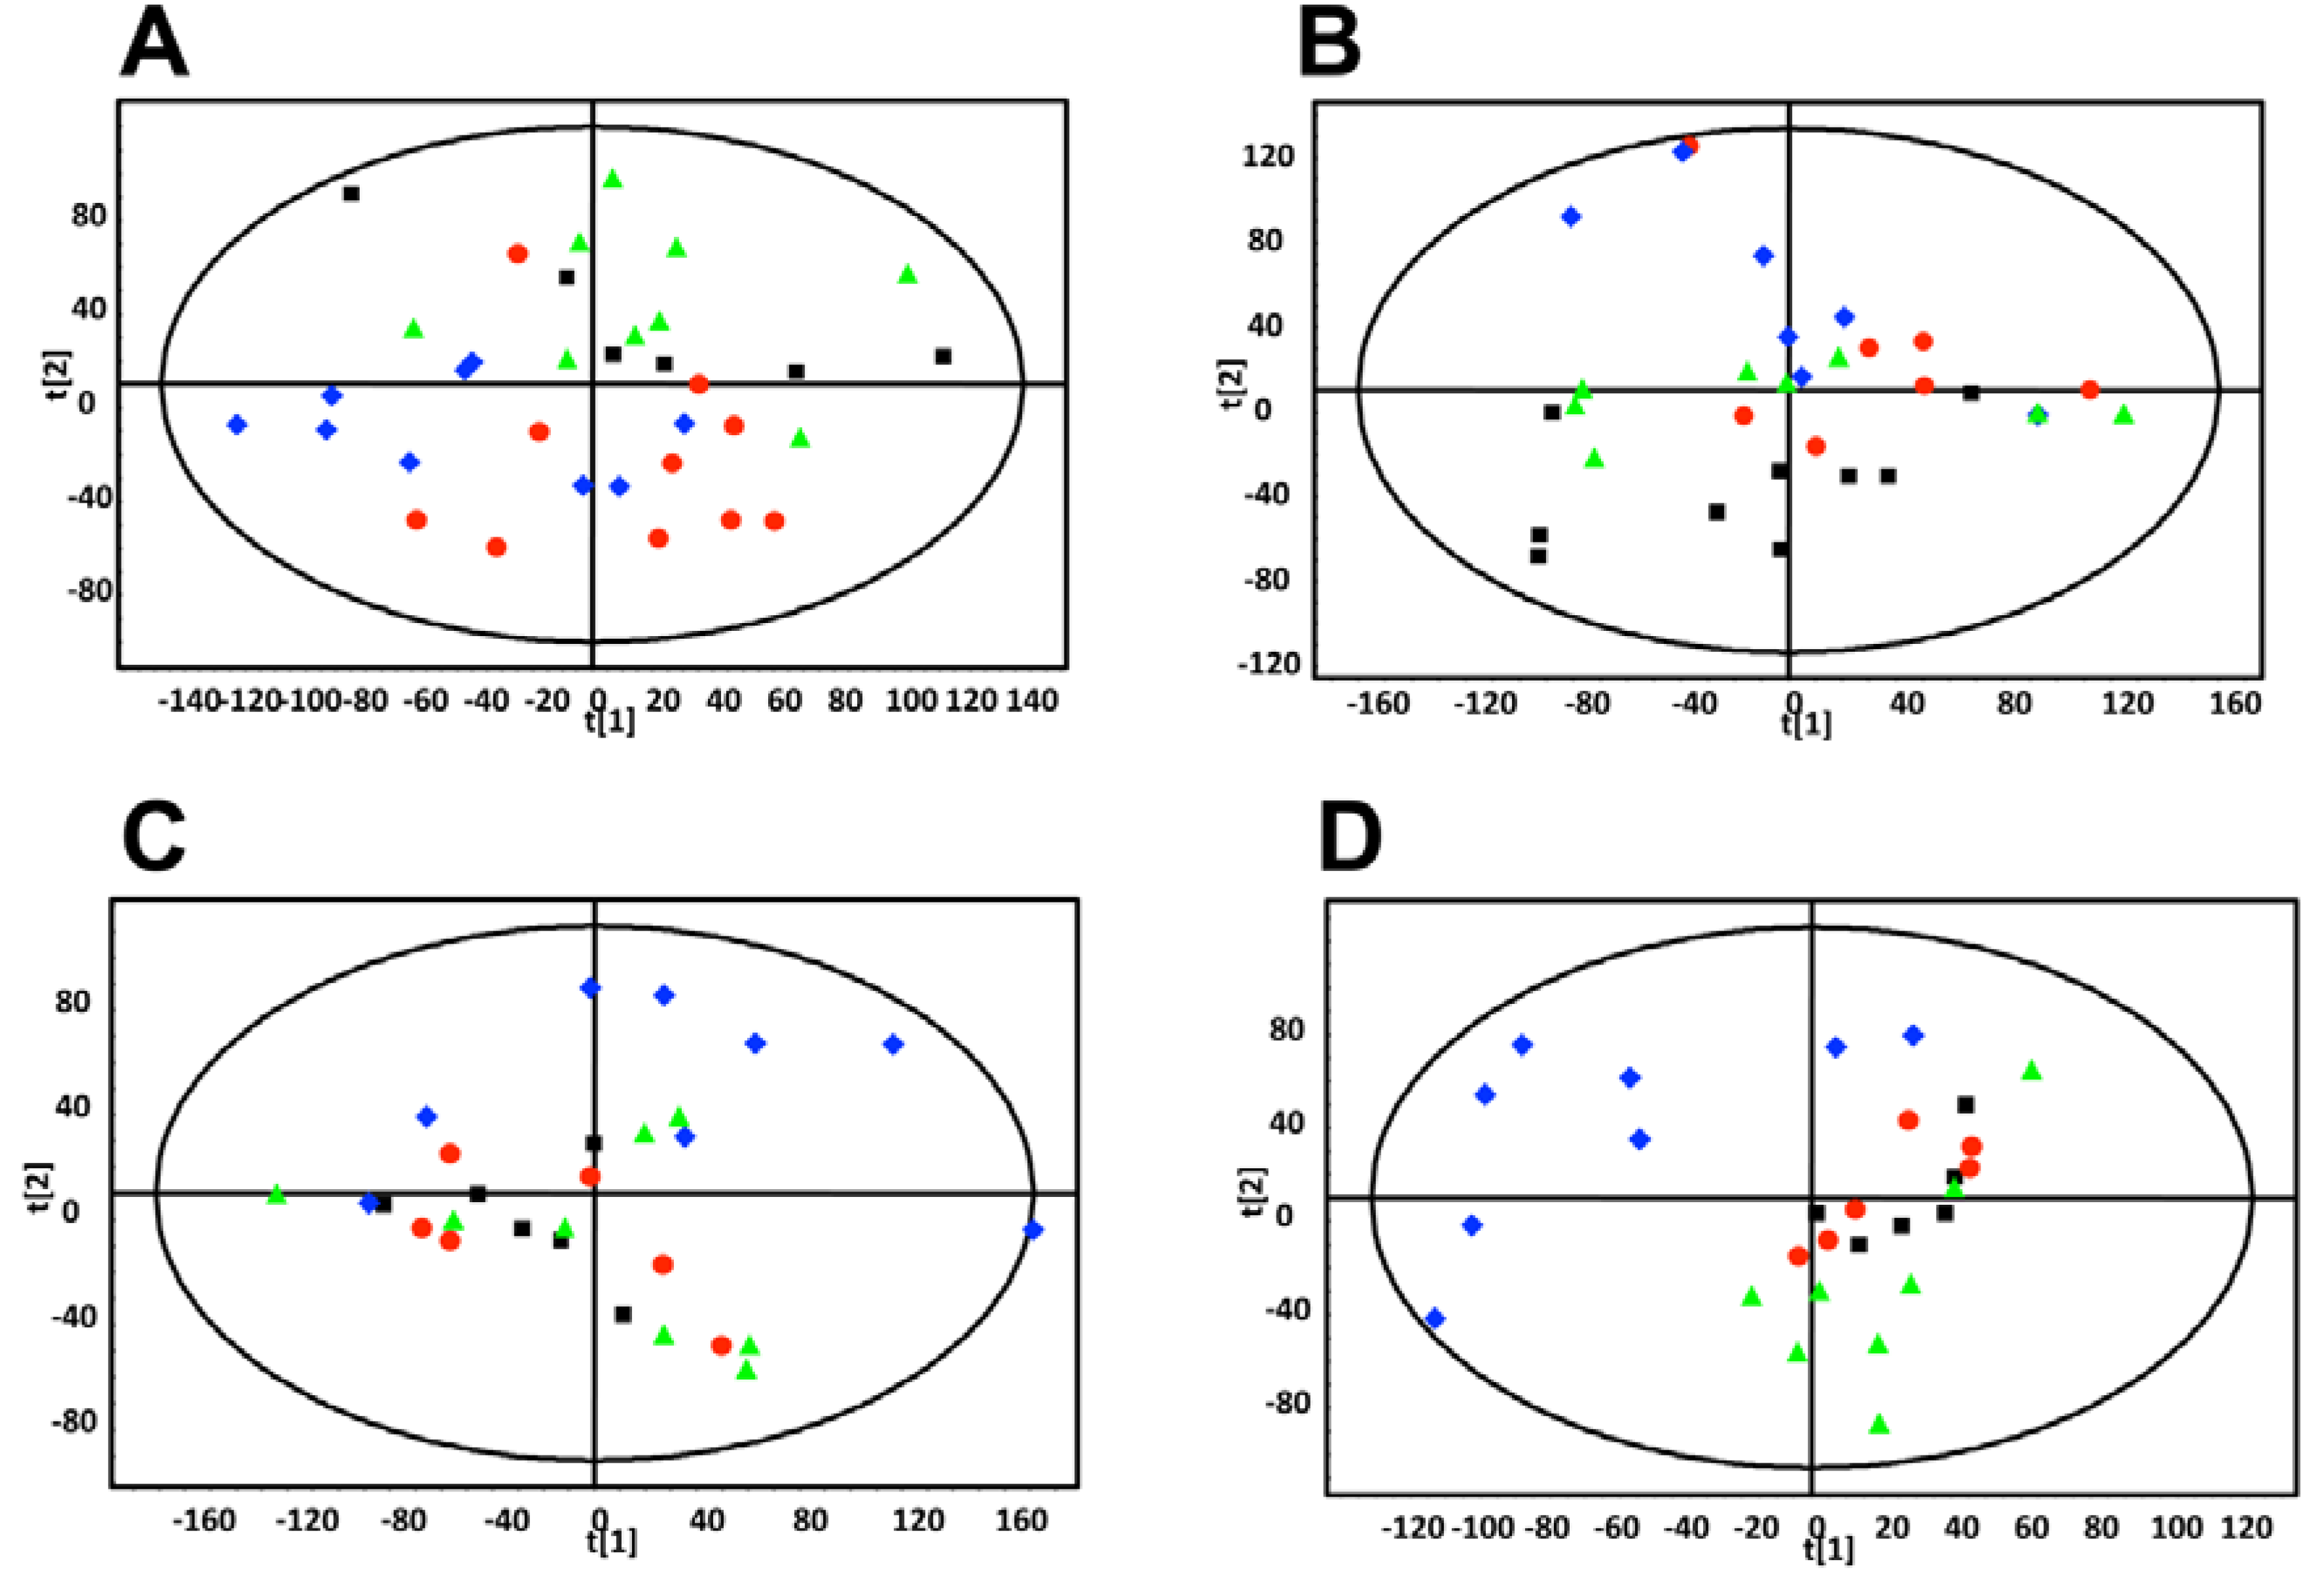

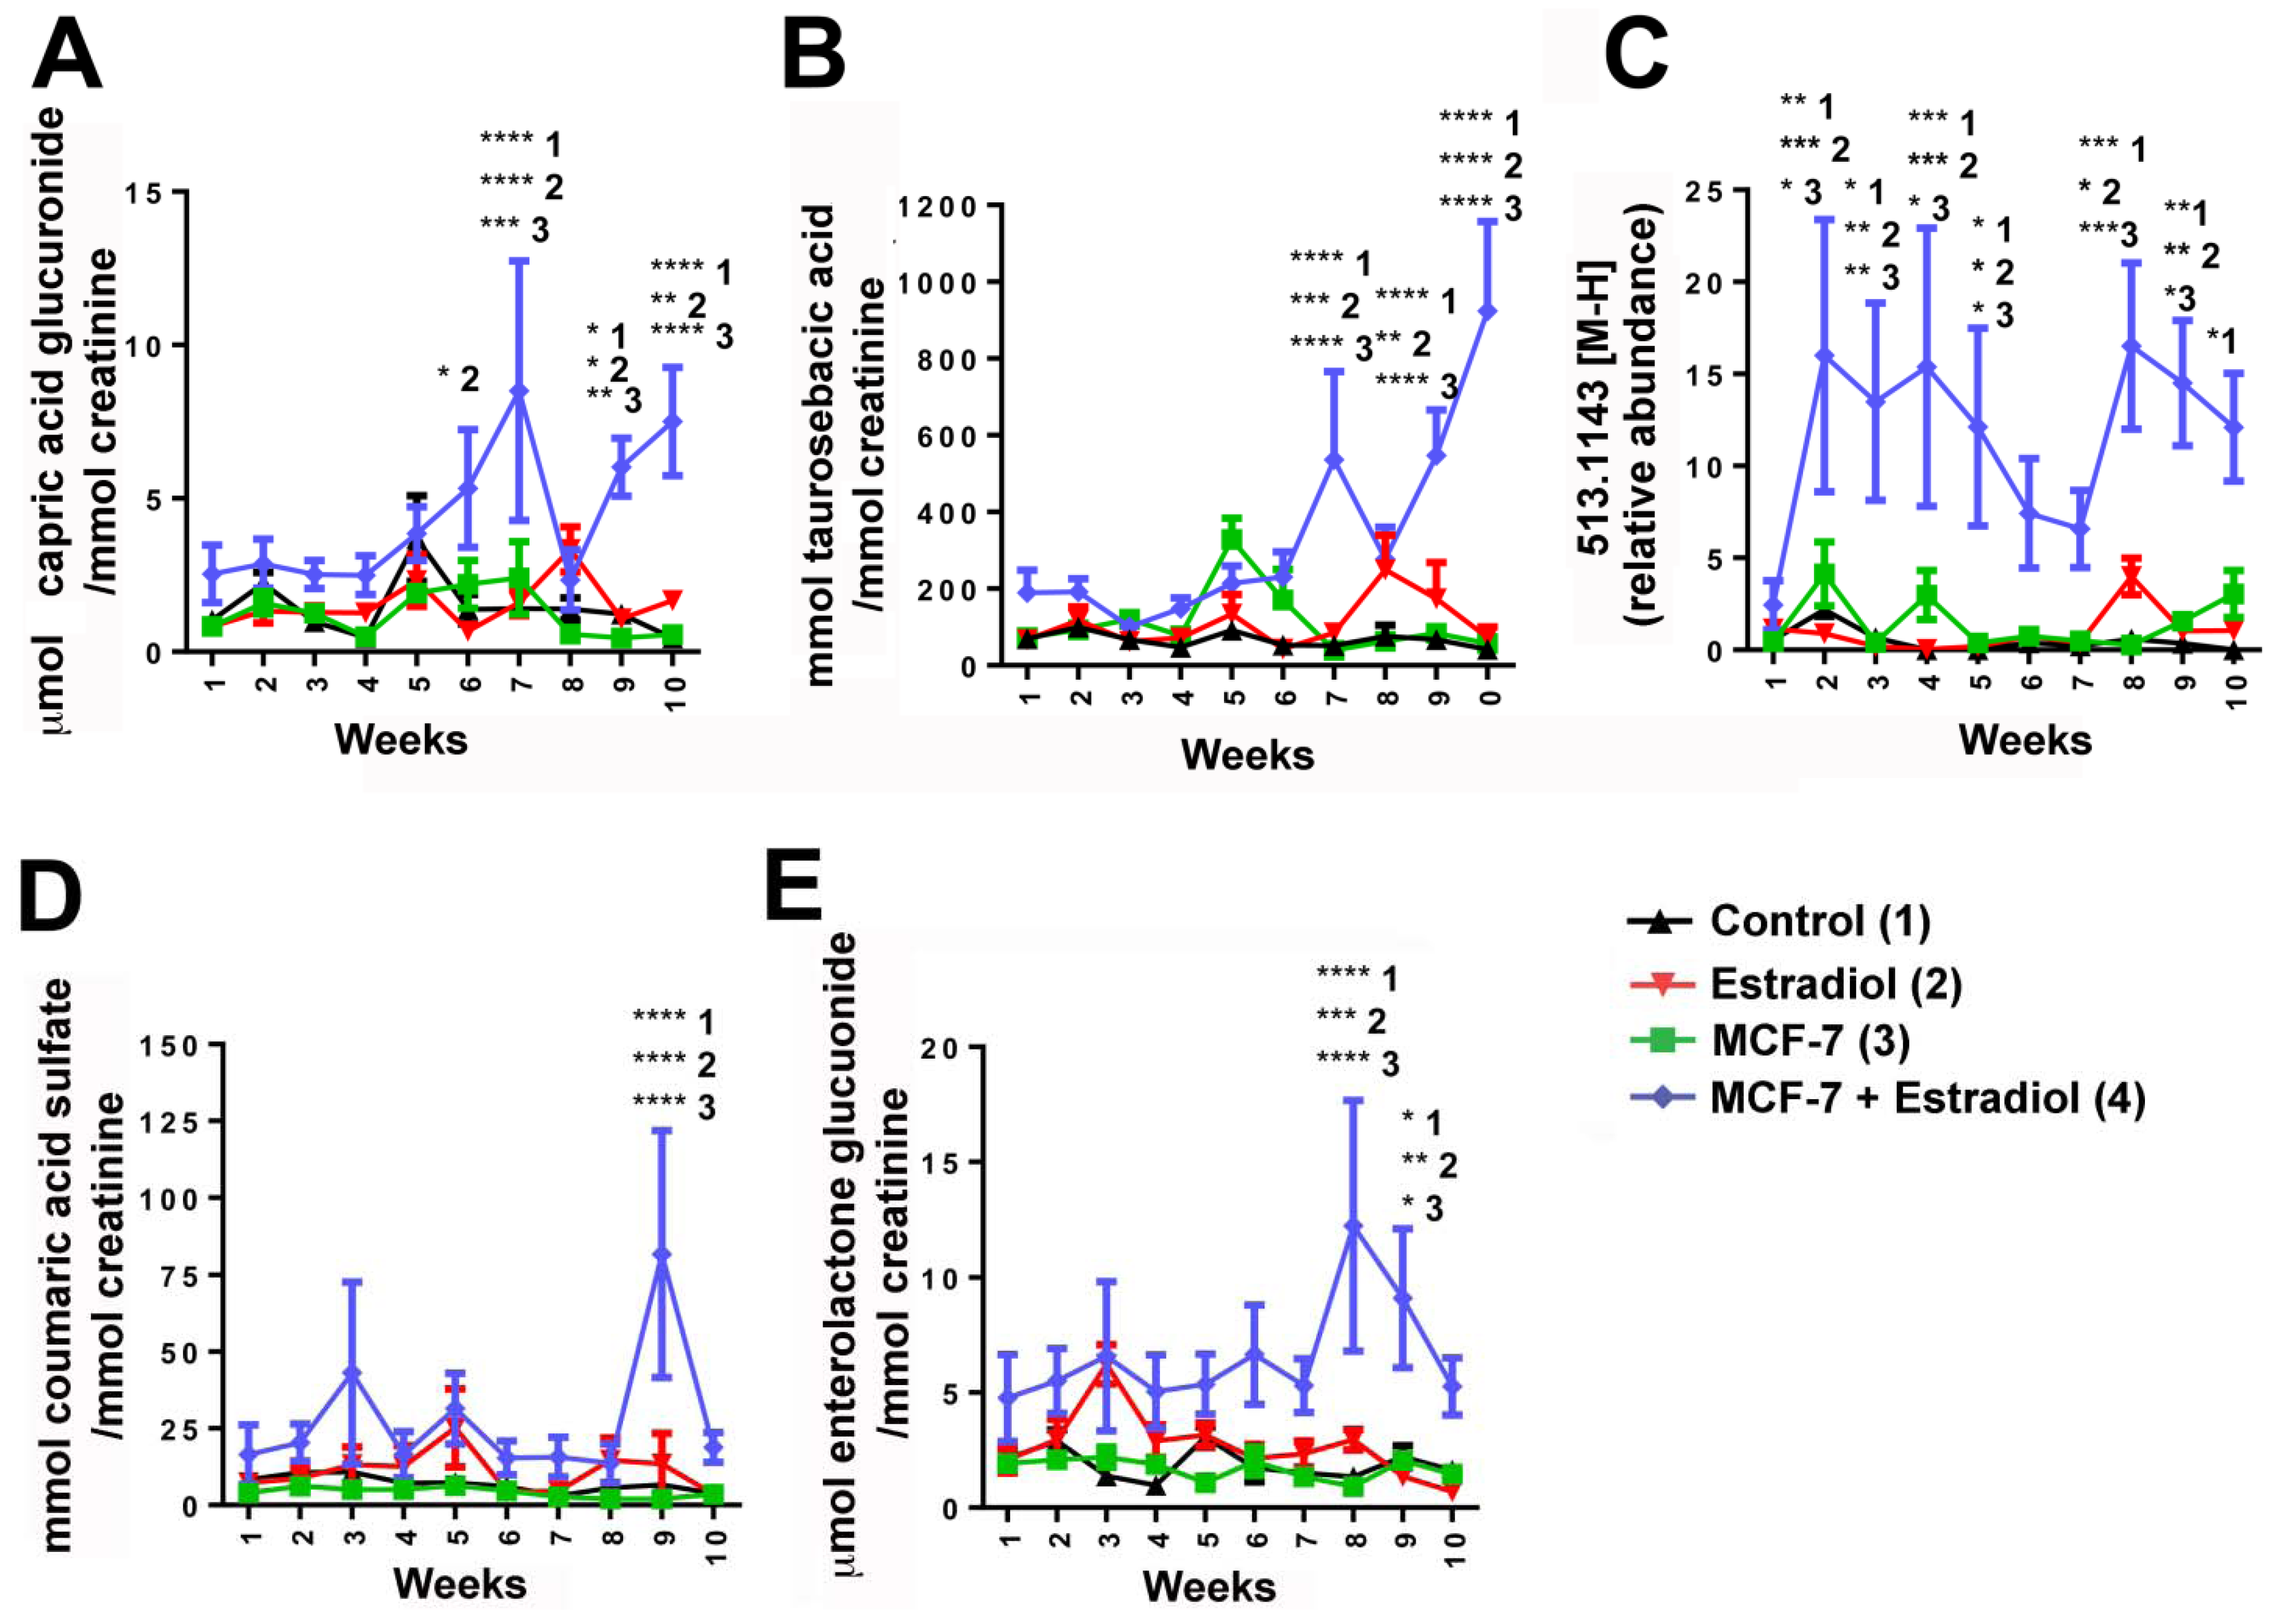
| Rank | Metabolite | Retention Time (min) | Identification | Confirmed / putative | Mass error (ppm) | Fragments |
|---|---|---|---|---|---|---|
| 1 | 347.1709 | 5.71 | Glucuronidated metabolite (potentially capric acid glucuronide) | Putative | 0.8 | 175.0243, 171.1389, 113.0237 |
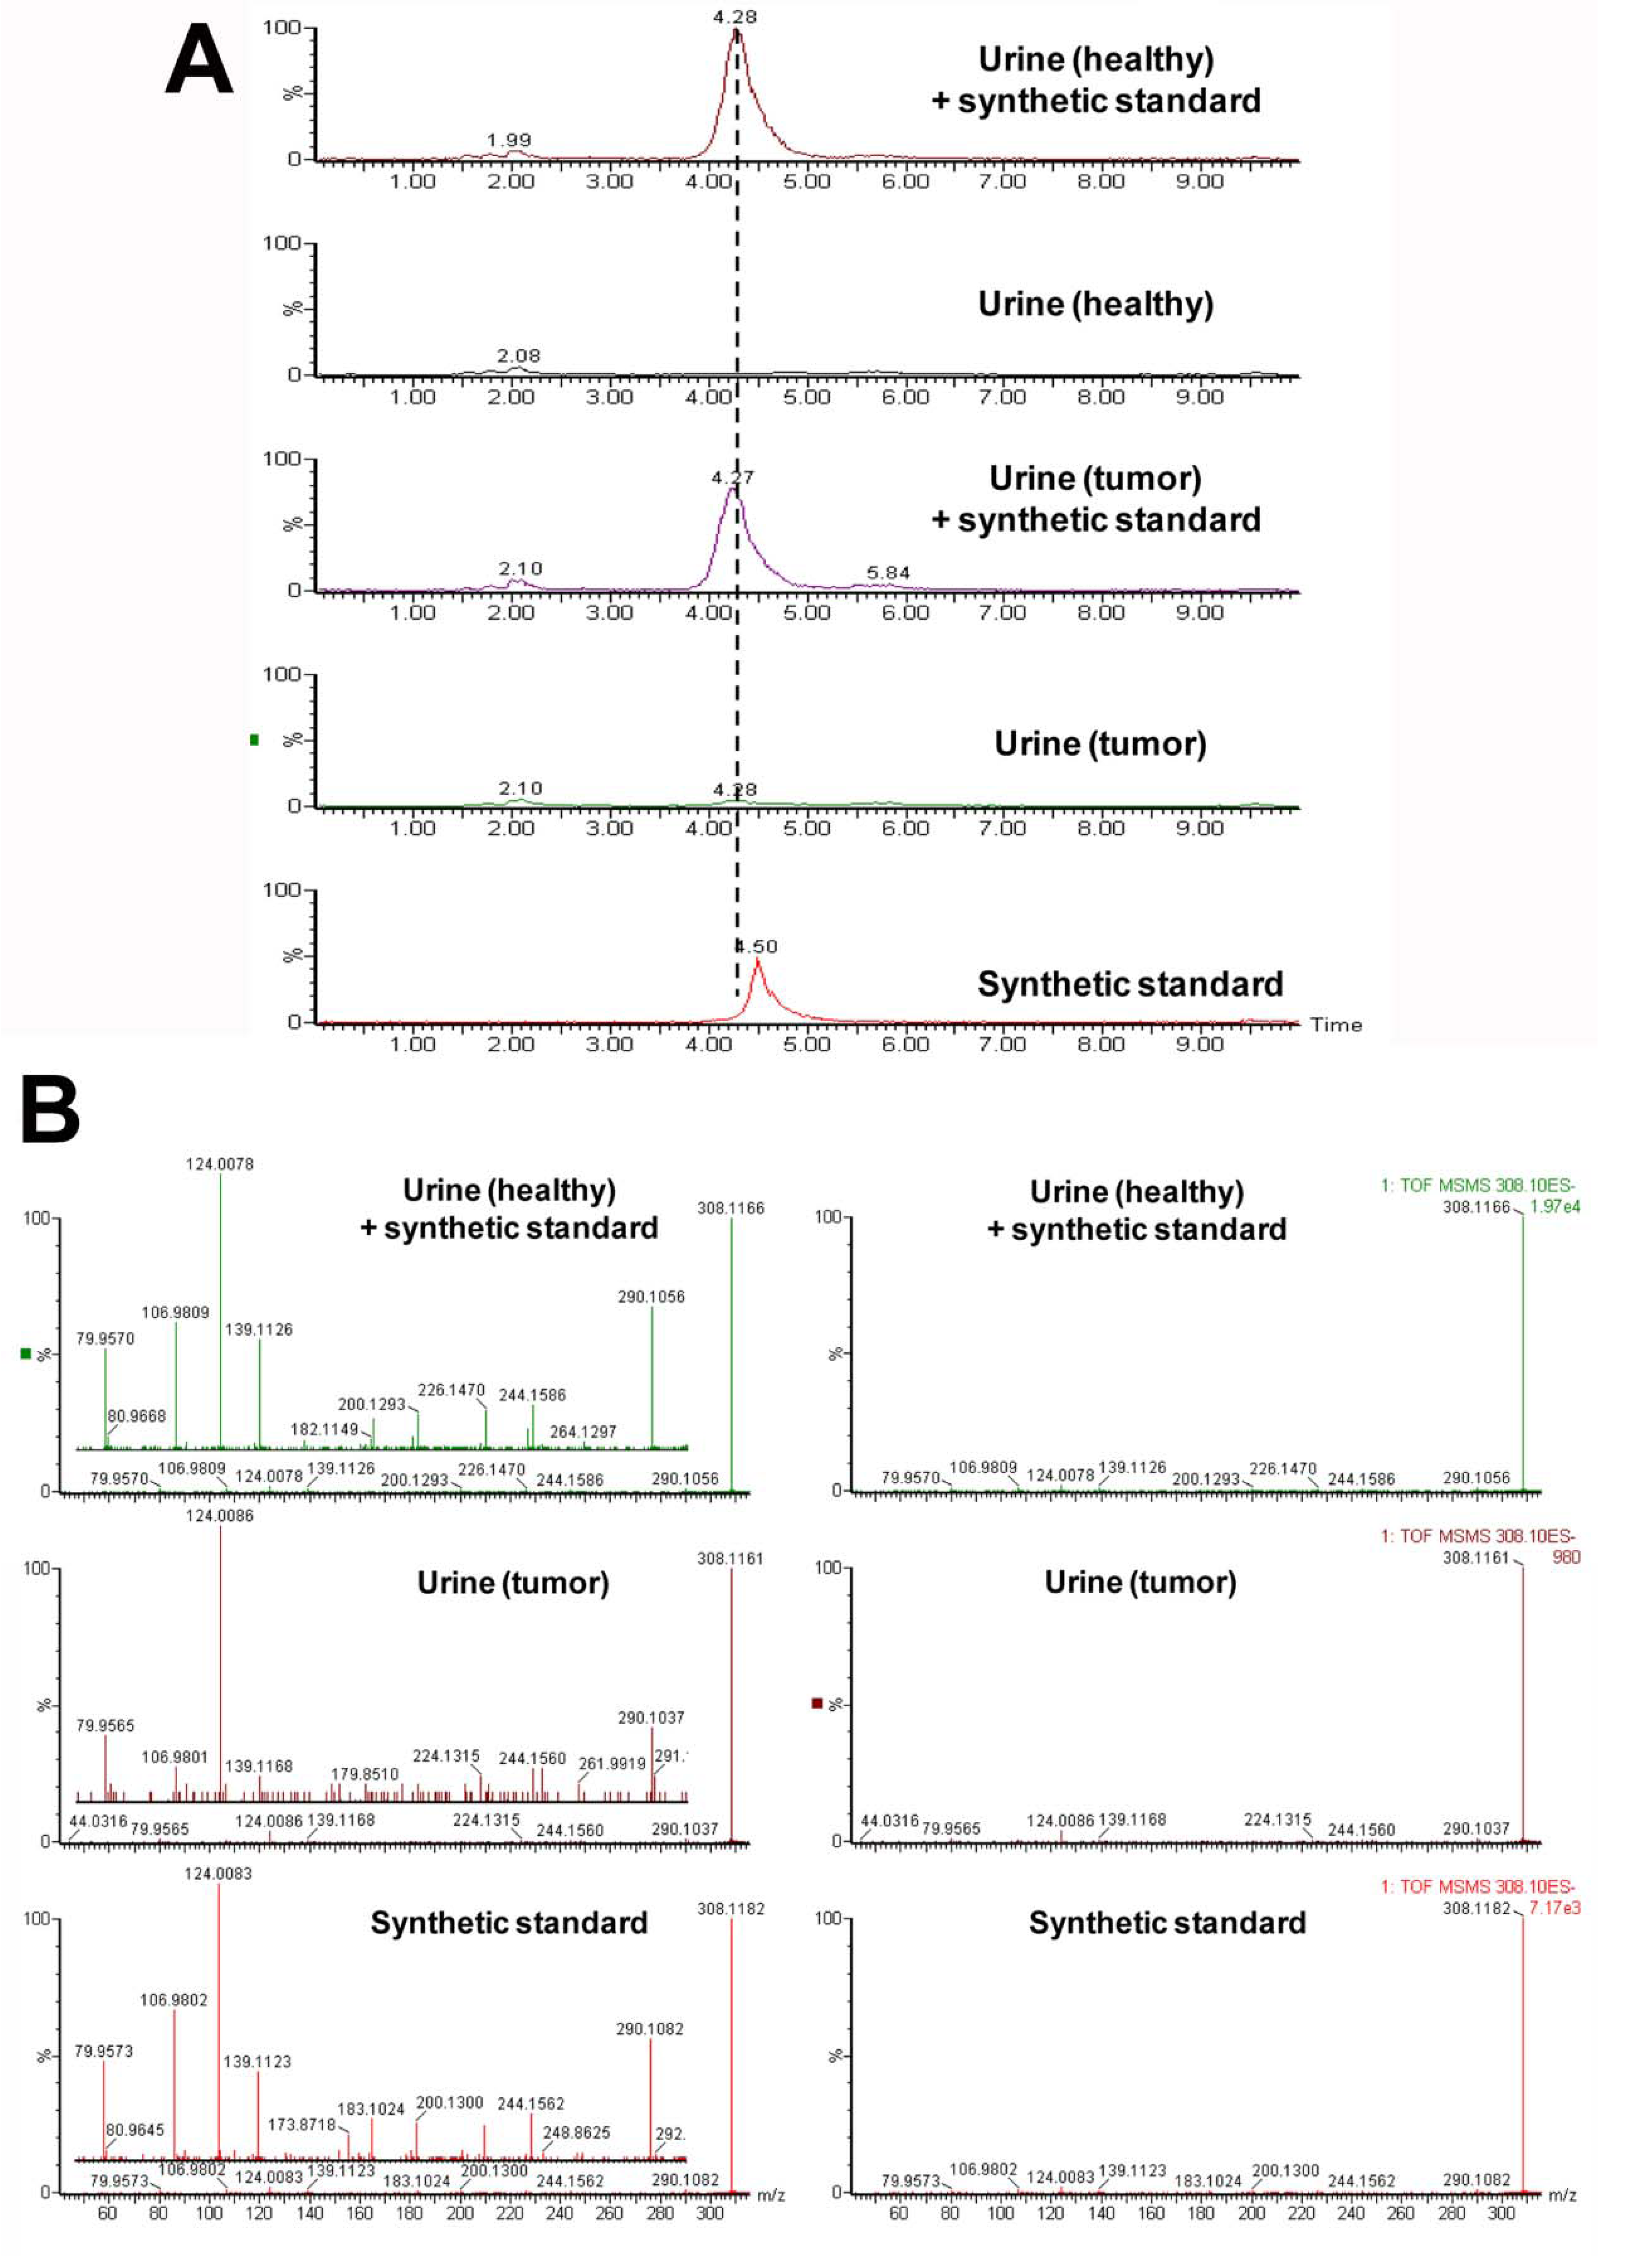
| 2 | 308.1167 | 3.52 | Taurosebacic acid | N/A | N/A | 124.0075, 106.9808, 79.9569 |
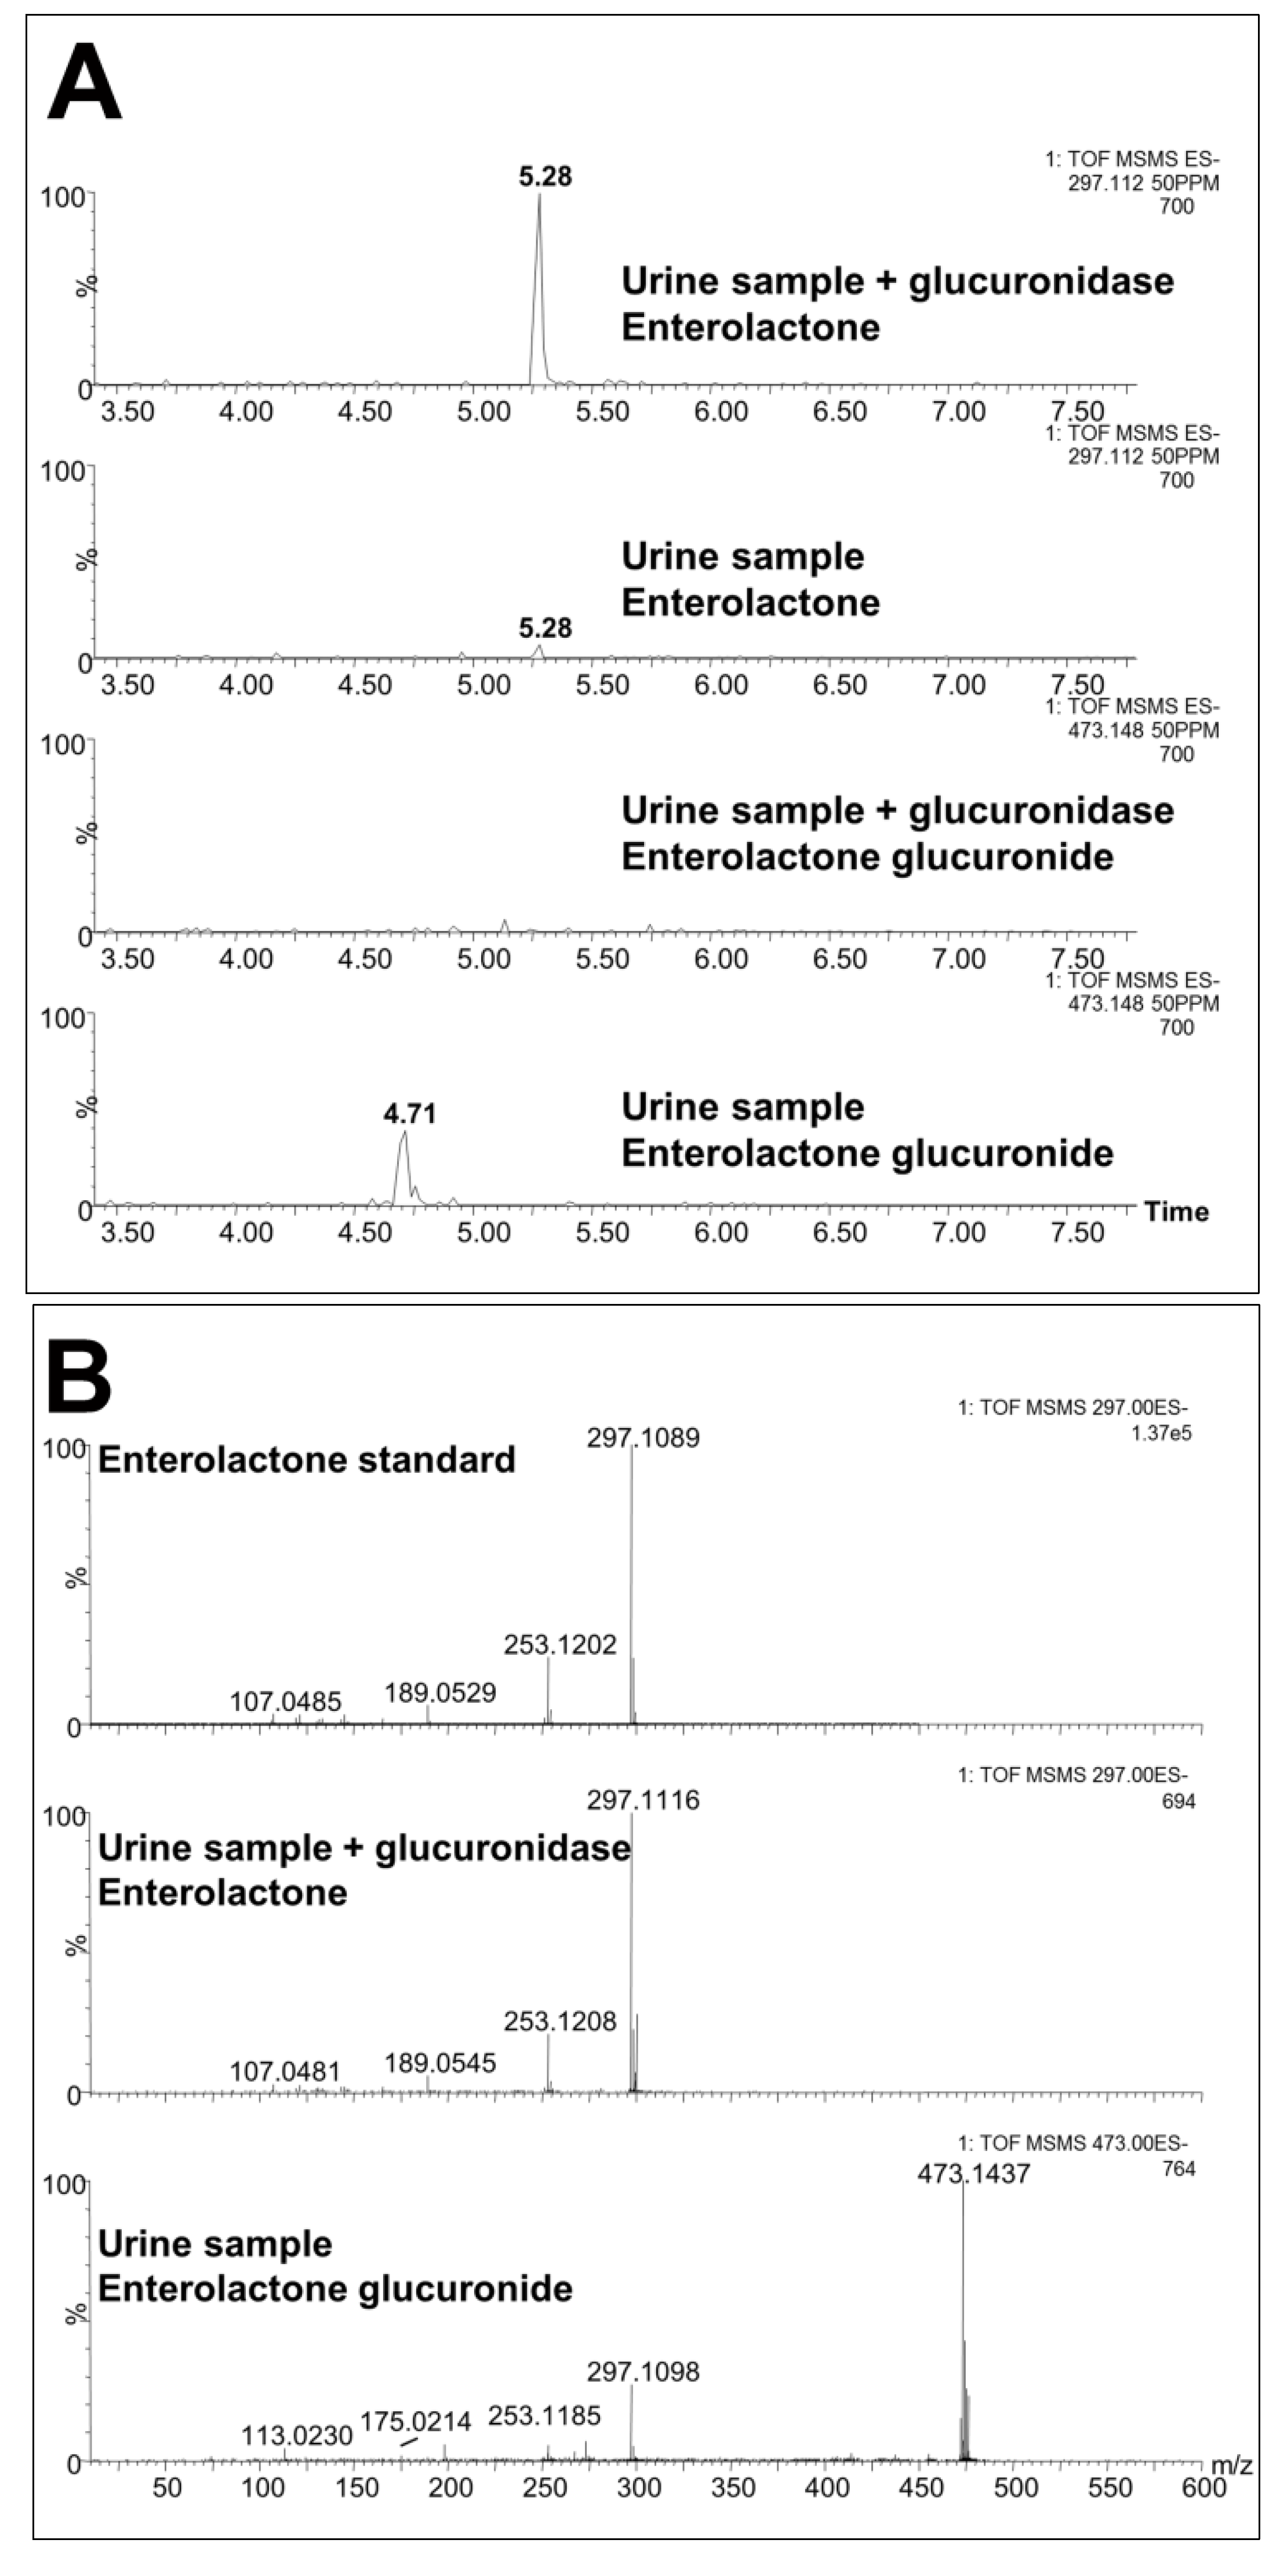
| 3 | 473.1450 | 4.73 | Enterolactone glucuronide | Confirmed against standard and by deconjugation | 0.4 | 297.1118, 253.1202, 189.0542, 175.0235, 165.0532, 113.0241 |
| 4 | 513.1443 | 4.71 | Unknown | N/A | N/A | 351.0900, 271.1331, 237.1263 |
| 5 | 242.9967 | 2.18 | Coumaric acid sulfate | Confirmed against standard and by deconjugation | 1.6 | 163.0385, 119.0496, 79.9582 |


3. Experimental Section
3.1. Compounds
3.2. Synthesis of Mono-Taurosebacic Acid
3.3. MCF-7 Xenograft
3.4. Urine Collection and Preparation for UPLC-ESI-QTOFMS
3.5. UPLC-ESI-QTOFMS Analysis
3.6. Multivariate Data Analysis and Biomarker Identification
3.7. Deconjugation of Sulfated and Glucuronidated Metabolites
3.8. Quantitation
3.9. Statistics
4. Conclusions
Acknowledgments
Conflict of Interest
References
- American Cancer Society: Cancer Facts and Figures 2013. Available online: http://www.cancer.org/research/cancerfactsstatistics/cancerfactsfigures2013/index/ (accessed on 21 June 2013).
- IARC, World Cancer Report 2009; International Agency for Research on Cancer: Lyon, France, 2008.
- Denkert, C.; Bucher, E.; Hilvo, M.; Salek, R.; Oresc, M.; Griffin, J.; Brockmoller, S.; Klauschen, F.; Loibl, S.; Barupal, D.K.; et al. Metabolomics of human breast cancer: New approaches for tumor typing and biomarker discovery. Genome Med. 2012, 4, 37. [Google Scholar]
- Slupsky, C.M.; Steed, H.; Wells, T.H.; Dabbs, K.; Schepansky, A.; Capstick, V.; Faught, W.; Sawyer, M.B. Urine metabolite analysis offers potential early diagnosis of ovarian and breast cancers. Clin. Cancer Res. 2010, 16, 5835–5841. [Google Scholar] [CrossRef]
- Woo, H.M.; Kim, K.M.; Choi, M.H.; Jung, B.H.; Lee, J.; Kong, G.; Nam, S.J.; Kim, S.; Bai, S.W.; Chung, B.C. Mass spectrometry based metabolomic approaches in urinary biomarker study of women's cancers. Clin. Chim. Acta. 2009, 400, 63–69. [Google Scholar] [CrossRef]
- Johnson, C.H.; Patterson, A.D.; Idle, J.R.; Gonzalez, F.J. Xenobiotic metabolomics: Major impact on the metabolome. Annu. Rev. Pharmacol. Toxicol. 2012, 52, 37–56. [Google Scholar] [CrossRef]
- Moroz, J.; Turner, J.; Slupsky, C.; Fallone, G.; Syme, A. Tumour xenograft detection through quantitative analysis of the metabolic profile of urine in mice. Phys. Med. Biol. 2011, 56, 535–556. [Google Scholar] [CrossRef]
- Kim, K.B.; Yang, J.Y.; Kwack, S.J.; Park, K.L.; Kim, H.S.; Ryu do, H.; Kim, Y.J.; Hwang, G.S.; Lee, B.M. Toxicometabolomics of urinary biomarkers for human gastric cancer in a mouse model. J. Toxicol. Env. Heal. A 2010, 73, 1420–1430. [Google Scholar] [CrossRef]
- Fan, T.W.; Lane, A.N.; Higashi, R.M.; Yan, J. Stable isotope resolved metabolomics of lung cancer in a SCID mouse model. Metabolomics 2011, 7, 257–269. [Google Scholar] [CrossRef]
- Liu, X.P.; Suzuki, N.; Laxmi, Y.R.S.; Okamoto, Y.; Shibutani, S. Anti-breast cancer potential of daidzein in rodents. Life Sci. 2012, 91, 415–419. [Google Scholar] [CrossRef]
- Chen, X.S.; Meng, Q.W.; Zhao, Y.B.; Liu, M.Y.; Li, D.D.; Yang, Y.M.; Sun, L.C.; Sui, G.J.; Cai, L.; Dong, X.Q. Angiotensin II type 1 receptor antagonists inhibit cell proliferation and angiogenesis in breast cancer. Cancer Lett. 2013, 328, 318–324. [Google Scholar] [CrossRef]
- Chen, J.M.; Saggar, J.K.; Corey, P.; Thompson, L.U. Flaxseed cotyledon fraction reduces tumour growth and sensitises tamoxifen treatment of human breast cancer xenograft (MCF-7) in athymic mice. Brit. J. Nutr. 2011, 105, 339–347. [Google Scholar] [CrossRef]
- Plowman, J.; Dykes, D.; Hollingshead, M.; Simpson-Herren, L.; Alley, M. Human tumor xenograft models in NCI drug development. In Anticancer Drug Development Guide: Preclinical Screening, Clinical Trials, and Approval; Humana Press Inc: New York, NY, USA, 1997; pp. 101–125. [Google Scholar]
- Tyburski, J.B.; Patterson, A.D.; Krausz, K.W.; Slavik, J.; Fornace, A.J., Jr.; Gonzalez, F.J.; Idle, J.R. Radiation metabolomics. 1. Identification of minimally invasive urine biomarkers for gamma-radiation exposure in mice. Radiat. Res. 2008, 170, 1–14. [Google Scholar] [CrossRef]
- Johnson, C.H.; Patterson, A.D.; Krausz, K.W.; Kalinich, J.F.; Tyburski, J.B.; Kang, D.W.; Luecke, H.; Gonzalez, F.J.; Blakely, W.F.; Idle, J.R. Radiation metabolomics. 5. Identification of urinary biomarkers of ionizing radiation exposure in nonhuman primates by mass spectrometry-based metabolomics. Radiat. Res. 2012, 178, 328–340. [Google Scholar] [CrossRef]
- Smith, C.A.; O’Maille, G.; Want, E.J.; Qin, C.; Trauger, S.A.; Brandon, T.R.; Custodio, D.E.; Abagyan, R.; Siuzdak, G. METLIN: A metabolite mass spectral database. Ther. Drug Monit. 2005, 27, 747–751. [Google Scholar] [CrossRef]
- Jakobs, C.; Sweetman, L.; Wadman, S.K.; Duran, M.; Saudubray, J.M.; Nyhan, W.L. Prenatal-diagnosis of glutaric aciduria type-II by direct chemical-analysis of dicarboxylic-acids in amniotic-fluid. Eur. J. Pediatr. 1984, 141, 153–157. [Google Scholar] [CrossRef]
- Gregersen, N.; Kolvraa, S.; Mortensen, P.B.; Rasmussen, K. C6-C10-dicarboxylic aciduria: Biochemical considerations in relation to diagnosis of beta-oxidation defects. Scand. J. Clin. Lab. Inv. 1982, 42, 15–27. [Google Scholar]
- Sonestedt, E.; Wirfalt, E. Enterolactone and breast cancer: Methodological issues may contribute to conflicting results in observational studies. Nutr. Res. 2010, 30, 667–677. [Google Scholar] [CrossRef]
- Penttinen, P.; Jaehrling, J.; Damdimopoulos, A.E.; Inzunza, J.; Lemmen, J.G.; van der Saag, P.; Pettersson, K.; Gauglitz, G.; Makela, S.; Pongratz, I. Diet-derived polyphenol metabolite enterolactone is a tissue-specific estrogen receptor activator. Endocrinology 2007, 148, 4875–4886. [Google Scholar] [CrossRef]
- Abarzua, S.; Serikawa, T.; Szewczyk, M.; Richter, D.U.; Piechulla, B.; Briese, V. Antiproliferative activity of lignans against the breast carcinoma cell lines MCF 7 and BT 20. Arch. Gynecol. Obstet. 2012, 285, 1145–1151. [Google Scholar] [CrossRef]
- Saarinen, N.M.; Power, K.; Chen, J.; Thompson, L.U. Flaxseed attenuates the tumor growth stimulating effect of soy protein in ovariectomized athymic mice with MCF-7 human breast cancer xenografts. Int. J. Cancer 2006, 119, 925–931. [Google Scholar] [CrossRef]
- Truan, J.S.; Chen, J.M.; Thompson, L.U. Comparative effects of sesame seed lignan and flaxseed lignan in reducing the growth of human breast tumors (MCF-7) at high levels of circulating estrogen in athymic mice. Nutr. Cancer 2012, 64, 65–71. [Google Scholar] [CrossRef]
- Truan, J.S.; Chen, J.M.; Thompson, L.U. Flaxseed oil reduces the growth of human breast tumors (MCF-7) at high levels of circulating estrogen. Mol. Nutr. Food Res. 2010, 54, 1414–1421. [Google Scholar] [CrossRef]
- Dabrosin, C.; Chen, J.; Wang, L.; Thompson, L.U. Flaxseed inhibits metastasis and decreases extracellular vascular endothelial growth factor in human breast cancer xenografts. Cancer Lett. 2002, 185, 31–37. [Google Scholar] [CrossRef]
- Mabrok, H.B.; Klopfleisch, R.; Ghanem, K.Z.; Clavel, T.; Blaut, M.; Loh, G. Lignan transformation by gut bacteria lowers tumor burden in a gnotobiotic rat model of breast cancer. Carcinogenesis 2012, 33, 203–208. [Google Scholar] [CrossRef]
- Fresco, P.; Borges, F.; Diniz, C.; Marques, M.P. New insights on the anticancer properties of dietary polyphenols. Med. Res. Rev. 2006, 26, 747–766. [Google Scholar] [CrossRef]
- Serafim, T.L.; Carvalho, F.S.; Marques, M.P.; Calheiros, R.; Silva, T.; Garrido, J.; Milhazes, N.; Borges, F.; Roleira, F.; Silva, E.T.; et al. Lipophilic caffeic and ferulic acid derivatives presenting cytotoxicity against human breast cancer cells. Chem. Res. Toxicol. 2011, 24, 763–774. [Google Scholar] [CrossRef]
- Kampa, M.; Alexaki, V.I.; Notas, G.; Nifli, A.P.; Nistikaki, A.; Hatzoglou, A.; Bakogeorgou, E.; Kouimtzoglou, E.; Blekas, G.; Boskou, D.; et al. Antiproliferative and apoptotic effects of selective phenolic acids on T47D human breast cancer cells: Potential mechanisms of action. Breast Cancer Res. 2004, 6, R63–R74. [Google Scholar] [CrossRef]
- Brozic, P.; Kocbek, P.; Sova, M.; Kristl, J.; Martens, S.; Adamski, J.; Gobec, S.; Lanisnik Rizner, T. Flavonoids and cinnamic acid derivatives as inhibitors of 17beta-hydroxysteroid dehydrogenase type 1. Mol. Cell. Endocrinol. 2009, 301, 229–234. [Google Scholar] [CrossRef]
© 2013 by the authors; licensee MDPI, Basel, Switzerland. This article is an open access article distributed under the terms and conditions of the Creative Commons Attribution license (http://creativecommons.org/licenses/by/3.0/).
Share and Cite
Johnson, C.H.; Manna, S.K.; Krausz, K.W.; Bonzo, J.A.; Divelbiss, R.D.; Hollingshead, M.G.; Gonzalez, F.J. Global Metabolomics Reveals Urinary Biomarkers of Breast Cancer in a MCF-7 Xenograft Mouse Model. Metabolites 2013, 3, 658-672. https://doi.org/10.3390/metabo3030658
Johnson CH, Manna SK, Krausz KW, Bonzo JA, Divelbiss RD, Hollingshead MG, Gonzalez FJ. Global Metabolomics Reveals Urinary Biomarkers of Breast Cancer in a MCF-7 Xenograft Mouse Model. Metabolites. 2013; 3(3):658-672. https://doi.org/10.3390/metabo3030658
Chicago/Turabian StyleJohnson, Caroline H., Soumen K. Manna, Kristopher W. Krausz, Jessica A. Bonzo, Raymond D. Divelbiss, Melinda G. Hollingshead, and Frank J. Gonzalez. 2013. "Global Metabolomics Reveals Urinary Biomarkers of Breast Cancer in a MCF-7 Xenograft Mouse Model" Metabolites 3, no. 3: 658-672. https://doi.org/10.3390/metabo3030658