Global LC/MS Metabolomics Profiling of Calcium Stressed and Immunosuppressant Drug Treated Saccharomyces cerevisiae

Abstract
:
1. Introduction
2. Materials and Methods
2.1. Yeast Culture
2.2. Metabolite Extraction
2.3. Trace Protein and Cell Debris Removal
2.4. Chromatography
2.5. MS and MS/MS
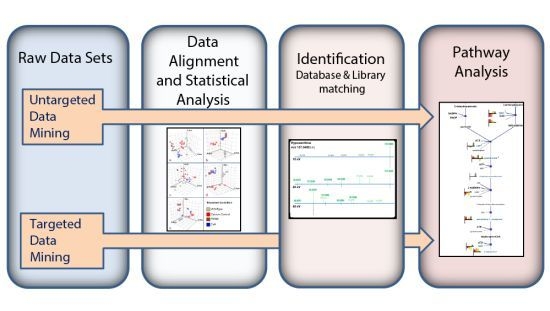
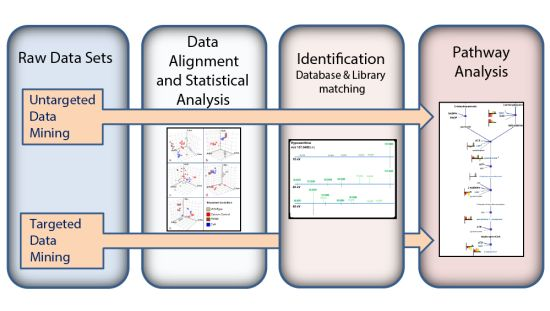
2.6. Data Analysis
2.6.1. Personal Compound Database (PCD) and Library (PCDL)
2.6.2. Feature Extraction
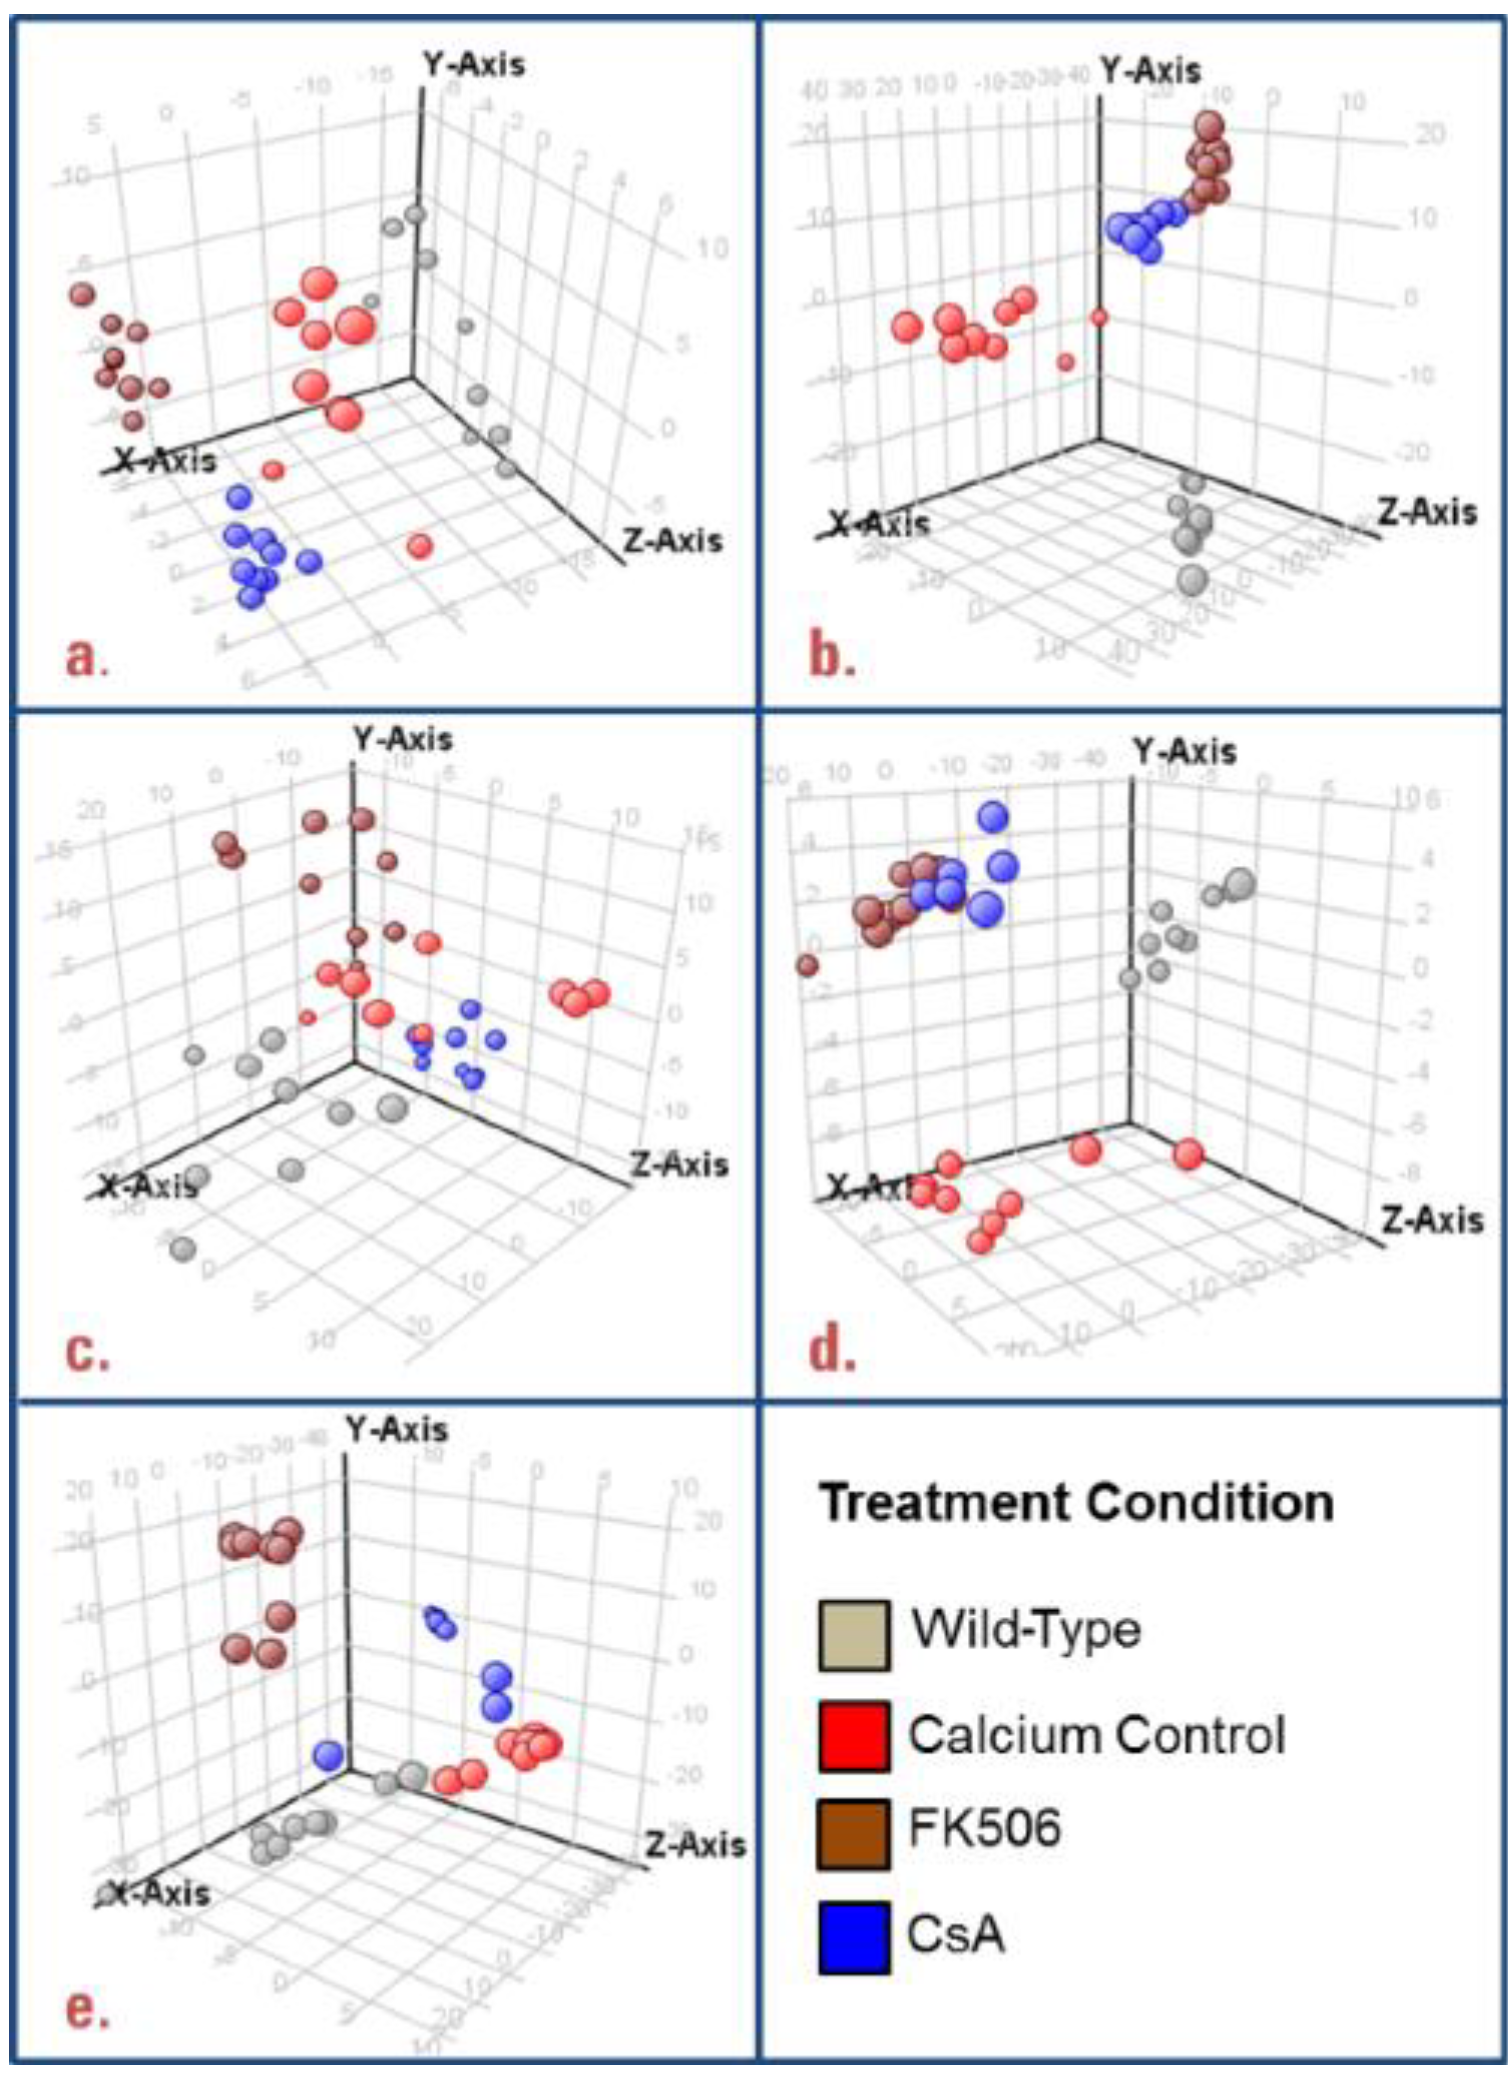
2.6.3. Baselining, Alignment, Filtering and Statistical Analysis
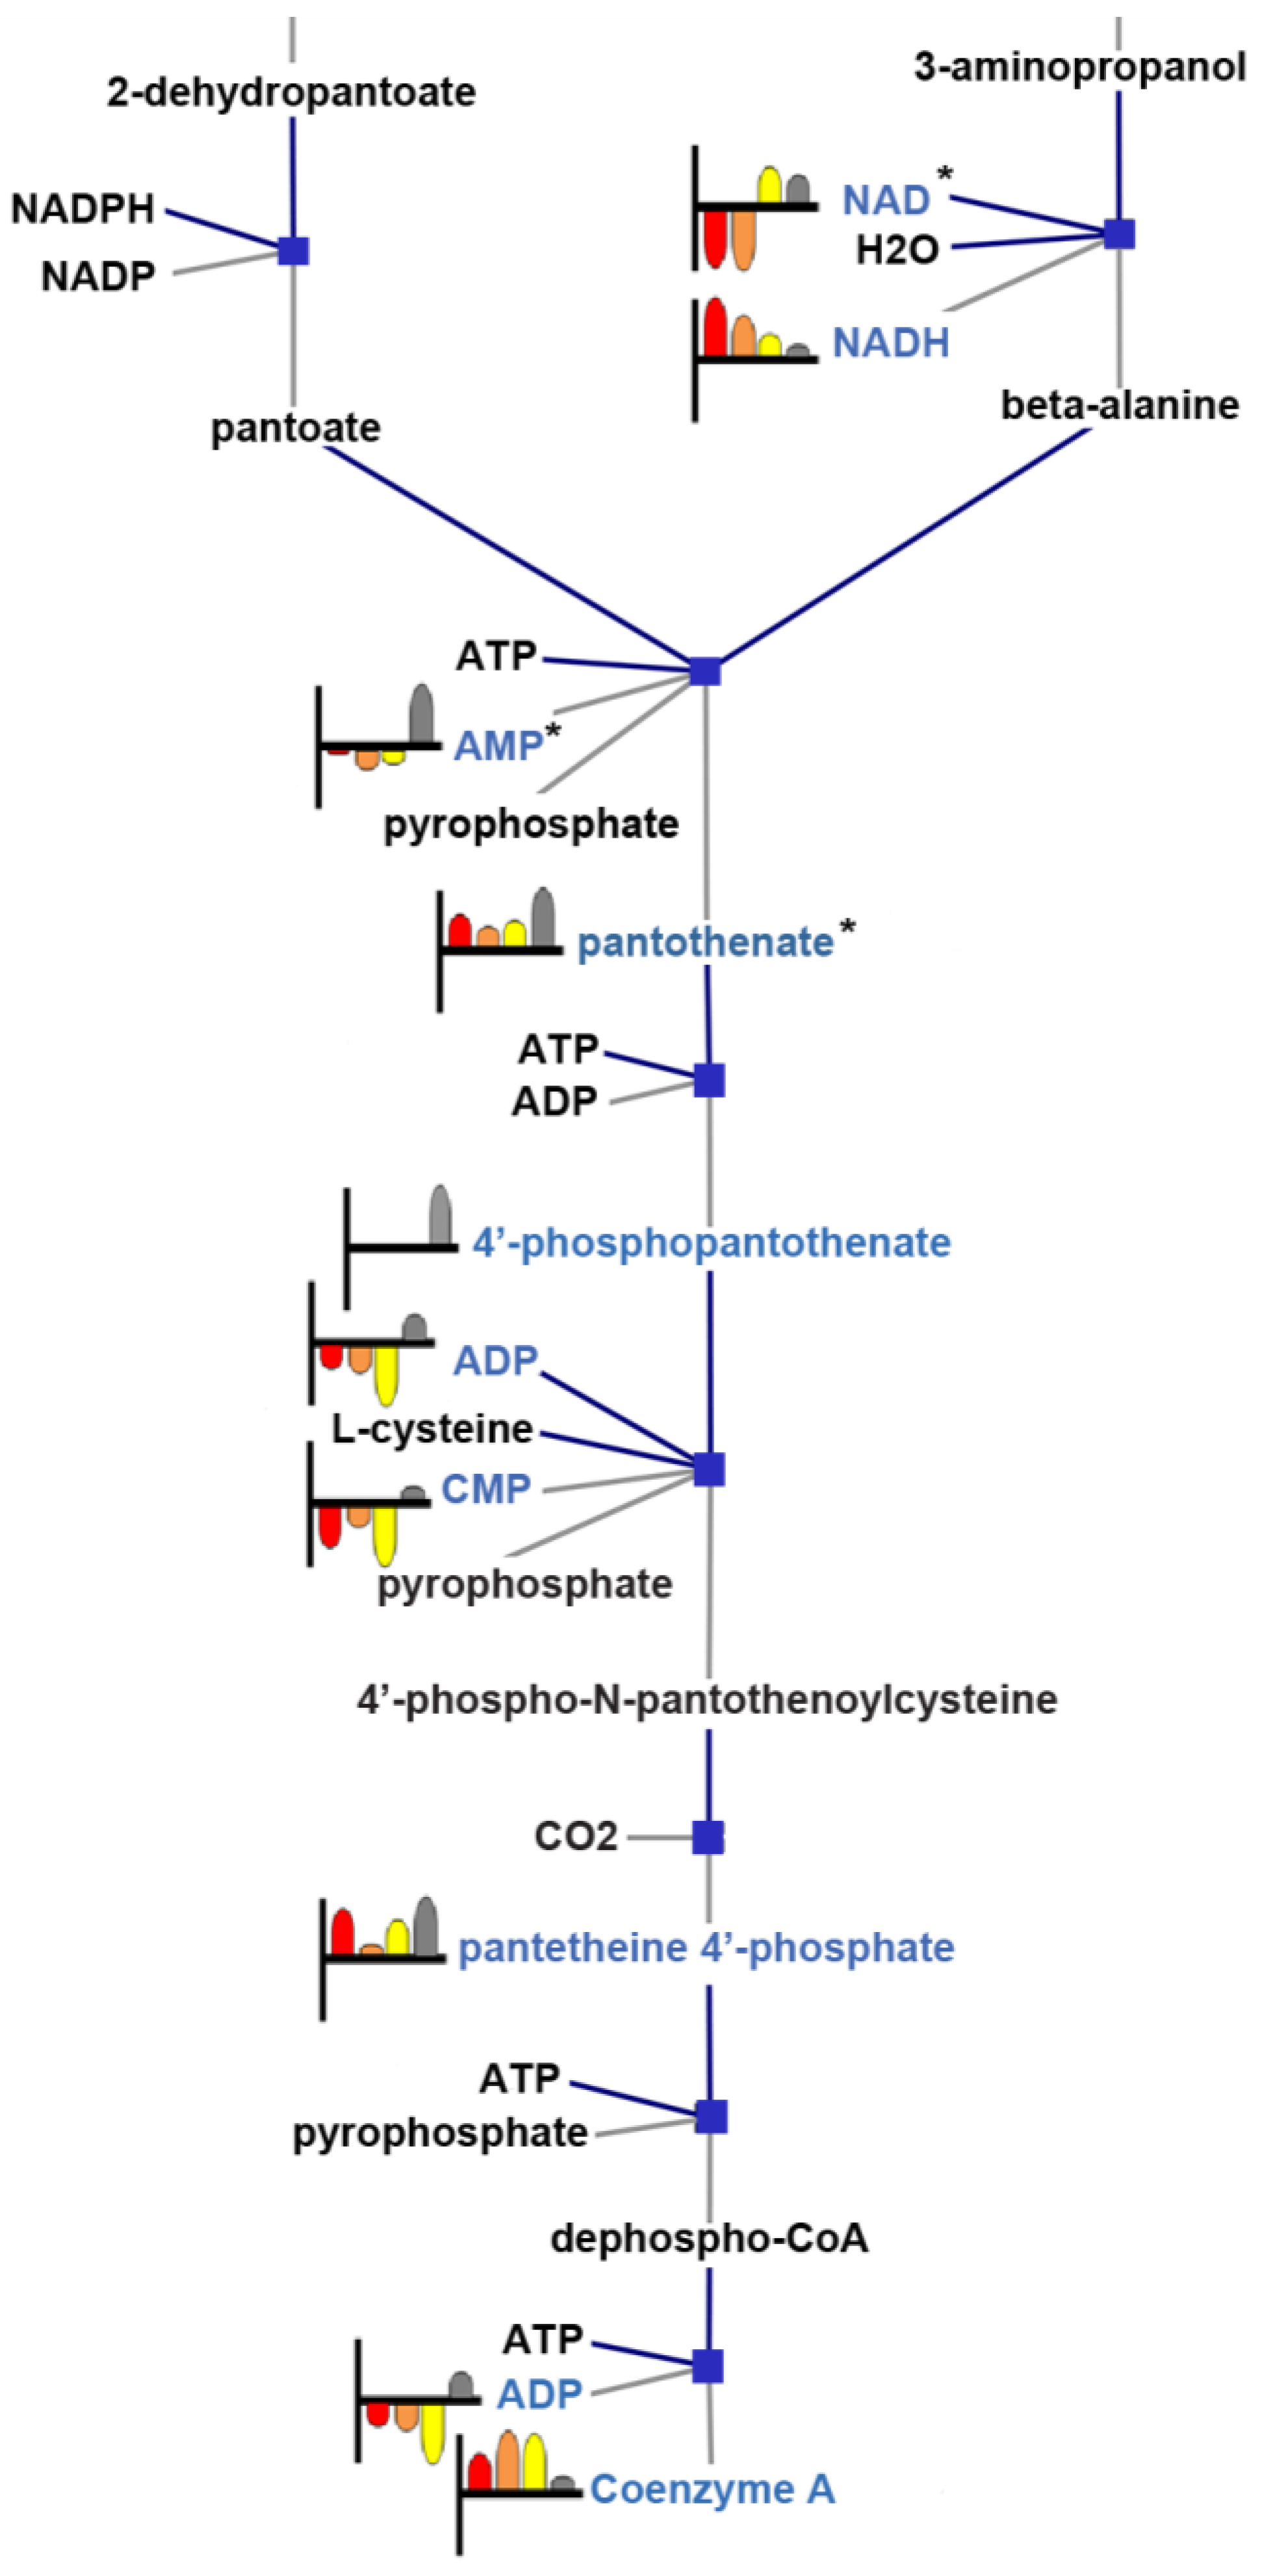
2.6.4. Pathway Analysis
3. Results and Discussion
3.1. Untargeted Data Mining
3.2. Targeted Data Mining

3.3. MS/MS Spectral Library Identification

3.4. Pathway Analysis


| Compound | p (Corr) | CA/WT | CY/WT | FK/WT | Molecular Formula | KEGG ID |
|---|---|---|---|---|---|---|
| L-cystathionine | 2.11 × 10⁻¹¹ | −1.62 | −1.35 | −1.63 | C7H14N2O4S | C02291 |
| L-methionine | 9.15 × 10⁻¹⁷ | 1.27 | 1.05 | −1.13 | C5H11NO2S | C00073 |
| L-serine | 2.47 × 10⁻¹⁹ | −0.43 | −0.30 | −3.04 | C3H7NO3 | C00065 |
| ADP | 4.53 × 10⁻¹⁴ | −0.87 | −1.07 | −2.32 | C10H15N5O10P2 | C00008 |
| O-acetyl-L-homoserine | 1.08 × 10⁻⁴ | 0.17 | ND | 0.09 | C6H11NO4 | C01077 |
| L-aspartate-semialdehyde | 1.40 × 10⁻⁴ | −8.22 | −10.54 | −14.42 | C4H7NO3 | C00441 |
| L-aspartate | 7.23 × 10⁻⁹ | −3.95 | −0.23 | 1.83 | C4H7NO4 | C00049 |
| L-glutamate | 3.49 × 10⁻⁶ | −2.69 | 1.98 | 1.93 | C5H9NO4 | C00025 |
| CoA | 1.01 × 10⁻² | 2.42 | 3.85 | 3.75 | C21H36N7O16P3S | C00010 |
| acetyl-CoA | 0 | −10.76 | −10.76 | −8.84 | C23H38N7O17P3S | C00024 |
4. Conclusions
Acknowledgments
Conflicts of Interest
References
- Stathopoulos, A.M.; Cyert, M.S. Calcineurin acts through the CRZ1/TCN1-encoded transcription factor to regulate gene expression in yeast. Genes Dev. 1997, 11, 3432–3444. [Google Scholar] [CrossRef]
- Cyert, M.S. Calcineurin signaling in Saccharomyces cerevisiae: How yeast go crazy in response to stress. Biochem. Biophys. Res. Commun. 2003, 311, 1143–1150. [Google Scholar] [CrossRef]
- Yoshimoto, H.; Saltsman, K.; Gasch, A.P.; Li, H.X.; Ogawa, N.; Botstein, D.; Brown, P.O.; Cyert, M.S. Genome-wide analysis of gene expression regulated by the calcineurin/Crz1p signaling pathway in Saccharomyces cerevisiae. J. Biol. Chem. 2002, 277, 31079–31088. [Google Scholar] [CrossRef]
- Heath, V.L.; Shaw, S.L.; Roy, S.; Cyert, M.S. Hph1p and Hph2p, novel components of calcineurin mediated stress responses in Saccharomyces cerevisiae. Eukaryot. Cell 2004, 3, 695–704. [Google Scholar] [CrossRef]
- Dumont, F.J.; Staruch, M.J.; Koprak, S.L.; Siekierka, J.J.; Lin, C.S.; Harrison, R.; Sewe, T.; Kindt, V.M.; Beattie, T.R.; Wyvratt, M.; et al. The immunosuppressive and toxic effects of FK-506 are mechanistically related: Pharmacology of a novel antogonist of FK-506 and rapamycin. J. Exp. Med. 1992, 176, 751–760. [Google Scholar] [CrossRef]
- Aramburu, J.; Rao, A.; Klee, C.B. Calcineurin: From structure to function. Curr. Top. Cell. Regul. 2000, 36, 237–295. [Google Scholar] [CrossRef]
- Kadafar, K.; Cyert, M. Integration of stress responses: Modulation of calcineurin signaling in Saccharomyces cerevisiae by protein kinase A. Eukaryot. Cell 2004, 3, 1147–1153. [Google Scholar] [CrossRef]
- Arron, J.R.; Winslow, M.M.; Polleri, A.; Chang, C.P.; Wu, H.; Gao, X.; Neilson, J.R.; Chen, L.; Heit, J.J.; Kim, S.K.; et al. NFAT dysregulation by increased dosage of DSCR1 and DYRK1A on chromosome 21. Nature 2006, 441, 595–600. [Google Scholar] [CrossRef]
- Mukherjee, A; Soto, C. Role of calcineurin in neurodegeneration produced by misfolded proteins and endoplasmic reticulum stress. Curr. Opin. Cell Biol. 2011, 23, 223–230. [Google Scholar] [CrossRef]
- Reese, L.C.; Taglialatela, G. A role for calcineurin in Alzheimer’s disease. Curr. Neuropharmacol. 2011, 9, 685–692. [Google Scholar] [CrossRef]
- Zhao, Y.; Du, J.; Zhao, G.; Jiang, L. Activation of calcineurin is mainly responsible for the calcium sensitivity of gene deletion mutations in the genome of budding yeast. Genomics 2013, 101, 49–56. [Google Scholar] [CrossRef]
- Veenstra, T.D. Metabolomics: The final frontier? Genome Med. 2012, 4. [Google Scholar] [CrossRef]
- Canelas, A.B.; ten Pierick, A.; Ras, C.; Seifar, R.M.; van Dam, J.C.; van Gulik, W.M.; Heijnen, J.J. Quantitative evaluation of intracellular metabolite extraction techniques for yeast metabolomics. Anal. Chem. 2009, 81, 7379–7389. [Google Scholar] [CrossRef]
- Ejsing, C.S.; Sampaio, J.L.; Surendranath, V.; Duchoslav, E.; Ekroos, K.; Klemm, R.W.; Simons, K.; Shevchenko, A. Global analysis of the yeast lipidome by quantitative shotgun mass spectrometry. Proc. Natl. Acad. Sci. USA 2009, 106, 2136–2141. [Google Scholar] [CrossRef]
- Lee, D.Y.; Fiehn, O. Hihh quality metabolomic data for Chlamydomonas reinhardtii. Plant Methods 2008. [Google Scholar] [CrossRef]
- Loret, M.O.; Pedersen, L.; Francois, J. Revised procedures for yeast metabolites extraction: Application to a glucose pulse to carbon-limited yeast cultures, which reveals a transient activation of the purine salvage pathway. Yeast 2007, 24, 47–60. [Google Scholar] [CrossRef]
- Maharjan, R.M.; Ferenci, T. Global metabolite analysis: The influence of extraction methodology on metabolome profiles of Escherichia coli. Anal. Biochem. 2003, 313, 145–154. [Google Scholar] [CrossRef]
- Martins, A.M.; Sha, W.; Evans, C.; Martino-Catt, S.; Mendes, P.; Shulaev, V. Comparison of sampling techniques for parallel analysis of transcript and metabolite levels in Saccharomyces cerevisiae. Yeast 2007, 24, 181–188. [Google Scholar] [CrossRef]
- Sana, T.R.; Waddell, K.; Fischer, S. A sample extraction and chromatographic strategy for increasing LC/MS detection coverage of the erythrocyte metabolome. J. Chromatogr. B 2008, 871, 314–321. [Google Scholar] [CrossRef]
- Villas-Boas, S.G.; Hojer-Pedersen, J.; Akesson, M.; Smedsgaard, J.; Nielsen, J. Global metabolite analysis of yeast: Evaluation of sample preparation methods. Yeast 2005, 22, 1155–1169. [Google Scholar] [CrossRef]
- Cubbon, S.; Ankonio, C.; Wilson, J.; Thomas-Oates, J. Metabolomic applications of HILIC-LC-MS. Mass Spectrom. Rev. 2010, 29, 671–684. [Google Scholar] [CrossRef]
- Sana, T.R.; Fischer, S.M.; Jenkins, S.; Matyska, M.T.; Pesek, J.J. Two pH Optimized LC-MS Methods for Metabolomics Analysis of Hydrophilic Compounds on a Silica Hydride Stationary Phase. Available online: http://www.chem.agilent.com/Library/posters/Public/WP16_362.pdf (accessed on 15 October 2013).
- Smith, C.A.; O’Maille, G.; Want, E.J.; Qin, C.; Trauger, S.A.; Brandon, T.R.; Custodio, D.E.; Abagyan, R.; Siuzdak, G. METLIN: A metabolite mass spectral database. Ther. Drug Monit. 2005, 27, 747–751. [Google Scholar] [CrossRef]
- Koning, W.; Dam, K. A method for the determination of changes of glycolytic metabolites in yeast on a subsecond time scale using extraction at neutral pH. Anal. Biochem. 1992, 204, 118–123. [Google Scholar] [CrossRef]
- Karp, P.D.; Ouzonis, C.A.; Moore-Kochlac, C. Expansion of the BioCyc collection of pathway/genome databases to 160 genomes. Nucleic Acids Res. 2005, 33, 6083–6089. [Google Scholar] [CrossRef]
- Li, H.; Ma, M.L.; Luo, S.; Zhang, R.M.; Han, P.; Hu, W. Metabolic responses to ethanol in Saccharomyces cerevisiae using a gas chromatography tandem mass spectrometry-based metabolomics approach. Int. J. Biochem. Cell Biol. 2012, 44, 1087–1096. [Google Scholar] [CrossRef]
- Araki, Y.; Wu, H.; Kitagaki, H.; Akao, T.; Takagi, H.; Shimoi, H. Ethanol stress stimulates the Ca2+-mediated calcineurin/Crz1 pathway in Saccharomyces cerevisiae. J. Biosci. Bioeng. 2009, 107, 1–6. [Google Scholar] [CrossRef]
- Kang, W.Y.; Kim, S.H.; Chae, Y.K. Stress adaptation of Saccharomyces cerevisiae as monitored via metabolites using two-dimensional NMR spectroscopy. FEMS Yeast Res. 2012, 12, 608–616. [Google Scholar] [CrossRef]
- Erasmus, D.J.; van der Merwe, G.K.; van Vuuren, H.J. Genome-wide expression analyses: Metabolic adaptation of Saccharomyces cerevisiae to high sugar stress. FEMS Yeast Res. 2003, 3, 375–399. [Google Scholar] [CrossRef]
- Walther, T.; Novo, M.; Rössger, K.; Létisse, F.; Loret, M.O.; Portais, J.C.; François, J.M. Control of ATP homeostasis during the respiro-fermentative transition in yeast. Mol. Syst. Biol. 2010, 6. [Google Scholar] [CrossRef]
- Serrano, R.; Ruiz, A.; Bernal, D.; Chambers, J.R.; Arino, J. The transcriptional response to alkaline pH in Saccharomces cerevisiae: Evidence for calcium-mediated signaling. Mol. Microbiol. 2002, 46, 1319–1333. [Google Scholar] [CrossRef]
- Lin, F.M.; Tan, Y.; Yuan, Y.J. Temporal quantitative proteomics of Saccharomyces cerevisiae in response to a nonlethal concentration of furfural. Proteomics 2009, 9, 5471–5483. [Google Scholar] [CrossRef]
- Ruiz, A.; Yenush, L.; Ariño, J. Regulation of ENA1 Na+-ATPase gene expression by the Ppz1 protein phosphatase is mediated by the calcineurin pathway. Eukaryot. Cell 2003, 2, 937–948. [Google Scholar] [CrossRef]
- Hemenway, C.S.; Heitman, J. Lic4, a nuclear phosphoprotein that cooperates with calcineurin to regulate cation homeostasis in Saccharomyces cerevisiae. Mol. Gen. Genet. 1999, 261, 388–401. [Google Scholar] [CrossRef]
- Hamasaki-Katagiri, N.; Ames, J.B. Neuronal calcium sensor-1 (Ncs1p) is up-regulated by calcineurin to promote Ca2+ tolerance in fission yeast. J. Biol. Chem. 2010, 285, 4405–4414. [Google Scholar]
- Blank, L.M.; Kuepfer, L.; Sauer, U. Large-scale 13C-flux analysis reveals mechanistic principles of metabolic network robustness to null mutations in yeast. Genome Biol. 2005, 6, R49. [Google Scholar] [CrossRef] [Green Version]
- Ariño, J. Integrative responses to high pH stress in S. cerevisiae. OMICS: J. Integr. Biol. 2010, 14, 517–523. [Google Scholar]
Supplementary Materials
© 2013 by the authors; licensee MDPI, Basel, Switzerland. This article is an open access article distributed under the terms and conditions of the Creative Commons Attribution license (http://creativecommons.org/licenses/by/3.0/).
Share and Cite
Jenkins, S.; Fischer, S.M.; Chen, L.; Sana, T.R. Global LC/MS Metabolomics Profiling of Calcium Stressed and Immunosuppressant Drug Treated Saccharomyces cerevisiae. Metabolites 2013, 3, 1102-1117. https://doi.org/10.3390/metabo3041102
Jenkins S, Fischer SM, Chen L, Sana TR. Global LC/MS Metabolomics Profiling of Calcium Stressed and Immunosuppressant Drug Treated Saccharomyces cerevisiae. Metabolites. 2013; 3(4):1102-1117. https://doi.org/10.3390/metabo3041102
Chicago/Turabian StyleJenkins, Stefan, Steven M. Fischer, Lily Chen, and Theodore R. Sana. 2013. "Global LC/MS Metabolomics Profiling of Calcium Stressed and Immunosuppressant Drug Treated Saccharomyces cerevisiae" Metabolites 3, no. 4: 1102-1117. https://doi.org/10.3390/metabo3041102