Application of Stable Isotope-Assisted Metabolomics for Cell Metabolism Studies

Abstract
:1. Introduction

| Approaches | Description | Example |
|---|---|---|
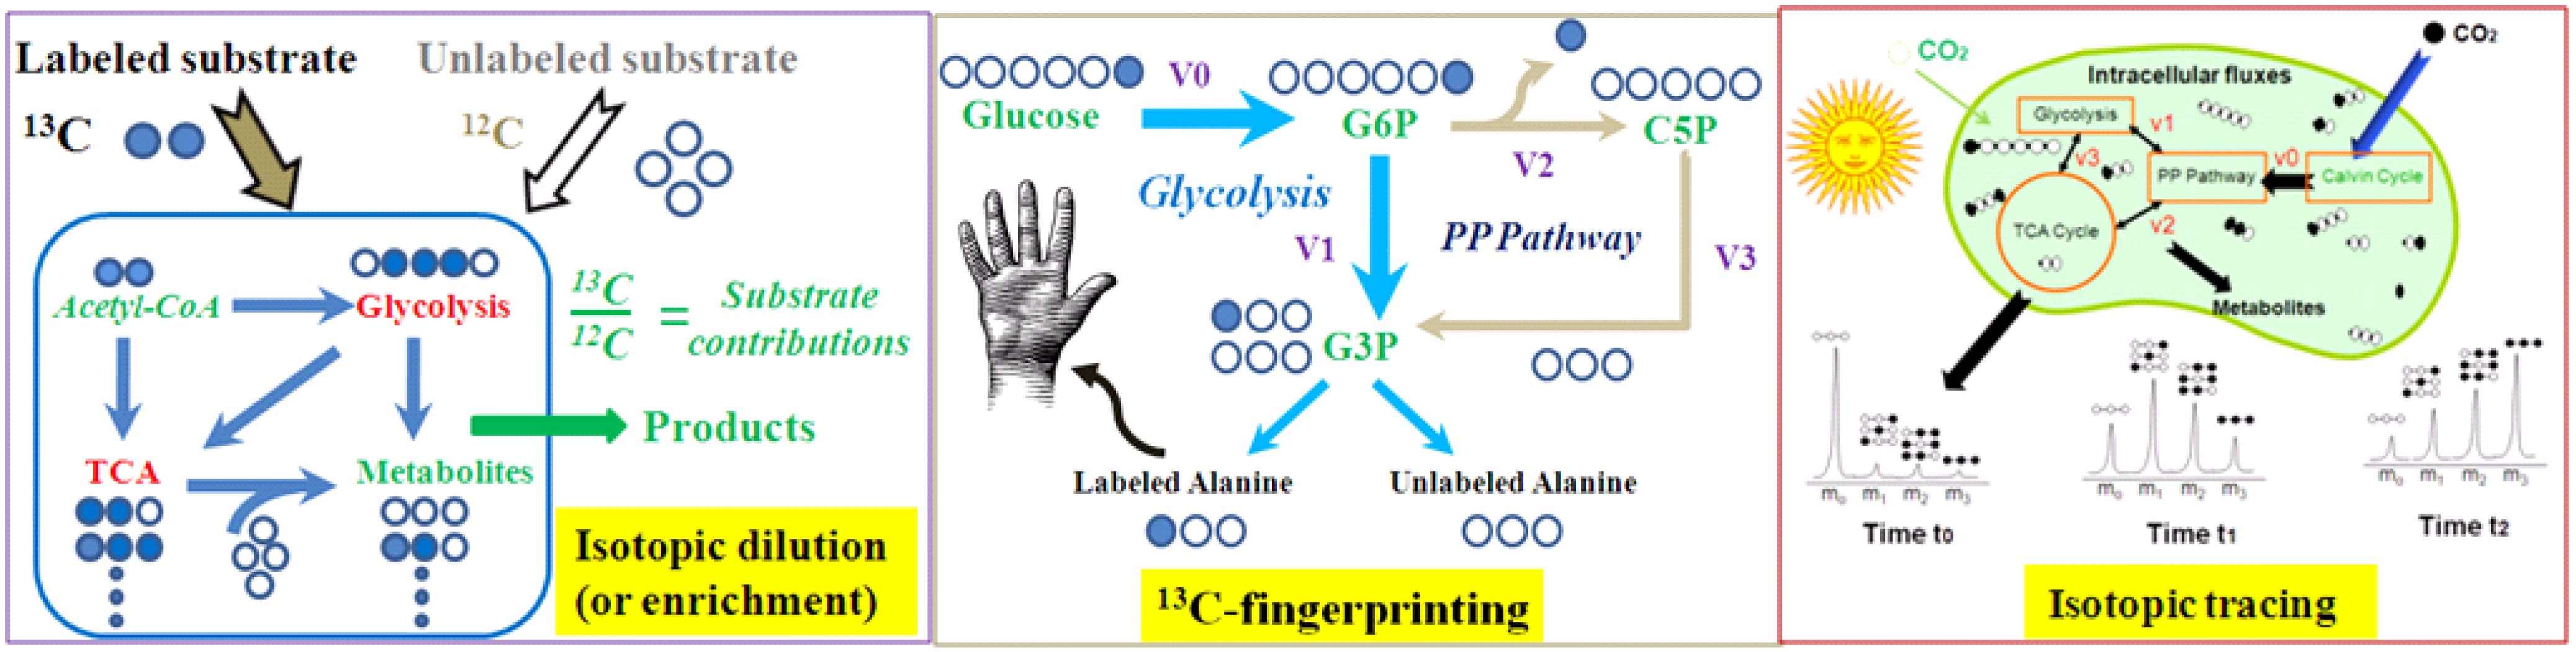
| Isotopic dilution (or enrichment) | Grow cells with multiple carbon sources (some of them are labeled); then measure labeling of the metabolic products. This method is used for studying cell nutrient utilizations. | In a culture with 13C-glucose and yeast extracts, analysis of 13C-enrichment in proteinogenic amino acids reveals the contributons of yeast extract to biomass synthesis. |
| Isotopic tracing | Expose cell culture to a labeled compound (pulse); then measure change of labeling in downstream metabolites over time (chase). Pulse-chase tracing allows isotopic non-stationary MFA to quantify cell fluxomes [16]. | The kinetics of isotopic incorporation from a nutrient into a downstream metabolite can detect and quantify functional pathways (e.g., kinetic flux profiling) [17] |
| 13C-fingerprinting | Use specified labeled 13C-substrates to create steady state and position specific labeling patterns in metabolites, which delineate functional pathways. 13C-fingerprint allows 13C-MFA to quantify cell fluxomes. | If cell grows with 1st position labeled glucose, labeling patterns in serine and alanine can examine the Entner-Doudoroff pathway function. |

2. Sample Preparation, Metabolite Separations, and MS Analysis
2.1. Metabolite Quenching
2.2. Metabolite Extraction
2.3. Metabolite Derivatization
2.4. Metabolite Separation Platforms

3. Isotopologue and Isotopomer Analysis
3.1. MS Resolutions
| Mass difference (in Dalton) | 13C–12C | 15N–14N | 18O–16O | D–H | 34S–32S |
|---|---|---|---|---|---|
| 1.003355 | 0.997035 | 2.004246 | 1.006277 | 1.995796 | |
| Mass shift | |||||
| M1 | 1.003355 | 0.997035 | - | 1.006277 | - |
| M2 | 2.006710 | 1.994070 | 2.004246 | 2.012554 | 1.995796 |
| M3 | 3.010065 | 2.991105 | - | 3.018831 | - |
| M4 | 4.013419 | 3.988140 | 4.008492 | 4.025108 | 7.983184 |

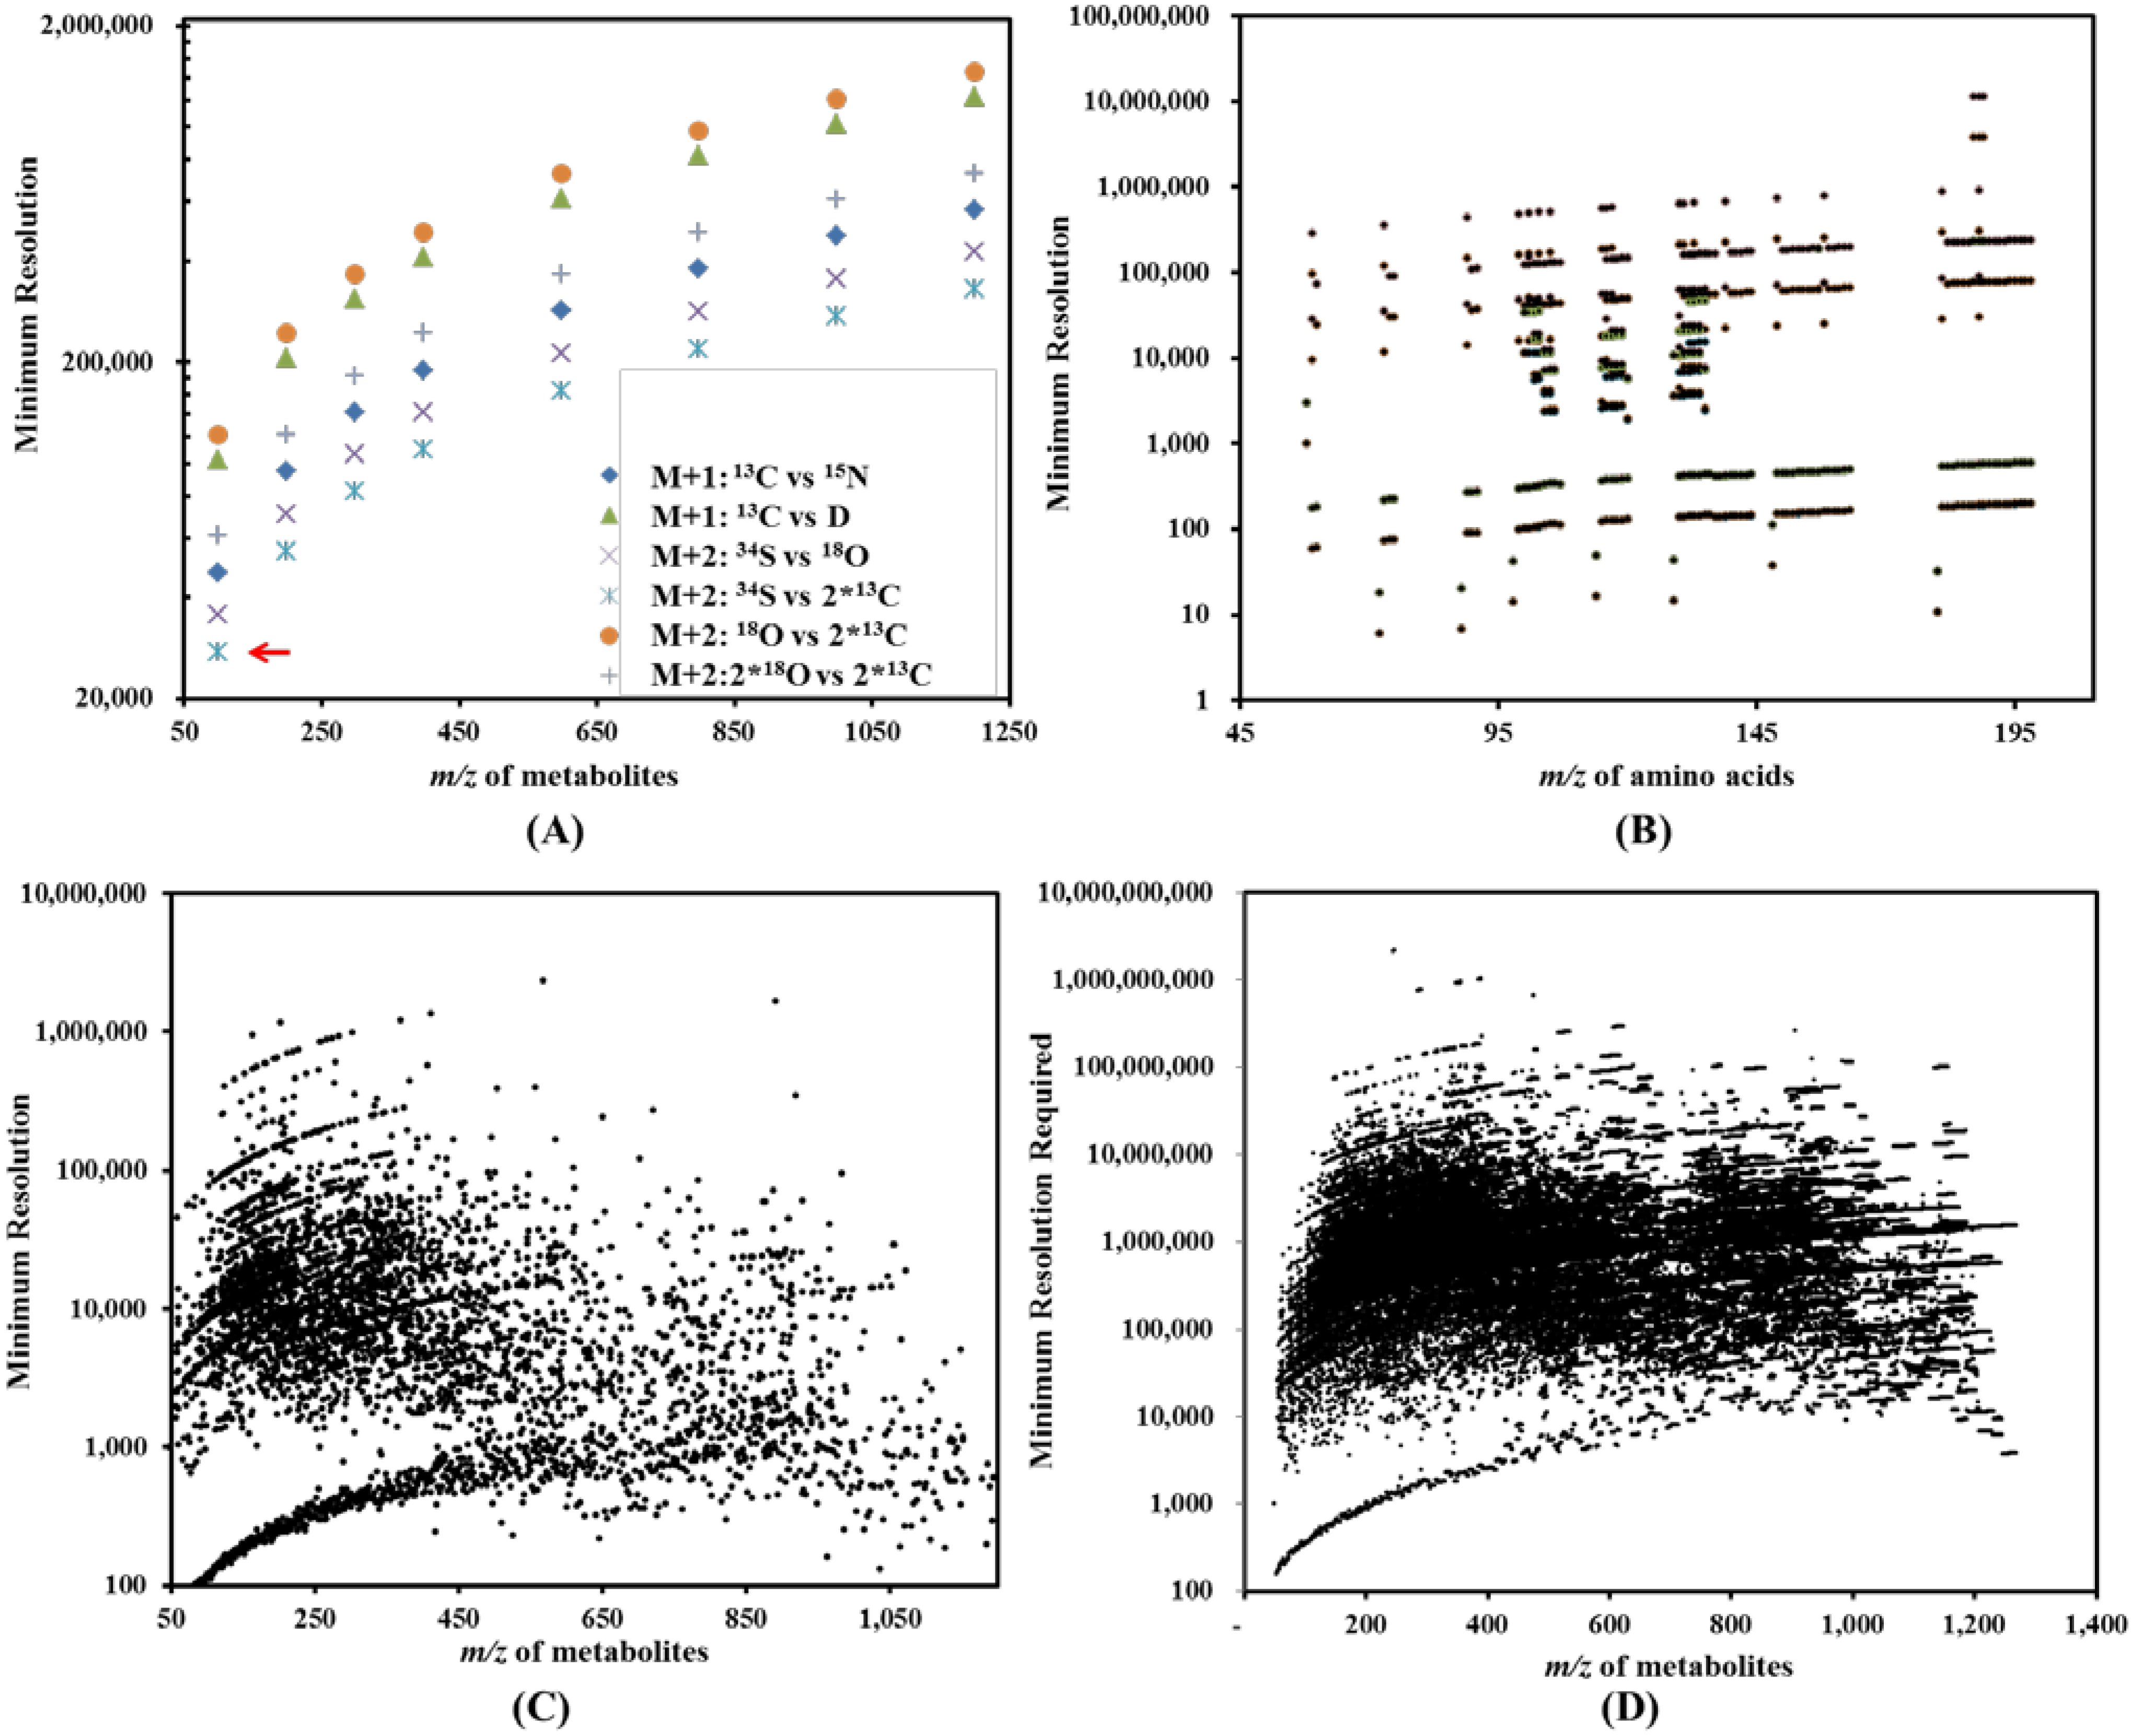
 (see Table 2). Thereby, we have one dot at the x-y coordinates (100, 27,488) in Figure 3A. In a similar approach, the cloud of dots in Figure 3A represents the resolutions required to distinguish major isotopologues for metabolites of different m/z. Figure 3B reports the minimum resolutions required to analyze isotopologues from a mixture of amino acids (121 data points). Figure 3C (4,598 data points) represents the minimum resolutions required to resolve two isobaric metabolites (metabolites with the same molecular weight) in a mixture of hypothetical metabolites without considering effects due to isotopologues (or isotopic peaks). Similar to Figure 3B, Figure 3D reports the minimum resolution required to resolve close isotopologues (160,253 data points) in a mixture of hypothetical metabolites.
3.2. MS Platform Selection
4. Data Analysis
5. Application of Isotope-Assisted Metabolomics
5.1. Isotope Analysis for Tracking Nutrient Utilizations
5.2. Isotope-Assisted Metabolite Identifications
5.3. Isotope-Assisted Metabolite Quantification
5.4. Isotope-Assisted Pathway Investigations
5.5. 13C-assisted Metabolic Flux Analysis
5.6. 13C-asssited Metabolic Analysis of Microbial Communities
6. Future Directions and Conclusions

Acknowledgments
Author Contributions
Conflicts of Interest
References
- Fiehn, O. Metabolomics—The link between genotypes and phenotypes. Plant Mol. Biol. 2002, 48, 155–171. [Google Scholar] [CrossRef]
- Allen, J.; Davey, H.M.; Broadhurst, D.; Heald, J.K.; Rowland, J.J.; Oliver, S.G.; Kell, D.B. High-throughput classification of yeast mutants for functional genomics using metabolic footprinting. Nat. Biotechnol. 2003, 21, 692–696. [Google Scholar] [CrossRef] [Green Version]
- Raamsdonk, L.M.; Teusink, B.; Broadhurst, D.; Zhang, N.; Hayes, A.; Walsh, M.C.; Berden, J.A.; Brindle, K.M.; Kell, D.B.; Rowland, J.J.; et al. A functional genomics strategy that uses metabolome data to reveal the phenotype of silent mutations. Nat. Biotechnol. 2001, 19, 45–50. [Google Scholar] [CrossRef]
- Griffin, J.L. Metabonomics: NMR spectroscopy and pattern recognition analysis of body fluids and tissues for characterisation of xenobiotic toxicity and disease diagnosis. Curr. Opin. Chem. Biol. 2003, 7, 648–654. [Google Scholar] [CrossRef]
- Kind, T.; Wohlgemuth, G.; Lee do, Y.; Lu, Y.; Palazoglu, M.; Shahbaz, S.; Fiehn, O. FiehnLib: Mass spectral and retention index libraries for metabolomics based on quadrupole and time-of-flight gas chromatography/mass spectrometry. Anal. Chem. 2009, 81, 10038–10048. [Google Scholar] [CrossRef]
- Tang, J.K.-H.; You, L.; Blankenship, R.E.; Tang, Y.J. Recent advances in mapping environmental microbial metabolisms through 13C isotopic fingerprints. J. R. Soc. Interface 2012, 9, 2767–2780. [Google Scholar] [CrossRef]
- Tjellstrom, H.; Yang, Z.; Allen, D.K.; Ohlrogge, J.B. Rapid kinetic labeling of Arabidopsis cell suspension cultures: Implications for models of lipid export from plastids. Plant Physiol. 2012, 158, 601–611. [Google Scholar]
- Bates, P.D.; Ohlrogge, J.B.; Pollard, M. Incorporation of newly synthesized fatty acids into cytosolic glycerolipids in pea leaves occurs via acyl editing. J. Biol. Chem. 2007, 282, 31206–31216. [Google Scholar]
- Fiehn, O. Combining genomics, metabolome analysis, and biochemical modelling to understand metabolic networks. Comp. Funct. Genomics 2001, 2, 155–168. [Google Scholar] [CrossRef]
- Huege, J.; Sulpice, R.; Gibon, Y.; Lisec, J.; Koehl, K.; Kopka, J. GC-EI-TOF-MS analysis of in vivo carbon-partitioning into soluble metabolite pools of higher plants by monitoring isotope dilution after 13CO2 labelling. Phytochemistry 2007, 68, 2258–2272. [Google Scholar] [CrossRef]
- Giavalisco, P.; Hummel, J.; Lisec, J.; Inostroza, A.C.; Catchpole, G.; Willmitzer, L. High-resolution direct infusion-based mass spectrometry in combination with whole 13C metabolome isotope labeling allows unambiguous assignment of chemical sum formulas. Anal. Chem. 2008, 80, 9417–9425. [Google Scholar]
- Giavalisco, P.; Li, Y.; Matthes, A.; Eckhardt, A.; Hubberten, H.M.; Hesse, H.; Segu, S.; Hummel, J.; Kohl, K.; Willmitzer, L. Elemental formula annotation of polar and lipophilic metabolites using (13) C, (15) N and (34) S isotope labelling, in combination with high-resolution mass spectrometry. Plant J. 2011, 68, 364–376. [Google Scholar] [CrossRef]
- Kalderon, B.; Gopher, A.; Lapidot, A. Metabolic pathways leading to liver glycogen repletion in vivo, studied by GC-MS and NMR. FEBS Lett. 1986, 204, 29–32. [Google Scholar] [CrossRef]
- Katz, J.; Lee, W.N.; Wals, P.A.; Bergner, E.A. Studies of glycogen synthesis and the Krebs cycle by mass isotopomer analysis with [U-13C]glucose in rats. J. Biol. Chem. 1989, 264, 12994–13004. [Google Scholar]
- Katz, J.; Lee, W.N. Application of mass isotopomer analysis for determination of pathways of glycogen synthesis. Am. J. Physiol. 1991, 261, E332–E336. [Google Scholar]
- Young, J.D.; Shastri, A.A.; Stephanopoulos, G.; Morgan, J.A. Mapping photoautotrophic metabolism with isotopically nonstationary 13C flux analysis. Metab. Eng. 2011, 13, 656–665. [Google Scholar] [CrossRef]
- Yuan, J.; Bennett, B.D.; Rabinowitz, J.D. Kinetic flux profiling for quantitation of cellular metabolic fluxes. Nat. Protoc. 2008, 3, 1328–1340. [Google Scholar] [CrossRef]
- De Koning, W.; van Dam, K. A method for the determination of changes of glycolytic metabolites in yeast on a subsecond time scale using extraction at neutral pH. Anal. Biochem. 1992, 204, 118–123. [Google Scholar] [CrossRef]
- Villas-Bôas, S.G.; Højer-Pedersen, J.; Åkesson, M.; Smedsgaard, J.; Nielsen, J. Global metabolite analysis of yeast: Evaluation of sample preparation methods. Yeast 2005, 22, 1155–1169. [Google Scholar] [CrossRef]
- Bolten, C.J.; Kiefer, P.; Letisse, F.; Portais, J.-C.; Wittmann, C. Sampling for metabolome analysis of microorganisms. Anal. Chem. 2007, 79, 3843–3849. [Google Scholar]
- Villas-Bôas, S.G.; Bruheim, P. Cold glycerol–saline: The promising quenching solution for accurate intracellular metabolite analysis of microbial cells. Anal. Biochem. 2007, 370, 87–97. [Google Scholar] [CrossRef]
- Wittmann, C.; Krömer, J.O.; Kiefer, P.; Binz, T.; Heinzle, E. Impact of the cold shock phenomenon on quantification of intracellular metabolites in bacteria. Anal. Biochem. 2004, 327, 135–139. [Google Scholar] [CrossRef]
- Bennett, B.D.; Yuan, J.; Kimball, E.H.; Rabinowitz, J.D. Absolute quantitation of intracellular metabolite concentrations by an isotope ratiobased approach. Nat. Protoc. 2008, 3, 1299–1311. [Google Scholar] [CrossRef]
- Winder, C.L.; Dunn, W.B.; Schuler, S.; Broadhurst, D.; Jarvis, R.; Stephens, G.M.; Goodacre, R. Global metabolic profiling of Escherichia coli cultures: An evaluation of methods for quenching and extraction of intracellular metabolites. Ana. Chem. 2008, 80, 2939–2948. [Google Scholar] [CrossRef]
- Canelas, A.B.; ten Pierick, A.; Ras, C.; Seifar, R.M.; van Dam, J.C.; van Gulik, W.M.; Heijnen, J.J. Quantitative evaluation of intracellular metabolite extraction techniques for yeast metabolomics. Anal. Chem. 2009, 81, 7379–7389. [Google Scholar]
- Geier, F.M.; Want, E.J.; Leroi, A.M.; Bundy, J.G. Cross-platform comparison of Caenorhabditis elegans tissue extraction strategies for comprehensive metabolome coverage. Anal. Chem. 2011, 83, 3730–3736. [Google Scholar] [CrossRef]
- Dietmair, S.; Timmins, N.E.; Gray, P.P.; Nielsen, L.K.; Krömer, J.O. Towards quantitative metabolomics of mammalian cells: Development of a metabolite extraction protocol. Anal. Biochem. 2010, 404, 155–164. [Google Scholar] [CrossRef]
- Halket, J.M.; Waterman, D.; Przyborowska, A.M.; Patel, R.K.P.; Fraser, P.D.; Bramley, P.M. Chemical derivatization and mass spectral libraries in metabolic profiling by GC/MS and LC/MS/MS. J. Exp. Bot. 2005, 56, 219–243. [Google Scholar]
- Bollinger, J.G.; Thompson, W.; Lai, Y.; Oslund, R.C.; Hallstrand, T.S.; Sadilek, M.; Turecek, F.; Gelb, M.H. Improved sensitivity mass spectrometric detection of eicosanoids by charge reversal derivatization. Anal. Chem. 2010, 82, 6790–6796. [Google Scholar] [CrossRef]
- Wells, R.J. Recent advances in non-silylation derivatization techniques for gas chromatography. J. Chromatogr. A 1999, 843, 1–18. [Google Scholar] [CrossRef]
- Fiehn, O.; Kopka, J.; Dormann, P.; Altmann, T.; Trethewey, R.N.; Willmitzer, L. Metabolite profiling for plant functional genomics. Nat. Biotechnol. 2000, 18, 1157–1161. [Google Scholar] [CrossRef]
- Zhang, B.; Tolstikov, V.; Turnbull, C.; Hicks, L.M.; Fiehn, O. Divergent metabolome and proteome suggest functional independence of dual phloem transport systems in cucurbits. Proc. Natl. Acad. Sci. USA 2010, 107, 13532–13537. [Google Scholar] [CrossRef]
- Graham, T.L. A rapid, high resolution high performance liquid chromatography profiling procedure for plant and microbial aromatic secondary metabolites. Plant Physiol. 1991, 95, 584–593. [Google Scholar] [CrossRef]
- Coulier, L.; Bas, R.; Jespersen, S.; Verheij, E.; van der Werf, M.J.; Hankemeier, T. Simultaneous quantitative analysis of metabolites using ion-pair liquid chromatography-electrospray ionization mass spectrometry. Anal. Chem. 2006, 78, 6573–6582. [Google Scholar] [CrossRef]
- Zhang, B.; Watts, K.M.; Hodge, D.; Kemp, L.M.; Hunstad, D.A.; Hicks, L.M.; Odom, A.R. A second target of the antimalarial and antibacterial agent fosmidomycin revealed by cellular metabolic profiling. Biochemistry 2011, 50, 3570–3577. [Google Scholar] [CrossRef]
- Magnes, C.; Sinner, F.M.; Regittnig, W.; Pieber, T.R. LC/MS/MS method for quantitative determination of long-chain fatty acyl-CoAs. Anal. Chem. 2005, 77, 2889–2894. [Google Scholar] [CrossRef]
- Grobe, N.; Zhang, B.; Fisinger, U.; Kutchan, T.M.; Zenk, M.H.; Guengerich, F.P. Mammalian cytochrome P450 enzymes catalyze the phenol-coupling step in endogenous morphine biosynthesis. J. Biol. Chem. 2009, 284, 24425–24431. [Google Scholar]
- Merrill, A.H.; Dennis, E.A.; McDonald, J.G.; Fahy, E. Lipidomics technologies at the end of the first decade and the beginning of the next. Adv. Nutr. 2013, 4, 565–567. [Google Scholar]
- Fahy, E.; Sud, M.; Cotter, D.; Subramaniam, S. LIPID MAPS online tools for lipid research. Nucleic Acids Res. 2007, 35, W606–W612. [Google Scholar] [CrossRef]
- Degenkolbe, T.; Giavalisco, P.; Zuther, E.; Seiwert, B.; Hincha, D.K.; Willmitzer, L. Differential remodeling of the lipidome during cold acclimation in natural accessions of Arabidopsis thaliana. Plant J. 2012, 72, 972–982. [Google Scholar]
- Yamada, T.; Uchikata, T.; Sakamoto, S.; Yokoi, Y.; Fukusaki, E.; Bamba, T. Development of a lipid profiling system using reverse-phase liquid chromatography coupled to high-resolution mass spectrometry with rapid polarity switching and an automated lipid identification software. J. Chromatogr. A 2013, 1292, 211–218. [Google Scholar] [CrossRef]
- Shui, G.; Guan, X.L.; Low, C.P.; Chua, G.H.; Goh, J.S.; Yang, H.; Wenk, M.R. Toward one step analysis of cellular lipidomes using liquid chromatography coupled with mass spectrometry: Application to Saccharomyces cerevisiae and Schizosaccharomyces pombe lipidomics. Mol. Biosyst. 2010, 6, 1008–1017. [Google Scholar] [CrossRef]
- Bird, S.S.; Marur, V.R.; Sniatynski, M.J.; Greenberg, H.K.; Kristal, B.S. Lipidomics profiling by high-resolution LC-MS and high-energy collisional dissociation fragmentation: Focus on characterization of mitochondrial cardiolipins and monolysocardiolipins. Anal. Chem. 2011, 83, 940–949. [Google Scholar] [CrossRef]
- Iwasaki, Y.; Goto, M.; Mochizuki, K.; Terayama, E.; Ito, R.; Saito, K.; Sugino, N.; Makino, T.; Nakazawa, H. Development and validation of a hydrophilic interaction chromatography-tandem mass spectrometry for quantification of nicotine and its metabolites in human maternal and cord sera. Biomed. Chromatogr. 2011, 25, 503–510. [Google Scholar] [CrossRef]
- Lisa, M.; Cifkova, E.; Holcapek, M. Lipidomic profiling of biological tissues using off-line two-dimensional high-performance liquid chromatography-mass spectrometry. J. Chromatogr. A 2011, 1218, 5146–5156. [Google Scholar] [CrossRef]
- Garcia-Canaveras, J.C.; Donato, M.T.; Castell, J.V.; Lahoz, A. A comprehensive untargeted metabonomic analysis of human steatotic liver tissue by RP and HILIC chromatography coupled to mass spectrometry reveals important metabolic alterations. J. Proteome Res. 2011, 10, 4825–4834. [Google Scholar] [CrossRef]
- Donot, F.; Cazals, G.; Gunata, Z.; Egron, D.; Malinge, J.; Strub, C.; Fontana, A.; Schorr-Galindo, S. Analysis of neutral lipids from microalgae by HPLC-ELSD and APCI-MS/MS. J. Chromatogr. B Anal. Technol. Biomed. Life Sci. 2013, 942–943, 98–106. [Google Scholar]
- Iwasaki, Y.; Sawada, T.; Hatayama, K.; Ohyagi, A.; Tsukuda, Y.; Namekawa, K.; Ito, R.; Saito, K.; Nakazawa, H. Separation technique for the determination of highly polar metabolites in biological samples. Metabolites 2012, 2, 496–515. [Google Scholar] [CrossRef]
- Alonso, A.P.; Piasecki, R.J.; Wang, Y.; LaClair, R.W.; Shachar-Hill, Y. Quantifying the labeling and the levels of plant cell wall precursors using ion chromatography tandem mass spectrometry. Plant Physiol. 2010, 153, 915–924. [Google Scholar] [CrossRef]
- Iwatani, S.; van Dien, S.; Shimbo, K.; Kubota, K.; Kageyama, N.; Iwahata, D.; Miyano, H.; Hirayama, K.; Usuda, Y.; Shimizu, K.; et al. Determination of metabolic flux changes during fed-batch cultivation from measurements of intracellular amino acids by LC-MS/MS. J. Biotechnol. 2007, 128, 93–111. [Google Scholar] [CrossRef]
- McNaught, A.D.; Wilkinson, A.; International Union of Pure and Applied Chemistry; Royal Society of Chemistry (Great Britain). IUPAC Compendium of Chemical Terminology, 2nd ed.; Royal Society of Chemistry: Cambridge, UK, 2000. [Google Scholar]
- Pingitore, F.; Tang, Y.; Kruppa, G.H.; Keasling, J.D. Analysis of amino acid isotopomers using FT-ICR MS. Anal. Chem. 2007, 79, 2483–2490. [Google Scholar] [CrossRef]
- Blank, L.M.; Desphande, R.R.; Schmid, A.; Hayen, H. Analysis of carbon and nitrogen co-metabolism in yeast by ultrahigh-resolution mass spectrometry applying 13C- and 15N-labeled substrates simultaneously. Anal. Bioanal. Chem. 2012, 403, 2291–2305. [Google Scholar] [CrossRef]
- Lorkiewicz, P.; Higashi, R.M.; Lane, A.N.; Fan, T.W. High information throughput analysis of nucleotides and their isotopically enriched isotopologues by direct-infusion FTICR-MS. Metabolomics 2012, 8, 930–939. [Google Scholar] [CrossRef]
- Kind, T.; Fiehn, O. Seven Golden Rules for heuristic filtering of molecular formulas obtained by accurate mass spectrometry. BMC Bioinform. 2007, 8. [Google Scholar] [CrossRef]
- Valkenborg, D.; Mertens, I.; Lemiere, F.; Witters, E.; Burzykowski, T. The isotopic distribution conundrum. Mass Spectrom. Rev. 2012, 31, 96–109. [Google Scholar]
- Marshall, A.G.; Blakney, G.T.; Chen, T.; Kaiser, N.K.; McKenna, A.M.; Rodgers, R.P.; Ruddy, B.M.; Xian, F. Mass resolution and mass accuracy: How much is enough? Mass Spectrom. 2013, 2, S0009. [Google Scholar]
- Guerrasio, R.; Haberhauer-Troyer, C.; Steiger, M.; Sauer, M.; Mattanovich, D.; Koellensperger, G.; Hann, S. Measurement uncertainty of isotopologue fractions in fluxomics determined via mass spectrometry. Anal. Bioanal. Chem. 2013, 405, 5133–5146. [Google Scholar] [CrossRef]
- Hall, R.D.; Wishart, D.S.; Roessner, U. Metabolomics and the move towards biology. Metabolomics 2011, 7, 454–456. [Google Scholar] [CrossRef]
- Caspi, R.; Altman, T.; Dreher, K.; Fulcher, C.A.; Subhraveti, P.; Keseler, I.M.; Kothari, A.; Krummenacker, M.; Latendresse, M.; Mueller, L.A.; et al. The MetaCyc database of metabolic pathways and enzymes and the BioCyc collection of pathway/genome databases. Nucleic Acids Res. 2012, 40, D742–D753. [Google Scholar] [CrossRef]
- Tohge, T.; Fernie, A. R. Web-based resources for mass-spectrometry-based metabolomics: A user’s guide. Phytochemistry 2009, 70, 450–456. [Google Scholar] [CrossRef]
- Nikolskiy, I.; Mahieu, N.G.; Chen, Y., Jr.; Tautenhahn, R.; Patti, G.J. An untargeted metabolomicworkflow to improve structural characterization of metabolites. Anal. Chem. 2013, 85, 7713–7719. [Google Scholar] [CrossRef]
- Bateman, K.P.; Castro-Perez, J.; Wrona, M.; Shockcor, J.P.; Yu, K.; Oballa, R.; Nicoll-Griffith, D.A. MSE with mass defect filtering for in vitro and in vivo metabolite identification. Rapid Commun. Mass Spectrom. 2007, 21, 1485–1496. [Google Scholar] [CrossRef]
- Wahl, S.A.; Dauner, M.; Wiechert, W. New tools for mass isotopomer data evaluation in 13C flux analysis: Mass isotope correction, data consistency checking, and precursor relationships. Biotechnol. Bioeng. 2004, 85, 259–268. [Google Scholar] [CrossRef]
- Eibl, G.; Bernardo, K.; Koal, T.; Ramsay, S. L.; Weinberger, K. M.; Graber, A. Isotope correction of mass spectrometry profiles. Rapid Commun. Mass Spectrom. 2008, 22, 2248–2252. [Google Scholar] [CrossRef]
- Wu, B.; Zhang, B.; Feng, X.; Rubens, J.R.; Huang, R.; Hicks, L.M.; Pakrasi, H.B.; Tang, Y.J. Alternative isoleucine synthesis pathway in cyanobacterial species. Microbiology 2010, 156, 596–602. [Google Scholar] [CrossRef]
- McLafferty, F.W.; Tureccek, F. Interpretation of Mass Spectra, 4th ed.; University Science Books: Sausalito, CA, USA, 1993. [Google Scholar]
- Moseley, H.N. Correcting for the effects of natural abundance in stable isotope resolved metabolomics experiments involving ultra-high resolution mass spectrometry. BMC Bioinform. 2010, 11. [Google Scholar] [CrossRef]
- Kind, T.; Tolstikov, V.; Fiehn, O.; Weiss, R.H. A comprehensive urinary metabolomic approach for identifying kidney cancer. Anal. Biochem. 2007, 363, 185–195. [Google Scholar] [CrossRef]
- Smith, C.A.; Want, E.J.; O’Maille, G.; Abagyan, R.; Siuzdak, G. XCMS: Processing mass spectrometry data for metabolite profiling using nonlinear peak alignment, matching, and identification. Anal. Chem. 2006, 78, 779–787. [Google Scholar] [CrossRef]
- Pluskal, T.; Castillo, S.; Villar-Briones, A.; Oresic, M. MZmine 2: Modular framework for processing, visualizing, and analyzing mass spectrometry-based molecular profile data. BMC Bioinform. 2010, 11. [Google Scholar] [CrossRef]
- Katajamaa, M.; Miettinen, J.; Oresic, M. MZmine: Toolbox for processing and visualization of mass spectrometry based molecular profile data. Bioinformatics 2006, 22, 634–636. [Google Scholar] [CrossRef]
- Smith, C.A.; Maille, G.O.; Want, E.J.; Qin, C.; Trauger, S.A.; Brandon, T.R.; Custodio, D.E.; Abagyan, R.; Siuzdak, G. METLIN: A Metabolite Mass Spectral Database. Ther. Drug Monit. 2005, 27, 747–751. [Google Scholar] [CrossRef]
- Larsen, T.; Taylor, D.L.; Leigh, M.B.; O’Brien, D.M. Stable isotope fingerprinting: A novel method for identifying plant, fungal, or bacterial origins of amino acids. Ecology 2009, 90, 3526–3535. [Google Scholar] [CrossRef]
- Christiansen, T.; Christensen, B.; Nielsen, J. Metabolic network analysis of Bacillus clausii on minimal and semirich medium using 13C-labeled glucose. Metab. Eng. 2002, 4, 159–169. [Google Scholar] [CrossRef]
- Zhuang, W.Q.; Yi, S.; Feng, X.; Zinder, S.H.; Tang, Y.J.; Alvarez-Cohen, L. Selective utilization of exogenous amino acids by Dehalococcoides ethenogenes strain 195 and the enhancement resulted to dechloronation activity. Appl. Environ. Microbiol. 2011, 77, 7797–7803. [Google Scholar] [CrossRef]
- Dos Santos, M.M.; Gombert, A.K.; Christensen, B.; Olsson, L.; Nielsen, J. Identification of in vivo enzyme activities in the cometabolism of glucose and acetate by Saccharomyces cerevisiae by using 13C-labeled substrates. Eukaryot. Cell 2003, 2, 599–608. [Google Scholar] [CrossRef]
- Goodson, C.; Roth, R.; Wang, Z.T.; Goodenough, U. Structural correlates of cytoplasmic and chloroplast lipid body synthesis in Chlamydomonas reinhardtii and stimulation of lipid body production with acetate boost. Eukaryot. Cell 2011, 10, 1592–1606. [Google Scholar] [CrossRef]
- Wyche, K.P.; Blake, R.S.; Willis, K.A.; Monks, P.S.; Ellis, A.M. Differentiation of isobaric compounds using chemical ionization reaction mass spectrometry. Rapid Commun. Mass Spectrom. 2005, 19, 3356–3362. [Google Scholar] [CrossRef]
- Fortner, E.C.; Knighton, W.B. Quantitatively resolving mixtures of isobaric compounds using chemical ionization mass spectrometry by modulating the reactant ion composition. Rapid Commun. Mass Spectrom. 2008, 22, 2597–2601. [Google Scholar] [CrossRef]
- Rodgers, R.; Blumer, E.; Hendrickson, C.; Marshall, A. Stable isotope incorporation triples the upper mass limit for determination of elemental composition by accurate mass measurement. J. Am. Soc. Spectrom. 2000, 11, 835–840. [Google Scholar] [CrossRef]
- Hegeman, A.D.; Schulte, C.F.; Cui, Q.; Lewis, I.A.; Huttlin, E.L.; Eghbalnia, H.; Harms, A.C.; Ulrich, E.L.; Markley, J.L.; Sussman, M.R. Stable isotope assisted assignment of elemental compositions for metabolomics. Anal. Chem. 2007, 79, 6912–6921. [Google Scholar] [CrossRef]
- Baran, R.; Bowen, B.P.; Bouskill, N.J.; Brodie, E.L.; Yannone, S.M.; Northen, T.R. Metabolite identification in Synechococcus sp. PCC 7002 using untargeted stable isotope assisted metabolite profiling. Anal. Chem. 2010, 82, 9034–9042. [Google Scholar] [CrossRef]
- Weber, R.; Selander, E.; Sommer, U.; Viant, M. A stable-isotope mass spectrometry-based metabolic footprinting approach to analyze exudates from phytoplankton. Mar. Drugs 2013, 11, 4158–4175. [Google Scholar] [CrossRef]
- Hiller, K.; Metallo, C.M.; Kelleher, J.K.; Stephanopoulos, G. Nontargeted elucidation of metabolic pathways using stable-isotope tracers and mass spectrometry. Anal. Chem. 2010, 82, 6621–6628. [Google Scholar] [CrossRef]
- Creek, D.J.; Chokkathukalam, A.; Jankevics, A.; Burgess, K.E.V.; Breitling, R.; Barrett, M.P. Stable isotope-assisted metabolomics for network-wide metabolic pathway elucidation. Anal. Chem. 2012, 84, 8442–8447. [Google Scholar] [CrossRef]
- Wu, L.; Mashego, M.R.; van Dam, J.C.; Proell, A.M.; Vinke, J.L.; Ras, C.; van Winden, W.A.; van Gulik, W.M.; Heijnen, J.J. Quantitative analysis of the microbial metabolome by isotope dilution mass spectrometry using uniformly 13C-labeled cell extracts as internal standards. Anal. Biochem. 2005, 336, 164–171. [Google Scholar] [CrossRef]
- Yuan, J.; Fowler, W.U.; Kimball, E.; Lu, W.; Rabinowitz, J.D. Kinetic flux profiling of nitrogen assimilation in Escherichia coli. Nat. Chem. Biol. 2006, 2, 529–530. [Google Scholar] [CrossRef]
- Cobbold, S.A.; Vaughan, A.M.; Lewis, I.A.; Painter, H.J.; Camargo, N.; Perlman, D.H.; Fishbaugher, M.; Healer, J.; Cowman, A.F.; Kappe, S.H.I.; et al. Kinetic flux profiling elucidates two independent acetyl-CoA biosynthetic pathways in Plasmodium falciparum. J. Biol. Chem. 2013, 288, 36338–36350. [Google Scholar] [CrossRef]
- Peyraud, R.; Kiefer, P.; Christen, P.; Massou, S.; Portais, J.-C.; Vorholt, J.A. Demonstration of the ethylmalonyl-CoA pathway by using 13C metabolomics. Proc. Natl. Acad. Sci. USA 2009, 106, 4846–4851. [Google Scholar] [CrossRef]
- Bogorad, I.W.; Lin, T.-S.; Liao, J.C. Synthetic non-oxidative glycolysis enables complete carbon conservation. Nature 2013, 502, 693–697. [Google Scholar] [CrossRef]
- Butler, J.A.; Mishur, R.J.; Bokov, A.F.; Hakala, K.W.; Weintraub, S.T.; Rea, S.L. Profiling the anaerobic response of C. elegans using GC-MS. PLoS One 2012, 7, e46140. [Google Scholar]
- Dalvi, S.; Azetsu, S.; Patrauchan, M.A.; Aktas, D.F.; Fathepure, B.Z. Proteogenomic elucidation of the initial steps in the benzene degradation pathway of a novel halophile, Arhodomonas sp. strain rozel, isolated from a hypersaline environment. Appl. Environ. Microbiol. 2012, 78, 7309–7316. [Google Scholar] [CrossRef]
- Hasokawa, M.; Shinohara, M.; Tsugawa, H.; Bamba, T.; Fukusaki, E.; Nishiumi, S.; Nishimura, K.; Yoshida, M.; Ishida, T.; Hirata, K.-I. Identification of biomarkers of stent restenosis with serum metabolomic profiling using gas chromatography/mass spectrometry. Circ. J. 2012, 76, 1864–1873. [Google Scholar] [CrossRef]
- Trushina, E.; Dutta, T.; Persson, X.-M.T.; Mielke, M.M.; Petersen, R.C. Identification of altered metabolic pathways in plasma and csf in mild cognitive impairment and alzheimer’s disease using metabolomics. PLoS One 2013, 8, e63644. [Google Scholar]
- Weckwerth, W.; Fiehn, O. Can we discover novel pathways using metabolomic analysis? Curr. Opin. Biotechnol. 2002, 13, 156–160. [Google Scholar]
- Vander Heiden, M.G. Targeting cancer metabolism: A therapeutic window opens. Nat. Rev. Drug Discov. 2011, 10, 671–684. [Google Scholar] [CrossRef] [Green Version]
- Gupta, S.; Kim, J.; Prasad, S.; Aggarwal, B. Regulation of survival, proliferation, invasion, angiogenesis, and metastasis of tumor cells through modulation of inflammatory pathways by nutraceuticals. Cancer Metastasis Rev. 2010, 29, 405–434. [Google Scholar] [CrossRef]
- Anso, E.; Mullen, A.; Felsher, D.; Mates, J.; DeBerardinis, R.; Chandel, N. Metabolic changes in cancer cells upon suppression of MYC. Cancer Metab. 2013, 1. [Google Scholar] [CrossRef]
- Nelson, S.J.; Kurhanewicz, J.; Vigneron, D.B.; Larson, P.E.Z.; Harzstark, A.L.; Ferrone, M.; van Criekinge, M.; Chang, J.W.; Bok, R.; Park, I.; et al. Metabolic imaging of patients with prostate cancer using hyperpolarized [1–13C]pyruvate. Sci. Transl. Med. 2013, 5, 198ra108. [Google Scholar]
- Luo, Y.; Yoneda, J.; Ohmori, H.; Sasaki, T.; Shimbo, K.; Eto, S.; Kato, Y.; Miyano, H.; Kobayashi, T.; Sasahira, T.; et al. Cancer usurps skeletal muscle as an energy repository. Cancer Res. 2013, 74, 330–340. [Google Scholar]
- Dutta, P.; Le, A.; Vander Jagt, D.L.; Tsukamoto, T.; Martinez, G.V.; Dang, C.V.; Gillies, R.J. Evaluation of LDH-A and glutaminase inhibition in vivo by hyperpolarized 13C-pyruvate magnetic resonance spectroscopy of tumors. Cancer Res. 2013, 73, 4190–4195. [Google Scholar]
- Metallo, C.M.; Vander Heiden, M.G. Understanding metabolic regulation and its influence on cell physiology. Mol. Cell 2013, 49, 388–398. [Google Scholar] [CrossRef]
- Dauner, M.; Sauer, U. GC-MS analysis of amino acids rapidly provides rich information for isotopomer balancing. Biotechnol. Prog. 2000, 16, 642–649. [Google Scholar] [CrossRef]
- You, L.; Page, L.; Feng, X.; Berla, B.; Pakrasi, H.B.; Tang, Y.J. Metabolic pathway confirmation and discovery through 13C-labeling of proteinogenic amino acids. J. Vis. Exp. 2012. [Google Scholar] [CrossRef]
- Wiechert, W. 13C Metabolic flux analysis. Metab. Eng. 2001, 3, 195–206. [Google Scholar] [CrossRef]
- Xiong, W.; Liu, L.; Wu, C.; Yang, C.; Wu, Q. 13C-Tracer and gas chromatography-mass spectrometry analyses reveal metabolic flux distribution in the oleaginous microalga Chlorella protothecoides. Plant Physiol. 2010, 154, 1001–1011. [Google Scholar] [CrossRef]
- Hörl, M.; Schnidder, J.; Sauer, U.; Zamboni, N. Non-stationary 13C-metabolic flux ratio analysis. Biotechnol. Bioeng. 2013, 110, 3164–3176. [Google Scholar] [CrossRef]
- Metallo, C.M.; Walther, J.L.; Stephanopoulos, G. Evaluation of 13C isotopic tracers for metabolic flux analysis in mammalian cells. J. Biotechnol. 2009, 144, 167–174. [Google Scholar] [CrossRef]
- Rühl, M.; Zamboni, N.; Sauer, U. Dynamic flux responses in riboflavin overproducing Bacillus subtilis to increasing glucose limitation in fed-batch culture. Biotechnol. Bioeng. 2010, 105, 795–804. [Google Scholar]
- Wahrheit, J.; Nicolae, A.; Heinzle, E. Eukaryotic metabolism: Measuring compartment fluxes. Biotechnol. J. 2011, 6, 1071–1085. [Google Scholar] [CrossRef]
- Ahn, W.S.; Antoniewicz, M.R. Towards dynamic metabolic flux analysis in CHO cell cultures. Biotechnol. J. 2012, 7, 61–74. [Google Scholar] [CrossRef]
- Williams, T.C.R.; Sweetlove, L.J.; Ratcliffe, R.G. Capturing metabolite channeling in metabolic flux phenotypes. Plant Physiol. 2011, 157, 981–984. [Google Scholar] [CrossRef]
- Heinzle, E.; Matsuda, F.; Miyagawa, H.; Wakasa, K.; Nishioka, T. Estimation of metabolic fluxes, expression levels and metabolite dynamics of a secondary metabolic pathway in potato using label pulse-feeding experiments combined with kinetic network modelling and simulation. Plant J. 2007, 50, 176–187. [Google Scholar] [CrossRef]
- Hoekstra, R.; Nibourg, G.A.A.; van der Hoeven, T.V.; Ackermans, M.T.; Hakvoort, T.B.M.; van Gulik, T.M.; Lamers, W.H.; Elferink, R.P.O.; Chamuleau, R.A.F.M. The HepaRG cell line is suitable for bioartificial liver application. Int. J. Biochem. Cell Biol. 2011, 43, 1483–1489. [Google Scholar] [CrossRef]
- Mavri-Damelin, D.; Damelin, L.H.; Eaton, S.; Rees, M.; Selden, C.; Hodgson, H.J.F. Cells for bioartificial liver devices: The human hepatoma-derived cell line C3A produces urea but does not detoxify ammonia. Biotechnol. Bioeng. 2008, 99, 644–651. [Google Scholar] [CrossRef]
- Nyberg, G.B.; Balcarcel, R.R.; Follstad, B.D.; Stephanopoulos, G.; Wang, D.I.C. Metabolic effects on recombinant interferon-γ glycosylation in continuous culture of Chinese hamster ovary cells. Biotechnol. Bioeng. 1999, 62, 336–347. [Google Scholar] [CrossRef]
- Sengupta, N.; Rose, S.T.; Morgan, J.A. Metabolic flux analysis of CHO cell metabolism in the late non-growth phase. Biotechnol. Bioeng. 2011, 108, 82–92. [Google Scholar] [CrossRef]
- Ahn, W.; Antoniewicz, M. Metabolic flux analysis of CHO cells at growth and non-growth phases using isotopic tracers and mass spectrometry. Metab. Eng. 2011, 13, 598–609. [Google Scholar] [CrossRef]
- Stolyar, S.; van Dien, S.; Hillesland, K.L.; Pinel, N.; Lie, T.J.; Leigh, J.A.; Stahl, D.A. Metabolic modeling of a mutualistic microbial community. Mol. Syst. Biol. 2007, 3. [Google Scholar] [CrossRef]
- De Graaf, A.A.; Maathuis, A.; de Waard, P.; Deutz, N.E.P.; Dijkema, C.; de Vos, W.M.; Venema, K. Profiling human gut bacterial metabolism and its kinetics using [U-13C]glucose and NMR. NMR Biomed. 2010, 23, 2–12. [Google Scholar] [CrossRef]
- Bombach, P.; Chatzinotas, A.; Neu, T.R.; Kästner, M.; Lueders, T.; Vogt, C. Enrichment and characterization of a sulfate-reducing toluene-degrading microbial consortium by combining in situ microcosms and stable isotope probing techniques. FEMS Microbiol. Ecol. 2010, 71, 237–246. [Google Scholar] [CrossRef]
- Eisenreich, W.; Dandekar, T.; Heesemann, J.; Goebel, W. Carbon metabolism of intracellular bacterial pathogens and possible links to virulence. Nat. Rev. Microbiol. 2010, 8, 401–412. [Google Scholar] [CrossRef]
- Fuchs, T.M.; Eisenreich, W.; Kern, T.; Dandekar, T. Towards a systemic understanding of Listeria monocytogenes metabolism during infection. Front. Microbiol. 2012, 3. [Google Scholar] [CrossRef]
- Götz, A.; Eylert, E.; Eisenreich, W.; Goebel, W. Carbon metabolism of enterobacterial human pathogens growing in epithelial colorectal adenocarcinoma (Caco-2) cells. PLoS One 2010, 5, e10586. [Google Scholar] [CrossRef] [Green Version]
- Rühl, M.; Hardt, W.D.; Sauer, U. Subpopulation-specific metabolic pathway usage in mixed cultures as revealed by reporter protein-based 13C analysis. Appl. Environ. Microbiol. 2011, 77, 1816–1821. [Google Scholar] [CrossRef]
- Galagan, J.E.; Minch, K.; Peterson, M.; Lyubetskaya, A.; Azizi, E.; Sweet, L.; Gomes, A.; Rustad, T.; Dolganov, G.; Glotova, I.; et al. The Mycobacterium tuberculosis regulatory network and hypoxia. Nature 2013, 499, 178–183. [Google Scholar] [CrossRef]
- Arakawa, K.; Tomita, M. Merging multiple omics datasets in silico: Statistical analyses and data interpretation. In Systems Metabolic Engineering; Alper, H.S., Ed.; Humana Press: New York, NY, USA, 2013; Volume 985, pp. 459–470. [Google Scholar]
- Liu, L.; Yang, T.; Ji, J.; Wen, Q.; Morgan, A.; Jin, B.; Chen, G.; Lyell, D.; Stevenson, D.; Ling, X.; et al. Integrating multiple “omics” analyses identifies serological protein biomarkers for preeclampsia. BMC Med. 2013, 11. [Google Scholar] [CrossRef]
- Zhang, W.; Li, F.; Nie, L. Integrating multiple “omics” analysis for microbial biology: Application and methodologies. Microbiology 2010, 156, 287–301. [Google Scholar] [CrossRef]
- Yoon, S.; Han, M.-J.; Jeong, H.; Lee, C.; Xia, X.-X.; Lee, D.-H.; Shim, J.; Lee, S.; Oh, T.; Kim, J. Comparative multi-omics systems analysis of Escherichia coli strains B and K-12. Genome Biol. 2012, 13, R37. [Google Scholar] [CrossRef]
- Villas-Boâs, S.; Moxley, J.; Akesson, M.; Stephanopoulos, G.; Nielsen, J. High-throughput metabolic state analysis: The missing link in integrated functional genomics of yeasts. Biochem. J. 2005, 388, 669–677. [Google Scholar] [CrossRef]
- Gygi, S.P.; Rochon, Y.; Franza, B.R.; Aebersold, R. Correlation between Protein and mRNA Abundance in Yeast. Mol. Cell. Biol. 1999, 19, 1720–1730. [Google Scholar]
- Schwab, W. Metabolome diversity: Too few genes, too many metabolites? Phytochemistry 2003, 62, 837–849. [Google Scholar] [CrossRef]
- Cheng, X.; Hiras, J.; Deng, K.; Bowen, B.; Simmons, B.; Adams, P.; Singer, S.; Northen, T. High throughput nanostructure-initiator mass spectrometry screening of microbial growth conditions for maximal ß-glucosidase production. Front. Microbiol. 2013, 4. [Google Scholar] [CrossRef]
- Reindl, W.; Northen, T.R. Rapid screening of fatty acids using nanostructure-initiator mass spectrometry. Anal. Chem. 2010, 82, 3751–3755. [Google Scholar] [CrossRef]
- Lane, A.N.; Fan, T.W.; Bousamra, M., 2nd; Higashi, R.M.; Yan, J.; Miller, D.M. Stable isotope-resolved metabolomics (SIRM) in cancer research with clinical application to nonsmall cell lung cancer. OMICS 2011, 15, 173–182. [Google Scholar] [CrossRef]
- Van der Hooft, J.J.J.; Mihaleva, V.; de Vos, R.C.H.; Bino, R.J.; Vervoort, J. A strategy for fast structural elucidation of metabolites in small volume plant extracts using automated MS-guided LC-MS-SPE-NMR. Magn. Reson. Chem. 2011, 49, S55–S60. [Google Scholar] [CrossRef]
- Marshall, A.G.; Hendrickson, C.L. High-resolution mass spectrometers. Annu. Rev. Anal. Chem. 2008, 1, 579–599. [Google Scholar] [CrossRef]
- Antoniewicz, M.R.; Kelleher, J.K.; Stephanopoulos, G. Elementary metabolite units (EMU): A novel framework for modeling isotopic distributions. Metab. Eng. 2007, 9, 68–86. [Google Scholar] [CrossRef]
© 2014 by the authors; licensee MDPI, Basel, Switzerland. This article is an open access article distributed under the terms and conditions of the Creative Commons Attribution license (http://creativecommons.org/licenses/by/3.0/).
Share and Cite
You, L.; Zhang, B.; Tang, Y.J. Application of Stable Isotope-Assisted Metabolomics for Cell Metabolism Studies. Metabolites 2014, 4, 142-165. https://doi.org/10.3390/metabo4020142
You L, Zhang B, Tang YJ. Application of Stable Isotope-Assisted Metabolomics for Cell Metabolism Studies. Metabolites. 2014; 4(2):142-165. https://doi.org/10.3390/metabo4020142
Chicago/Turabian StyleYou, Le, Baichen Zhang, and Yinjie J. Tang. 2014. "Application of Stable Isotope-Assisted Metabolomics for Cell Metabolism Studies" Metabolites 4, no. 2: 142-165. https://doi.org/10.3390/metabo4020142