Article

Multi-Capillary Column-Ion Mobility Spectrometry of Volatile Metabolites Emitted by Saccharomyces Cerevisiae

iAMB—Institute of Applied Microbiology, ABBt—Aachen Biology and Biotechnology, RWTH Aachen University, Worringer Weg, Aachen 52074, Germany
*
Author to whom correspondence should be addressed.
Metabolites 2014, 4(3), 751-774; https://doi.org/10.3390/metabo4030751
Submission received: 11 July 2014 / Revised: 25 August 2014 / Accepted: 29 August 2014 / Published: 5 September 2014
(This article belongs to the Special Issue Breath Analysis in Metabolomics)

Abstract

:
Volatile organic compounds (VOCs) produced during microbial fermentations determine the flavor of fermented food and are of interest for the production of fragrances or food additives. However, the microbial synthesis of these compounds from simple carbon sources has not been well investigated so far. Here, we analyzed the headspace over glucose minimal salt medium cultures of Saccharomyces cerevisiae using multi-capillary column-ion mobility spectrometry (MCC-IMS). The high sensitivity and fast data acquisition of the MCC-IMS enabled online analysis of the fermentation off-gas and 19 specific signals were determined. To four of these volatile compounds, we could assign the metabolites ethanol, 2-pentanone, isobutyric acid, and 2,3-hexanedione by MCC-IMS measurements of pure standards and cross validation with thermal desorption–gas chromatography-mass spectrometry measurements. Despite the huge biochemical knowledge of the biochemistry of the model organism S. cerevisiae, only the biosynthetic pathways for ethanol and isobutyric acid are fully understood, demonstrating the considerable lack of research of volatile metabolites. As monitoring of VOCs produced during microbial fermentations can give valuable insight into the metabolic state of the organism, fast and non-invasive MCC-IMS analyses provide valuable data for process control.

1. Introduction

Yeasts are key model organisms in eukaryotic research and play a significant role in many biotechnological processes. The use of yeast for biotechnological processes dates back to 7000–5000 BC, where it has been used for wine fermentation and in food processing. [1,2,3,4]. Today, yeast strains are used in the field of industrial, food, and pharmaceutical industry for the synthesis of broad range of products ranging from bakery products to bioethanol and pharmaceuticals [5,6,7,8]. With 4 million tons of yeast biomass produced worldwide in 2009 and an estimated yearly increase of 7% [9], the yeast biotechnological market is economically significant and growing. The so far most often used yeast cell factory is the baker’s yeast Saccharomyces cerevisiae. This yeast is not only the most widely used yeast in biotechnology, but is additionally the model system for eukaryotic organisms. Accordingly, much research has been conducted with S. cerevisiae and many of the today state-of-the-art analytical techniques and molecular biology methods have been first developed for and with this yeast. The simple and rapid cultivation, genetic accessibility, and industrial importance were and still are drivers to maintain its lead in the yeast community in many disciplines of science.
The haploid S. cerevisiae genome consists of about 12,500 kb and was completely sequenced as early as 1996 (first complete genome sequence of a eukaryote) [10]. Physiological and functional genomics studies have characterized 5097 of the 6607 open reading frames (ORFs) [11]. The genomic and metabolic information is gathered in different databases (SGD [12], MIPS [13], YPD [14]) and in genome-scale metabolic network reconstructions. The first genome-scale metabolic model was published in 2003 [15], which consisted of 1175 metabolic reactions and 584 metabolites. Since then, several revised metabolic yeast models were reported (e.g., [16,17,18,19]), which were for example extended by the intracellular location of the respective metabolic pathways, i.e., by compartmentation, and by the ever-increasing knowledge generated by the yeast community. A comprehensive consensus model was assembled in 2008 [20], which is continually updated. Its current version [21] comprises 2220 metabolites participating in 3490 reactions, which are annotated with 910 yeast genes encoding the catalyzing enzymes, about 18% of the verified open reading frames included in the Saccharomyces Genome Database [12]. Also, a lot of effort is put into the integration of different omics data in order to get a quantitative understanding of the metabolism and its regulation [22].
Surprisingly, the volatile metabolites produced by yeast are mainly neglected in yeast research with the most prominent exceptions of acetate and ethanol. This can be attributed to the limited knowledge of the biochemistry and genetics involved in the formation of volatile metabolites that hinder the general incorporation in systems biology studies. By far, most reports of volatile metabolites from yeast-derived products originate from researchers interested in high quality wine making [23,24,25,26,27], as the scent of wine impacts its organoleptic properties [28]. The main classes of volatile metabolites observed are alcohols, aldehydes, and esters (Table 1); while depending on grape and yeast used, many others can be found. Notably, most studies reported were carried out on media that have wine-like compositions. Thus, the media are most often complex, with alternative carbon and nitrogen sources present. The observed volatile metabolites can therefore originate from glucose catabolism or are products from biotransformation, i.e., do not originate from sugar (the carbon and energy source), but rather from grape metabolites that were only modified by yeast enzymes.
Recently, the known microbial volatile organic compounds (mVOCs) have been gathered in a database, mVOC [29], containing 846 metabolites from 349 bacterial and 69 fungal species (as of December 2013). Compared to other VOC specific databases such as Pherobase [30], SuperScent [31] or FlavorNet [32] or the recently published compilation of VOCs from the human body [33], which list up to 8000 compounds, the volatile metabolite space of microbes is rather little explored. This becomes all the more apparent, when checking the representation of VOCs in metabolic databases or genome-scale metabolic reconstructions. Of the 93 compounds listed in Table 1, only 19 are contained in the current yeast genome-scale metabolic model (Version 7.11) [34] or the yeast genome database SGD [12].
Table 1. Volatile organic compounds emitted from S. cerevisiae fermentations. It is indicated which of the compounds are included in the latest yeast genome scale metabolic reconstruction (Yeast 7.11) and in the Saccharomyces genome database SGD.
CompoundCompound classPubChem IDIncluded inReference #
Yeast 7.11SGD
(2-phenylcyclopropyl) methanolalcohols317540nono[35]
1,2-benzenedicarboxylic acidacids1017nono[29,36]
1,3-butanediolalcohols6440nono[35]
1-butanolalcohols263nono[35]
1-heptanolalcohols8129nono[35]
1-hexanolalcohols8103nono[23,24,25,37]
1-propanolalcohols1031nono[23,24,25,37,38]
2,3-butanediolalcohols262yesyes[23,24]
2,5-dimethylpyrazine *pyrazines31252nono[29,36]
2-ethyl-1-hexanolalcohols7720nono[29,36,37]
2-furfuraldehydealdehydes7362nono[25]
2-hexanolalcohols12297nono[35]
2-methyl-2-butanol *alcohols6405nono[24,25,37]
2-methylbutanal *aldehydes7284yesno[29,36]
2-methylbutanoic acidacids8314nono[29,36]
2-methylbutanolalcohols8723yesyes[24,25,37]
2-pentanoneketones7895nono[29,36]
2-phenylethanol *benzenoids6054yesyes[23,24,25,26,29,36]
2-phenylethyl acetateesters7654nono[25,26]
2-propanealkanes6334nono[37]
2-propanolalcohols3776nono[29,36,37,38]
2-xylenebenzenoids7237nono[29,36]
3-methylbutanal *aldehydes11552yesyes[37]
3-methylbutanoic acid *acids10430nono[24,25,29,36]
3-methylheptyl acetateesters537686nono[37]
5-methyl-2-furfuraldehydealdehydes12097nono[25]
acetaldehydealdehydes177yesyes[24,25,37,38]
acetaldehyde diethylacetalethers7765nono[25]
acetic acidacids176yesyes[23,29,36]
acetic acid 2-propenyl esteresters11584nono[37]
acetic acid ethenyl esteresters7904nono[29,36]
acetoinketones179yesyes[25]
acetoneketones180nono[29,36]
acetophenoneketones7410nono[25]
benzaldehydealdehydes240nono[25]
benzyl acetatealcohols8455nono[25]
benzyl alcohol *alcohols244noyes[25]
butanalaldehydes261nono[37]
butanone *ketones6569nono[29,36,37]
butyric acidcarboxylic acids264nono[24,26]
cis-3-hexen-1-olalcohols5281167nono[24,25]
decanoic acidcarboxylic acids2969nono[23,24,25,26]
diacetyl *ketones650noyes[25,37]
diethyl succinateesters31249nono[23,24,25]
dimethyl disulfide *sulfides12232nono[29,36]
dodecanoic acid *carboxylic acids3893nono[24,26]
ethanolalcohols702yesyes[29,36]
ethyl 2-methylbutyrateesters24020nono[25]
ethyl acetateesters8857yesno[24,25,29,36,37,38]
ethyl benzoateesters7165nono[25]
ethyl butyrateesters7762nono[23,25,26]
ethyl caproateesters31265nono[23,24,25,26,37]
ethyl caprylateesters7799nono[23,24,25,26,37]
ethyl decanoateesters8048nono[23,24,25,26]
ethyl furoateesters11980nono[25]
ethyl heptanoateesters7797nono[25]
ethyl isobutyrateesters7342nono[25,37]
ethyl isovalerateesters7945nono[25,37]
ethyl lactateesters7344nono[24,25]
ethyl pehnylacetateesters7590nono[25]
ethyl propanoateesters7749nono[25,37]
ethyl pyruvateesters12041nono[24]
ethyl valerateesters10882nono[25]
ethyl-2-hydroxy propionateesters545098nono[23]
furfuryl alcohol *alcohols7360nono[25]
guaiacol *alcohols460noyes[25]
heptanal *aldehydes8130nono[37]
heptanoic acidcarboxylic acids8094nono[25]
hexanalaldehydes6184nono[25]
hexanoic acid *carboxylic acids8892nono[23,24,25,26]
hexyl acetateesters8908nono[24,25,26]
isoamyl acetateesters31276yesno[37]
isoamyl alcoholalcohols31260yesyes[23,24,25,26,37]
isobutanal *aldehydes6561noyes[37]
isobutanolalcohols6560yesyes[23,24,25,29,36,37,38]
isobutyl acetateesters8038yesno[25,37]
limoneneterpenes22311nono[29,36]
linalyl propionateesters61098nono[23]
methanol *alcohols887nono[24,25]
methyl acetatesilanes76214nono[25]
methylpropanoic acid *acids6590noyes[24,29,36]
monoethyl succinateesters70610nono[23]
n-butyl acetateesters31272nono[25,37]
nonanalaldehydes31289nono[37]
nonanoic acidcarboxylic acids8158nono[25]
n-propyl acetateesters7997nono[25,37]
octanoic acid *carboxylic acids379nono[23,24,25,26]
pentanalaldehydes8063nono[37]
propionic acidcarboxylic acids1032nono[24]
pyrazinepyrazines9261nono[29,36]
undecanealkanes14257nono[29,36]
α-terpineolterpenes17100nono[25]
β-phenylethyl formateesters7711nono[37]
* These compounds were also detected in yeast extract [39]. In reference [36], yeast was cultivated in malt extract and tryptone soya, in reference [37] yeast extract, plus bactopeptone and glucose was used. All other references reported volatiles from wine fermentations.
One of the key bottlenecks in VOC research, and one of the reasons why these have not been studied broadly so far, is that sample preparation of gaseous chemicals requires additional care and that the analysis of volatiles is challenging. Most often, VOCs are extracted and enriched using head-space/solid phase microextraction (HS/SPME) methods and analyzed with gas chromatography coupled to advanced mass spectrometers [40,41]. An alternative technique for the analysis of volatile metabolites is ion mobility spectrometry (IMS). IMS has originally been used to detect explosives, chemical warfare agents or illegal drugs, but finds more and more broader applications, for example in medicine as diagnostic tool (breath analyses), for food quality control or monitoring and process control in the chemical and biotechnological industry. The increasing popularity can be attributed to its high sensitivity (detection limits down to ng L−1/pg L−1 or ppbv/pptv [42,43]), combined with relatively low investment and operating costs and high-speed data acquisition; a reading of a single spectrum takes only 20–50 ms [44]. The IMS separates analytes according to their gas-phase ion mobility. The sample is first ionized, e.g., directly by UV light or via charge transfer from ionized reactant ions produced by a radioactive ionization source (e.g., 63Ni). In the drift tube, the ionized molecules are accelerated by an electric field towards a Faraday plate, where the impact of the single ions is detected. While the ions are pulled along the drift tube they are separated by collision with the drift gas flowing into the opposite direction (Figure 1B). The ion mobility is compound specific and depends on the ion’s mass, charge, and shape. Hence, IMS allows the separation of molecule isomers.
The IMS is especially effective, when coupled to a multi capillary column (MCC) as a pre-separation unit. In this way, the volatile metabolites are separated in two dimensions, firstly according to the elution from the MCC and secondly through the specific drift velocity in the IMS. This hyphenated technique significantly increases the resolution of metabolites [40,45]. MCCs consists of approx. 1000 parallel capillaries that can withstand high gas fluxes and are insensitive to humidity levels up to 100% [46], thus allowing direct measurements of the fermentation off-gas without sample preparation. The total analysis time of one sample in an MCC-IMS is less than 500 s [44]. These characteristics together with the high sensitivity perfectly suit the MCC-IMS for on-line measurements of dilute volatile metabolites in the headspace of microbial fermentations.
Mass spectrometers have a higher potential for identification of metabolites, but come with the disadvantage of longer time intervals for analysis. Furthermore, GC-MS instruments require special gases such as helium and high vacuum, hence come with relatively high operating costs and technical expenditure. In contrast, MCC-IMS can be operated with nitrogen or air (not necessarily synthetic air) and at ambient temperature and pressure.
The potential of MCC-IMS analyses for fermentation monitoring has already been shown for measurements of mVOCs produced during batch cultivation of Escherichia coli and Pseudomonas aeruginosa in shake flasks [45,47]. Also, MCC-IMS measurements of yeast fermentation have been reported, in which on-line measurements of the off-gas of yeast fermentations were performed. While Kotiaho [48] focused on the quantification of one single metabolite, ethanol, Kohlemainen et al., measured patterns of off-gas metabolites without any analyte identification [49]. The potential of IMS analyses for quality control during beer fermentation was shown by Vautz et al. [50] by monitoring the ripening indicators diacetyl and 2,3-pentanedione. In this contribution we aimed for online MCC-IMS measurements for the monitoring and, combined with GC-MS analyses, for the identification of mVOCs produced by S. cerevisiae. Different growth conditions were tested and special emphasis was put on the dynamics of the VOC profiles during transient metabolic conditions, i.e., the shift from respiratory to fermentative metabolism.

2. Results and Discussion

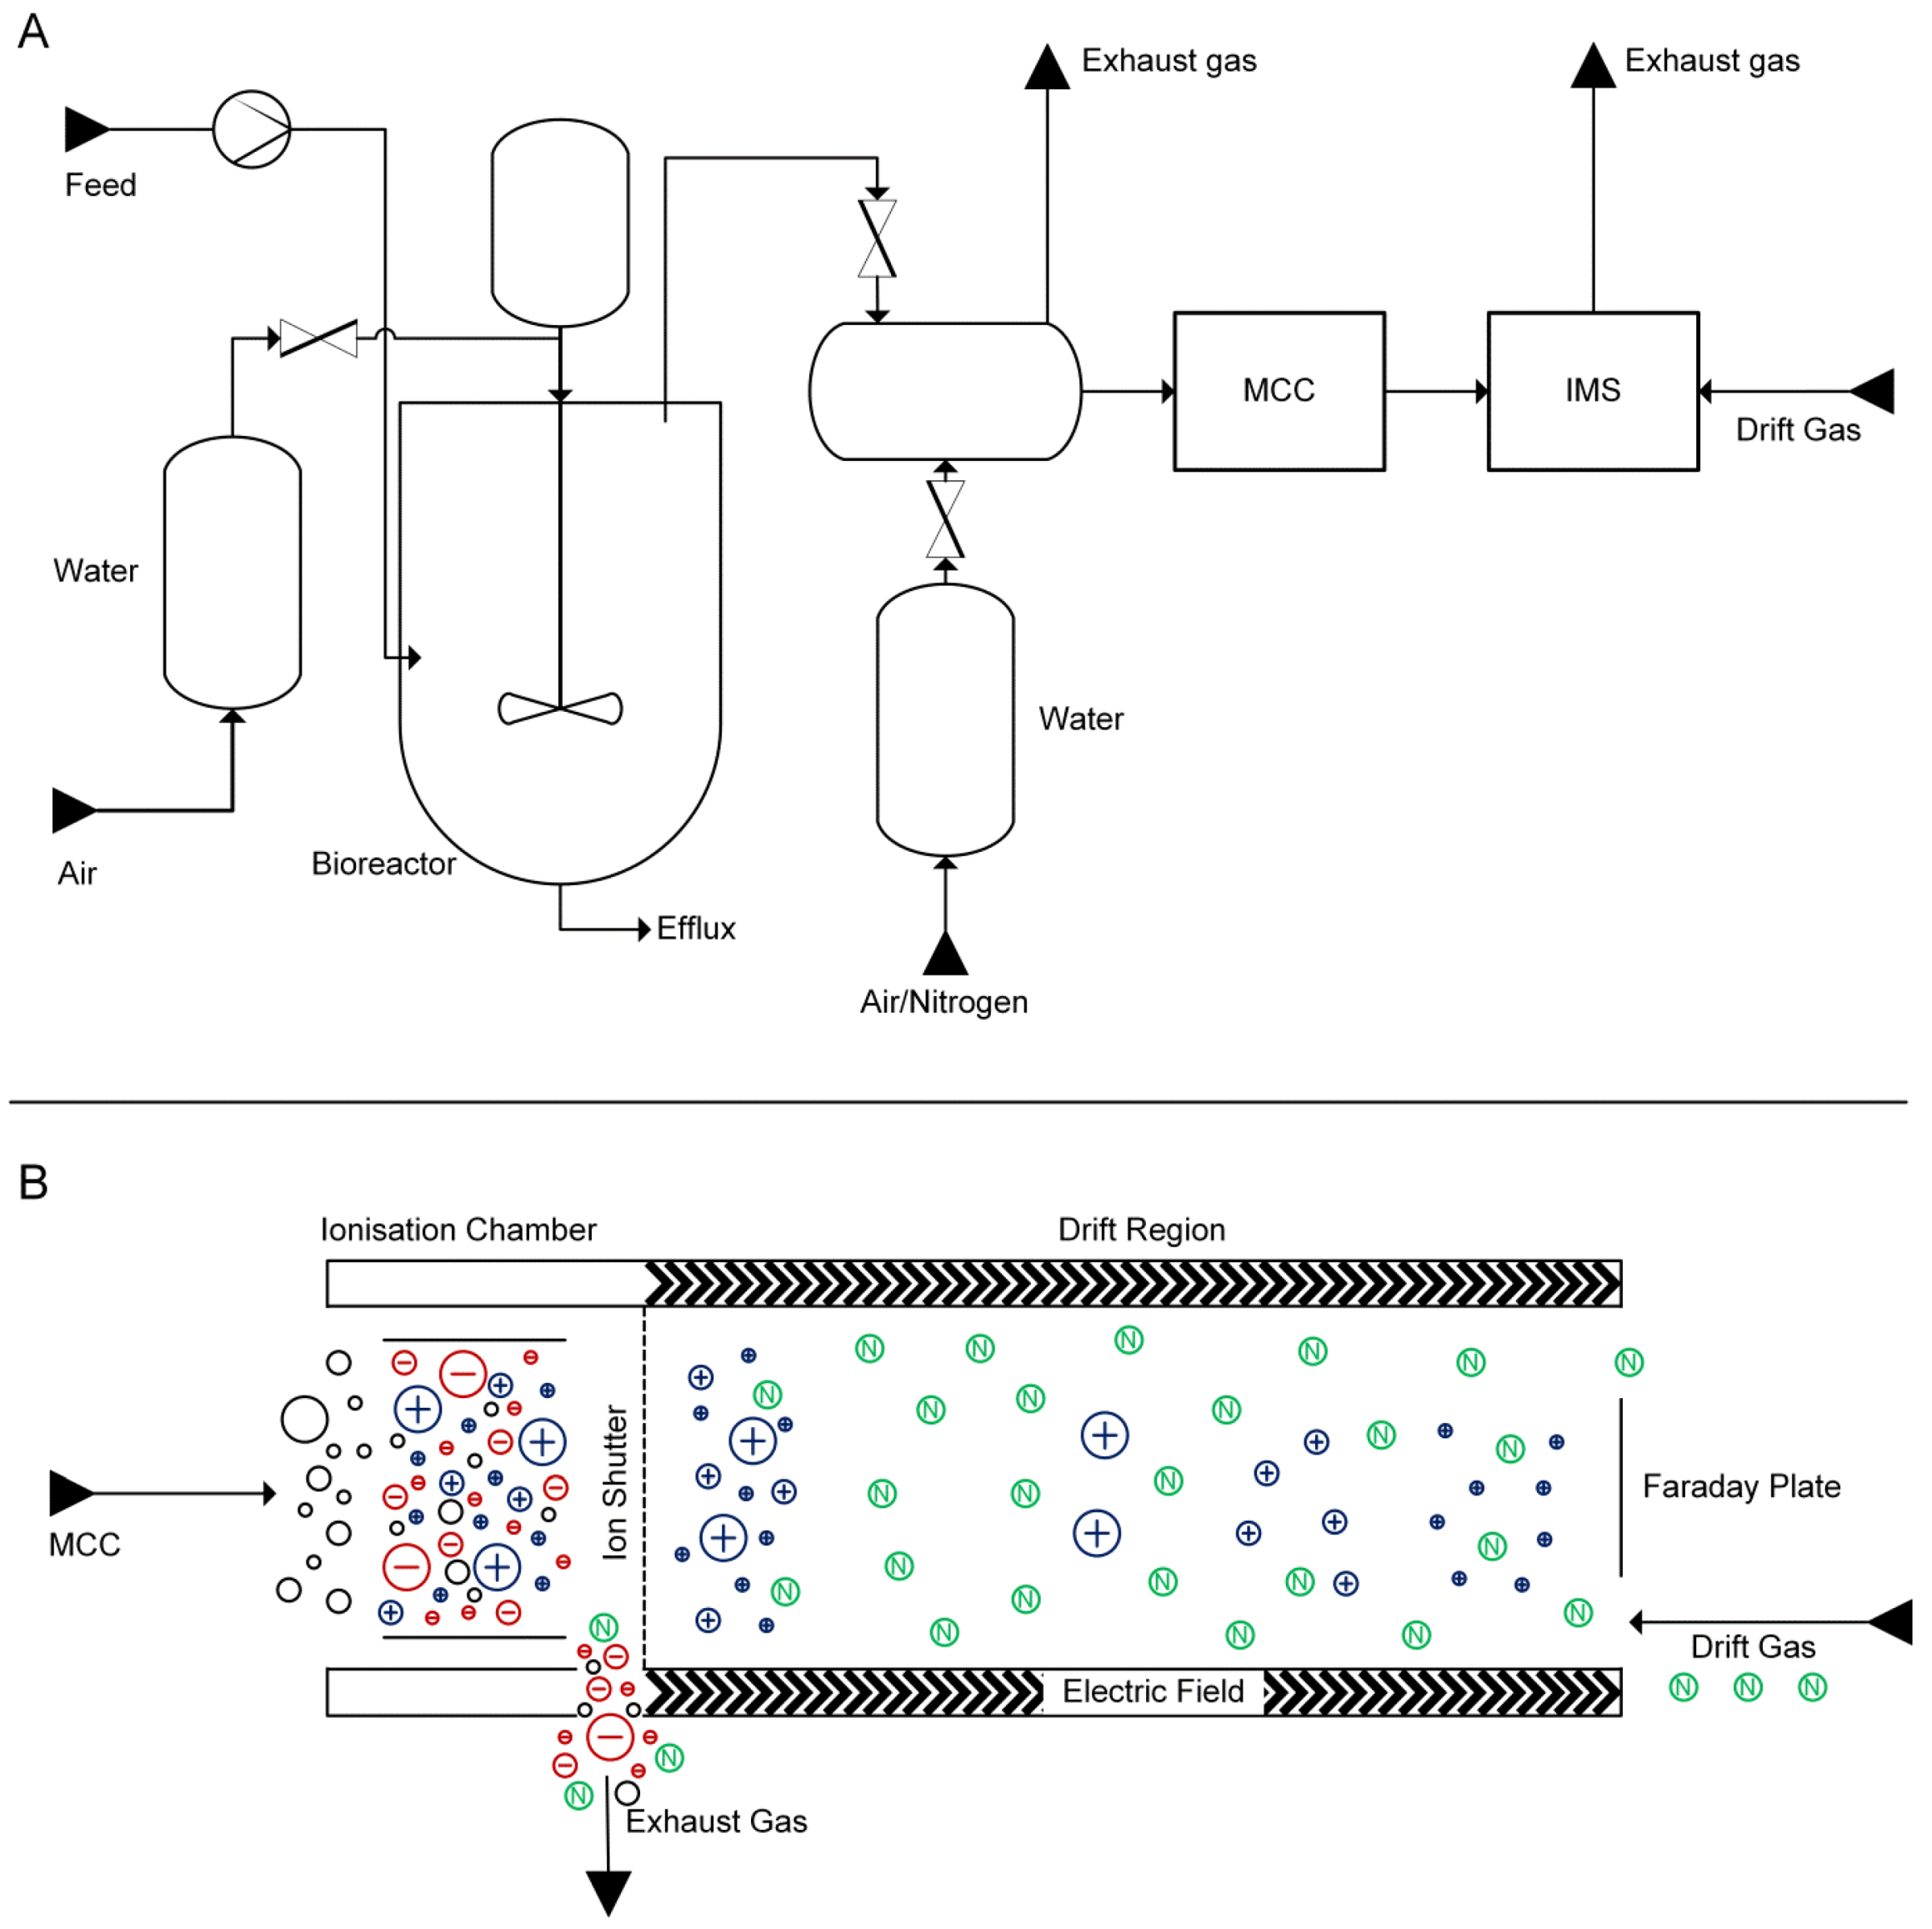
2.1. Experimental Setup

To enable off-gas measurements, the MCC-IMS had to be connected to the bioreactor in a controlled and robust manner. To achieve this, the off-gas of the bioreactor was connected to a mixing chamber where it was diluted with filtered, compressed air. To ensure proper mixing, the gas inlets were positioned at the bottom, while the gas outlet to the MCC-IMS was positioned in the upper section of the chamber. A second outlet leading through a filter into the environment was positioned at the top.
Between measurements, the MCC-IMS and sampling line were flushed with nitrogen at a flow rate of 100 mL min−1 (Figure 1A). To avoid microbial contaminations and the introduction of volatile impurities from the compressed air, the gas used for aeration of the bioreactor was passed through a 0.2 µm filter and a water bath. The overall setup allowed controlled sampling without disturbances from the environment as no impurities were observed in the MCC-IMS during abiotic operation of the bioreactor.
Figure 1. (A) Experimental set-up for the on-line MCC-IMS measurements of fermenter off-gas. (B) Working principle of the ion mobility spectrometer; adapted from [33].
Metabolites 04 00751 g001

2.2. Growth-Dependent Production of Volatile Metabolites

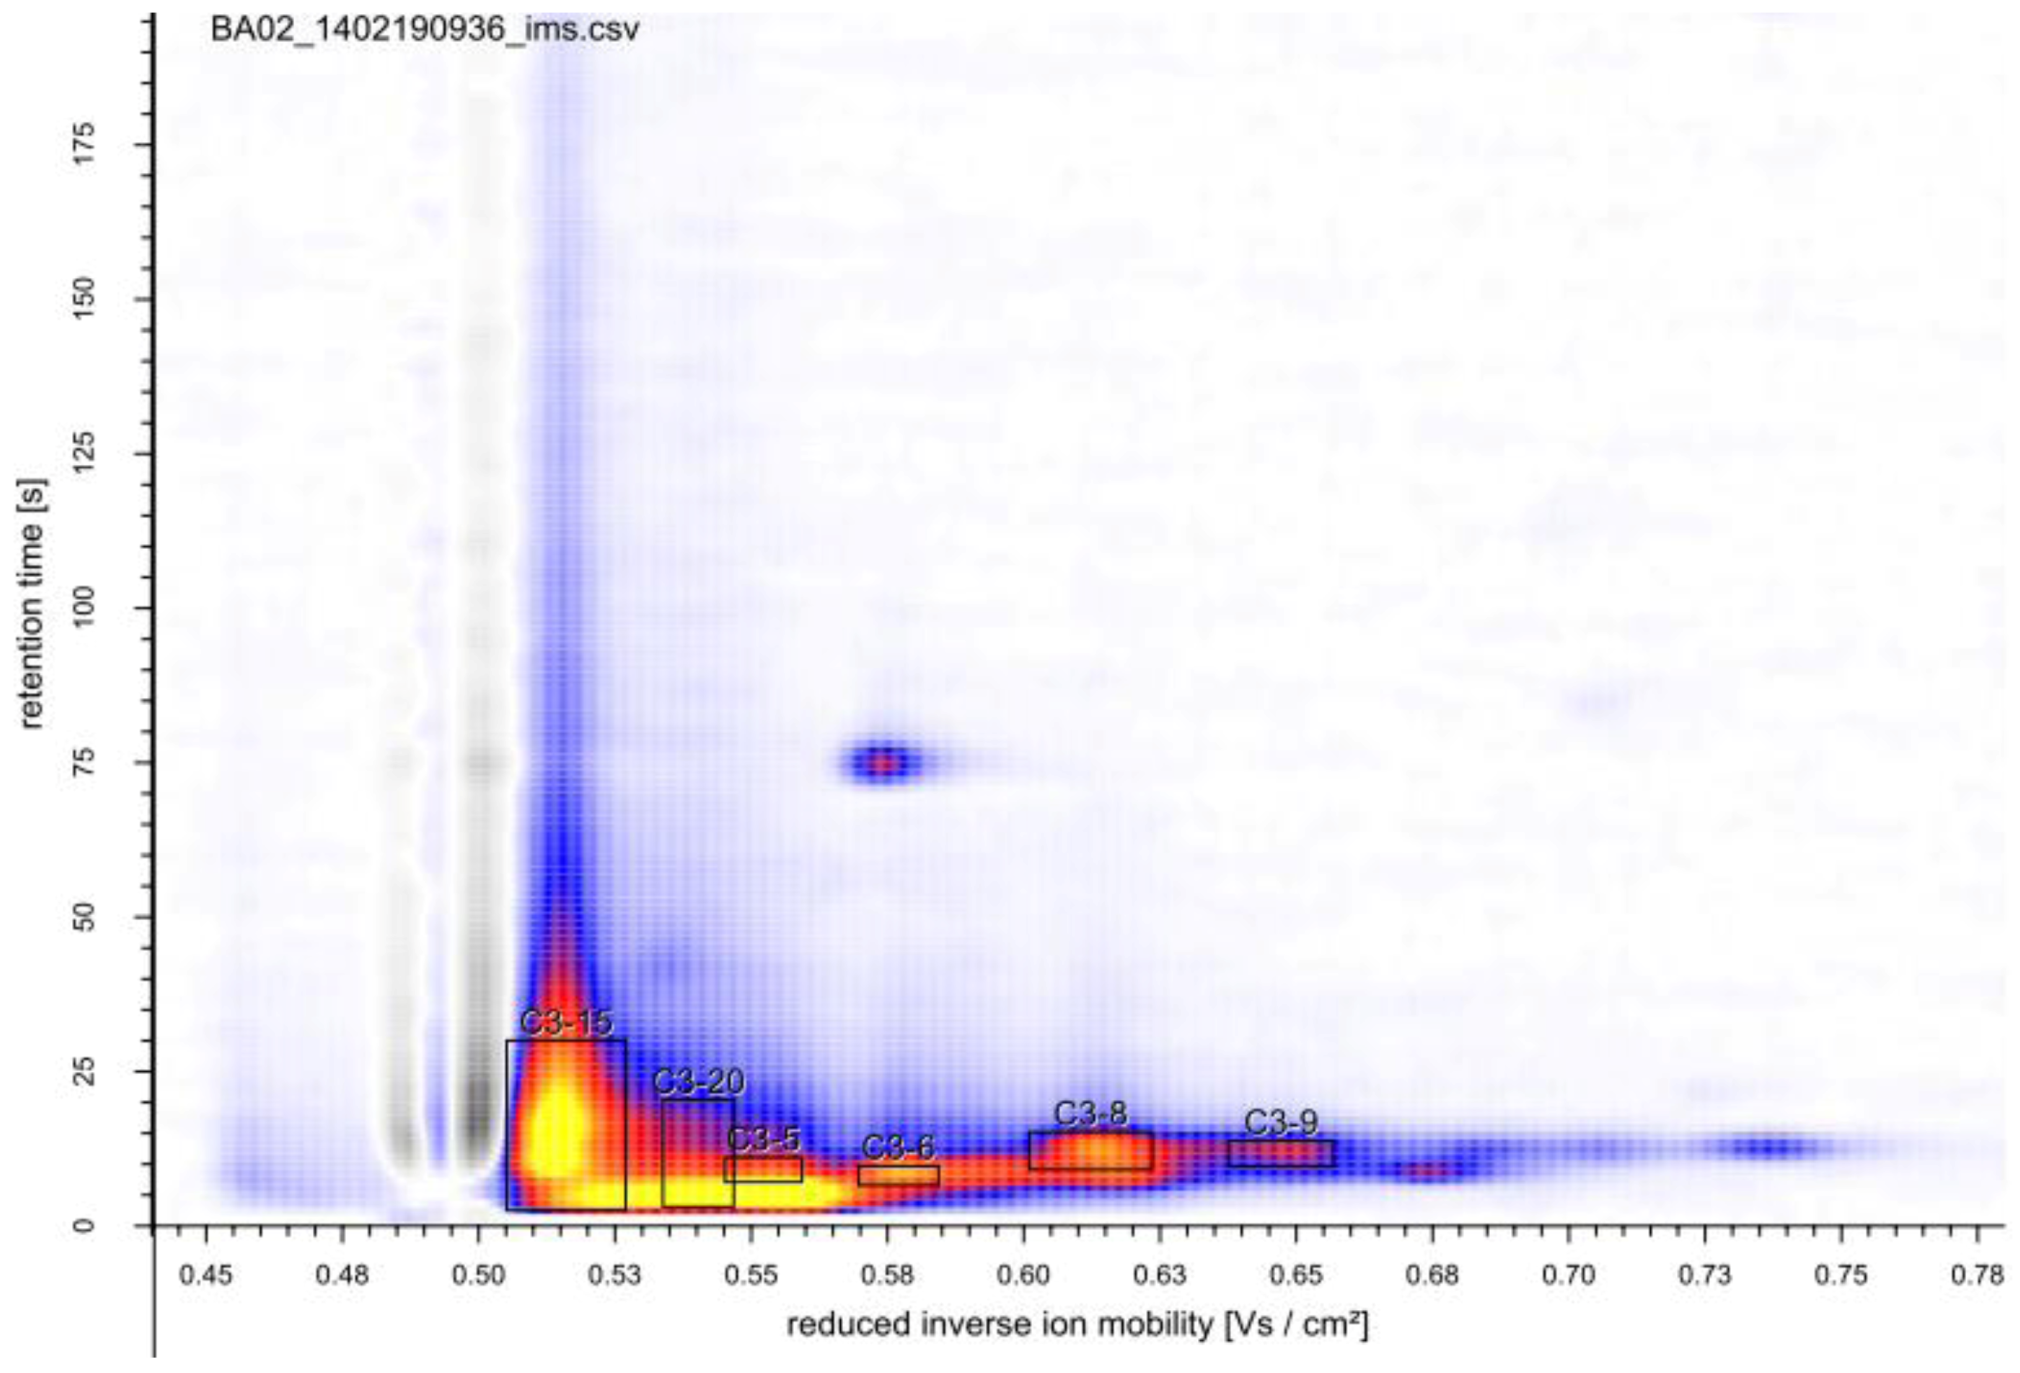
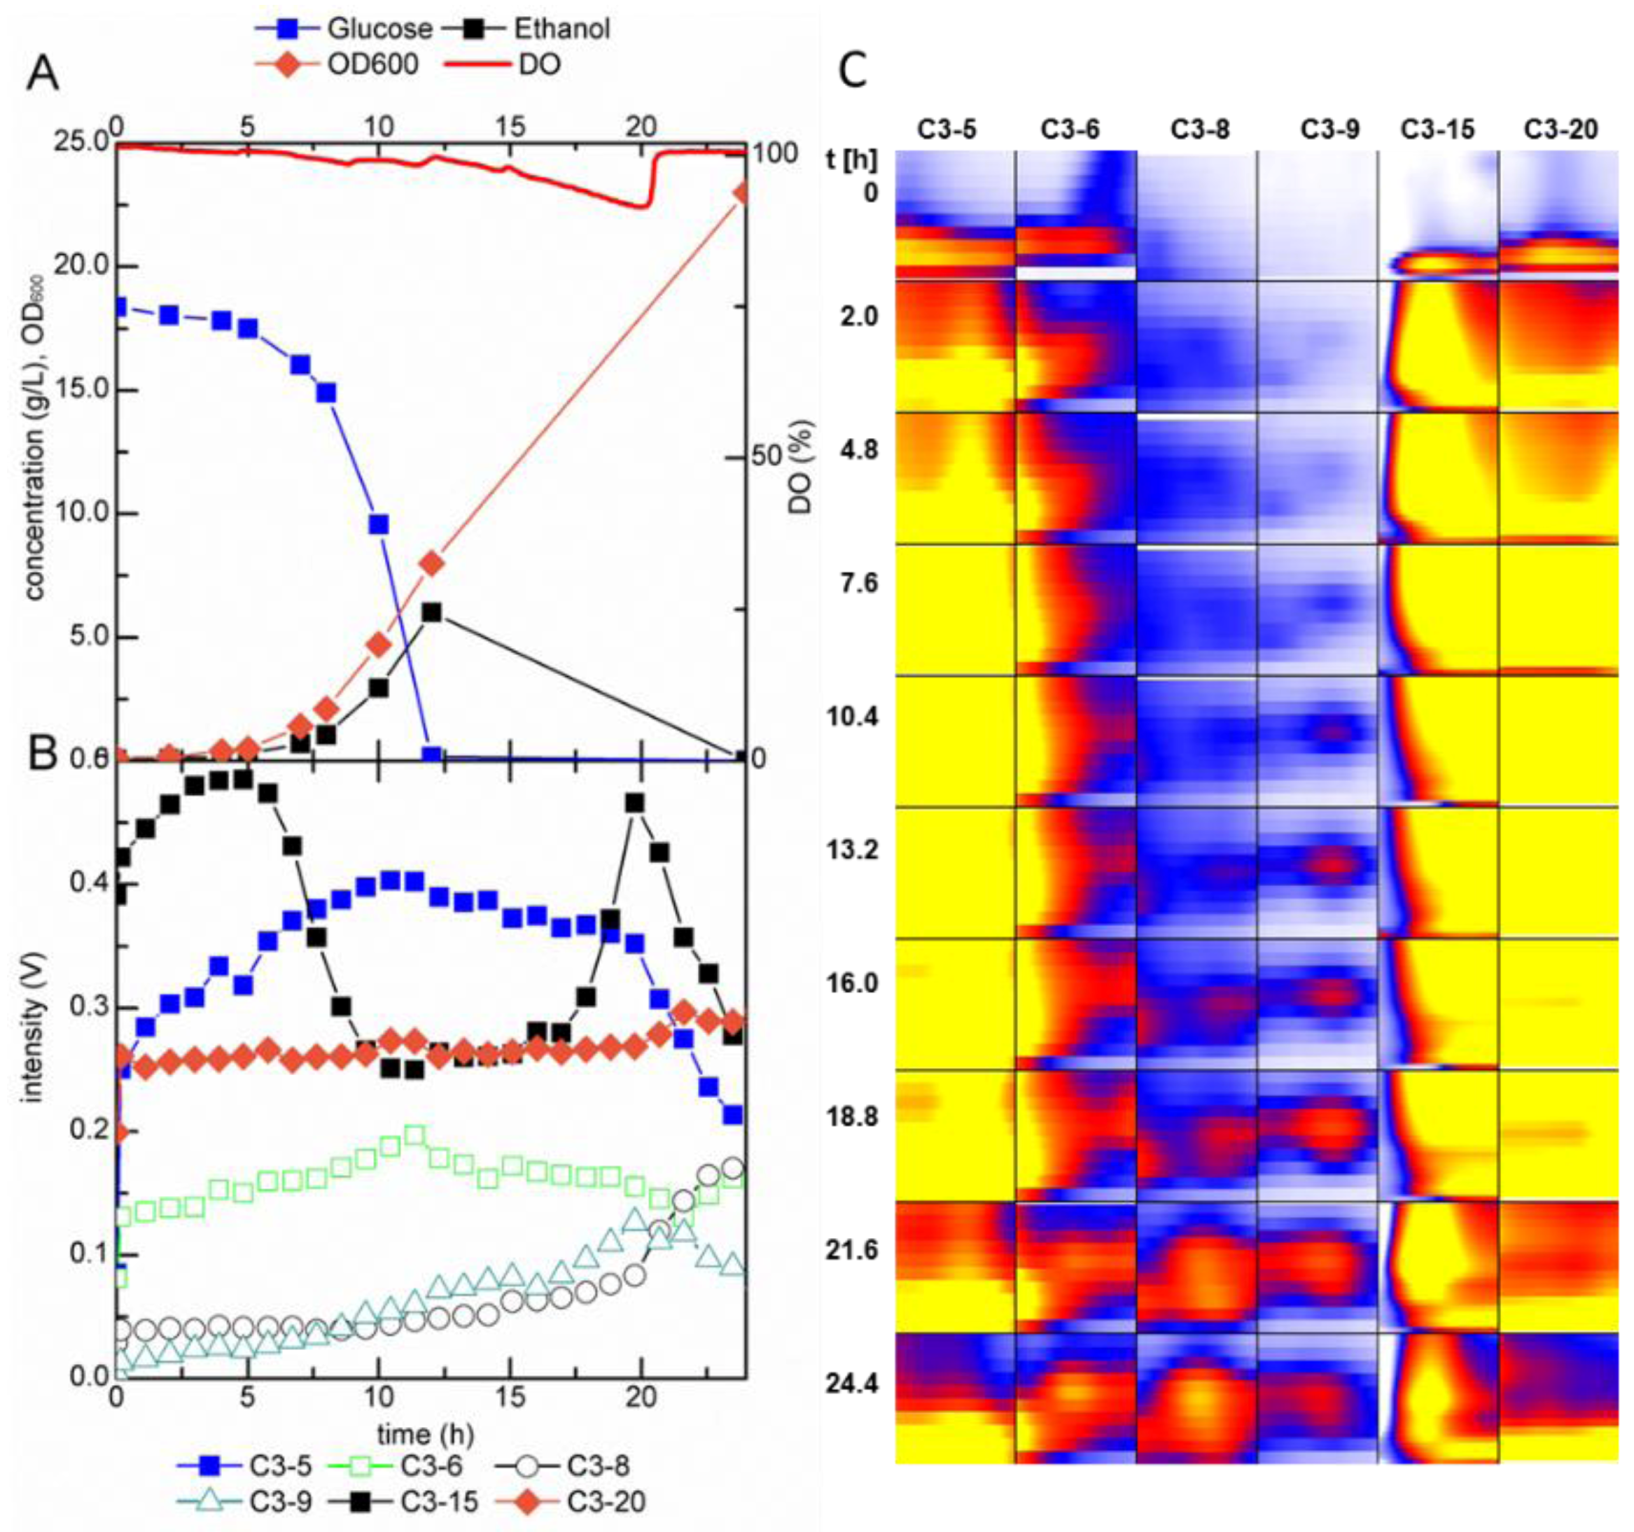
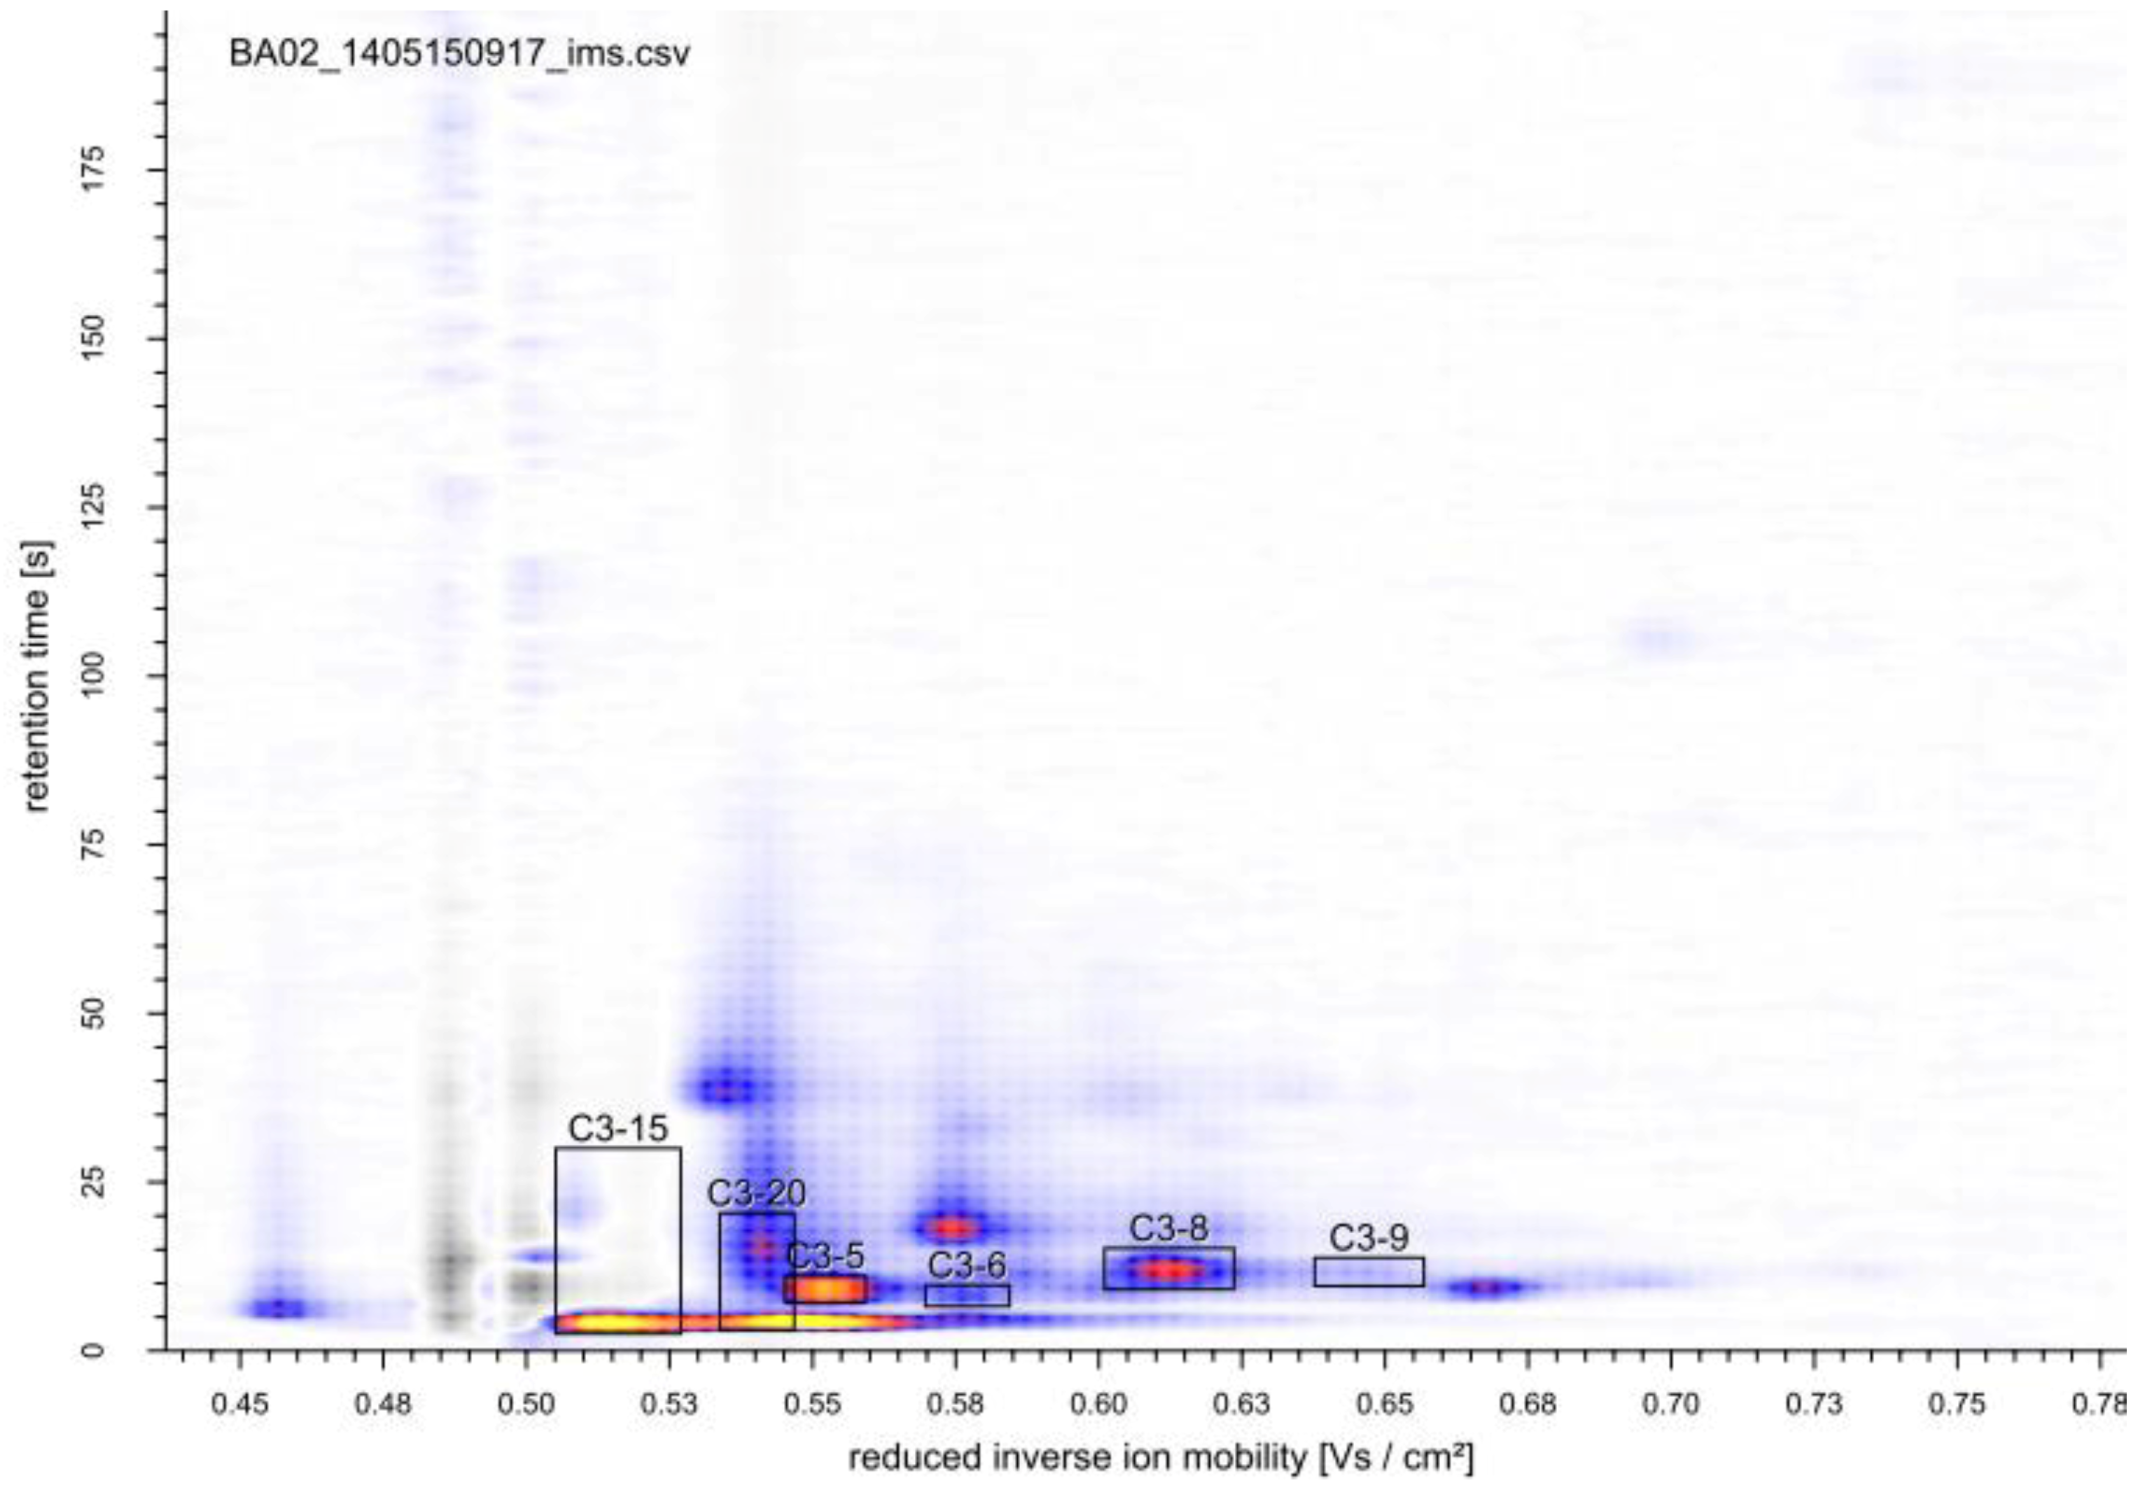
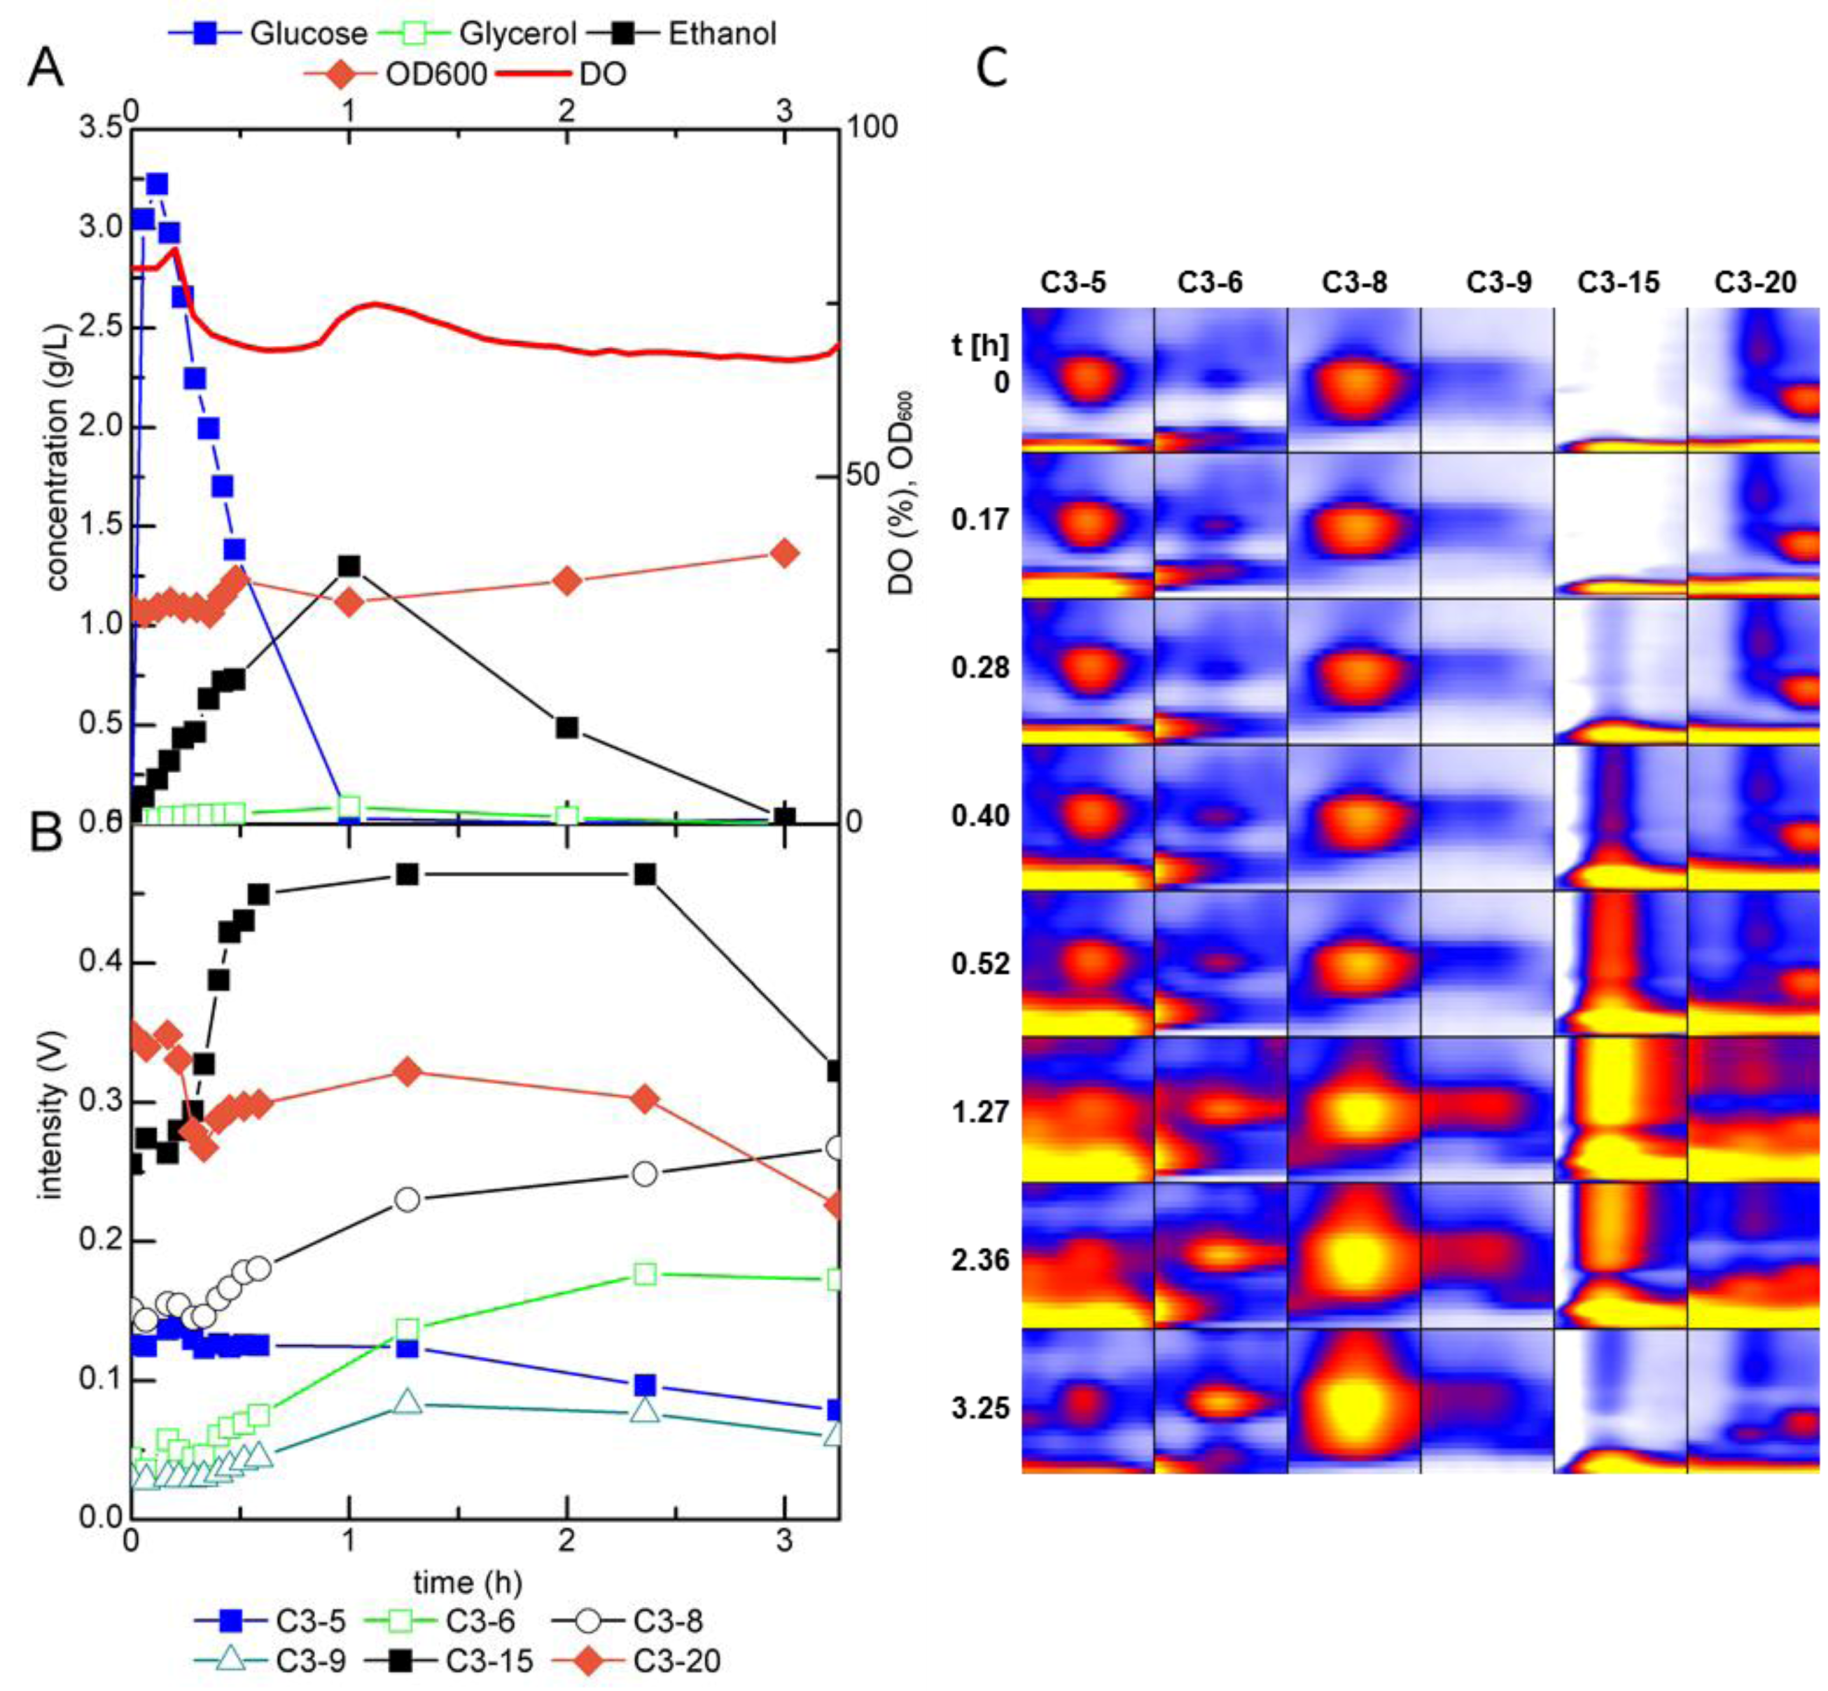
2.2.1. MCC-IMS Monitoring of Batch Cultures

So far, most studies of yeast VOCs focused on the determination of volatiles produced during wine fermentation and their impact on wine aroma. These studies did not discriminate whether the VOCs originated from yeast fermentation or were the product of biotransformations of the grape constituents [23,24,25,26]. Here, to explore the mVOCs de novo synthesized by baker’s yeast, minimal salt medium with glucose as the sole carbon source was used. For a first evaluation of the MCC-IMS set-up for real-time fermentation monitoring, S. cerevisiae was grown in batch culture. Before inoculation of the fermenter, signals occurring from the sterile medium were measured under process conditions (stirrer speed, temperature and pH control, aeration). During a period of 12 h, the MCC-IMS measurements (Figure 2) showed four major signals of invariant intensity (data not shown).
Figure 2. MCC-IMS topographic plot of sterile Verduyn medium. The reaction ion peak (1/K0 = 0.5 Vs cm−2) was compensated by the VisualNow software.
Metabolites 04 00751 g002
After inoculation to a starting OD600 of 0.1, MCC-IMS analyses were performed throughout the growth experiment in one hour intervals. In addition to the analytes detected in the sterile medium, 19 peaks emerged during the batch growth experiment, at retention times between 1 and 190 s (Figure 3). The time course of the six most distinctive peaks is shown in Figure 4B,C. To correlate the MCC-IMS patterns of the volatile metabolites to the yeast physiology, in parallel to the MCC-IMS measurements the optical cell density, carbon source consumption, and byproduct formation (ethanol, glycerol) were quantified (Figure 4A).
Figure 3. MCC-IMS topographic plot of S. cerevisiae in early stationary phase during batch fermentation. Boxes indicate analytes with the most significant changes during the growth (perturbation) experiments.
Metabolites 04 00751 g003
In the single fermentation experiment, the profile of signal C3-5 correlated with the growth rate since its signal increased after the lag phase and reached its maximum during the exponential growth phase. In the stationary phase, the peak intensity of C3-5 decreased again. Peak C3-9 was detected at the same time as ethanol, measured in the fermentation broth, and its signal diminished simultaneously with ethanol consumption. The signal of C3-8 showed an increasing trend in the late exponential to early stationary phase, when ethanol was nearly consumed. Signal C3-15 showed a rather peculiar profile. The signal intensity first increased, but rapidly decreased after 5 h and maintained a constant level for about 11 h. After this period, the intensity of C3-15 abruptly increased and reached its prior maximal value followed by a steady decrease at the end of the batch. This behavior might be explained by incomplete ionization of the analyte molecules. The signal of the two signals decreased when the peak of signal C3-5 increased. This signal might have a higher proton affinity and therefore be preferably ionized to substance C3-15. This hypothesis is substantiated by the low reaction ion peak (RIP) in the MCC-IMS chromatograms for the period between 5 h–21 h (data not shown). The RIP consists of reaction ion molecules originating from the drift gas, here nitrogen. In the ionization chamber, water molecules react with positively charged nitrogen ions to a cluster of the type (H2O)nH+. These ions form the RIP and transfer the charge to molecules with a higher proton affinity. Hence, with increasing analyte concentration the RIP diminishes. For more detailed information about the charge transfer reactions, the reader is referred to [51]. Note that the data presented here originate from single experiments and are thus not based on statistics. The intention of this work was the development of a set-up for online MCC-IMS measurements of volatile metabolites in the off-gas of yeast fermentations, with which we will generate more comprehensive datasets in future experiments.
Figure 4. (A) Fermentation profile of S. cerevisiae during batch growth in glucose minimal medium, (B) trends in intensity, (C) heat map of selected peaks detected by MCC-IMS analysis of the fermentation off-gas. Areas in the heat map show the detected analyte peak and the surrounding area; DO = dissolved oxygen.
Metabolites 04 00751 g004
To elucidate the potential of MCC-IMS analyses for the differentiation of different S. cerevisiae strains or mutants we compared the MCC-IMS chromatograms of S. cerevisiae CEN.PK 117 YOL086c::kanMX4, deficient in the major alcohol dehydrogenase Adh1p, with its isogenic reference strain. Again, we want to stress that in this proof-of-principle work, only single experiments were performed to show the general applicability of MCC-IMS for online measurements of fermentation off-gas.
The ADH1 deletion mutant had a reduced growth rate and biomass yield, about 56% and 42% of the reference values. The ethanol formation was clearly reduced (maximal accumulation of 0.8 g L−1 vs. 6 g L−1 for the reference strain) while glycerol production was increased (Figure 5A). These differences in the strain physiology were also reflected in the MCC-IMS pattern (Figure 5B,C). While no new peaks compared to the reference strain chromatograms were detected, the profiles of several peaks differed. Peak C3-15 increased much slower compared to the reference strain fermentation. The signal of C3-5 rose in the beginning, stagnated within the 5th–20th h after inoculation and increased afterwards. While the absolute intensity of peak C3-6 was lower in the measurements of the mutant strain compared to the reference strain, the time profile was similar for both cultivations., The profile of peak C3-20 was similar to that in the reference strain cultivation but showed a more shallow increase at the start of the fermentation while the intensity of C3-8 rose faster. Although replicate experiments are required for a statistically valid statement, we hypothesize that these distinct mVOC derived MCC-IMS signals allow differentiation of the two yeast strains. Similarly, species specific volatile footprints or markers have are already used to detect cancer via breath analysis of patients [52] or fungal contaminants in buildings [53].
Figure 5. (A) Fermentation profile of S. cerevisiae adh1Δ during batch growth in glucose minimal medium and (B) trends in intensity and (C) heat map of selected peaks detected by MCC-IMS analysis of the fermentation off-gas. The areas in the heat map show the detected analyte peak and the surrounding area; DO = dissolved oxygen.
Metabolites 04 00751 g005
These measurements gave first valuable information about the volatile metabolite patterns produced by yeast and their dynamics during growth on glucose minimal medium. However, because of the high signal of volatiles, most likely ethanol and acetaldehyde, in the off-gas and probable incomplete ionization of metabolites, data interpretation and thorough metabolite detection under these conditions was limited.

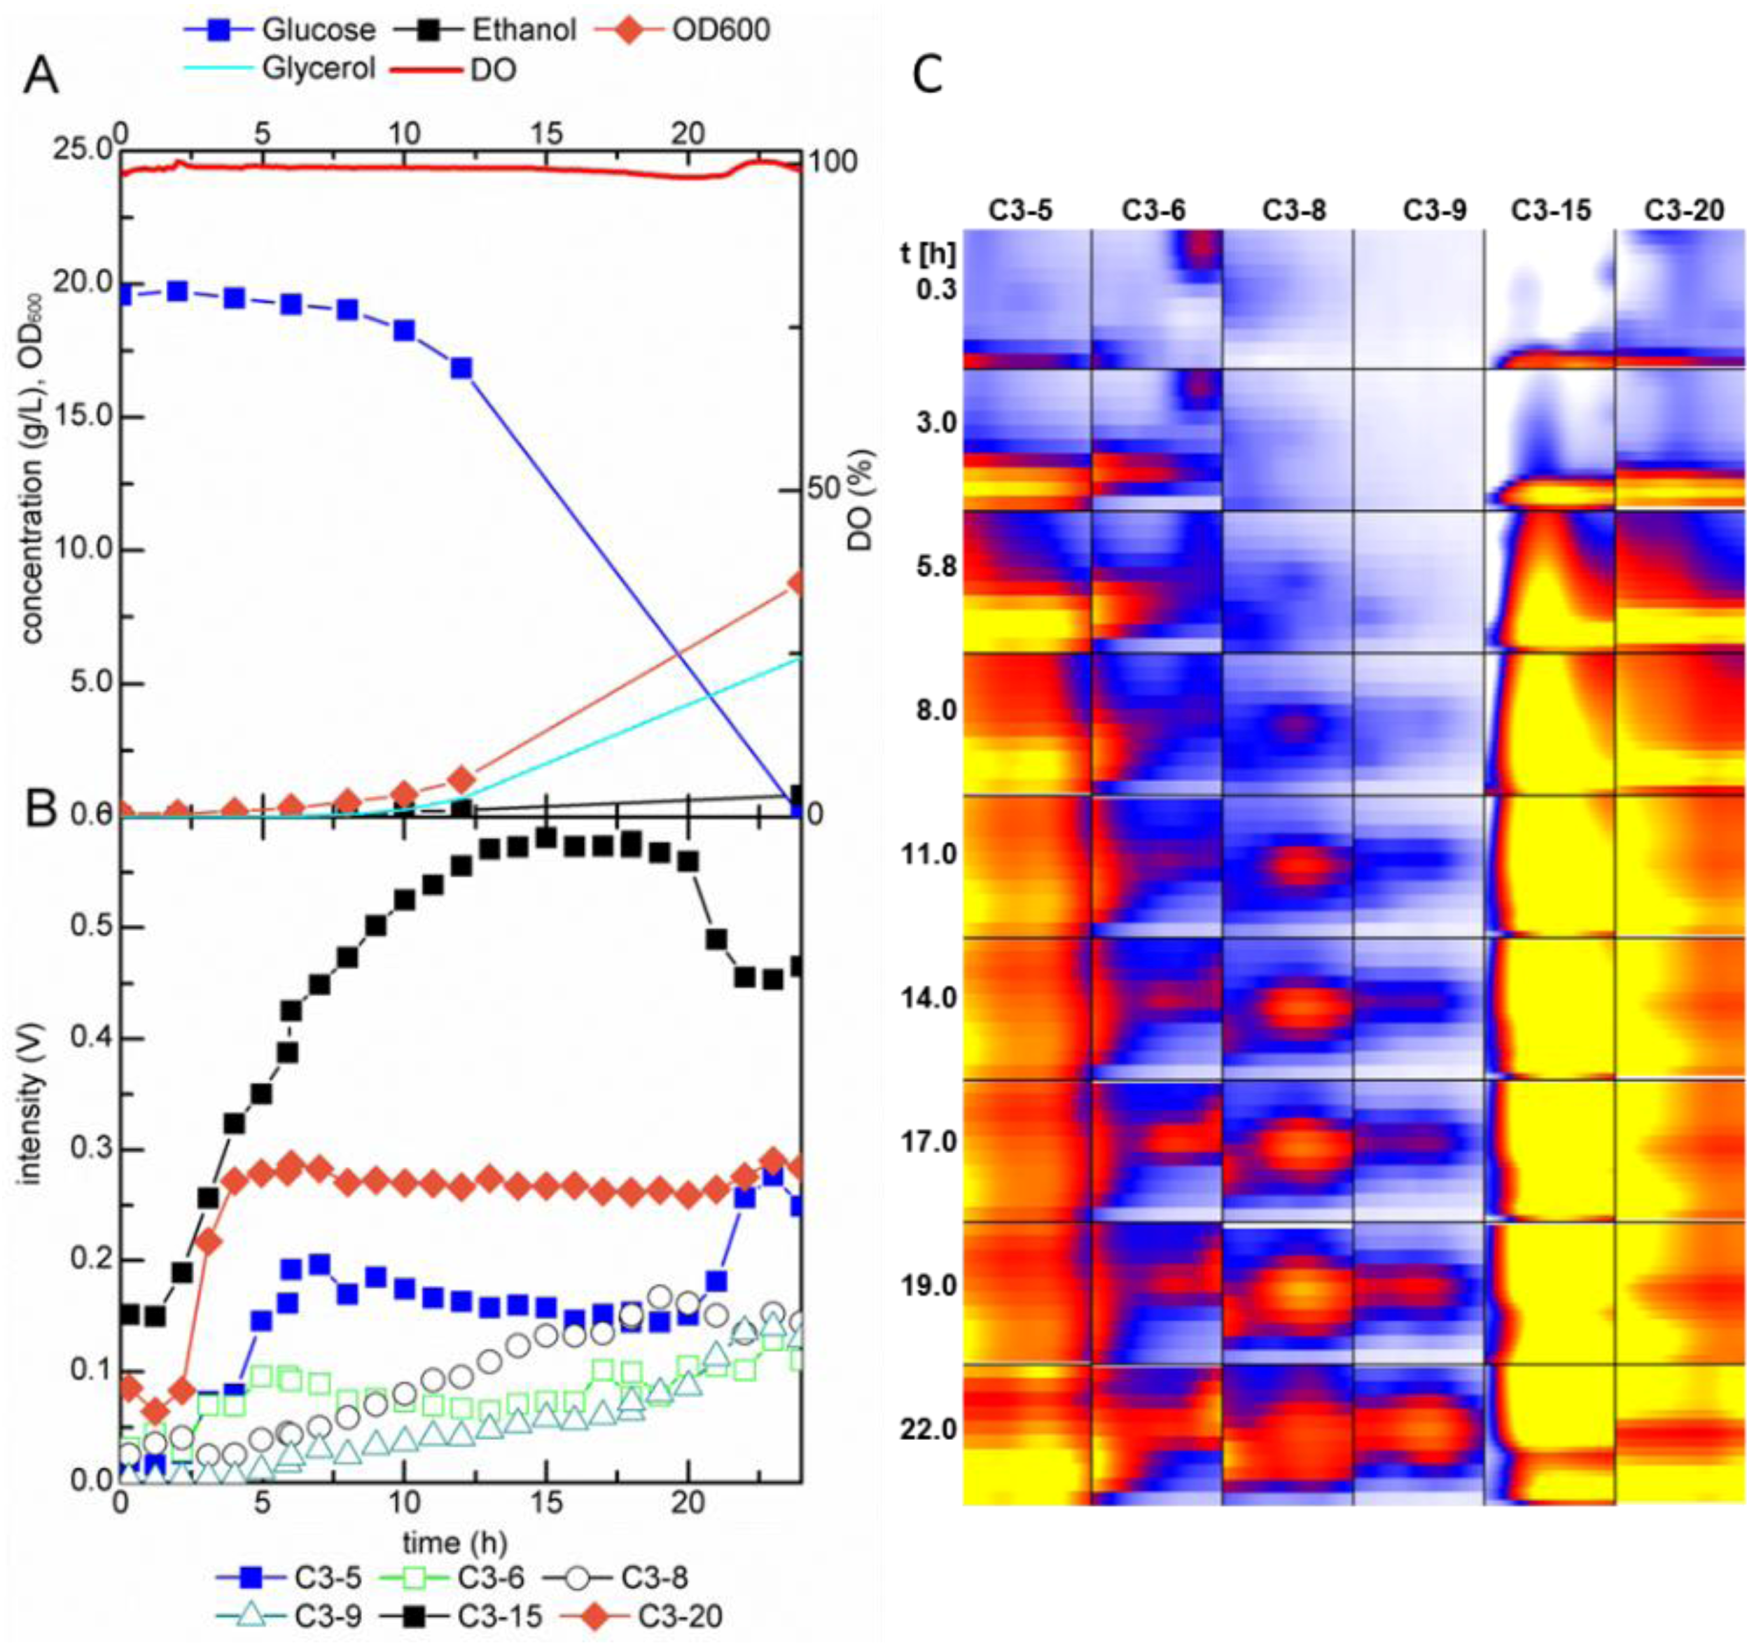
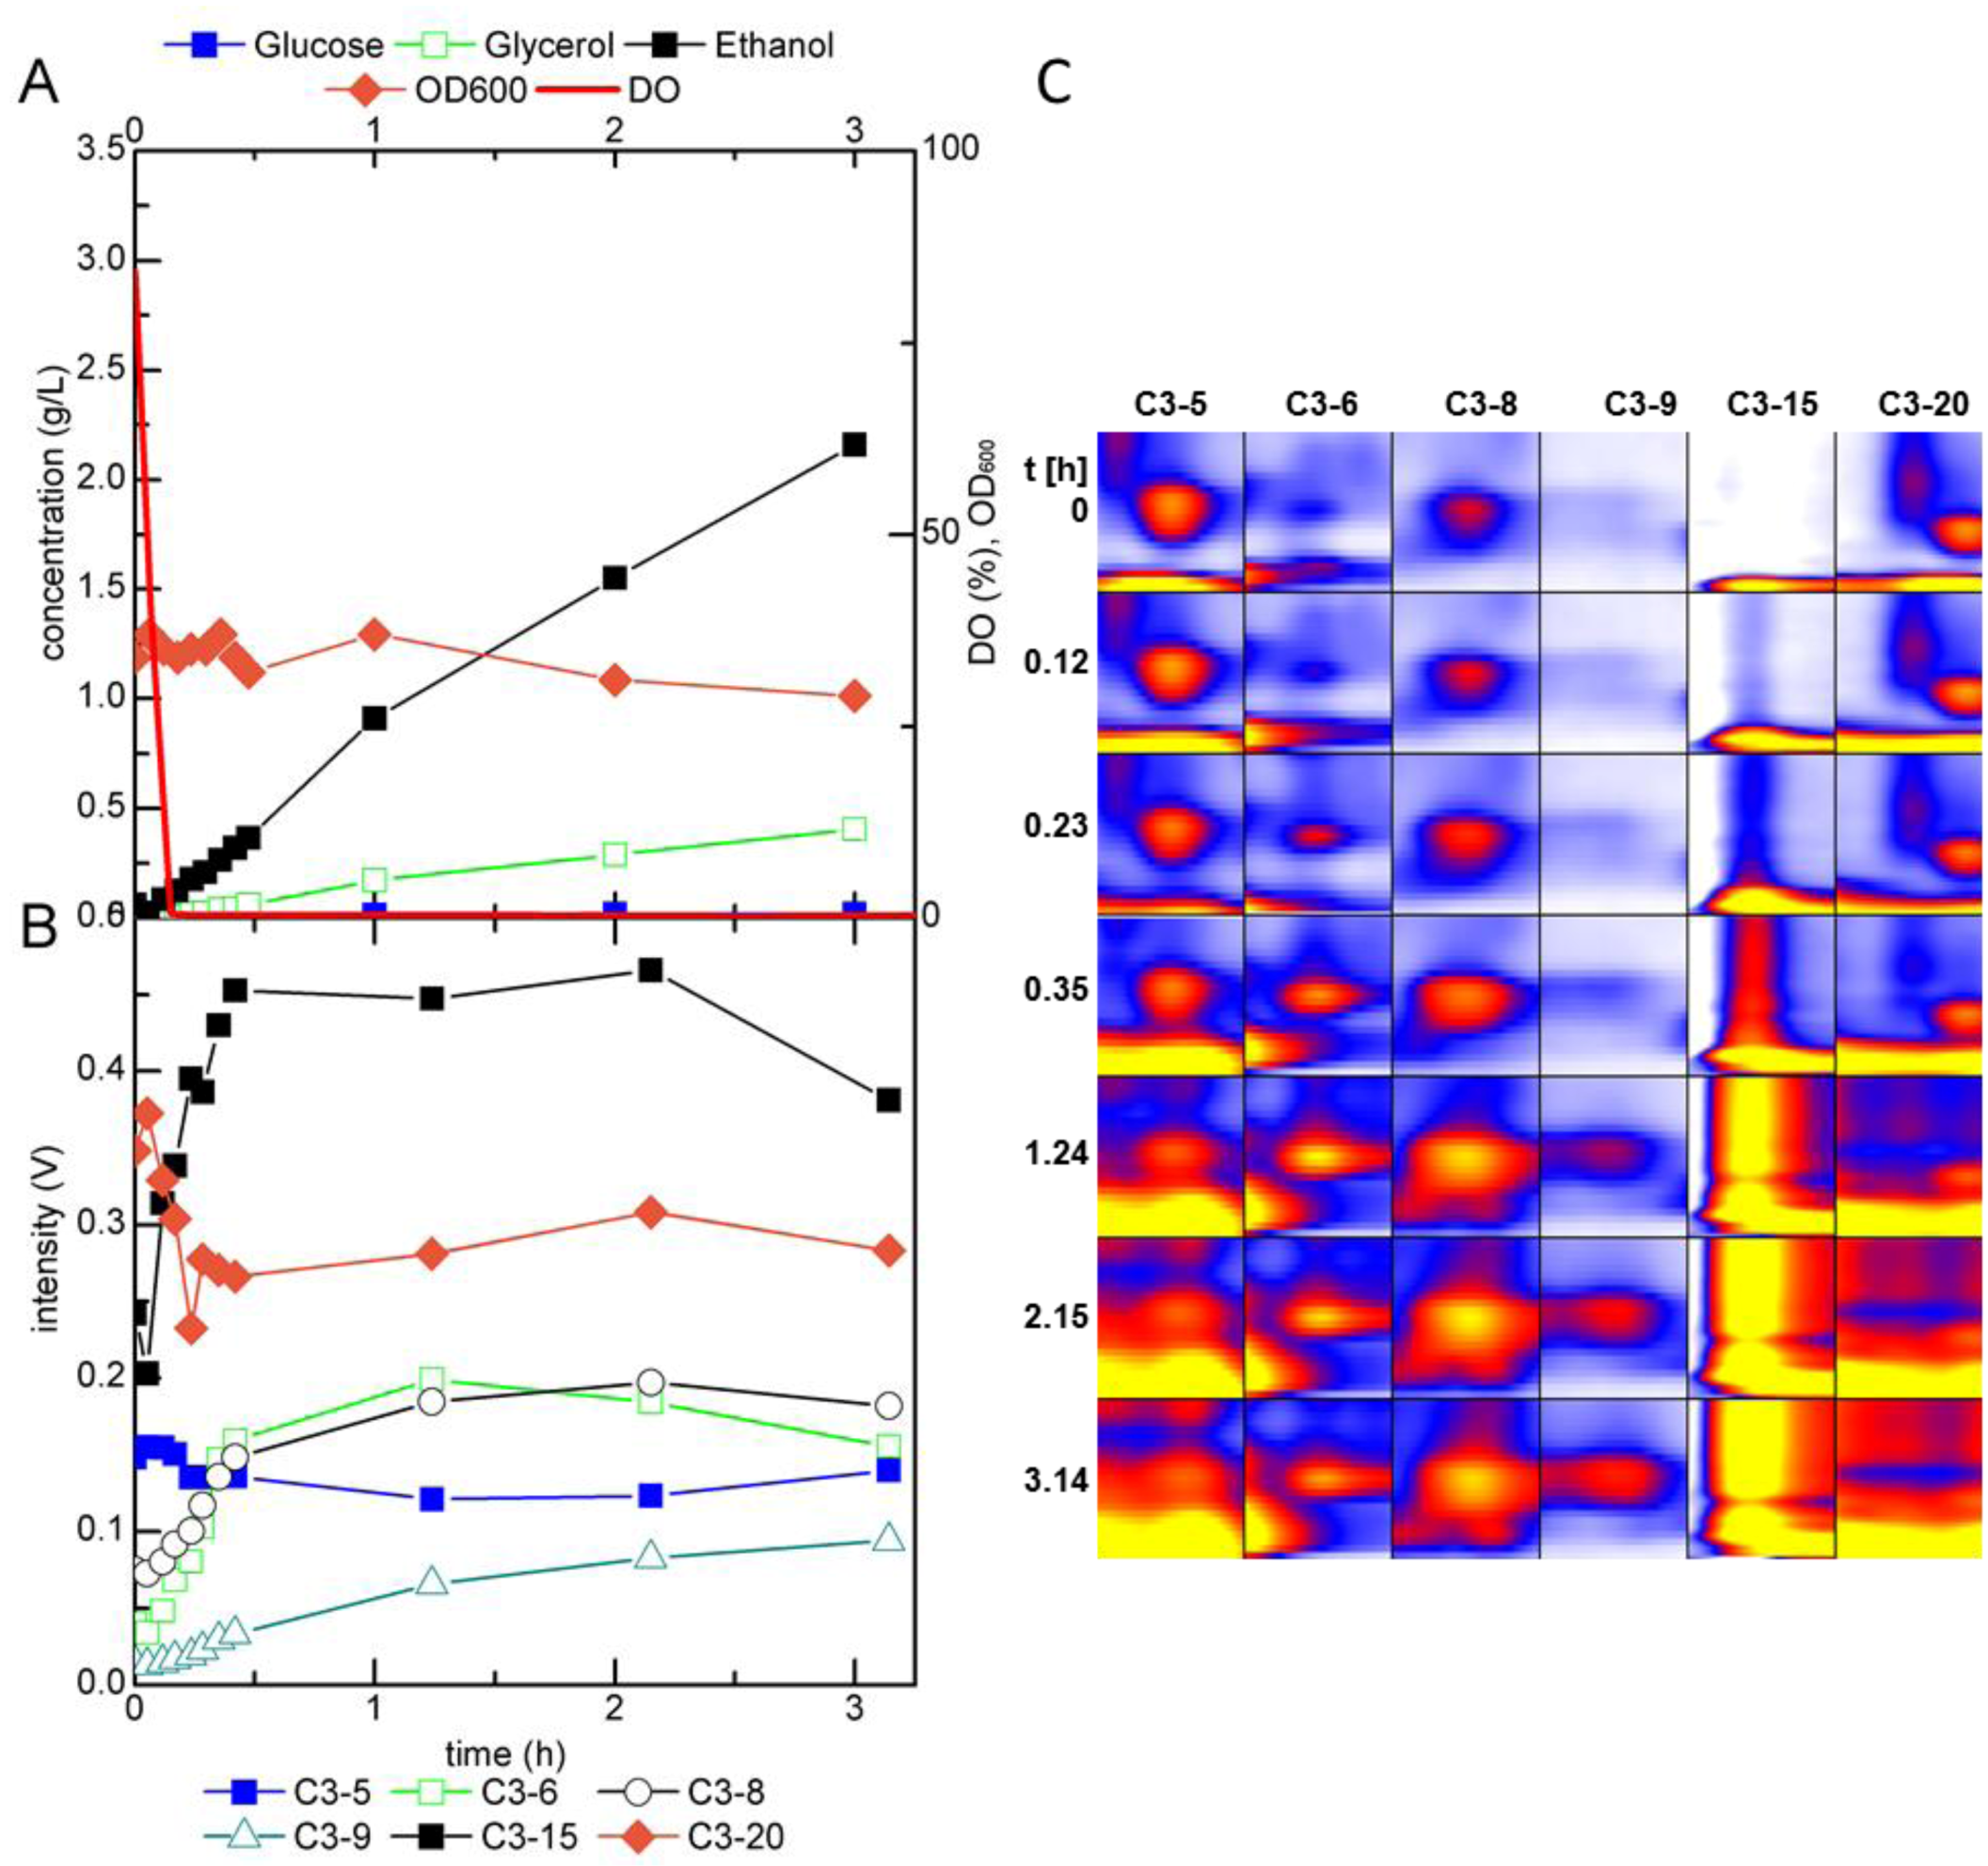
2.2.2. MCC-IMS Monitoring of Glucose-Limited Chemostat Fermentations

High glucose concentrations as in batch fermentations trigger glucose repression. One consequence is the induction of respiro-fermentative metabolism that is aerobic ethanol formation, known as Crabtree effect [54,55]. This switch of the metabolic mode is undesirable for example during production of yeast biomass or protein production, as ethanol formation reduces product yield and quality [56,57,58,59]. Such processes are therefore run as glucose-limited fermentations, in which this regulatory mechanism is repressed. While industrial processes are most often run as fed-batch fermentations, in academic research glucose-limited chemostats are favored as these continuous cultivations can be performed under defined, controlled, and constant conditions allowing very reproducible experiments. Moreover, this fermentation mode allows varying one single fermentation parameter, making it ideal for studying the impact of specific perturbations on growth physiology or metabolism. To elucidate possible changes in the volatile metabolites during the transition from respiratory to fermentative metabolism, we cultivated S. cerevisiae in a glucose-limited chemostat at a dilution rate of 0.13 h−1. Under these fully oxidative growth conditions, S. cerevisiae produced no ethanol. At metabolic steady state of the single experiment, the MCC-IMS chromatogram showed 13 peaks, which were not detected in the sterile medium, while two peaks observed in the sterile medium were not or with considerably less intensity detected in the chemostat culture (Figure 6). Because of the overloaded chromatogram during batch cultivation, it is difficult to state, which of these are specific for the glucose-limited respiratory growth conditions and which appear generally during growth of S. cerevisiae. The most distinct peaks were identical for both growth conditions.
To induce a shift from respiratory to fermentative metabolism, the steady state culture was perturbed once with a pulse of 22 mmol glucose, which was rapidly injected into the bioreactor. Immediately after the glucose pulse, ethanol accumulated in the fermentation broth (Figure 7A). Acetate (data not shown) and glycerol were detected as well and showed a similar profile as ethanol. The surplus glucose was consumed within 75 min, after which ethanol was catabolized and diminished about 3 h after the pulse. The optical density (OD600) increased from 31–39. The intensity of several analytes detected with the MCC-IMS increased after the pulse and decreased again after about 2 h (Figure 7B,C). The most prominent changes were observed for the analytes marked in Figure 6, these are the same peaks as in the batch cultivation of the wild type yeast and the ADH1 mutant. Peak C3-15 showed a strong correlation with the ethanol concentration determined in the fermentation broth. However, other peaks, like C3-6 and C3-8, did not resume the intensities prior to the perturbation, but maintained a higher level within the 7 h of MCC-IMS monitoring, hence, correlated with the increase in biomass concentration. C3-5 was the only peak whose intensity decreased upon glucose addition. About 3 h after the glucose pulse, its intensity increased again and regained its original value in the next 3 h. C3-20 showed a rapid decrease directly after the pulse, remained at a constant level and showed a decreasing trend after about 2 h and 30 min.
Figure 6. MCC-IMS topographic plot of the off-gas of a glucose-limited continuous cultivation of S. cerevisiae. Boxes indicate analytes with the most significant changes during the growth (perturbation) experiments. The reaction ion peak (1/K0 = 0.5 Vs cm−2) was compensated by the VisualNow software.
Metabolites 04 00751 g006
Figure 7. (A) Fermentation profile of S. cerevisiae during growth in a glucose-limited chemostat and (B) trends in intensity and (C) heat map of selected peaks detected by MCC-IMS measurements of the fermentation off-gas after perturbation of the metabolic steady state with a pulse of 22 mmol glucose; DO = dissolved oxygen.
Metabolites 04 00751 g007
The physiological response of S. cerevisiae to limited oxygen availability is very similar to that of the Crabtree effect. In both cases, the fluxes through glycolysis are upregulated while the fluxes through the TCA are downregulated and as a consequence ethanol is produced [60,61]. To elucidate possible differences in the volatile metabolite patterns of yeast cultures responding to a glucose pulse and anaerobiosis, respectively, in a second perturbation experiment gassing was switched from air to nitrogen. In this single perturbation experiment, the dissolved oxygen (DO) concentration dropped to zero within 10 min. Simultaneously with this drop, ethanol and glycerol accumulated in the fermentation broth, while only little acetate, which accumulated only after 1 h of anaerobic growth (Figure 8A). The biomass concentration decreased slowly during anaerobiosis. Note, that the data of this perturbation experiment cannot be directly compared to the glucose pulse as the air supply was permanently replaced by the same flow rate of nitrogen.
Figure 8. (A) Fermentation profile of S. cerevisiae during growth in a glucose-limited chemostat and (B) trends in intensity and (C) heat map of selected peaks detected by MCC-IMS measurements of the fermentation off-gas during transition to anaerobic conditions; DO = dissolved oxygen.
Metabolites 04 00751 g008
As in the glucose pulse perturbation experiment, peak C3-15 increased as soon as ethanol was produced (Figure 8B,C). The increase flattened after about 60 min and decreased after about 2 h Again incomplete ionization and possible incomplete evaluation of the peak area might be responsible for this trend. The intensities of peak C3-6 and C3-8 increased rapidly in the first 30 min after the shift to nitrogen gassing, considerably faster than in the glucose pulse experiment. C3-9 showed a slight increase while peak C3-5 stayed constant over the period of 3 h. Peak C3-20 showed a similar trend as in the glucose pulse perturbation, that is, a rapid decrease after the shift to nitrogen gassing followed by a steady intensity during the 3 h of monitoring. The dynamics of the MCC-IMS signals were very similar to that observed during the imposed Crabtree effect and no new peaks were detected. However, S. cerevisiae responded faster to anaerobic than to glucose excess conditions. Changes in the peak intensities of, for example, C3-15 were already observed 7 min after the shift to nitrogen gassing, i.e., before complete anaerobiosis, while the first changes in the MCC-IMS peak intensities after the rapid glucose pulse were observed only after 17 min.
In both perturbation experiments, samples were measured in intervals of 215 s over a period of about 30 min. These rapid measurements show the potential of MCC-IMS analysis for online monitoring and control of bioprocesses.

2.3. Identification of Volatile Metabolites

A disadvantage of MCC-IMS is its poor ability for analyte identification. To get first hints of the mVOC spectrum in the off-gas, we performed HS/SPME GC-MS analyses. Volatile metabolites were extracted from 10 mL the headspace of culture supernatant by solid phase microextraction. Peaks detected in the GC-MS analyses were identified by comparing retention indices and spectra with data from the NIST library (Version 2.0) and the FlavorNet database [32]. Although this identification procedure often results in ambiguous results, it narrowed down the standard measurements conducted with the MCC-IMS for peak identification.
GC-MS samples were taken from the glucose-limited chemostat cultivation of S. cerevisiae CEN.PK during steady state conditions, after perturbation of the continuous cultivation by the glucose pulse and shift to anaerobic conditions (15 min and 50 min after pulse injection and shift to anaerobic conditions, respectively), and of the batch cultivation of the isogenic ADH1 knock-out mutant during exponential growth and stationary phase. Several peaks in the GC-MS analyses were found in all samples, while some peaks were specific for the different growth conditions or strain used. In total, metabolites could be assigned to 10 peaks by database searches (Table 2). Compounds found in the samples of all culture conditions and if the S. cerevisiae adh1∆ mutant were ethanol (in different amounts), 2-pentanone, 2-phenylethanol, 2,3-hexanedione, butyric acid, and isobutyric acid. Benzaldehyde was found in all samples except those from anaerobic cultures. Acetoin and 2,3-butanediol were only detected in the samples of the S. cerevisiae adh1∆ strain. Acetoin is an intermediate of the pathway to 2,3-butanediol and can be derived from pyruvate and acetaldehyde via three different pathways [62,63,64,65,66,67]. With the reduced flux of acetaldehyde to ethanol in this mutant, conversion of acetaldehyde to acetoin and further to 2,3-butanediol might be induced as has already been reported for a ADH1, ADH3 and ADH5 triple knockout mutant of S. cerevisiae BY4742 [68]. By contrast, isovaleric acid was detected in all samples expect in those from the ADH1 knock-out mutant. Besides the 10 metabolites identified in the GC-MS analyses, standards of 1-butanol and acetaldehyde were measured by MCC-IMS. mVOCs were assigned to unknown peaks MCC-IMS signals by comparing the retention time and reduced inverse ion mobility to data of the pure standard substance measurements. As already assumed from the correlation with the ethanol concentration in the fermentation broth, peak C3-15 was identified as ethanol. Of the Ehrlich pathway compounds found in the GC-MS analyses, isobutyric acid, isovaleric acid, and 2-phenylethanol were measured via MCC-IMS. The Ehrlich pathway is a catabolic pathway, which degrades amino acid into aroma compounds such as higher alcohols or volatile fatty acids [35]. The fusel acids (and corresponding alcohols) isobutyric acid, isovaleric acid, and 2-methylbutanoic acid are, for example, derived from the branched chain amino acids valine, leucine, and isoleucine, respectively, by the activity of aldehyde dehydrogenases, encoded by ALD2 to ALD6 [38]. Only isobutyric acid could be assigned to one of the peaks (C3-8) detected in the off-gas analyses of yeast fermentations. Unambiguous identification of 2-phenylethanol was not possible due to overlapping peak regions, which is due to co-elution and similar drift times, with 2,3-butanediol.
The pure standard MCC-IMS measurements identified peak C3-5 as 2-pentanone. In Penicillium roqueforti, 2-pentanone is derived from β-oxidation of fatty acids and might be synthesized in S. cerevisiae via the same pathway [69]. However, although 2-pentanone has been found in several S. cerevisiae fermentations [29,36], a biochemical confirmation of the synthesis via β-oxidation is so far not described. Peak C3-7 (not shown in Figure 2 and Figure 5) was identified as 2,3-hexanedione, which is reported as a metabolite of brewer’s yeast with a cheesy aroma [70] and has recently been detected in the headspace of agar plates cultures of Corynebacterium glutamicum [71]. To the best of our knowledge no biosynthetic pathway for this compound has been reported for S. cerevisiae.
Table 2. Volatile organic compounds detected in fermentations of S. cerevisiae growing in glucose minimal salt medium. ND, not detected.
CompoundGC-MSMCC-IMSpeakreduced inverse ion mobility 1/K0 (Vs cm−2)MCC-IMS retention time (s)GC-MS retention time (min)
2,3-butanediolxx 0.5754.526.517
2,3-hexanedionexxC3-70.57019.49.633
2-pentanonexxC3-50.5546.45.029
acetoinxx 0.5328.516.932
benzaldehydexx 0.56637.525.366
butyric acidxx 0.63024.430.127
ethanolxxC3-150.5164.04.193
isobutyric acidxxC3-80.61810.427.827
isovaleric acidxND 31.594
2-phenylethanolxx 0.5784.539.670
The low recovery rate of metabolites identified by GC-MS might partially be explained by the different sampling procedures. While for the MCC-IMS measurements 10 mL of the off-gas were directly measured, for the GC-MS volatiles were extracted from the culture broth at 50 °C and were preconcentrated. Furthermore, GC-MS peaks were only tentatively identified by comparison with databases and require validation by pure standard analyte measurements. To broaden the spectrum of analyte detection in the MCC-IMS, measurements with both negative and positive ion mode are useful. Our future experiments will focus on the identification of unknown MCC-IMS signals, including thorough verification by GC-MS measurements of pure standard substances. Ideally, feeding experiments with labelled precursors should be performed to conclusively prove whether the identified compounds are actually produced by S. cerevisiae.

3. Experimental Section

3.1. Yeast Strains and Growth Conditions

The yeast strains used in this study were the reference strain S. cerevisiae CEN.PK 113-7D [72] and the isogenic ADH1 knockout mutant S. cerevisiae CEN.PK 117 YOL086c::kanMX4 [73] devoid of the main alcohol dehydrogenase Adh1p. The yeast strains were grown in Verduyn minimal salt medium [74] containing 20 g L−1 glucose, 3 g L−1 KH2PO4, 0.5 g L−1 MgSO4·7 H2O 20.4 g L−1 potassium hydrogen phthalate as well as 1 mL of vitamin solution and 1 mL of trace elements. The nitrogen source (NH4)2SO4 was replaced by 2 g L−1 urea, as at higher concentrations of ammonia, the water chemistry of the IMS ionisation process could shift to ammonia chemistry [75]. The vitamin solution contained 0.05 g L−1 D-biotin, 1 g L−1 calcium D-pantothenate, 1 g L‑1 nicotinic acid, 25 g L−1 myo-inositol, 1 g L−1 thiamine hydrochloride, 1 g L−1 pyridoxine hydrochloride and 0.2 g L−1 p-aminobenzoic acid. The trace element solution consisted of 15 g L−1 EDTA, 4.5 g L−1 ZnSO4·7H2O, 1 g L−1 MnCl2·4 H2O, 0.3 g L−1 CoCl2·7 H2O, 0.3 g L−1 CuSO4·5 H2O, 0.4 g L−1 NaMoO4·2 H2O, 4.5 g L−1 CaCl2·2 H2O, 3 g L−1 FeSO4·7 H2O, 1 g L−1 H3BO3 and 0.1 g L−1 KI. All precultures were performed in 500 mL shake flasks filled with 10% medium at 30 °C and 250 rpm. The bioreactor experiments were run in a Sartorius Biostat A plus bioreactor (Göttingen, Germany) with a working volume of 1 L at 30 °C. The fermentation parameters were controlled by an external computer and the software PC Panel μDCU. The pH was monitored with a Mettler Toledo pH electrode and controlled at pH 5 using 10 M potassium hydroxide and 4 M hydrochloric acid. In aerobic fermentations, the fermenter was aerated with pressurized air with a flow rate of 2.8 L min−1. To reduce impurities, the air was filtered by a Sartorius Midisart 2000 sterile filter (0.2 µm pore size) and passed through water, resulting in water-saturated gas. Dissolved oxygen concentrations were monitored with a Hamilton Oxyferm dissolved oxygen electrode. If not mentioned otherwise, the dissolved oxygen tension was maintained at 90% by adjusting the stirrer speed. Bioreactor cultivations were started by inoculating to an OD600 of 0.1. During batch cultivation, sample for OD and HPLC measurements were taken regularly in the first 12 h. Continuous, glucose-limited cultivations were run at a dilution rate of 0.13 h−1 by feeding fresh medium at a flow rate of 2.5 mL min−1. A constant volume of culture broth was maintained by positioning a tube at a predetermined height that corresponded to 1120 mL volume and connecting it to a separate pump that removed excess fluid. Both batch and continuous cultivations were single experiments.
To check for possible contamination during fermentations, samples were examined daily under the microscope (Leica DM750) with a 10X ocular and a 100X oil immersion objective.

3.2. Analytics

The optical density was determined with an Ultrospec 10 photometer (Amersham Bioscience, Amersham, Switzerland) with a fixed wavelength of 600 nm. When necessary, the samples were diluted using demineralized water.
For the determination of glucose and fermentative byproducts, samples were taken directly out of the fermenter using a syringe and a steel pipe. Samples were harvested by centrifugation (Heraeus Megafuge 16R, Thermo Fisher Scientific, Marietta, Ohio, USA) at 5000 rpm for 5 min at 4 °C. The supernatant was stored at −20 °C until further analysis. Analytes were separated using an organic acid resin column (C-S Chromatography, Langerwehe, Germany) at 50 °C. 5 mM H2SO4 was used as eluent at a flow rate of 0.8 mL min−1 (System Gold 125 Solvent Module). Analytes were detected with a UV detector (166 Detector, (Beckman Coulter, Krefeld, Germany) at a wavelength of 210 nm and a RI detector (Melz Differential Refractometer LDC 201) operated at 50 °C. Standard solutions of the analytes were measured in concentrations of 0.1, 0.5, 1, 5, 10, 20, 40 and 50 g L−1.

3.3. SPME GC-MS Measurements for Validation of Volatile Metabolites

To cross-check the identification of volatile compounds, 10 mL of the supernatant were sampled from the bioreactor and transferred into a headspace vial (20 mL). Metabolites were extracted from the headspace of culture supernatant via solid phase microextraction (CAR/PDMS fibers, Supelco, Steinheim, Germany) and analyzed with GC-MS as described in [41]. Briefly, the samples were incubated at 50 °C for 15 min and after that agitated for 10 s at 250 rpm. Afterwards, the analytes were desorbed in the SPME liner of the GC at 250 °C. GC-MS analyses were carried out with an Agilent 7890A gas chromatograph equipped with an Agilent 7000B triple-quadrupole mass spectrometer (Agilent Technologies, Waldbronn, Germany). The split was set to a ratio of 5:1. The column temperature was increased from 40–250 °C with a rate of 12 °C min−1. All other parameters were identical as those described in [41]. For mVOC identification, retention indices and mass spectra were compared with the NIST mass spectral library (Version: 2.0) and data published in the FlavorNet database (flavornet.org, [32]).

3.4. MCC-IMS Measurements

The MCC-IMS used was a BreathDiscovery (B&S Analytics, Dortmund, Germany) with an upstream multi capillary column type OV-5 (Multichrom Ltd. Novosibirsk, Russia) of 17 cm length consisting of approx. 1000 capillaries. The capillaries have an inner diameter of 40 µm and are coated with OV-5 stationary phase with a film thickness of 0.2 µm. The column temperature was set to 40 °C. Samples were ionized with a 550 MBq 63Ni ion source. The ionized analytes were introduced into the drift column (length, 120 mm) through a shutter that had a pulse frequency of 50 ms and an opening time of 30 µs. Separation in the drift chamber was carried out in a negative coaxial electric field with an intensity of 300 Vcm−1 (positive measurement mode). The MCC-IMS was operated at ambient temperature and pressure (i.e., laboratory conditions). Raw data of mVOCs were acquired using VOCan (B&S Analytik) with a frequency of 10 Hz, 5 consecutive single spectra were averaged. A single round of data acquisition required 0.5 s. The program was used to control all parameters of the MCC-IMS like gas flow and temperature, and to program measurement sequences.
Nitrogen 5.0 (Westfalen, Münster, Germany) was used both as drift gas in the MCC-IMS and as carrier gas in the MCC. The drift gas flow rate was set to 100 mL min−1; the carrier gas flow rate was set to 150 mL min−1 during batch and 50 mL min−1 during continuous fermentation. The fermenter off-gas was introduced into the system through a 10 mL stainless steel sampling loop coupled to a six-port valve. Between single measurements the MCC-IMS and the sampling line was purged with a nitrogen flow of 100 mL min−1.
The MCC-IMS topographic plots were evaluated using the software VisualNow (B&S Analytik). Reduced inverse ion mobilities, 1/K0 (Vs cm−2), were calculated by normalizing the measured drift velocities (drift time per drift distance) to the electric field, temperature and pressure. This reduced ion mobility is characteristic for the ion and independent of the experimental conditions. The program allowed the definition of peak regions and comparison of the peak intensities in different datasets. The intensities of detected peak regions, the reduced ion mobility and retention time were exported to Excel for further data evaluation [76].
The MCC-IMS was connected to the fermenter off-gas with a Teflon tube (ID, 1.58 mm; length, 1000 mm). To prevent overloading of the MCC-IMS, the off-gas was diluted with sterile, moisturized air or nitrogen at a flow rate of 2.4 mL min−1. The air was filtered with a 0.2 µm sterile filter. Mixing was achieved by introducing both gas streams into a 500 mL Schott bottle.

3.5. Volatile Metabolite Identification

For mVOC identification, pure standard substance measurements were performed, for which the MCC-IMS was operated with identical parameters as during the continuous cultivations. One mL of aqueous standard solutions of a concentration of 0.01 g L−1 was filled in 100 mL Erlenmeyer flasks, which were closed with an aluminum cap. The sampling tube was introduced to the flask and the measurement was started.

4. Conclusions

Application of MCC-IMS in positive ion mode for online monitoring of fermentation off-gas detected 19 signals produced by S. cerevisiae during growth on glucose minimal salt medium. To more comprehensively explore the volatile metabolite spectrum of yeast fermentations, in future experiments IMS measurements in both positive and negative ion mode will be performed. However, although the here presented first analyses probably captured only a minute fraction of S. cerevisiae’s volatile metabolite spectrum, they were sufficient to differentiate different S. cerevisiae strains and to reveal the impact of different growth conditions on the production of mVOCs. Four compounds were identified by complementary GC-MS measurements of fermentation broth extracts and pure standard substance measurements. Similar to the exometabolome, for which only the main metabolites are usually measured while it is only poorly described systematically [77], only little is known about the synthesis and regulation of volatile metabolites. Even for the well-studied model organism S. cerevisiae, the biochemistry of only two of the four mVOCs identified in this study by MCC-IMS and four of the 10 mVOCs identified by GC-MS are well understood. While in this study mVOC synthesis by S. cerevisiae was only qualitatively determined, future quantitative analyses will show the significance of mVOC analysis for the description of the cell physiology and its metabolic activity.

Acknowledgments

We thank Marco Fraatz (Justus-Liebig-University Gießen, Germany) for GC-MS measurements and help with data evaluation and Jörg I. Baumbach (Reutlingen University, Germany) for fruitful discussions. We also thank Peter Kaiser (B&S Analytik, Dortmund, Germany) for technical support and Mathis Wolter (RWTH Aachen, Germany) for assistance with MCC-IMS-measurements and implementation of the experimental set-up.

Author Contributions

The study was designed by Lars M. Blank, Birgitta E. Ebert, and Christoph Halbfeld. Christoph Halbfeld performed the experiments, Birgitta E. Ebert and Christoph Halbfeld analyzed the data. All authors wrote and approved the manuscript.

Conflicts of Interest

The authors declare no conflict of interest.

References

  1. McGovern, P.E.; Glusker, D.L.; Exner, L.J.; Voigt, M.M. Neolithic resinated wine. Nature 1996, 381, 480–481. [Google Scholar]
  2. Mortimer, R.K. Evolution and variation of the yeast (Saccharomyces). Genome Res. 2000, 10, 891. [Google Scholar]
  3. McGovern, P.E.; Zhang, J.H.; Tang, J.G.; Zhang, Z.Q.; Hall, G.R.; Moreau, R.A.; Nunez, A.; Butrym, E.D.; Richards, M.P.; Wang, C.S.; et al. Fermented beverages of pre- and proto-historic china. Proc. Natl. Acad. Sci. 2004, 101, 17593–17598. [Google Scholar] [CrossRef]
  4. Sicard, D.; Legras, J.L. Bread, beer and wine: Yeast domestication in the Saccharomyces sensu stricto complex. Comptes Rendus Biol. 2011, 334, 229–236. [Google Scholar]
  5. Paddon, C.J.; Westfall, P.J.; Pitera, D.J.; Benjamin, K.; Fisher, K.; McPhee, D.; Leavell, M.D.; Tai, A.; Main, A.; Eng, D.; et al. High-level semi-synthetic production of the potent antimalarial artemisinin. Nature 2013, 496, 528–532. [Google Scholar]
  6. Kjeldsen, T. Yeast secretory expression of insulin precursors. Appl. Microbiol. Biotechnol. 2000, 54, 277–286. [Google Scholar] [CrossRef]
  7. Thim, L.; Hansen, M.T.; Norris, K.; Hoegh, I.; Boel, E.; Forstrom, J.; Ammerer, G.; Fiil, N.P. Secretion and processing of insulin precursors in yeast. Proc. Natl. Acad. Sci. 1986, 83, 6766–6770. [Google Scholar]
  8. Basso, L.C.; de Amorim, H.V.; de Oliveira, A.J.; Lopes, M.L. Yeast selection for fuel ethanol production in brazil. FEMS Yeast Res. 2008, 8, 1155–1163. [Google Scholar]
  9. Quantz, M. Versuchsanstalt der Hefeindustrie e.V., Berlin, Germany. Available online: http://www.vh-berlin.org/ (accessed 11 July 2014).
  10. Goffeau, A.; Barrell, B.G.; Bussey, H.; Davis, R.W.; Dujon, B.; Feldmann, H.; Galibert, F.; Hoheisel, J.D.; Jacq, C.; Johnston, M.; et al. Life with 6000 genes. Science 1996, 274, 546, 563–547. [Google Scholar]
  11. Saccharomyces cerevisiae Genome Snapshot/Overview. Available online: http://www.yeastgenome.org/cache/genomeSnapshot.html (accessed 2 May 2014).
  12. Cherry, J.M.; Hong, E.L.; Amundsen, C.; Balakrishnan, R.; Binkley, G.; Chan, E.T.; Christie, K.R.; Costanzo, M.C.; Dwight, S.S.; Engel, S.R.; et al. Saccharomyces genome database: The genomics resource of budding yeast. Nucleic Acids Res. 2012, 40, D700–D705. [Google Scholar]
  13. Mewes, H.W.; Frishman, D.; Guldener, U.; Mannhaupt, G.; Mayer, K.; Mokrejs, M.; Morgenstern, B.; Munsterkotter, M.; Rudd, S.; Weil, B. Mips: A database for genomes and protein sequences. Nucleic Acids Res. 2002, 30, 31–34. [Google Scholar]
  14. Costanzo, M.C.; Hogan, J.D.; Cusick, M.E.; Davis, B.P.; Fancher, A.M.; Hodges, P.E.; Kondu, P.; Lengieza, C.; Lew-Smith, J.E.; Lingner, C.; et al. The yeast proteome database (ypd) and Caenorhabditis elegans proteome database (wormpd): Comprehensive resources for the organization and comparison of model organism protein information. Nucleic Acids Res. 2000, 28, 73–76. [Google Scholar] [CrossRef]
  15. Förster, J.; Famili, I.; Fu, P.; Palsson, B.O.; Nielsen, J. Genome-scale reconstruction of the Saccharomyces cerevisiae metabolic network. Genome Res. 2003, 13, 244–253. [Google Scholar]
  16. Duarte, N.C.; Herrgard, M.J.; Palsson, B.O. Reconstruction and validation of Saccharomyces cerevisiae ind750, a fully compartmentalized genome-scale metabolic model. Genome Res. 2004, 14, 1298–1309. [Google Scholar]
  17. Nookaew, I.; Jewett, M.C.; Meechai, A.; Thammarongtham, C.; Laoteng, K.; Cheevadhanarak, S.; Nielsen, J.; Bhumiratana, S. The genome-scale metabolic model iin800 of Saccharomyces cerevisiae and its validation: A scaffold to query lipid metabolism. BMC Syst. Biol. 2008. [Google Scholar] [CrossRef]
  18. Kuepfer, L.; Sauer, U.; Blank, L.M. Metabolic functions of duplicate genes in Saccharomyces cerevisiae. Genome Res. 2005, 15, 1421–1430. [Google Scholar] [CrossRef]
  19. Dobson, P.D.; Smallbone, K.; Jameson, D.; Simeonidis, E.; Lanthaler, K.; Pir, P.; Lu, C.; Swainston, N.; Dunn, W.B.; Fisher, P.; et al. Further developments towards a genome-scale metabolic model of yeast. BMC Syst. Biol. 2010. [Google Scholar] [CrossRef]
  20. Herrgard, M.J.; Swainston, N.; Dobson, P.; Dunn, W.B.; Arga, K.Y.; Arvas, M.; Bluthgen, N.; Borger, S.; Costenoble, R.; Heinemann, M.; et al. A consensus yeast metabolic network reconstruction obtained from a community approach to systems biology. Nat. Biotechnol. 2008, 26, 1155–1160. [Google Scholar] [CrossRef]
  21. Heavner, B.D.; Smallbone, K.; Swainston, N. Yeastnet. Available online: http://sourceforge.net/projects/yeast/files/ (accessed on 2 September 2014).
  22. Snyder, M.; Gallagher, J.E.G. Systems biology from a yeast omics perspective. FEBS Lett. 2009, 583, 3895–3899. [Google Scholar]
  23. Patel, S.; Shibamoto, T. Effect of 20 different yeast strains on the production of volatile components in symphony wine. J. Food Compos. Anal. 2003, 16, 469–476. [Google Scholar]
  24. Perez-Coello, M.S.; Perez, A.I.B.; Iranzo, J.F.U.; Alvarez, P.J.M. Characteristics of wines fermented with different Saccharomyces cerevisiae strains isolated from the la mancha region. Food Microbiol. 1999, 16, 563–573. [Google Scholar] [CrossRef]
  25. Callejon, R.M.; Clavijo, A.; Ortigueira, P.; Troncoso, A.M.; Paneque, P.; Morales, M.L. Volatile and sensory profile of organic red wines produced by different selected autochthonous and commercial Saccharomyces cerevisiae strains. Anal. Chim. Acta 2010, 660, 68–75. [Google Scholar]
  26. Torija, M.J.; Beltran, G.; Novo, M.; Poblet, M.; Guillamon, J.M.; Mas, A.; Rozes, N. Effects of fermentation temperature and Saccharomyces species on the cell fatty acid composition and presence of volatile compounds in wine. Int. J. Food Microbiol. 2003, 85, 127–136. [Google Scholar]
  27. Suomalainen, H.; Nykänen, L. The aroma components produced by yeast in nitrogen-free sugar solution. J. Inst. Brew. 1966, 72, 469–474. [Google Scholar] [CrossRef]
  28. Polaskova, P.; Herszage, J.; Ebeler, S.E. Wine flavor: Chemistry in a glass. Chem. Soc. Rev. 2008, 37, 2478–2489. [Google Scholar]
  29. Lemfack, M.C.; Nickel, J.; Dunkel, M.; Preissner, R.; Piechulla, B. mVOC: A database of microbial volatiles. Nucleic Acids Res. 2014, 42, D744–D748. [Google Scholar]
  30. El-Sayaed, A.M. The pherobase: Database of insect pheromones and semiochemicals. Available online: http://www.pherobase.com (accessed on 20 August 2014).
  31. Dunkel, M.; Schmidt, U.; Struck, S.; Berger, L.; Gruening, B.; Hossbach, J.; Jaeger, I.S.; Effmert, U.; Piechulla, B.; Eriksson, R.; et al. Superscent—A database of flavors and scents. Nucleic Acids Res. 2009, 37, D291–D294. [Google Scholar] [CrossRef]
  32. Arn, H.; Acree, T.E. Flavornet: A database of aroma compounds based on odor potency in natural products. In Food Flavors: Formation, Analysis, and Packaging Influences; Contis, E.T., Ho, C.T., Mussinan, C.J., Parliment, T.H., Shahidi, F., Spanier, A.M., Eds.; Elsevier Science Bv: Amsterdam, The Netherland, 1998; Volume 40, p. 27. [Google Scholar]
  33. De Lacy Costello, B.; Amann, A.; Al-Kateb, H.; Flynn, C.; Filipiak, W.; Khalid, T.; Osborne, D.; Ratcliffe, N.M. A review of the volatiles from the healthy human body. J. Breath Res. 2014. [Google Scholar] [CrossRef]
  34. Aung, H.W.; Henry, S.A.; Walker, L.P. Revising the representation of fatty acid, glycerolipid, and glycerophospholipid metabolism in the consensus model of yeast metabolism. Ind. Biotechnol. 2013, 9, 215–228. [Google Scholar]
  35. Hazelwood, L.A.; Daran, J.M.; van Maris, A.J.; Pronk, J.T.; Dickinson, J.R. The Ehrlich pathway for fusel alcohol production: A century of research on Saccharomyces cerevisiae metabolism. Appl. Environ. Microbiol. 2008, 74, 2259–2266. [Google Scholar] [CrossRef]
  36. Bruce, A.; Verrall, S.; Hackett, C.A.; Wheatley, R.E. Identification of volatile organic compounds (vocs) from bacteria and yeast causing growth inhibition of sapstain fungi. Holzforschung 2004, 58, 193–198. [Google Scholar]
  37. Hazelwood, L. Cornucopia-Non-Conventional Yeasts for Food Fermentation. In Proceedings of the 25th VH Yeast Conference, Hamburg, Germany, 23–24 April 2012; Research Institute for Baker’s Yeast: Berlin, Germany, 2012; pp. 35–47. [Google Scholar]
  38. Mateos, J.A.R.; Perez-Nevado, F.; Fernandez, M.R. Influence of Saccharomyces cerevisiae yeast strain on the major volatile compounds of wine. Enzyme Microb. Technol. 2006, 40, 151–157. [Google Scholar]
  39. Ames, J.M.; Leod, G.M. Volatile components of a yeast extract composition. J. Food Sci. 1985, 50, 125–131. [Google Scholar]
  40. Baumbach, J.I.; Eiceman, G.A. Ion mobility spectrometry: Arriving on site and moving beyond a low profile. Appl. Spectrosc. 1999, 53, 338–355. [Google Scholar]
  41. Zhang, Y.; Fraatz, M.A.; Horlamus, F.; Quitmann, H.; Zorn, H. Identification of potent odorants in a novel nonalcoholic beverage produced by fermentation of wort with shiitake (Lentinula edodes). J. Agric. Food Chem. 2014, 62, 4195–4203. [Google Scholar]
  42. Fenske, J.D.; Paulson, S.E. Human breath emissions of vocs. J. Air Waste Manag. Assoc. 1999, 49, 594–598. [Google Scholar]
  43. Yinon, J. Field detection and monitoring of explosives. TrAC Trends Anal. Chem. 2002, 21, 292–301. [Google Scholar] [CrossRef]
  44. Baumbach, J.I. Process analysis using ion mobility spectrometry. Anal. Bioanal. Chem. 2006, 384, 1059–1070. [Google Scholar]
  45. Maddula, S.; Blank, L.M.; Schmid, A.; Baumbach, J.I. Detection of volatile metabolites of Escherichia coli by multi capillary column coupled ion mobility spectrometry. Anal. Bioanal. Chem. 2009, 394, 791–800. [Google Scholar]
  46. Xie, Z.; Sielemann, S.; Schmidt, H.; Baumbach, J.I. A novel method for the detection of mtbe: Ion mobility spectrometry coupled to multi capillary column. Int. J. Ion Mobil. Spec. 2000, 4, 77–83. [Google Scholar]
  47. Kunze, N.; Gopel, J.; Kuhns, M.; Junger, M.; Quintel, M.; Perl, T. Detection and validation of volatile metabolic patterns over different strains of two human pathogenic bacteria during their growth in a complex medium using multi-capillary column-ion mobility spectrometry (MCC-IMS). Appl. Microbiol. Biotechnol. 2013, 97, 3665–3676. [Google Scholar]
  48. Kotiaho, T.; Lauritsen, F.R.; Degn, H.; Paakkanen, H. Membrane inlet ion mobility spectrometry for online measurement of ethanol in beer and in yeast fermentation. Anal. Chim. Acta 1995, 309, 317–325. [Google Scholar] [CrossRef]
  49. Kolehmainen, M.; Ronkko, P.; Raatikainen, A. Monitoring of yeast fermentation by ion mobility spectrometry measurement and data visualisation with self-organizing maps. Anal. Chim. Acta 2003, 484, 93–100. [Google Scholar] [CrossRef]
  50. Vautz, W.; Baumbach, J.I.; Jung, J. Beer fermentation control using ion mobility spectrometry—Results of a pilot study. J. Inst. Brew. 2006, 112, 157–164. [Google Scholar] [CrossRef]
  51. Stach, J.; Baumbach, J.I. Ion mobility spectrometry-basic elements and applications. Int. J. Ion Mobil. Spec. 2002, 5, 1–21. [Google Scholar]
  52. Westhoff, M.; Litterst, P.; Freitag, L.; Urfer, W.; Bader, S.; Baumbach, J.I. Ion mobility spectrometry for the detection of volatile organic compounds in exhaled breath of patients with lung cancer: Results of a pilot study. Thorax 2009, 64, 744–748. [Google Scholar] [CrossRef]
  53. Ruzsanyi, V.; Baumbach, J.I.; Eiceman, G.A. Detection of the mold markers using ion mobility spectrometry. Int. J. Ion Mobil. Spec. 2003, 6, 53–57. [Google Scholar]
  54. Crabtree, H.G. Observations on the carbohydrate metabolism of tumours. Biochem. J. 1929, 23, 536–545. [Google Scholar]
  55. De Deken, R.H. The crabtree effect: A regulatory system in yeast. J. Gen. Microbiol. 1966, 44, 149–156. [Google Scholar]
  56. Randez-Gil, F.; Corcoles-Saez, I.; Prieto, J.A. Genetic and phenotypic characteristics of baker’s yeast: Relevance to baking. Annu. Rev. Food Sci. Technol. 2013, 4, 191–214. [Google Scholar]
  57. Ejiofor, A.O.; Okafor, N.; Ugwueze, E.N. Development of baking yeast from nigerian palm-wine yeasts. World J. Microbiol. Biotechnol. 1994, 10, 199–202. [Google Scholar] [CrossRef]
  58. Fischer, K. Straightforward Prognostication of Durability of Baker’s Yeast. In Proceedings of the 18th VH Yeast Conference, Berlin, Germany, 25–26, April, 2005; Research Institute for Baker’s Yeast: Berlin, Germany, 2005; pp. 7–18. [Google Scholar]
  59. Porro, D.; Sauer, M.; Branduardi, P.; Mattanovich, D. Recombinant protein production in yeasts. Mol. Biotechnol. 2005, 31, 245–259. [Google Scholar] [CrossRef]
  60. Frick, O.; Wittmann, C. Characterization of the metabolic shift between oxidative and fermentative growth in Saccharomyces cerevisiae by comparative 13C flux analysis. Microb. Cell Fact. 2005. [Google Scholar] [CrossRef]
  61. Jouhten, P.; Rintala, E.; Huuskonen, A.; Tamminen, A.; Toivari, M.; Wiebe, M.; Ruohonen, L.; Penttila, M.; Maaheimo, H. Oxygen dependence of metabolic fluxes and energy generation of Saccharomyces cerevisiae cen.Pk113–1a. BMC Syst. Biol. 2008. [Google Scholar] [CrossRef]
  62. Chen, G.C.; Jordan, F. Brewers-yeast pyruvate decarboxylase produces acetoin from acetaldehyde—A novel tool to study the mechanism of steps subsequent to carbon-dioxide loss. Biochemistry 1984, 23, 3576–3582. [Google Scholar] [CrossRef]
  63. Heidlas, J.; Tressl, R. Purification and properties of two oxidoreductases catalyzing the enantioselective reduction of diacetyl and other diketones from baker’s yeast. Eur. J. Biochem. 1990, 188, 165–174. [Google Scholar]
  64. Romano, P.; Suzzi, G. Origin and production of acetoin during wine yeast fermentation. Appl. Environ. Microbiol. 1996, 62, 309–315. [Google Scholar]
  65. Bartowsky, E.J.; Henschke, P.A. The “buttery” attribute of wine-diacetyl-desirability, spoilage and beyond. Int. J. Food Microbiol. 2004, 96, 235–252. [Google Scholar]
  66. Gonzalez, E.; Fernandez, M.R.; Larroy, C.; Pares, X.; Biosca, J.A. Characterization and functional role of Saccharomyces cerevisiae 2,3-butanediol dehydrogenase. Chem.-Biol. Interact. 2001, 130–132, 425–434. [Google Scholar] [CrossRef]
  67. Pronk, J.T.; Steensma, H.Y.; van Dijken, J.P. Pyruvate metabolism in Saccharomyces cerevisiae. Yeast 1996, 12, 1607–1633. [Google Scholar]
  68. Ng, C.Y.; Jung, M.Y.; Lee, J.; Oh, M.K. Production of 2,3-butanediol in Saccharomyces cerevisiaeby in silico aided metabolic engineering. Microb. Cell Fact. 2012. [Google Scholar] [CrossRef]
  69. Walker, V.; Mills, G.A. 2-pentanone production from hexanoic acid by Penicillium roqueforti from blue cheese: Is this the pathway used in humans? Sci. World J. 2014. Available online: http://www.hindawi.com/journals/tswj/2014/215783/ (accessed on 20 August 2014).
  70. Jewison, T.; Knox, C.; Neveu, V.; Djoumbou, Y.; Guo, A.C.; Lee, J.; Liu, P.; Mandal, R.; Krishnamurthy, R.; Sinelnikov, I.; et al. Ymdb: The yeast metabolome database. Nucleic Acids Res. 2012, 40, D815–D820. [Google Scholar]
  71. Dickschat, J.S.; Wickel, S.; Bolten, C.J.; Nawrath, T.; Schulz, S.; Wittmann, C. Pyrazine biosynthesis in Corynebacterium glutamicum. Eur. J. Org. Chem. 2010. [Google Scholar] [CrossRef]
  72. Van Dijken, J.P.; Bauer, J.; Brambilla, L.; Duboc, P.; Francois, J.M.; Gancedo, C.; Giuseppin, M.L.F.; Heijnen, J.J.; Hoare, M.; Lange, H.C.; et al. An interlaboratory comparison of physiological and genetic properties of four Saccharomyces cerevisiae strains. Enzyme Microb. Technol. 2000, 26, 706–714. [Google Scholar]
  73. Blank, L.M.; Kuepfer, L.; Sauer, U. Large-scale 13C-flux analysis reveals mechanistic principles of metabolic network robustness to null mutations in yeast. Genome Biol. 2005. [Google Scholar] [CrossRef] [Green Version]
  74. Verduyn, C.; Postma, E.; Scheffers, W.A.; Vandijken, J.P. Effect of benzoic acid on metabolic fluxes in yeasts—A continuous culture study on the regulation of respiration and alcoholic fermentation. Yeast 1992, 8, 501–517. [Google Scholar] [CrossRef]
  75. Eiceman, G.H.; Karpas, Z.; Hill, H.H. Ion Mobility Spectrometry, 3rd ed.; CRC Press: Boca Raton, FL, USA, 2014. [Google Scholar]
  76. Bödeker, B.; Vautz, W.; Baumbach, J. Peak finding and referencing in mcc/ims data. Int. J. Ion Mobil. Spec. 2008, 11, 83–87. [Google Scholar]
  77. Paczia, N.; Nilgen, A.; Lehmann, T.; Gatgens, J.; Wiechert, W.; Noack, S. Extensive exometabolome analysis reveals extended overflow metabolism in various microorganisms. Microb. Cell Fact. 2012. [Google Scholar] [CrossRef]

