
Prediction, Detection, and Validation of Isotope Clusters in Mass Spectrometry Data


Abstract
:1. Introduction
2. Results
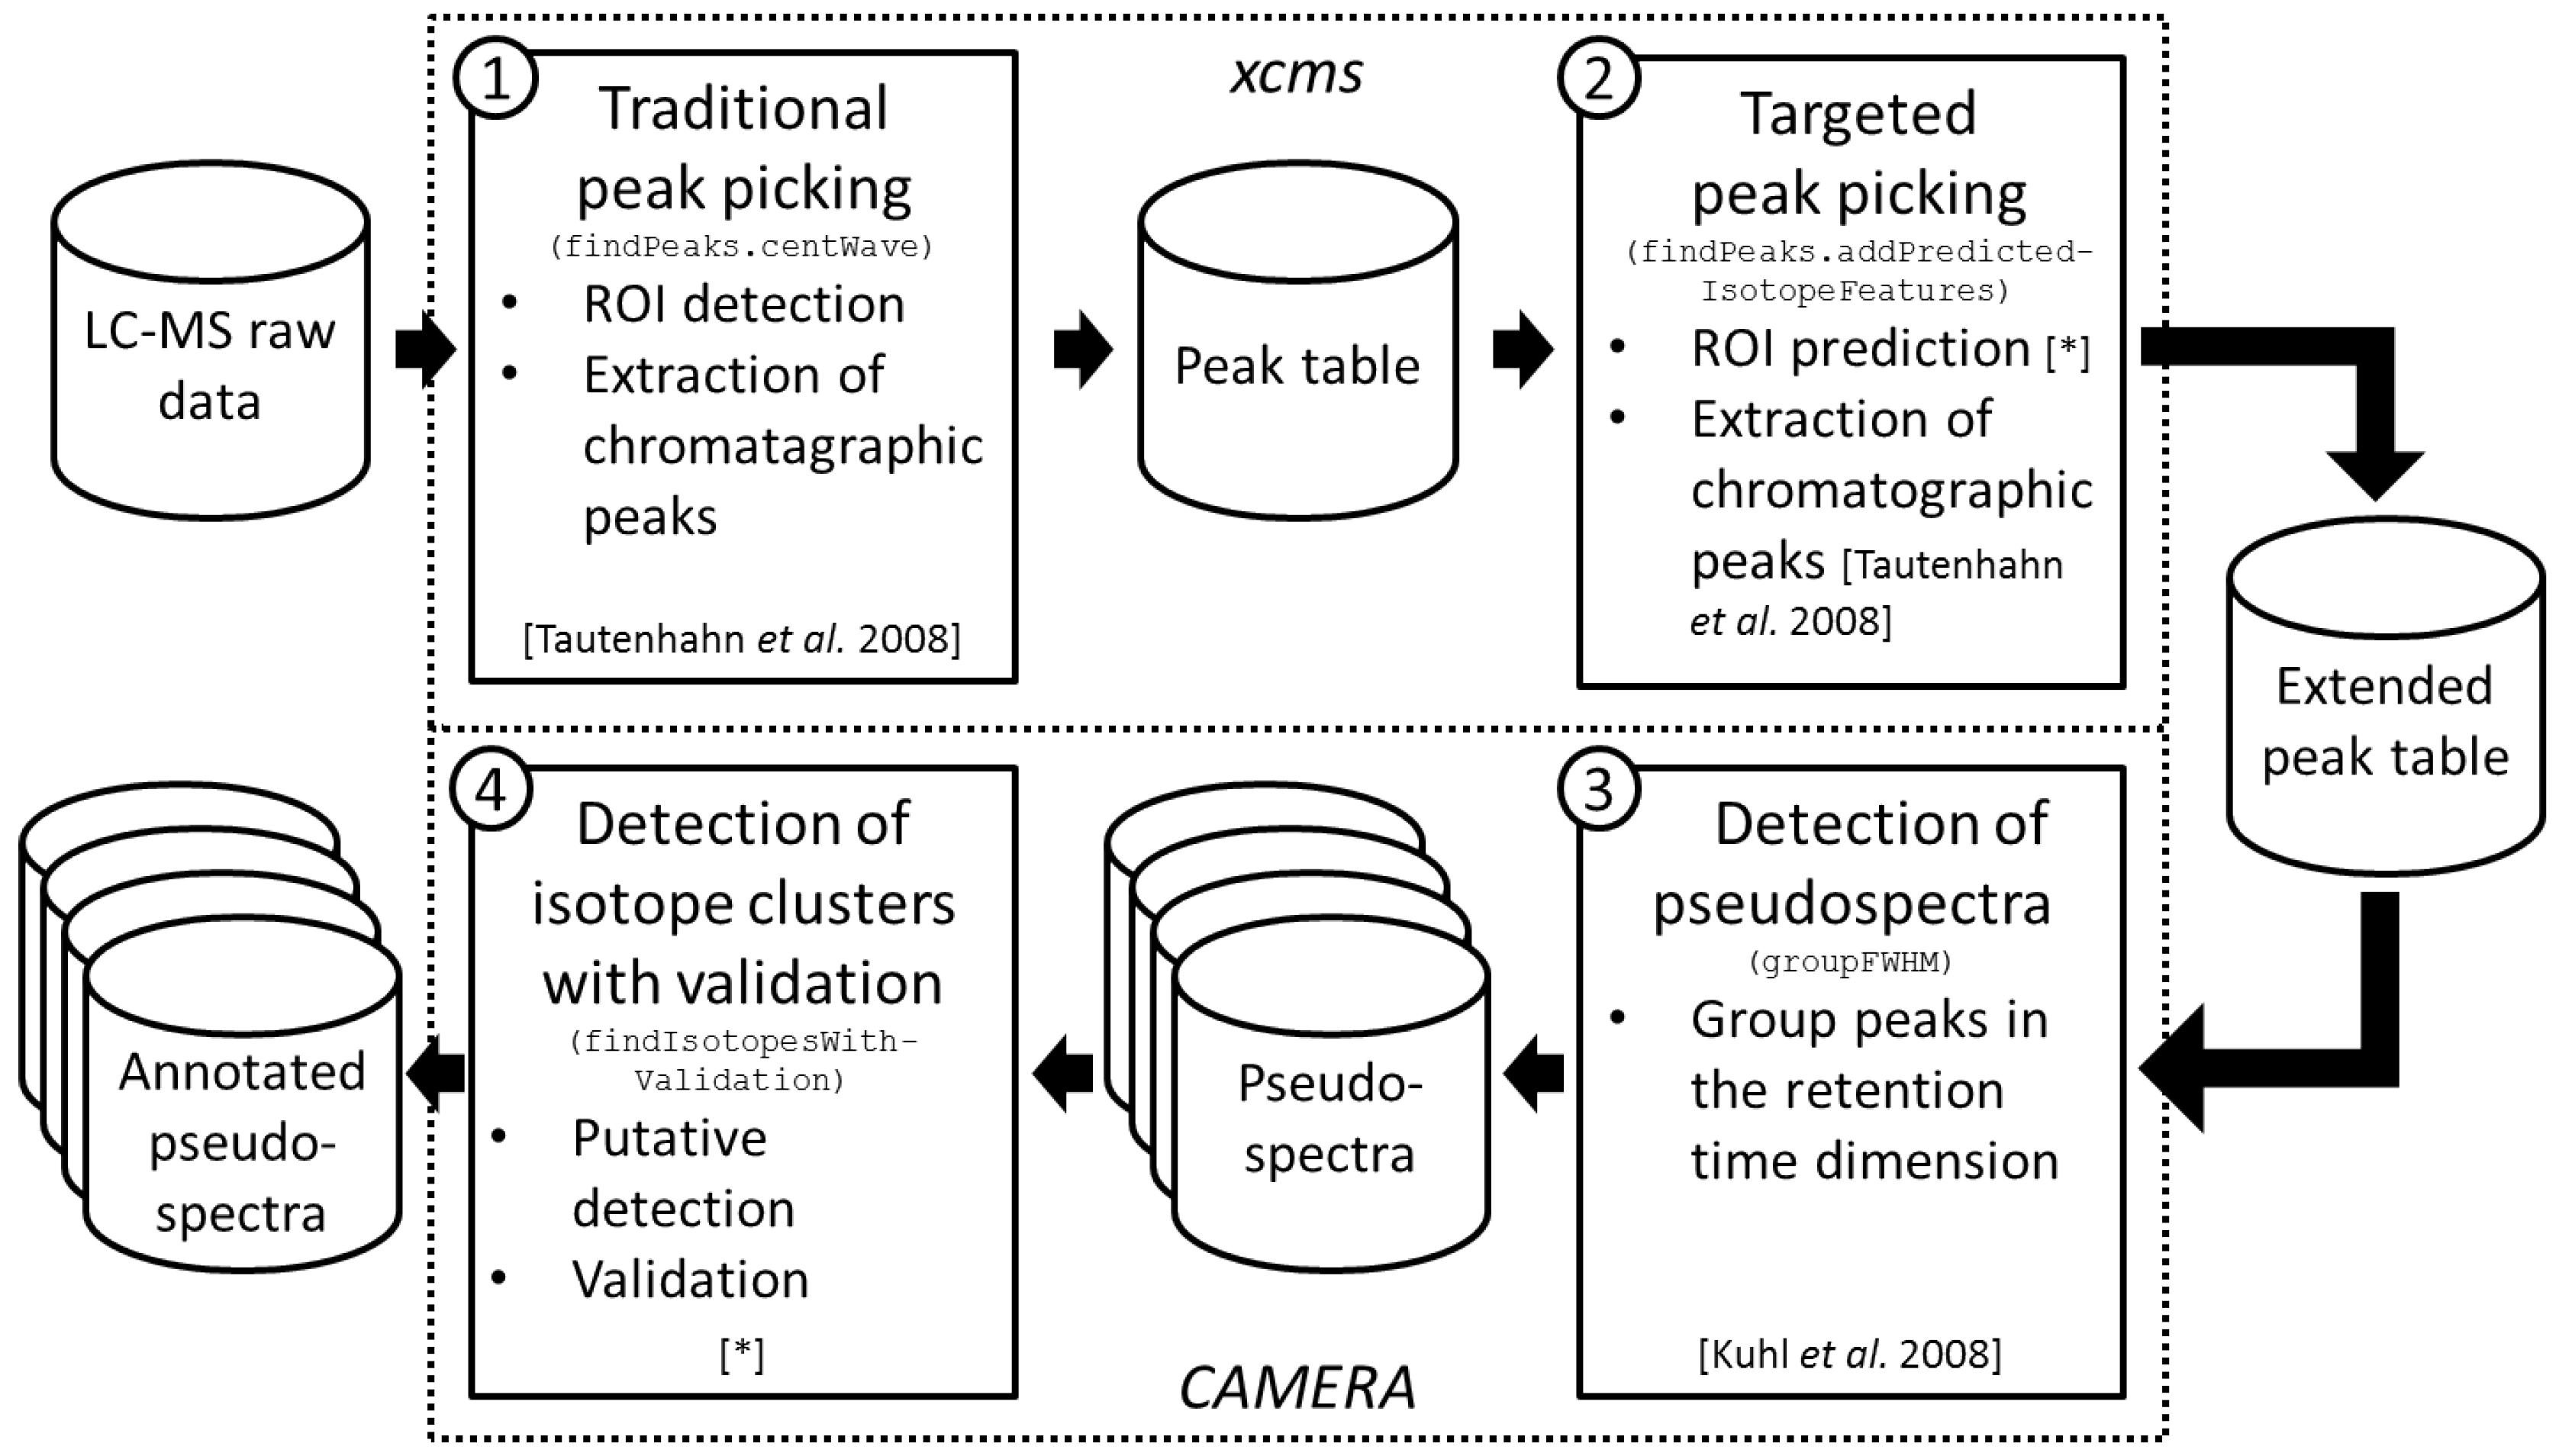
2.1. Workflow of the Approach
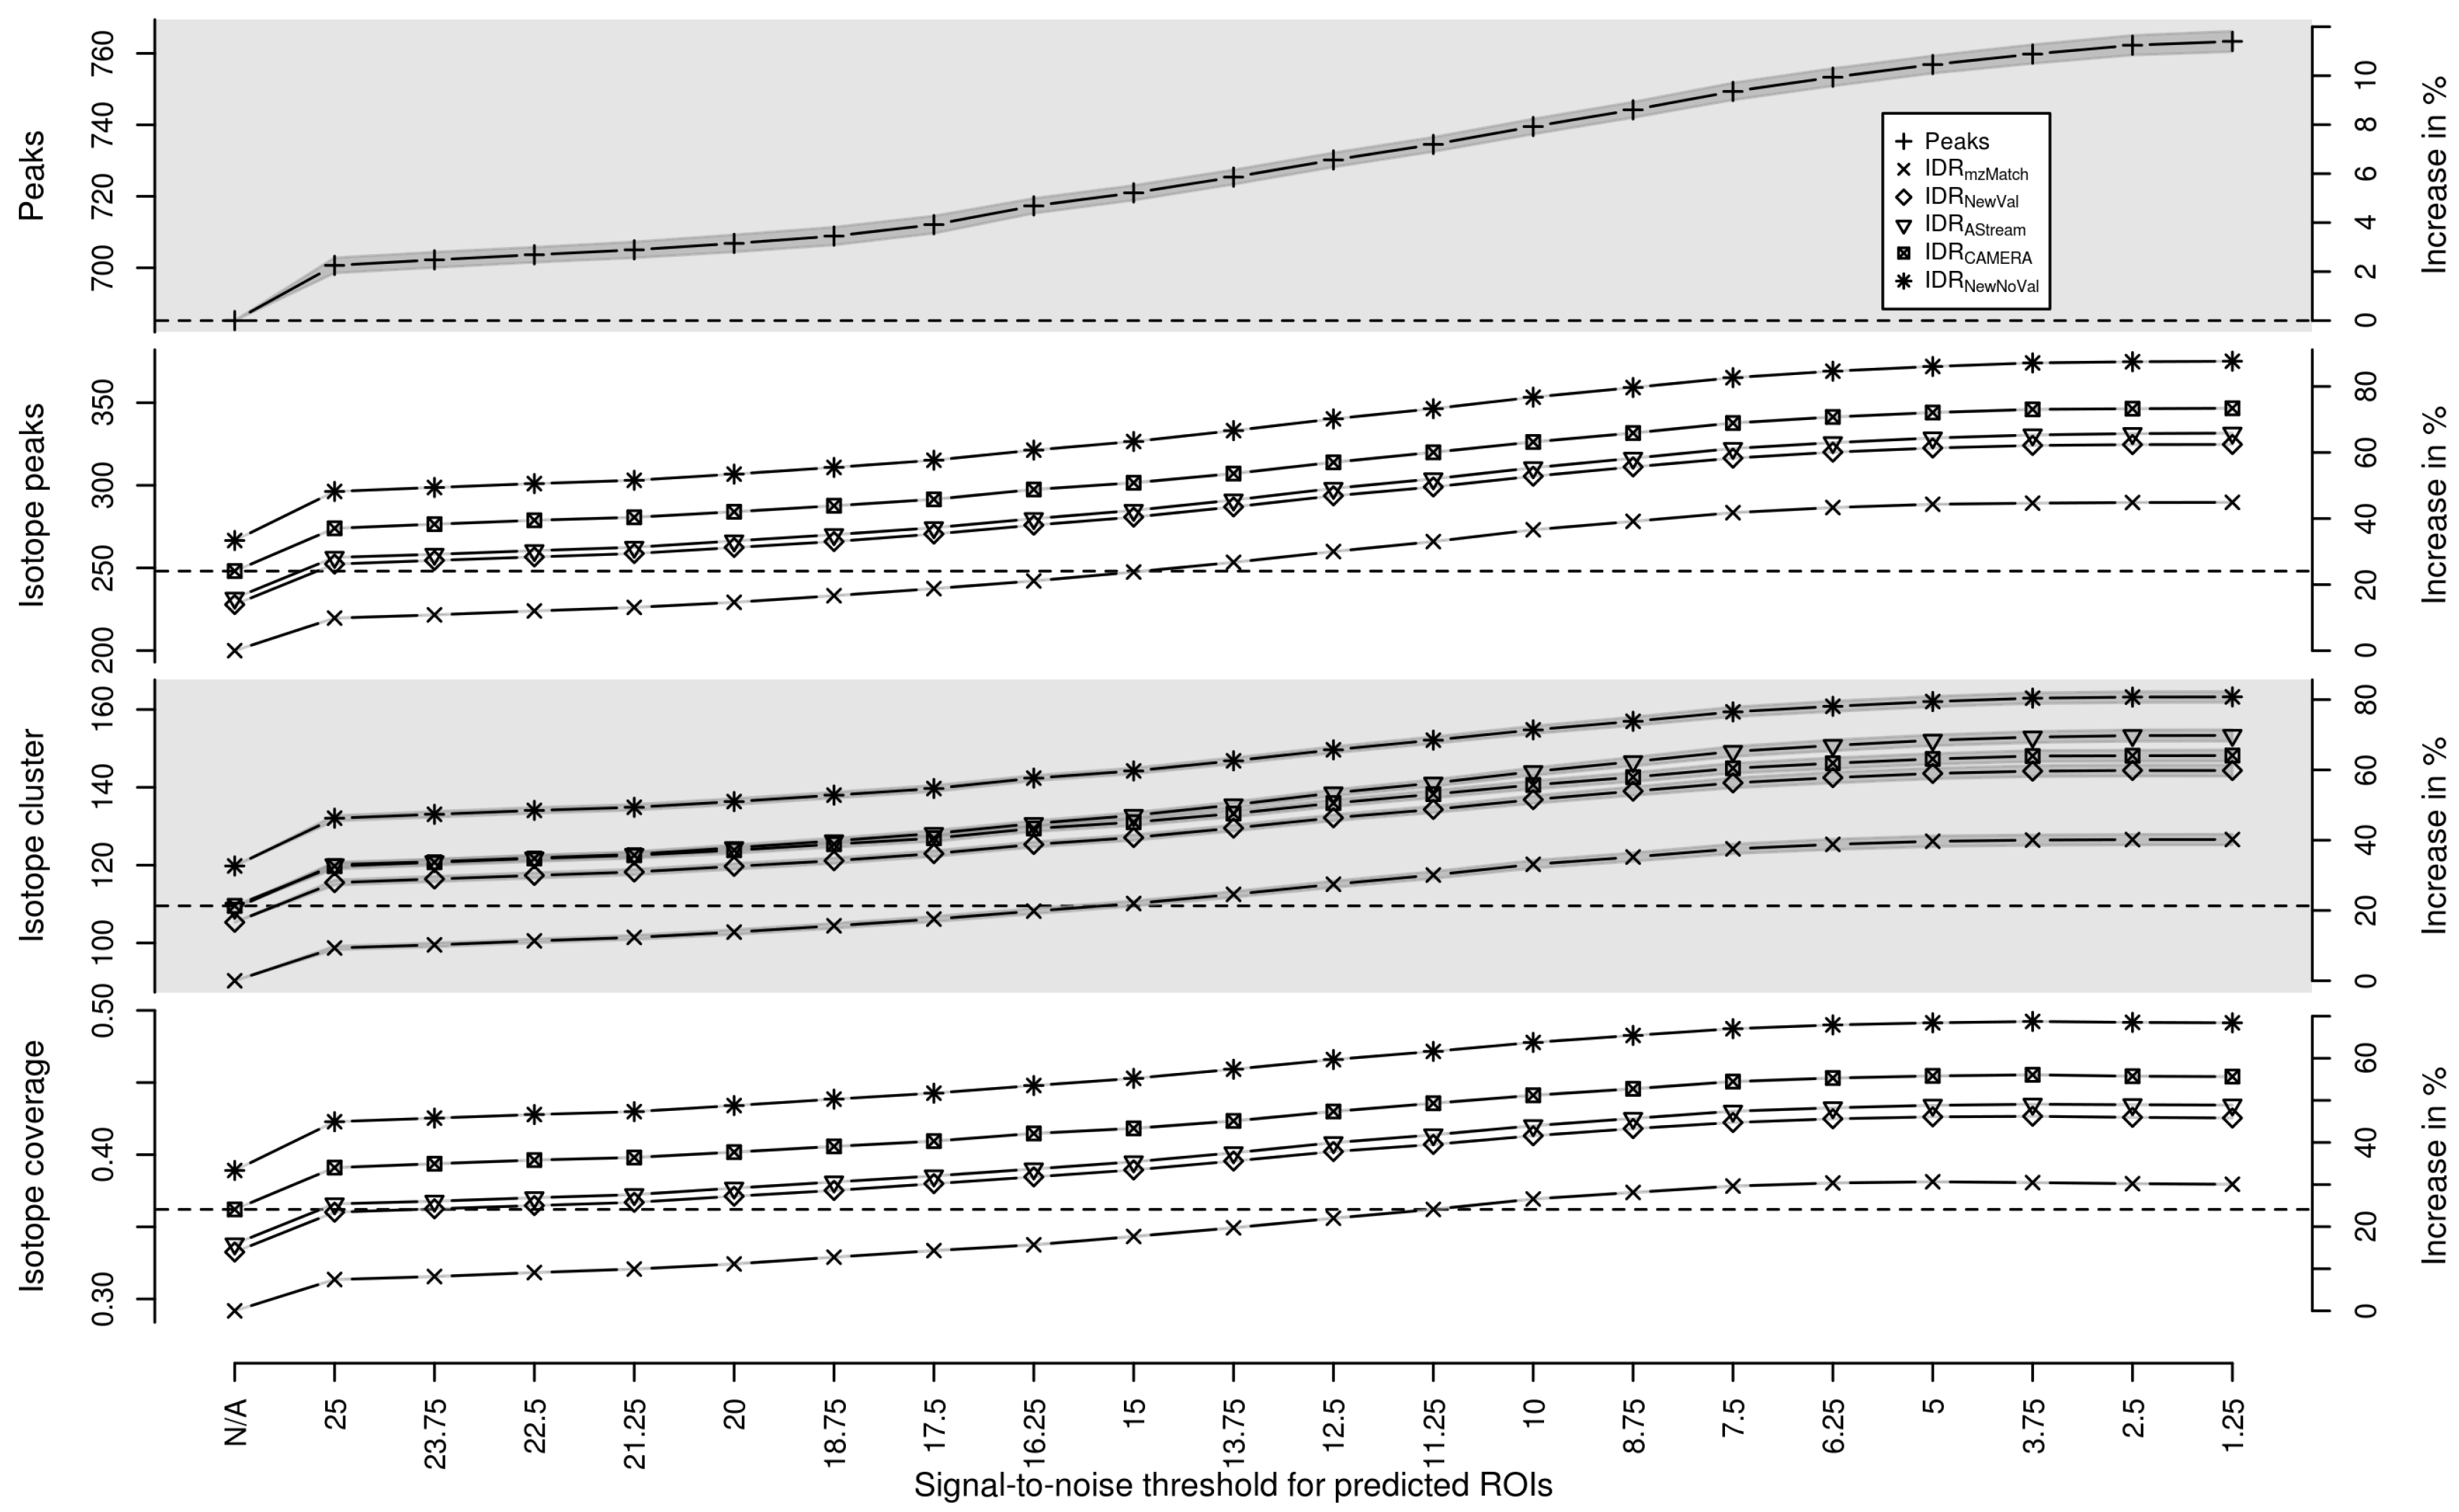
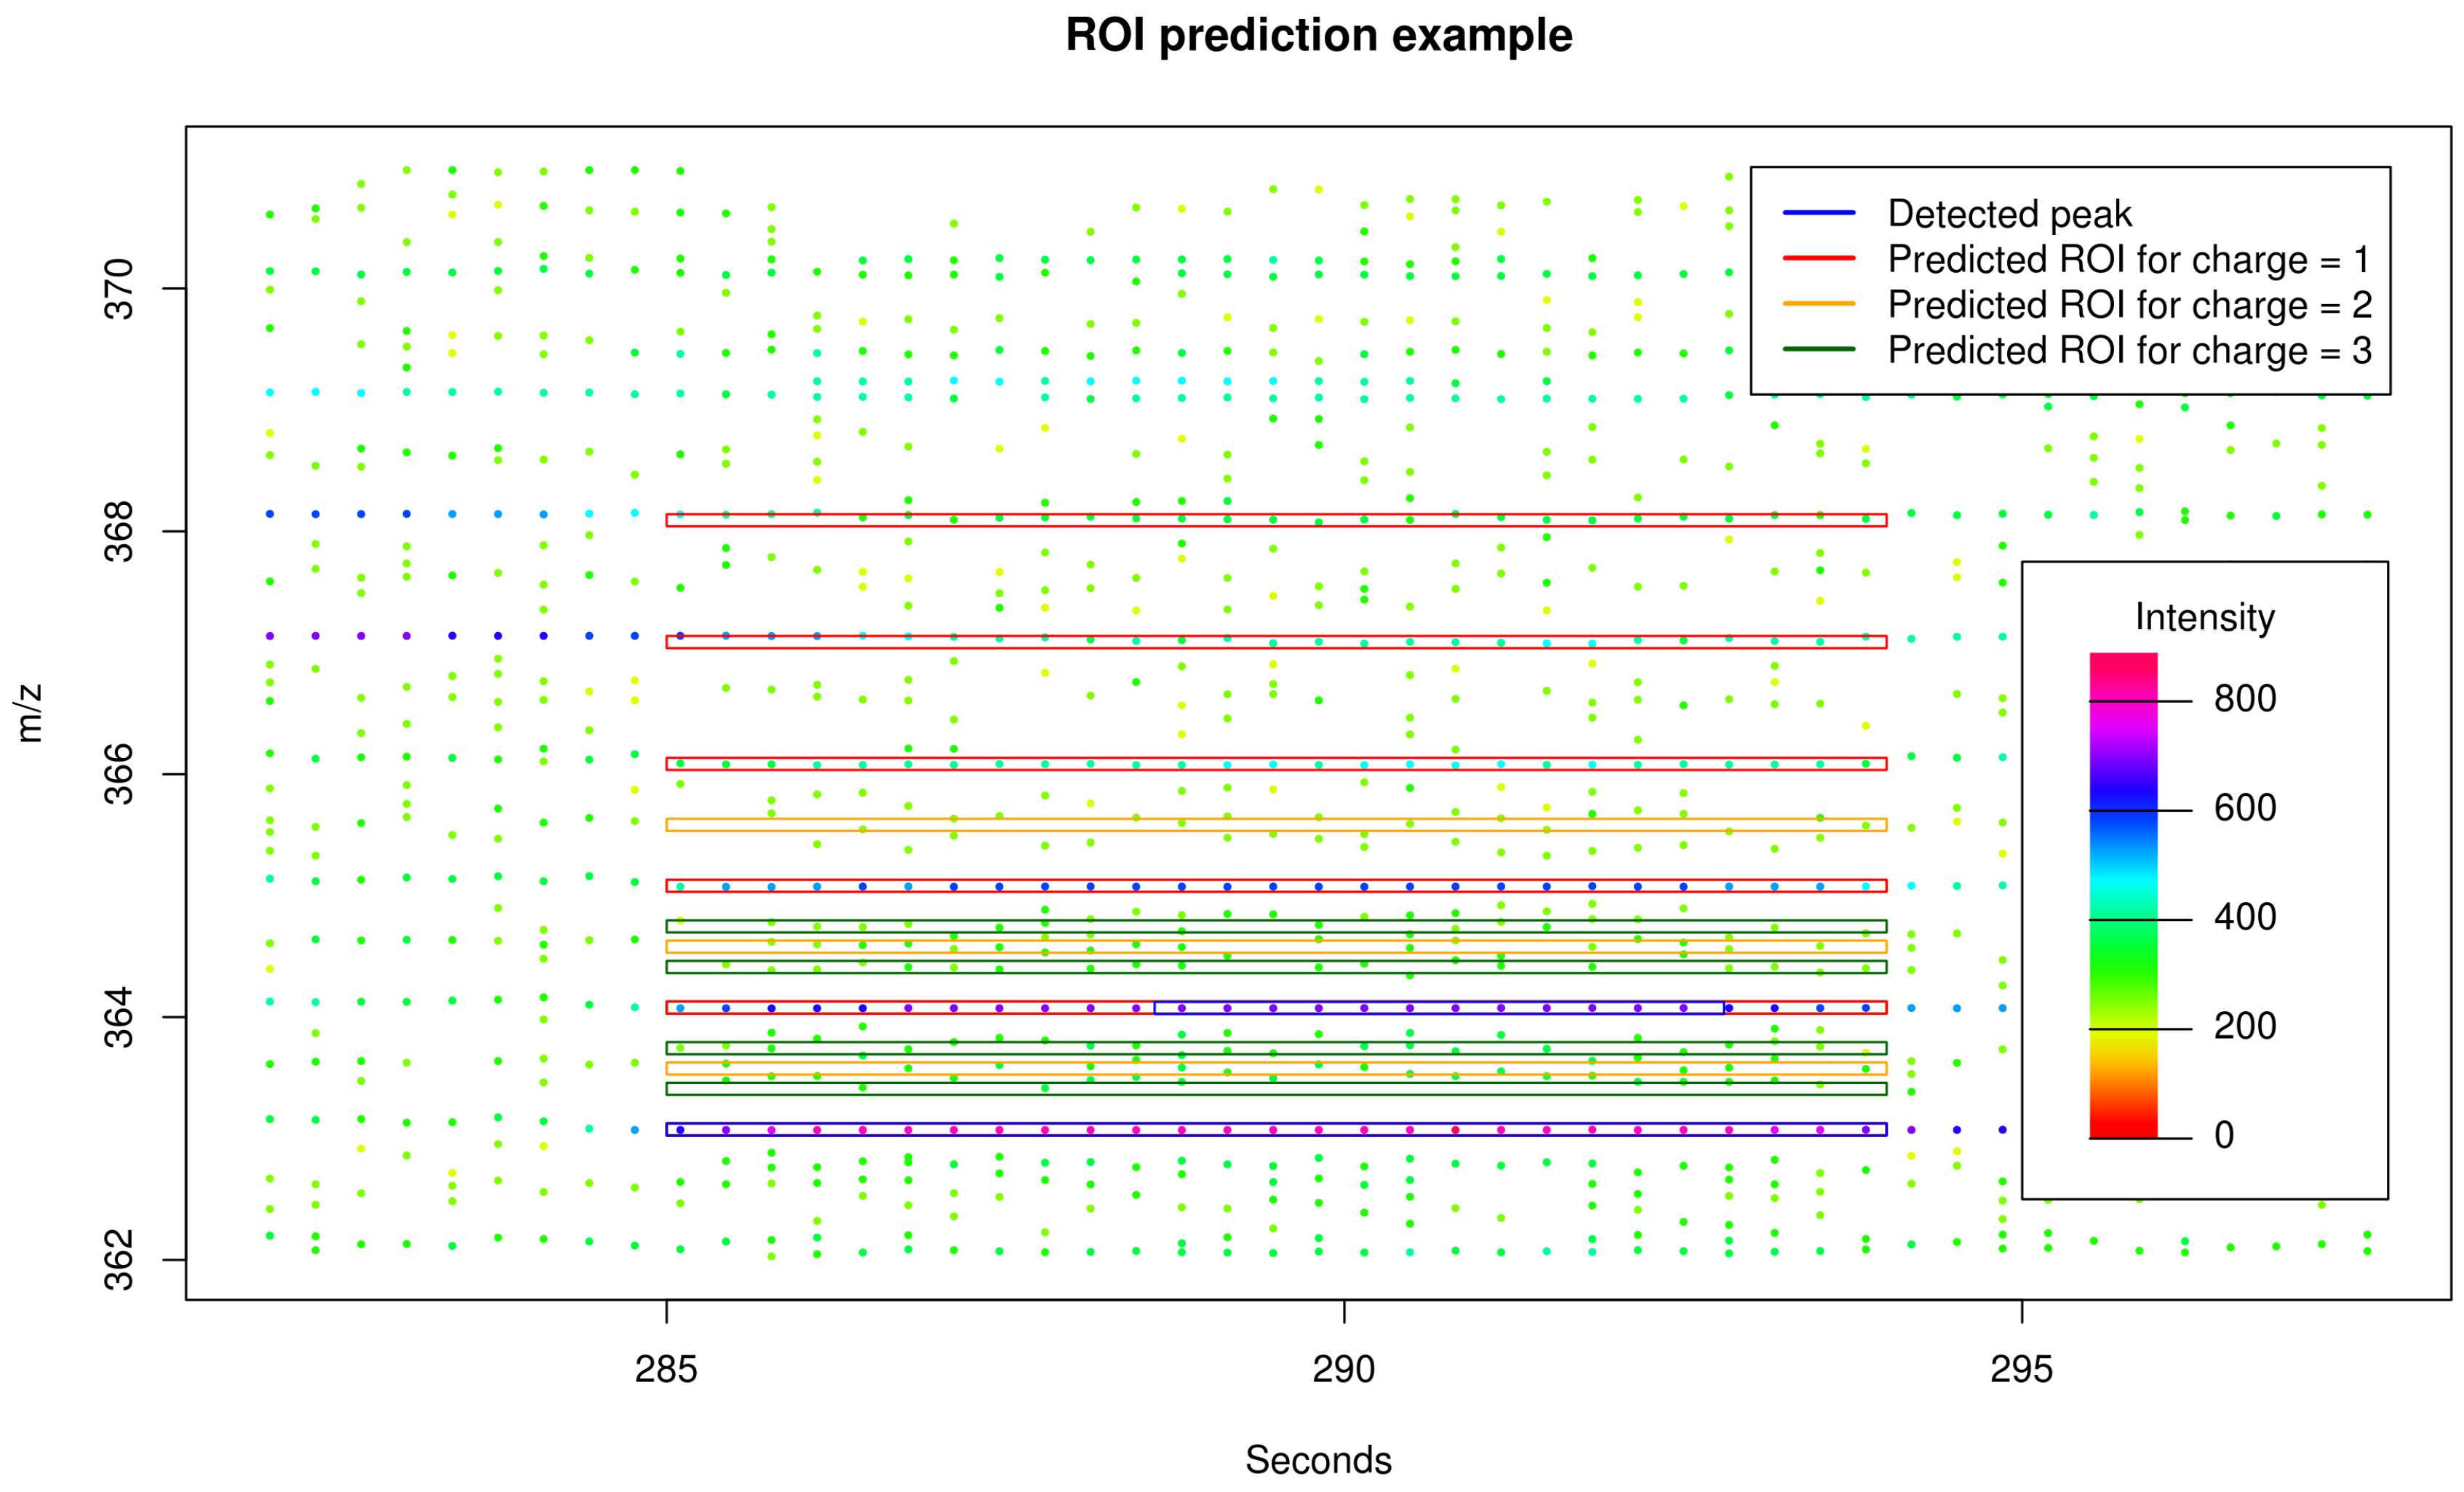
2.2. Targeted Peak Picking Using Predicted Isotope ROIs
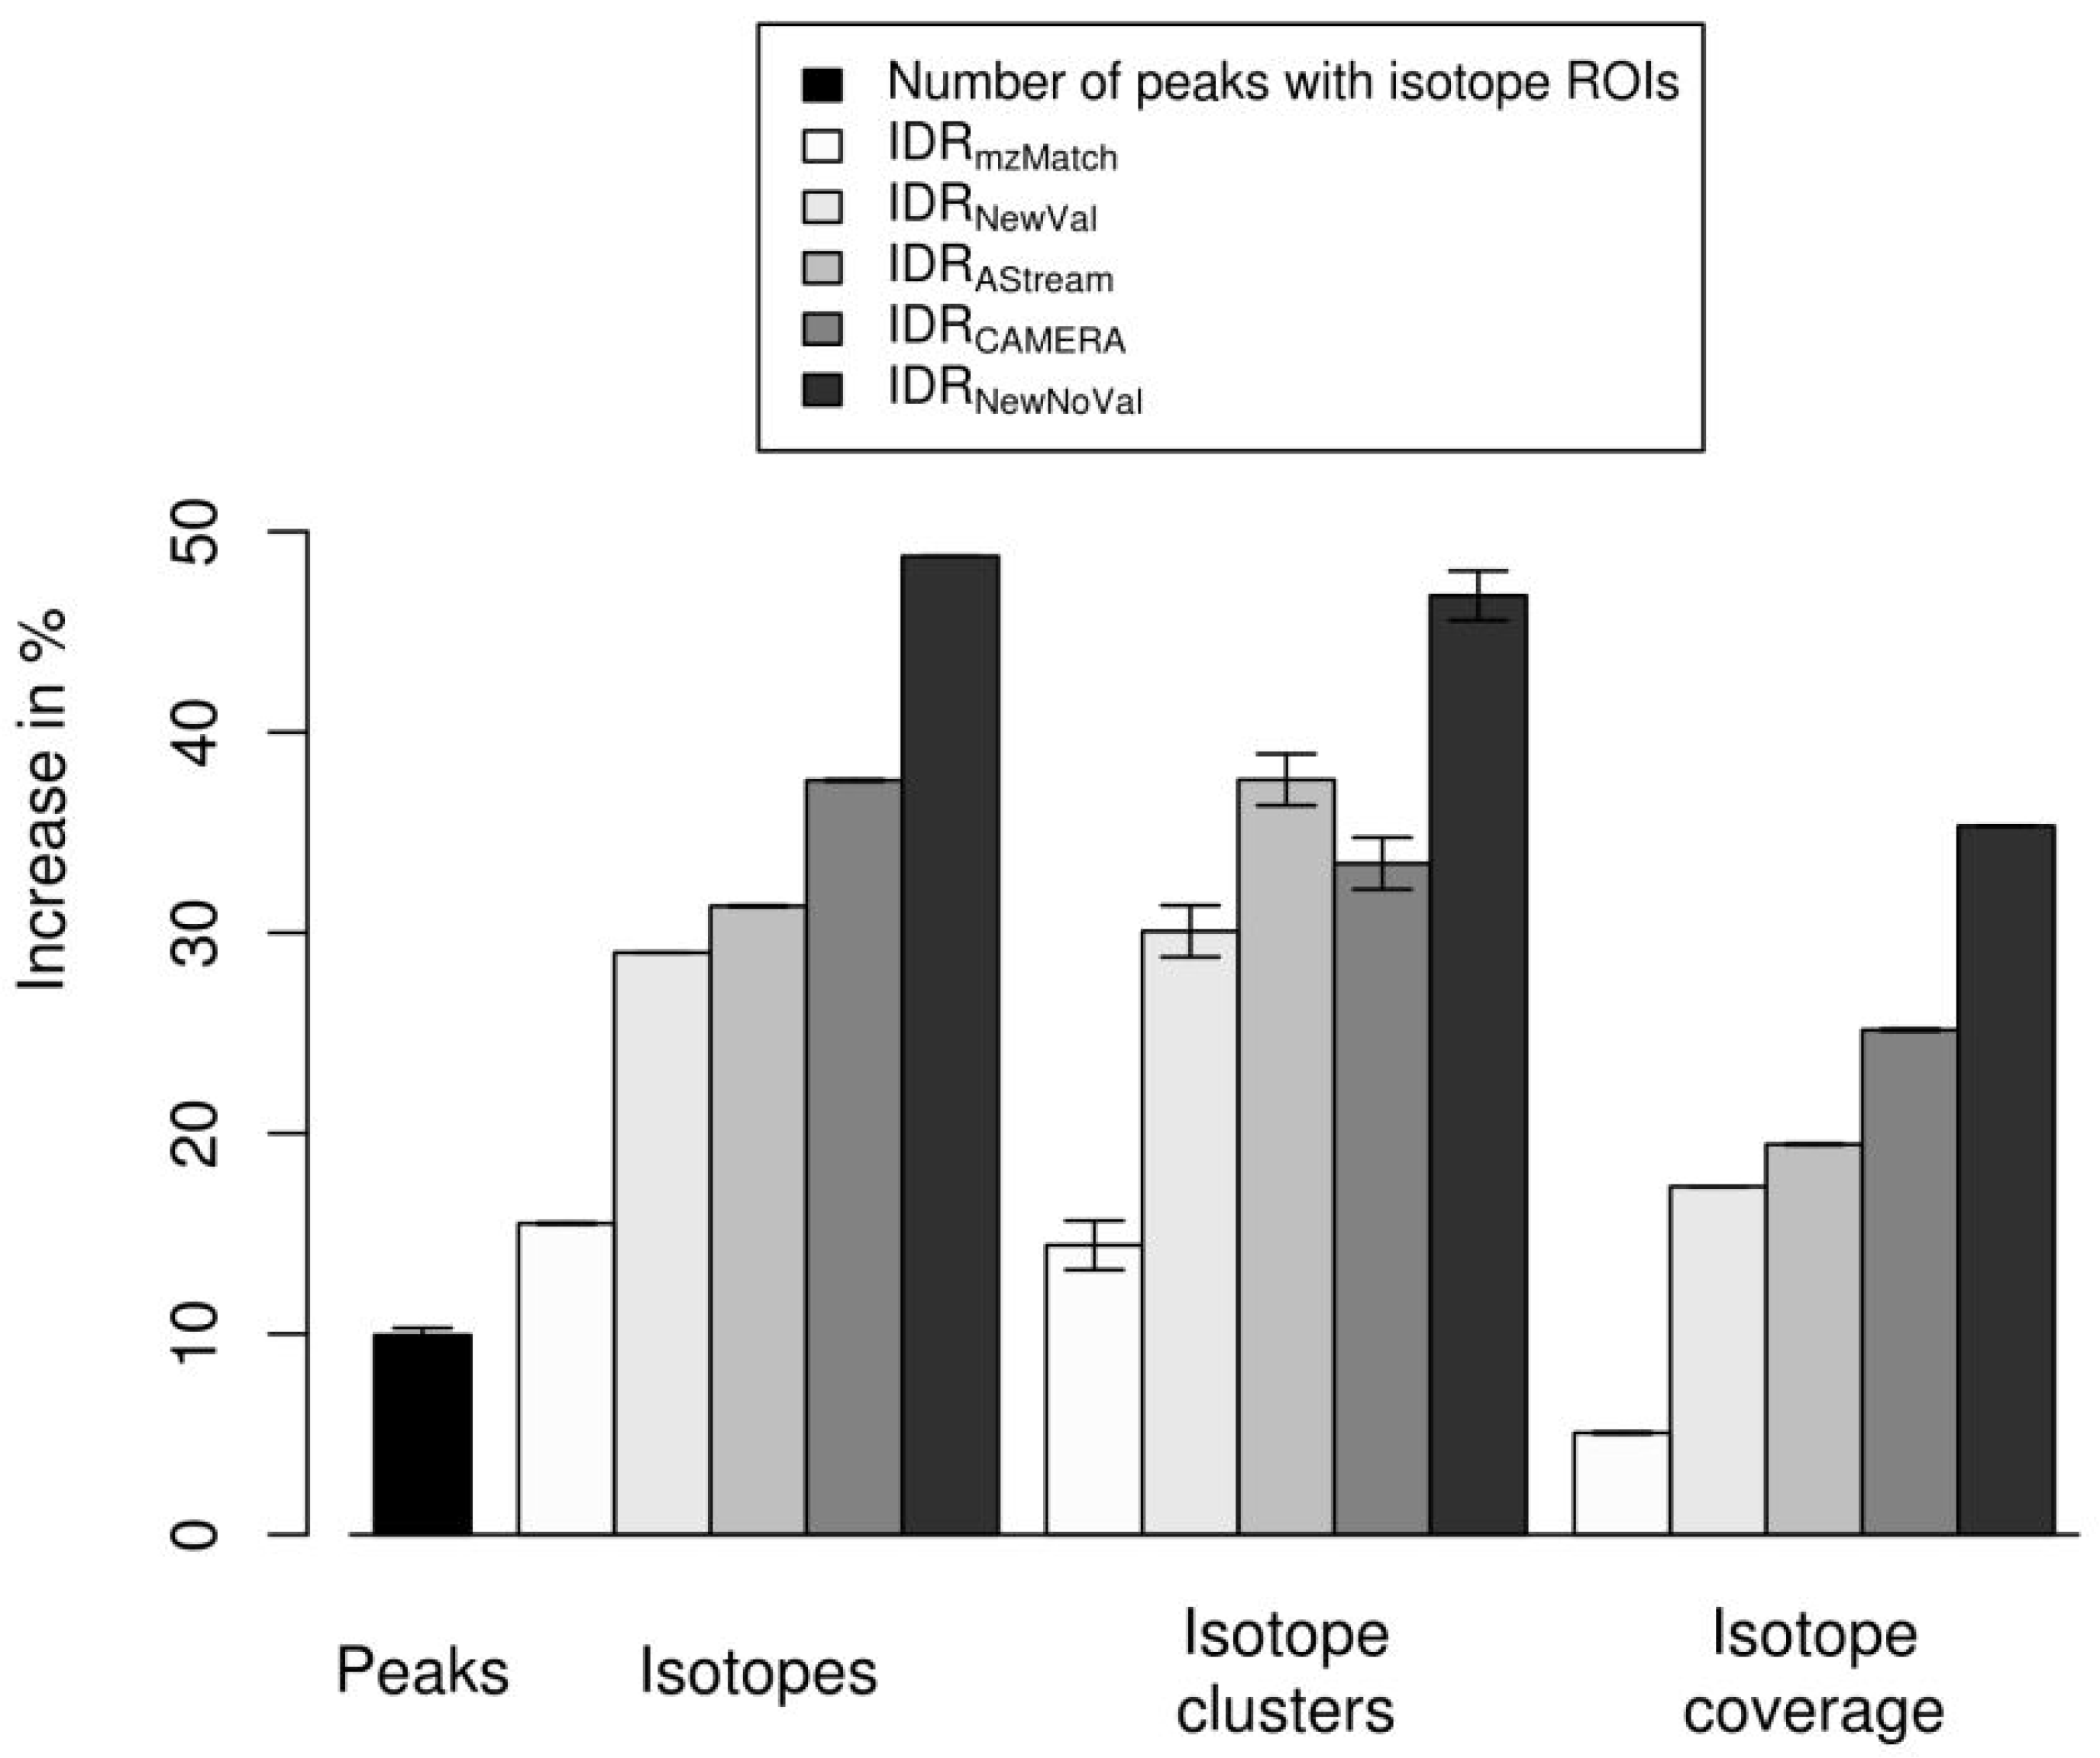
2.3. Isotope Cluster Detection and Validation
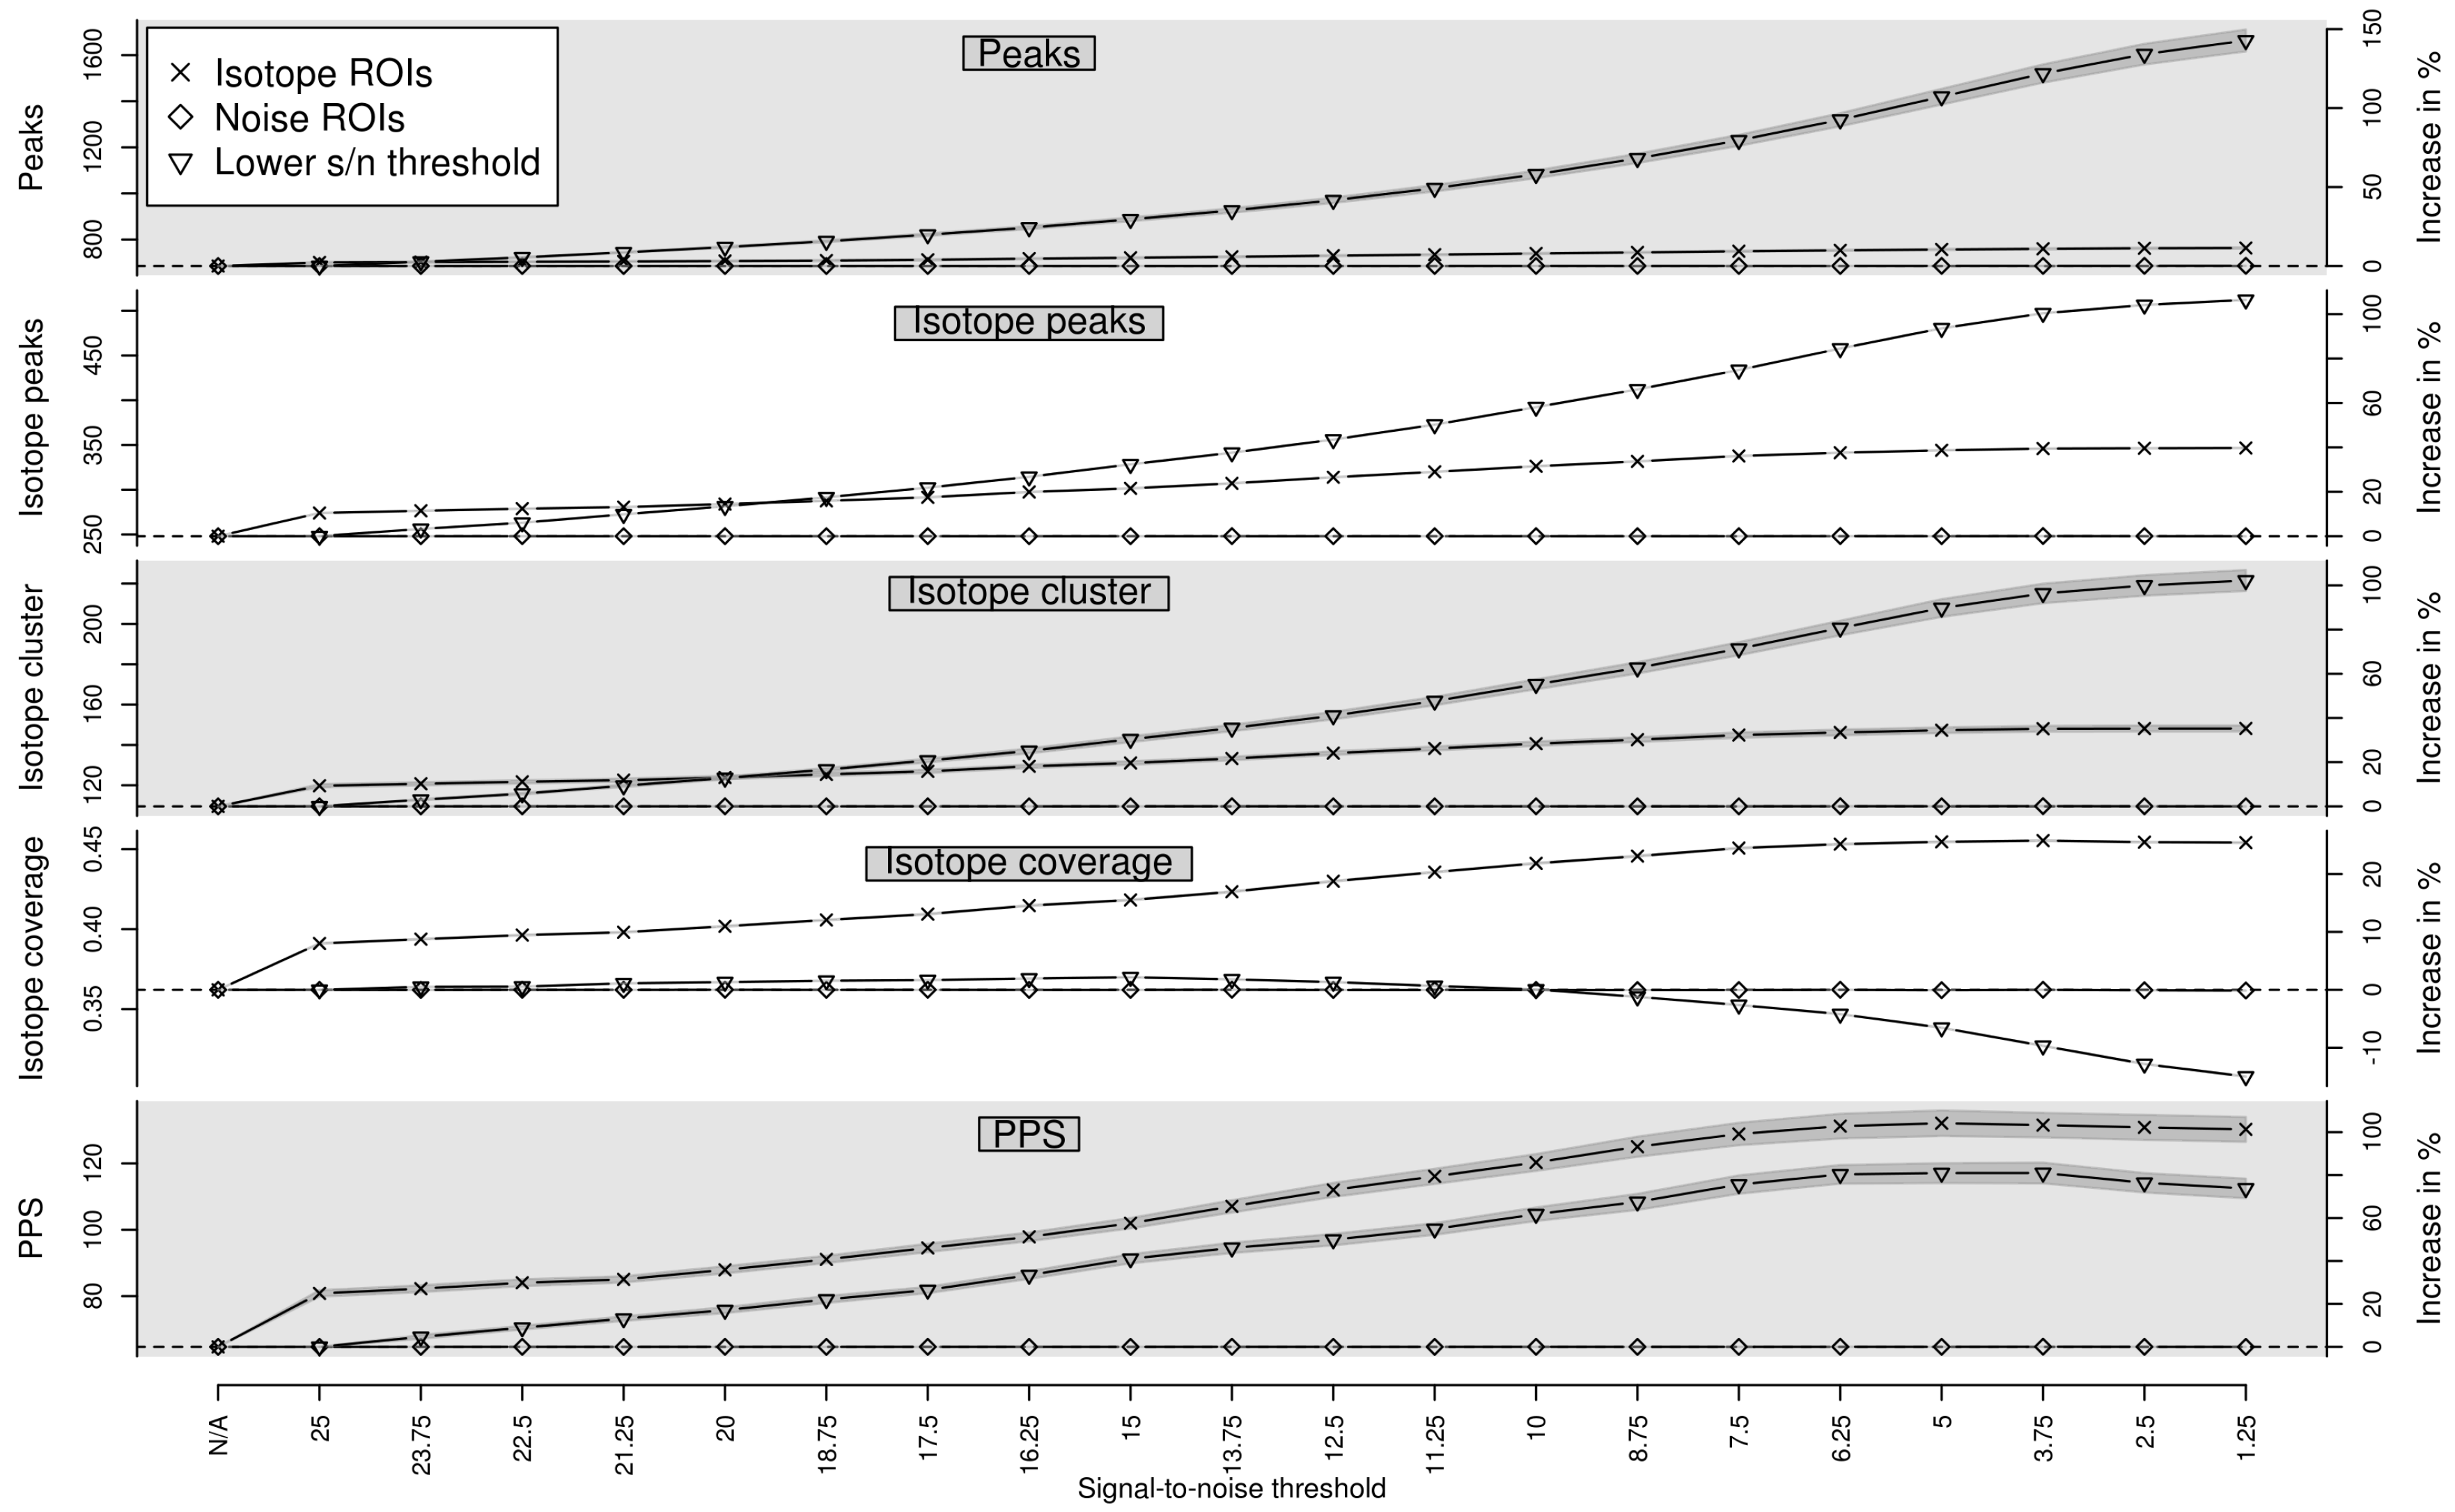
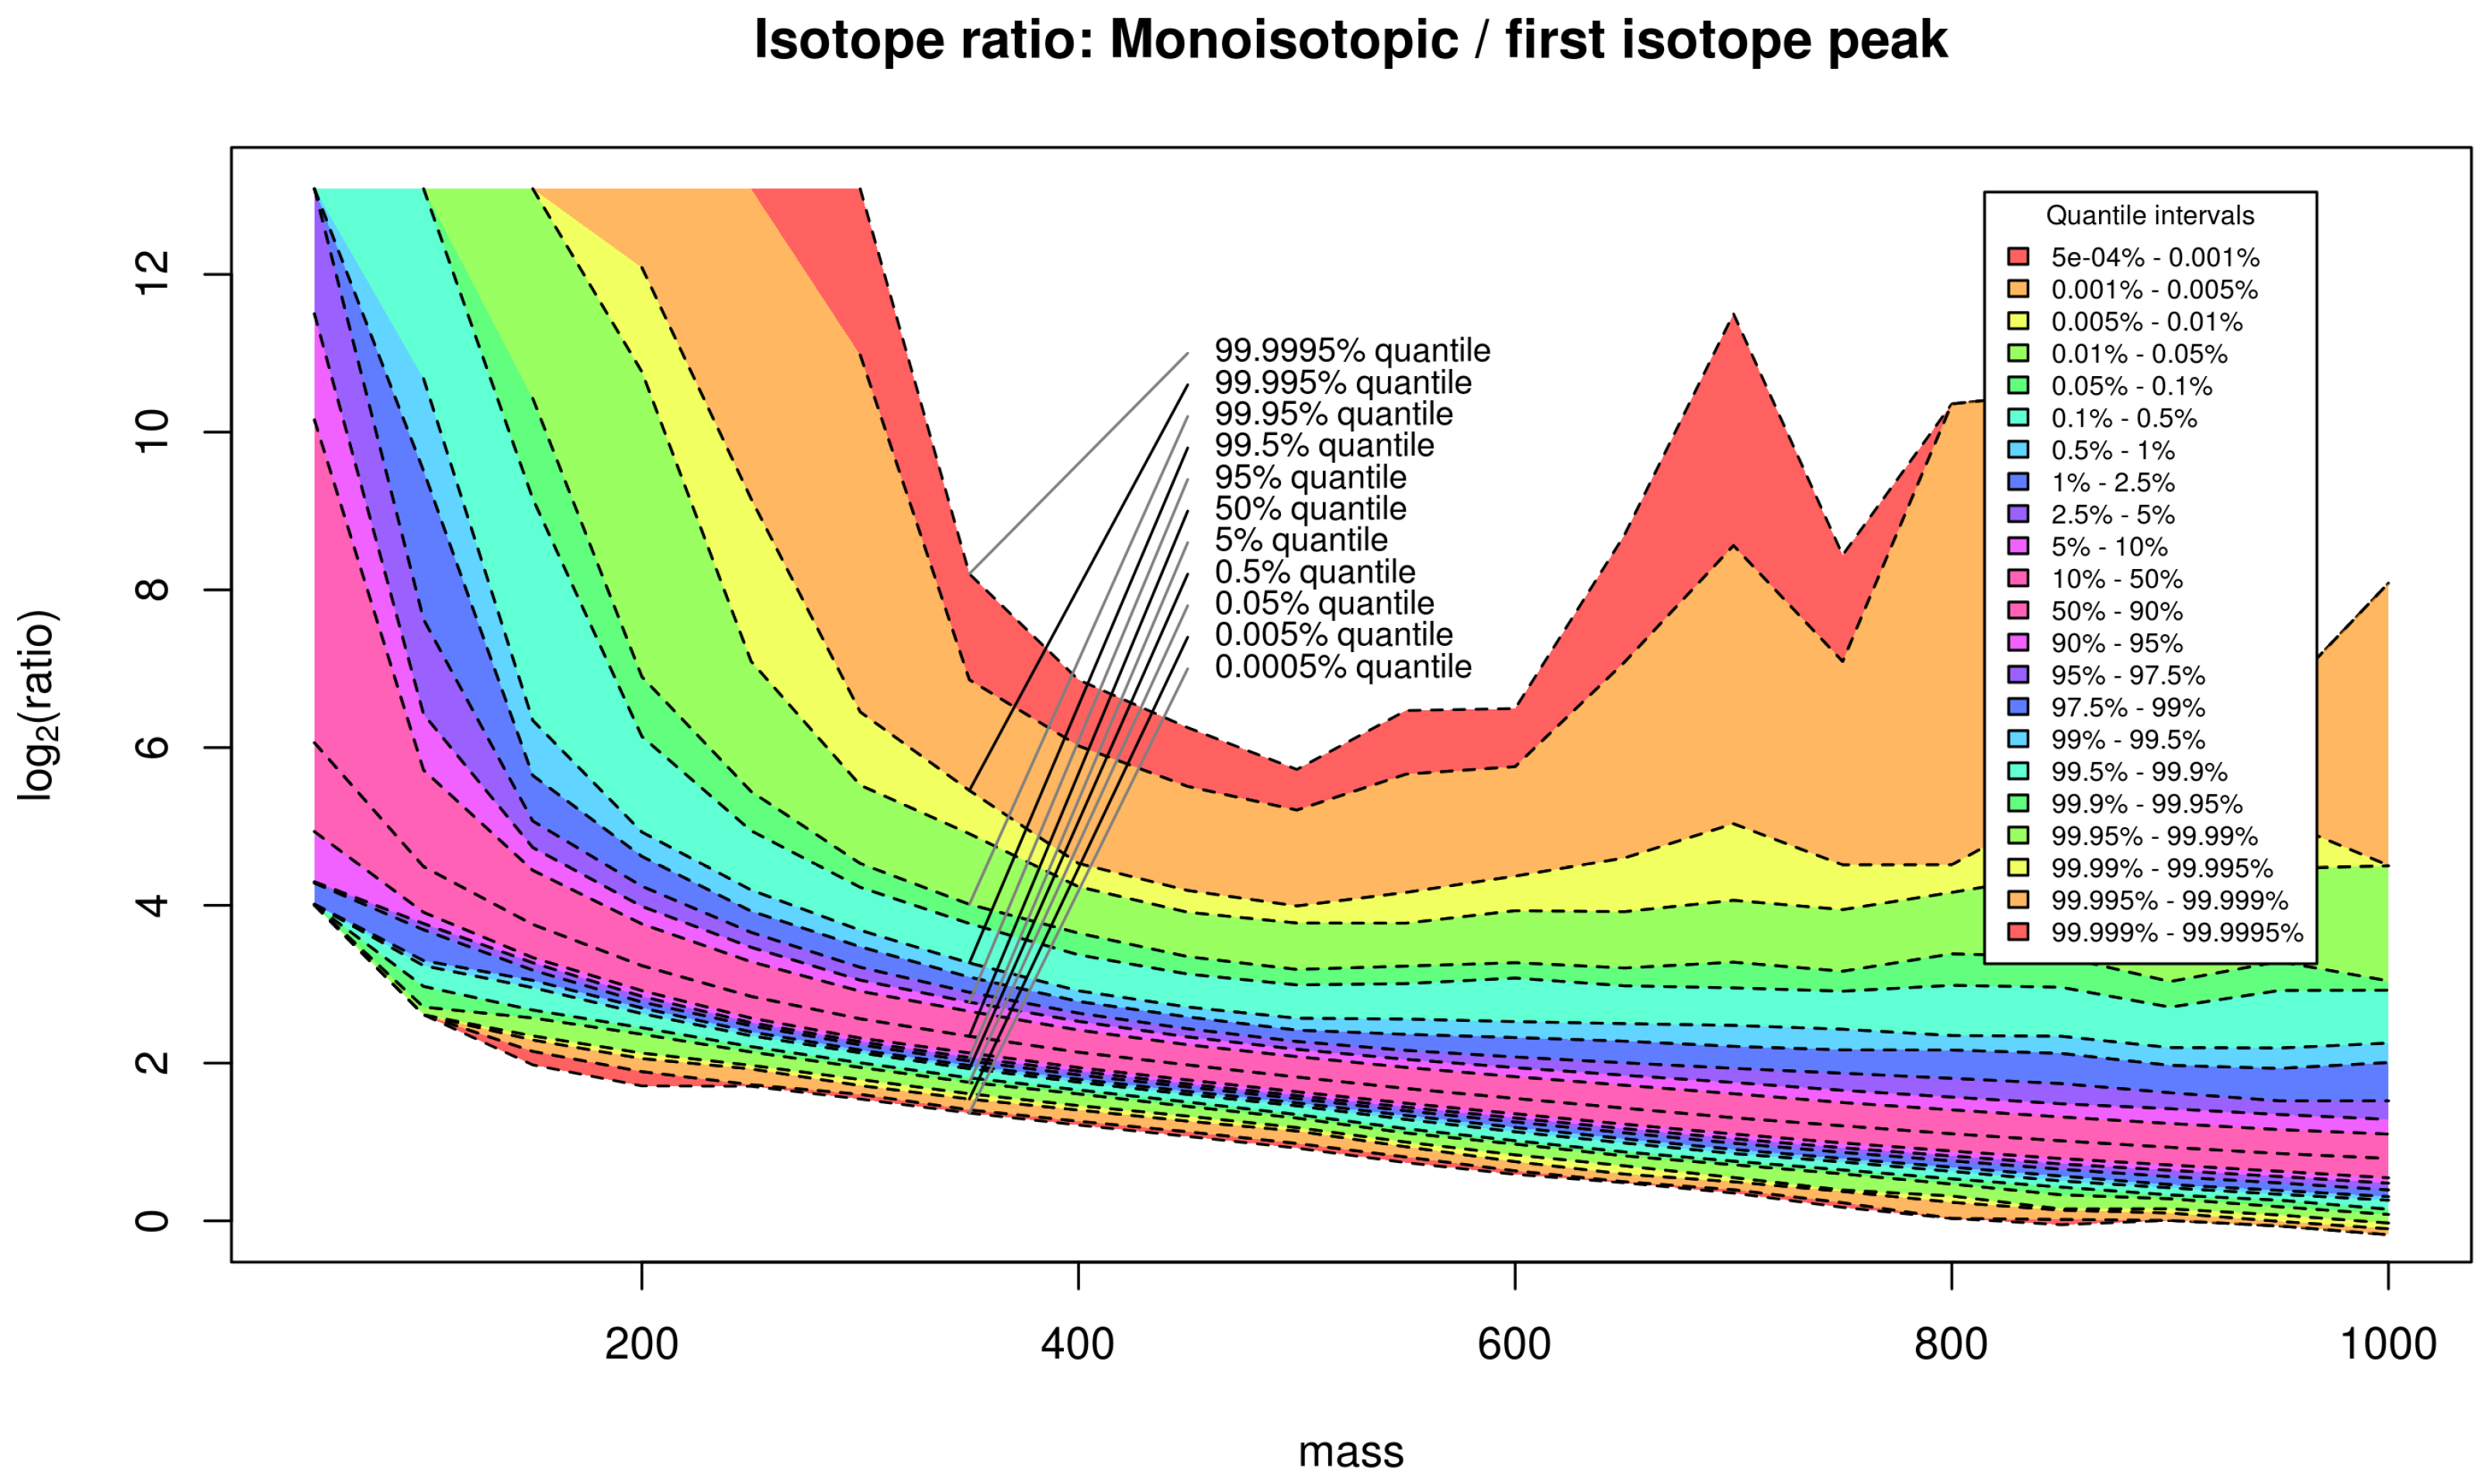
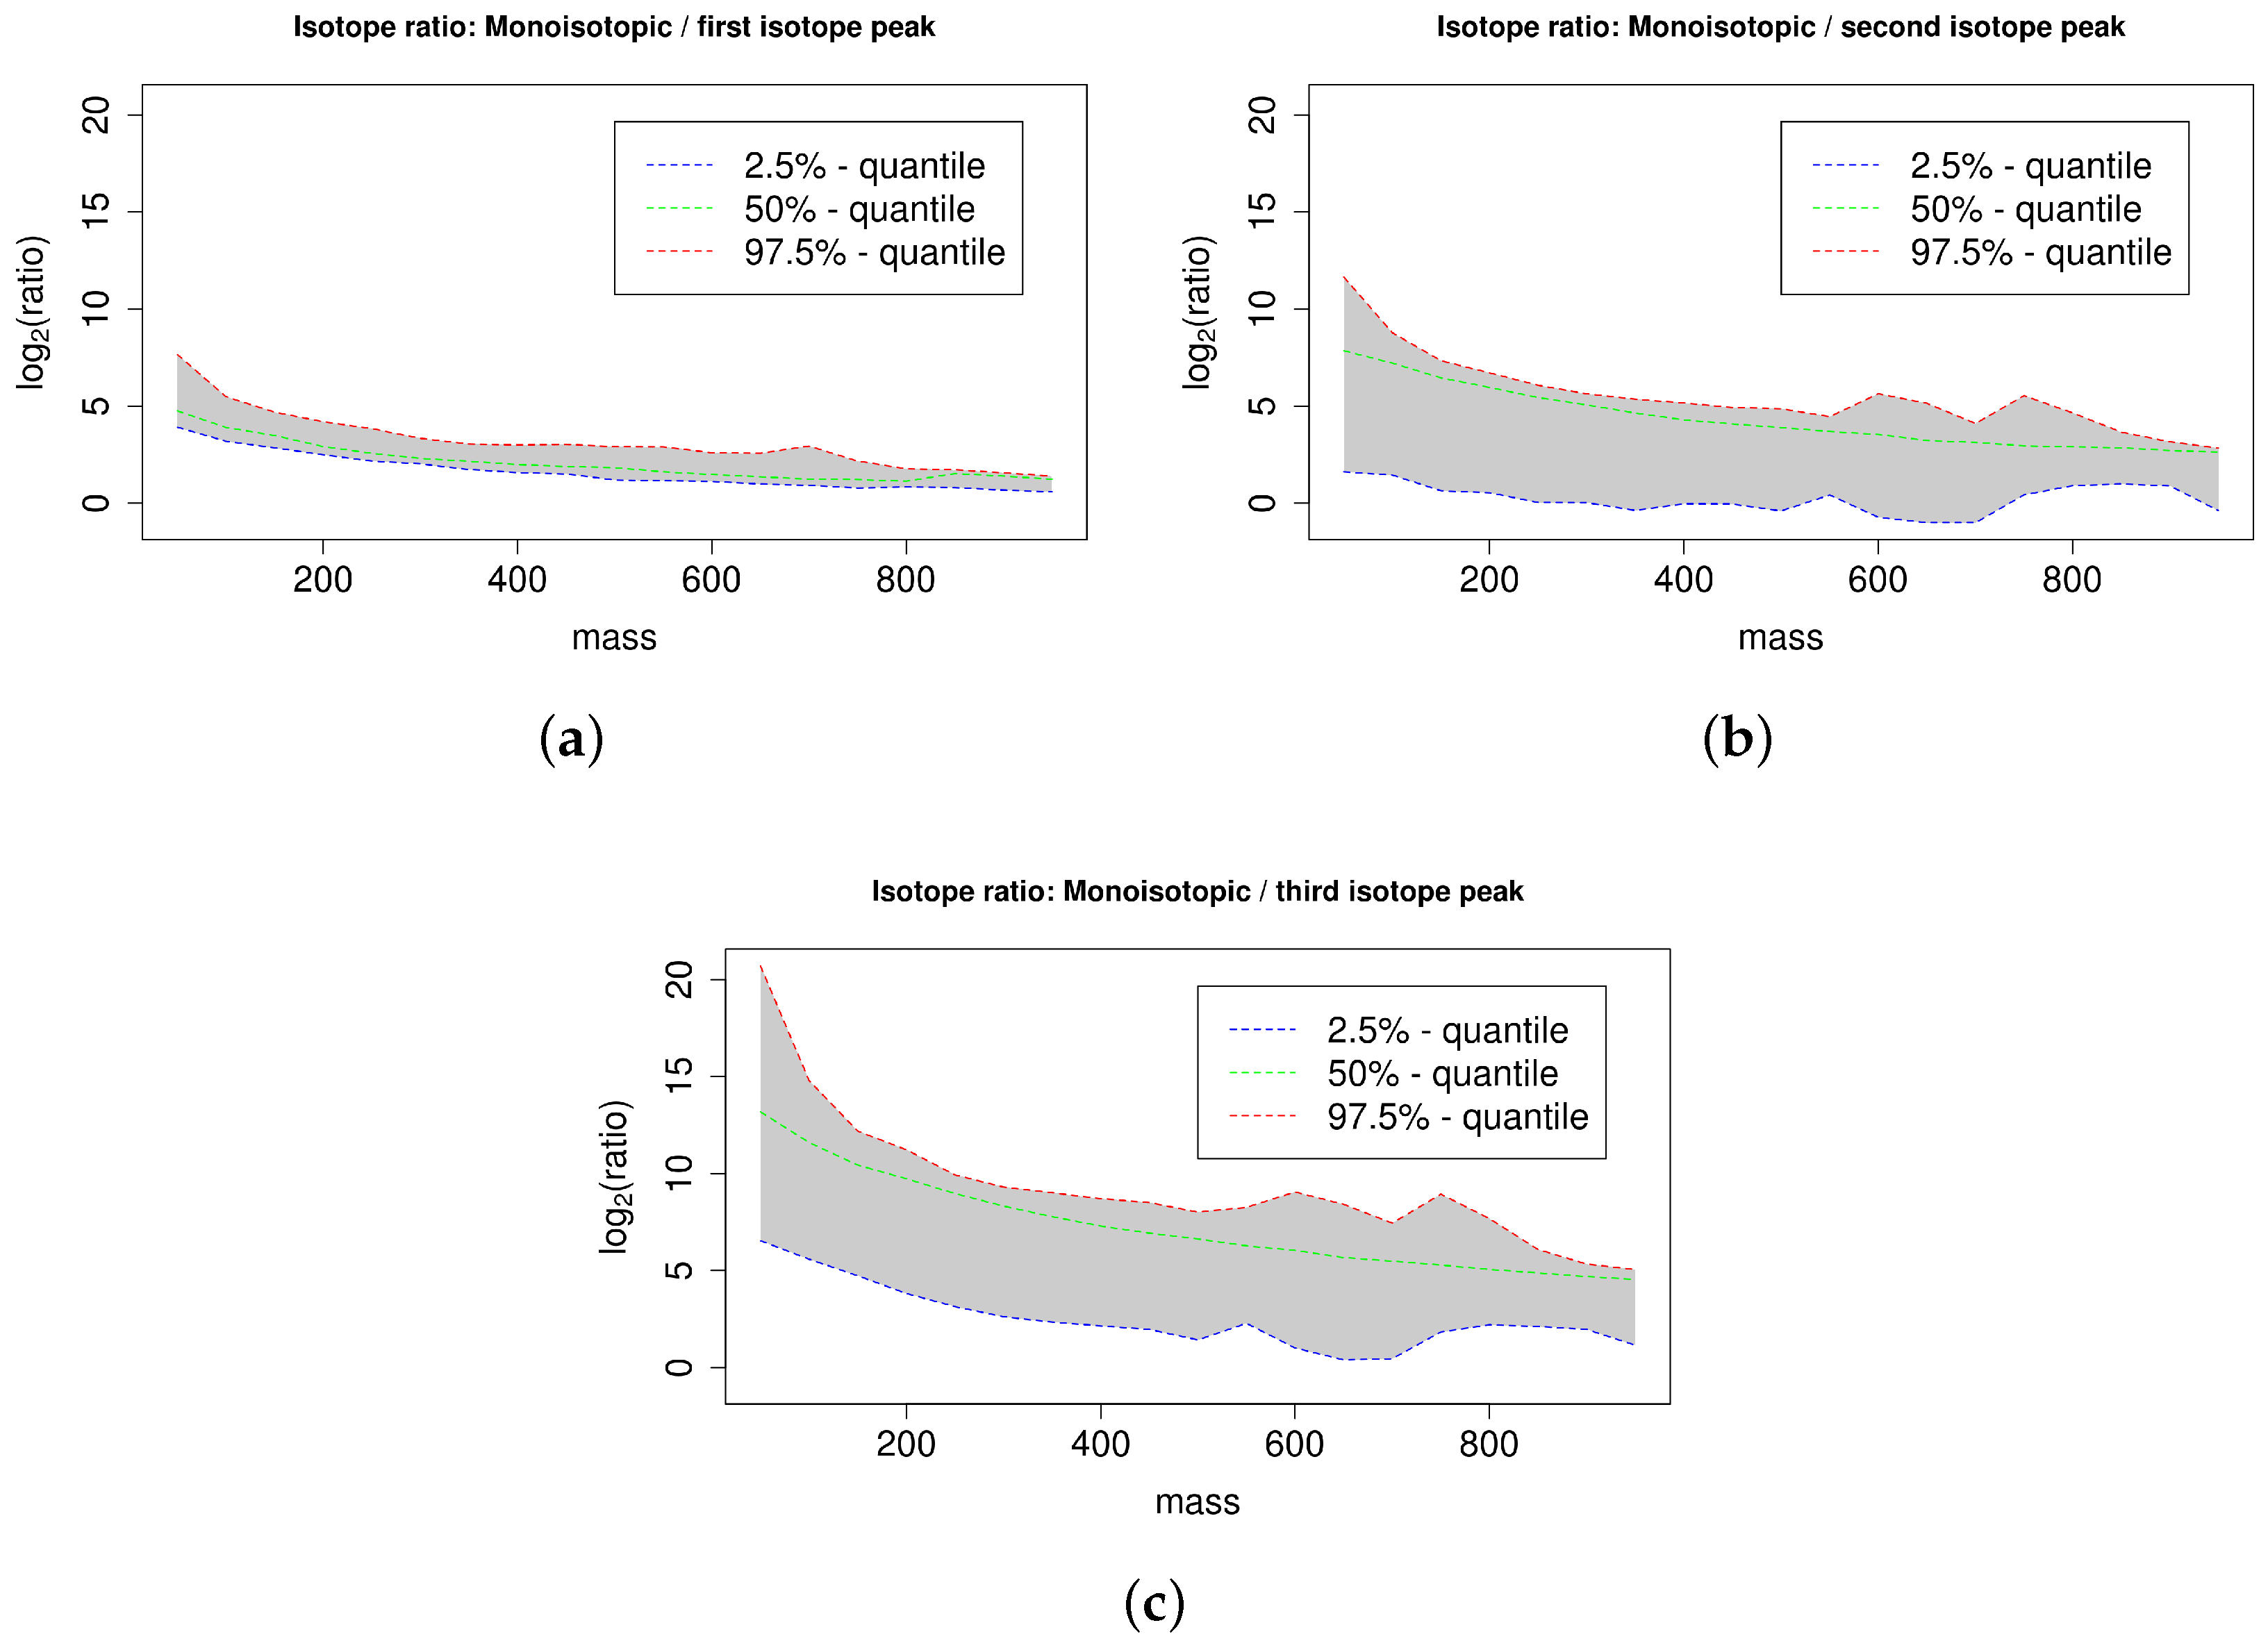
2.4. Isotope Cluster Statistics
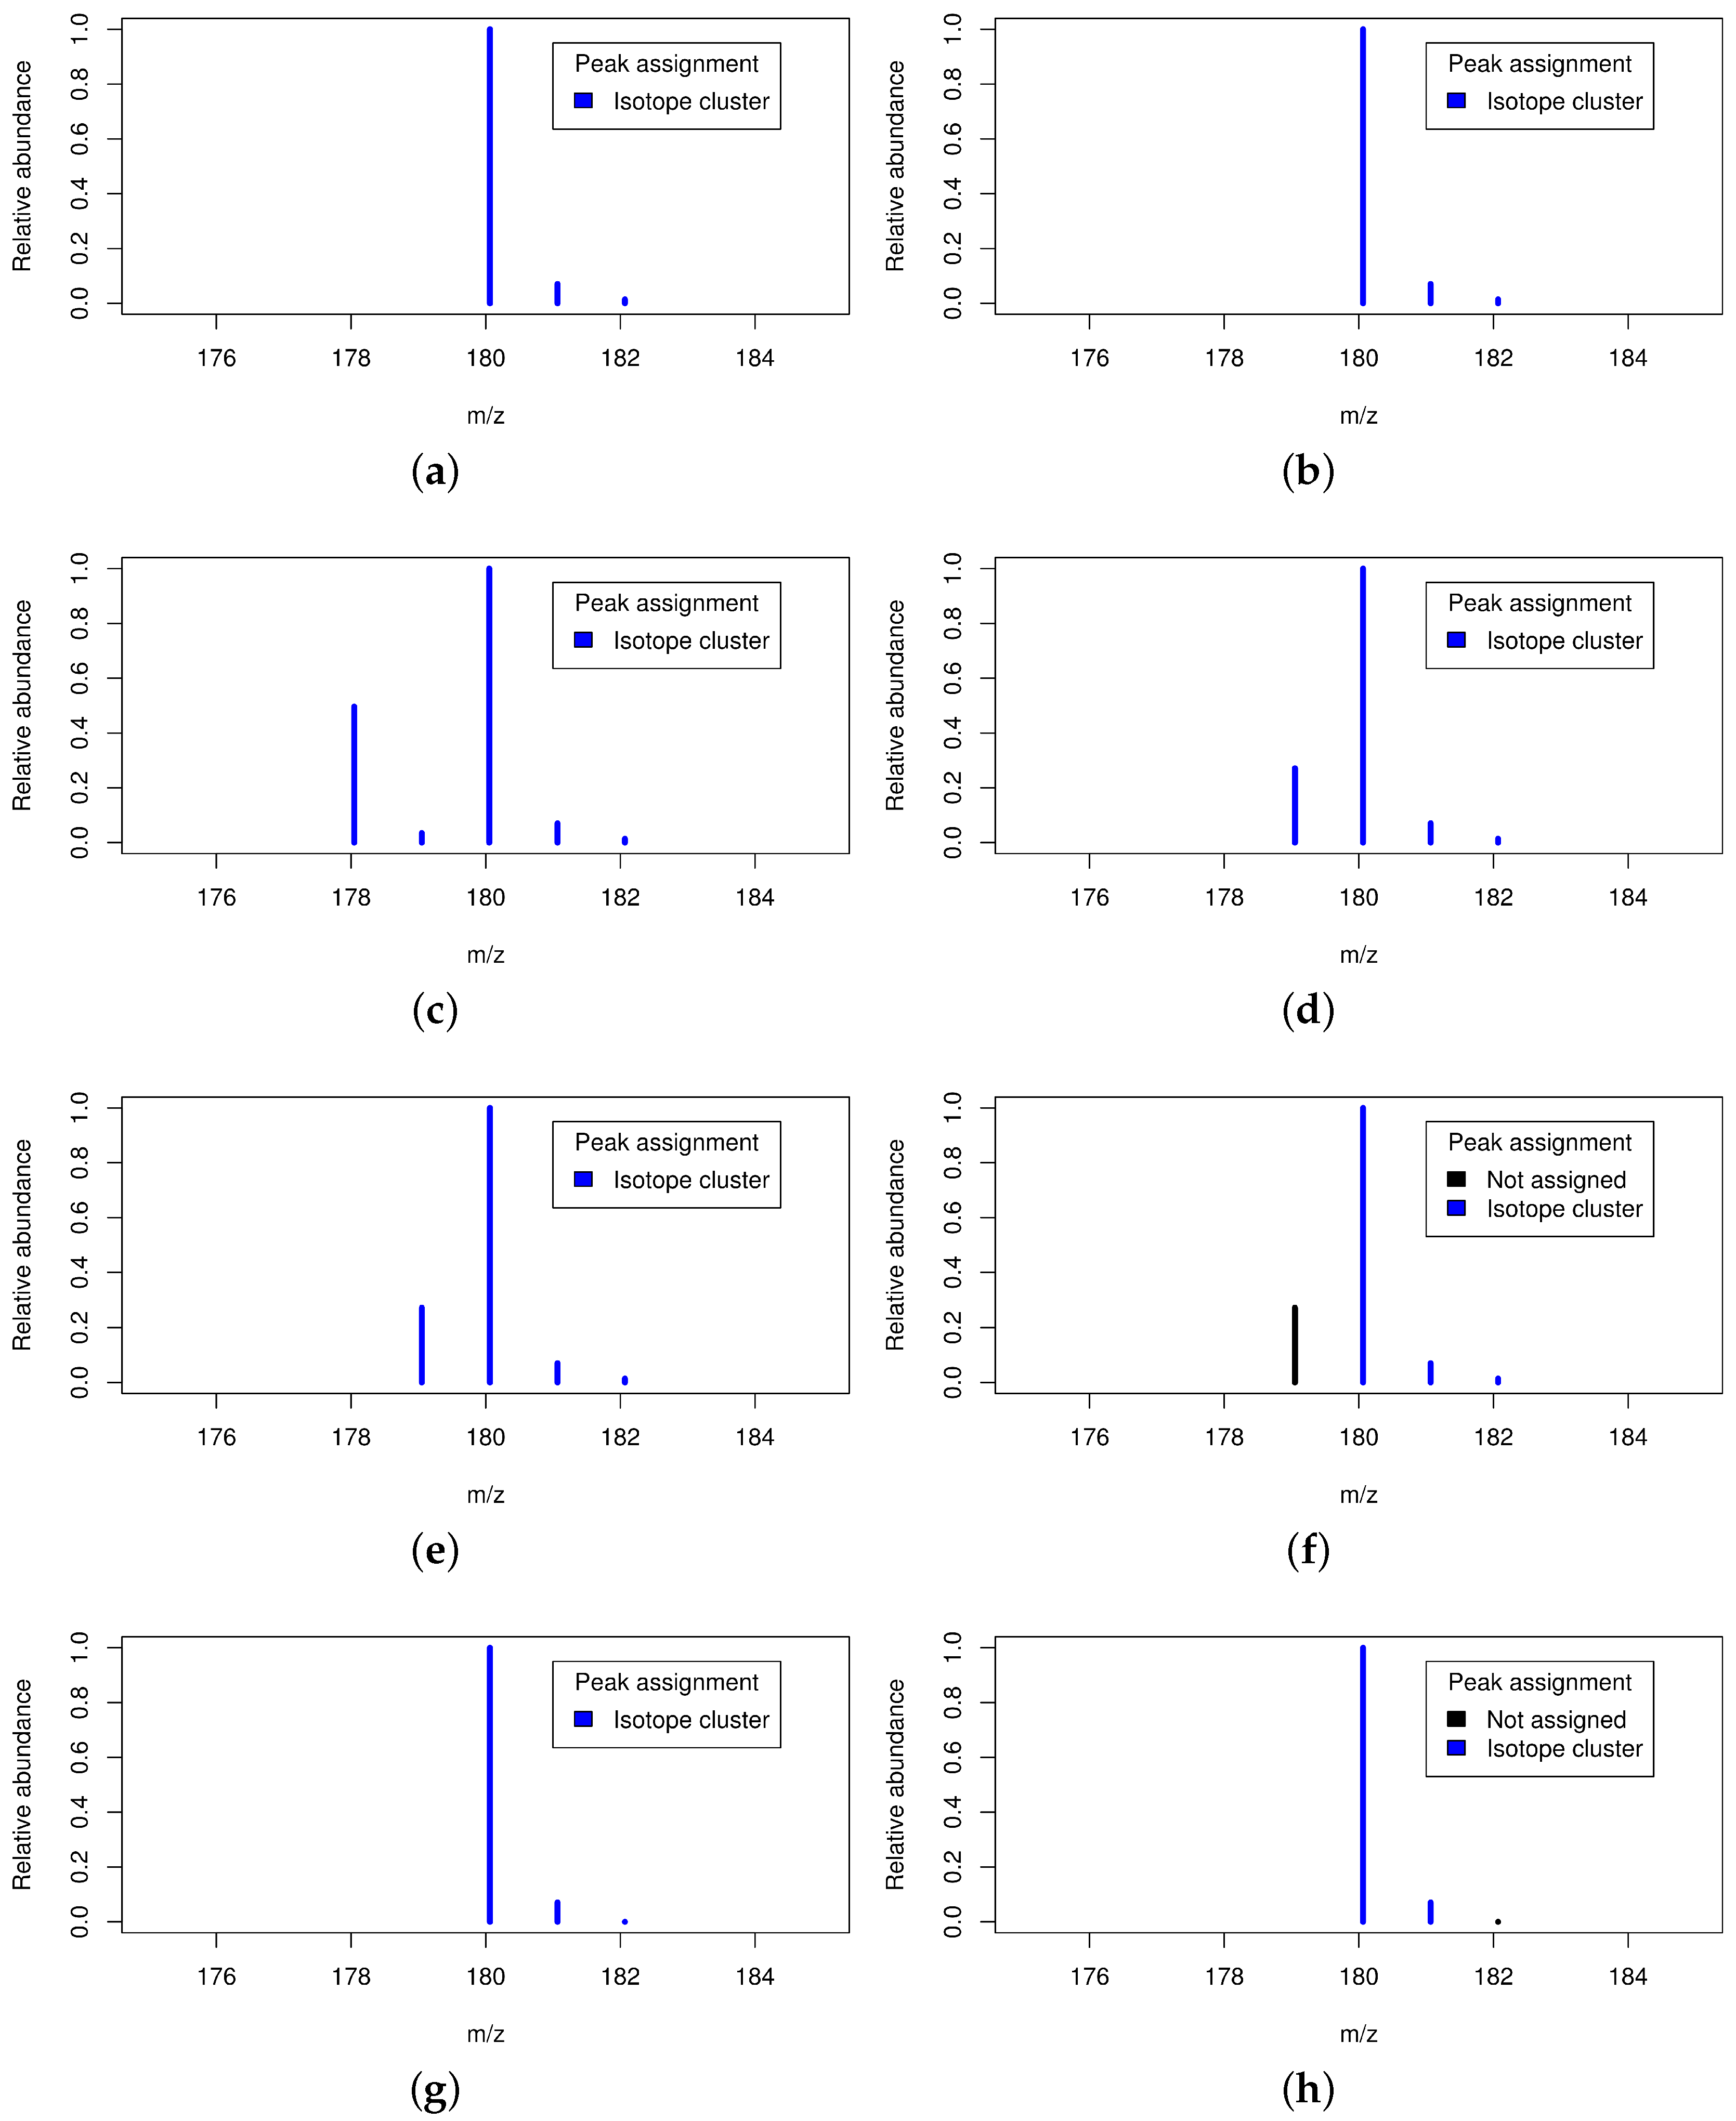
2.5. Exemplary Isotope Cluster Detection
3. Discussion
4. Materials and Methods
4.1. Targeted Peak Picking with Predicted Isotope ROIs
4.2. Detection and Mass–Specific Validation of Isotope Clusters
4.3. Isotope Ratio Quantiles
4.4. Data Sets
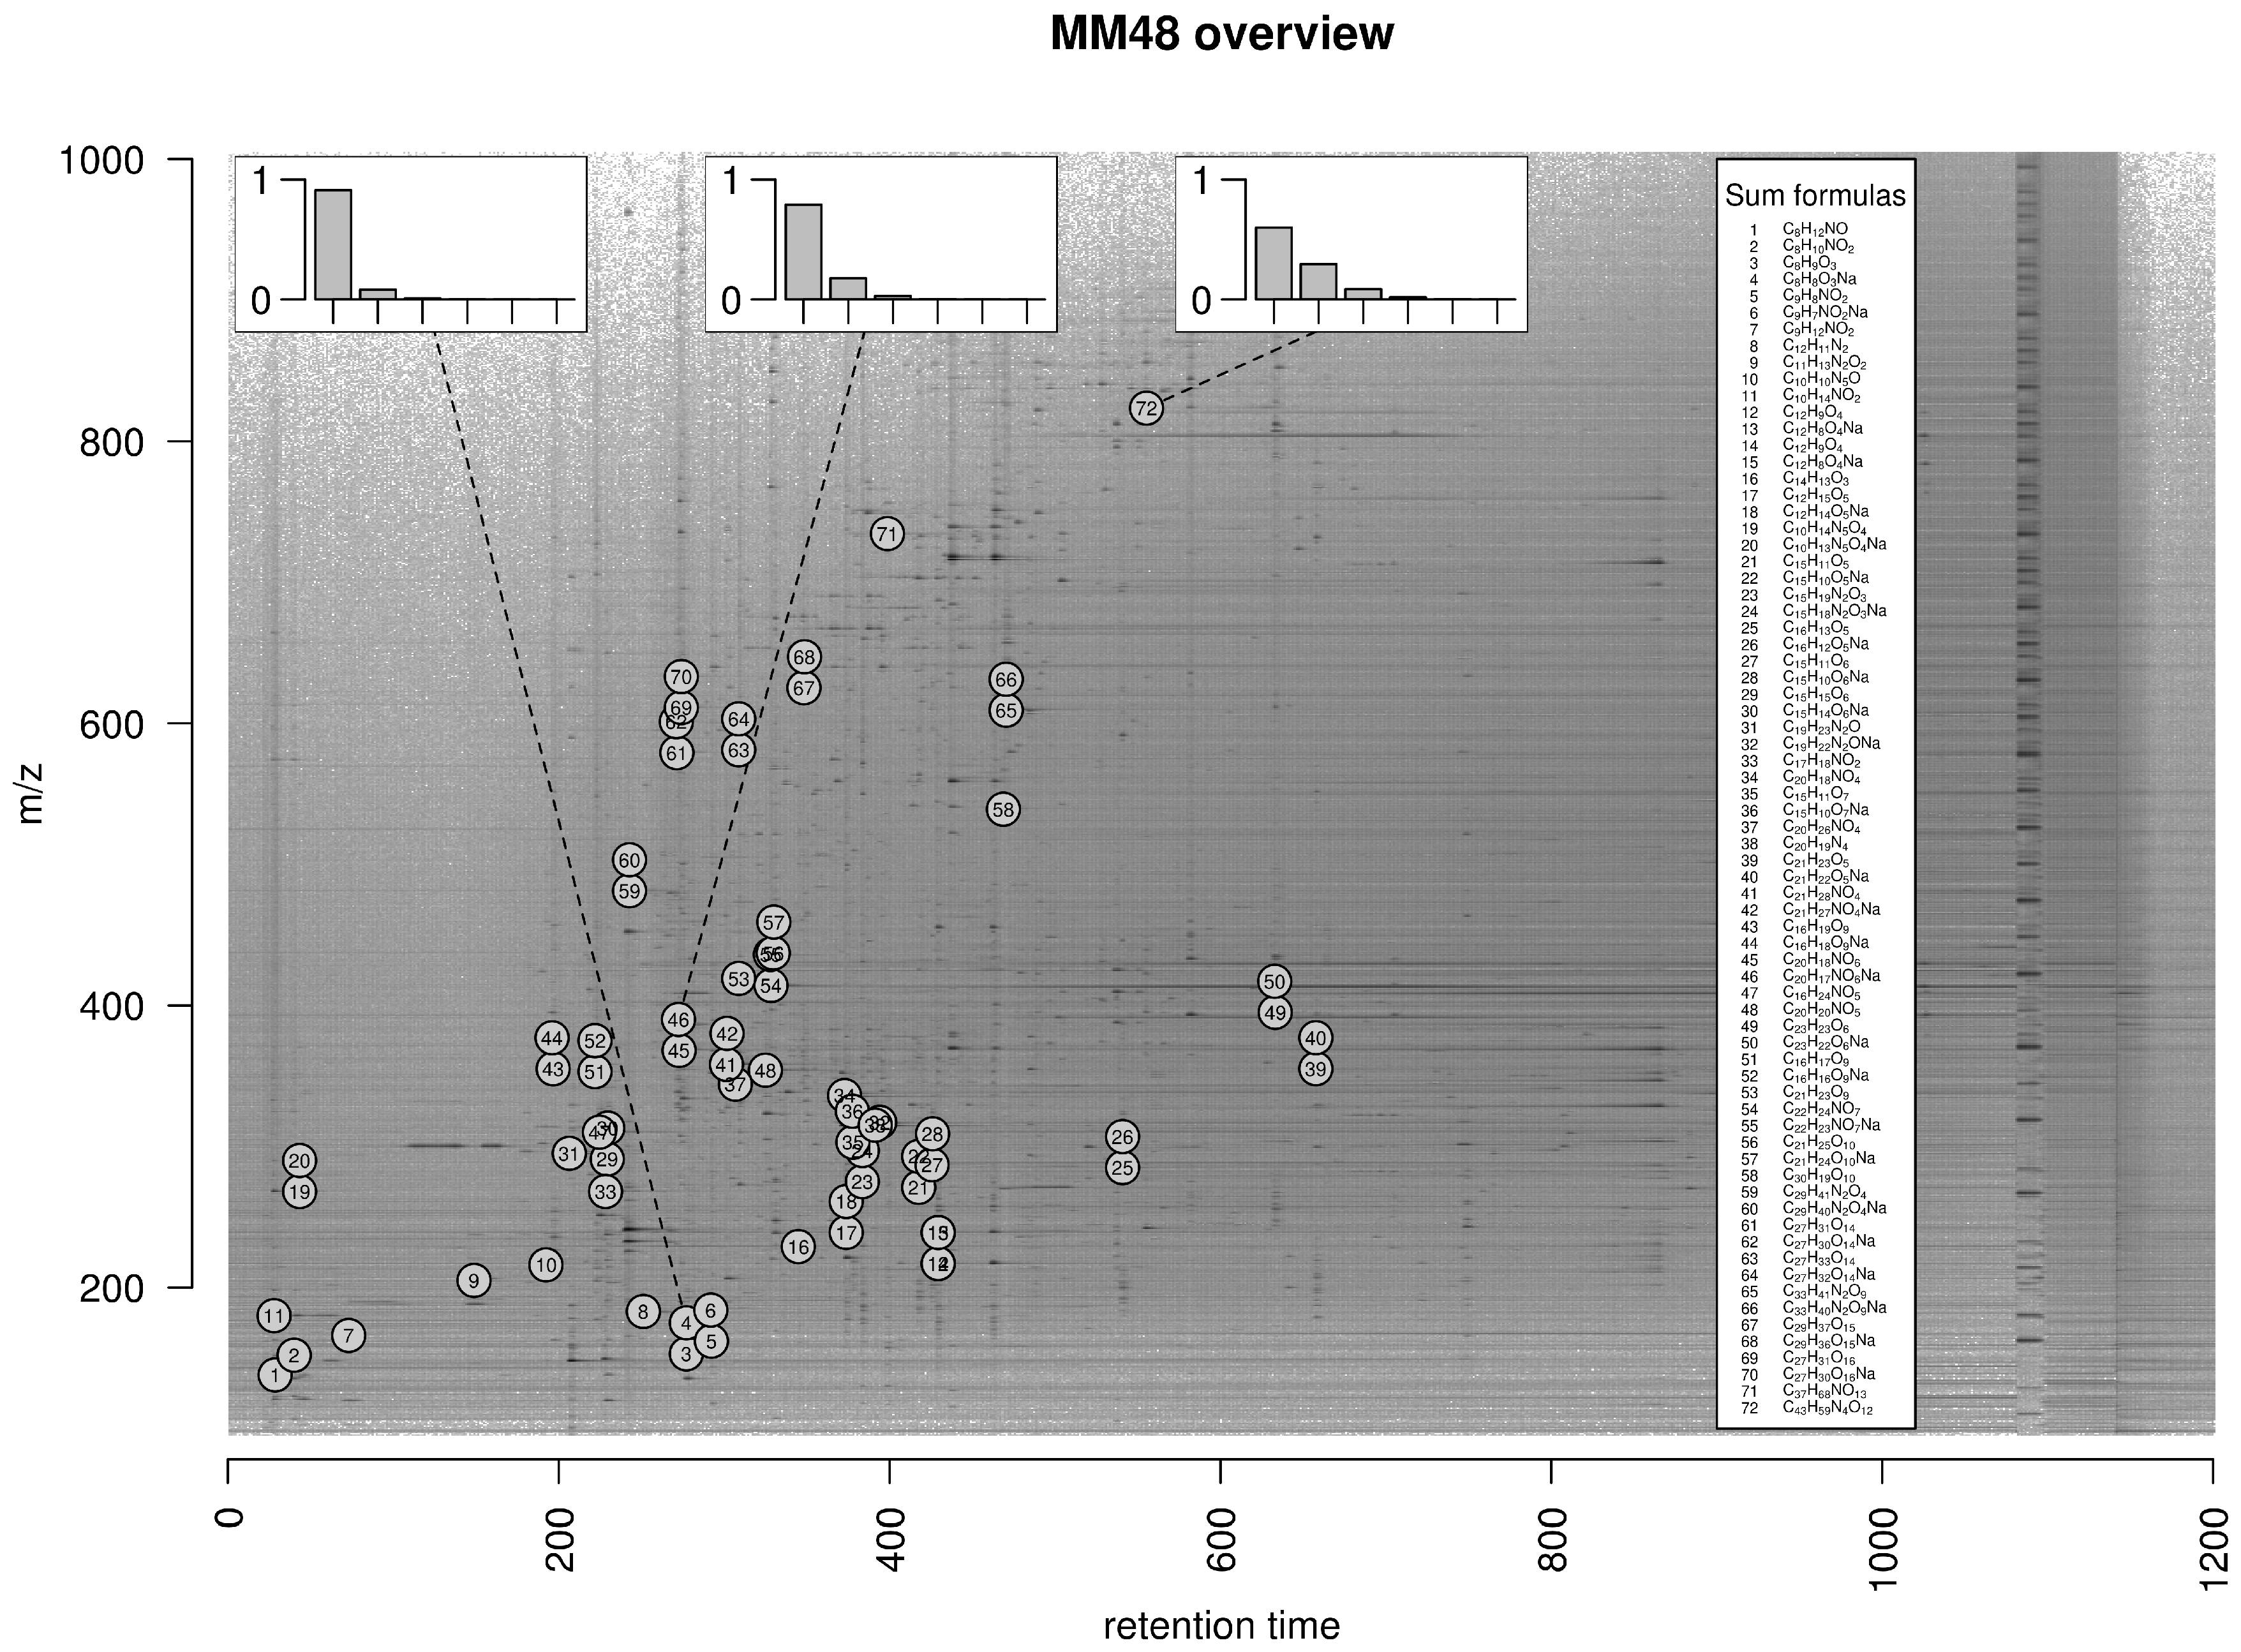
4.4.1. MM48
4.4.2. Dilution Series
5. Conclusions
Supplementary Materials
Acknowledgments
Author Contributions
Conflicts of Interest
Appendix A. Isotope Cluster Detection and Validation: Extended Results

Appendix B. Prediction of Molecular Formulas From Isotope Clusters

| Predicted Isotope ROIs | Isotope Detection Algorithm | Rank 1 | Rank 2 | Rank 3 | 3 < Rank ≤ 10 | Rank > 10 | No Rank | No Peak |
|---|---|---|---|---|---|---|---|---|
| − | 48.82 | 11.55 | 1.18 | 3.36 | 0 | 4.64 | 2.45 | |
| + | 48.18 | 12 | 1.18 | 3.36 | 0 | 4.82 | 2.45 | |
| − | 49.09 | 10.91 | 0.91 | 1.55 | 0 | 7.09 | 2.45 | |
| + | 49.36 | 11.18 | 0.73 | 1.64 | 0 | 6.73 | 2.36 | |
| − | 52.82 | 11.27 | 1.09 | 1.82 | 0 | 2.55 | 2.45 | |
| + | 53.27 | 11.55 | 0.55 | 1.91 | 0 | 2.36 | 2.36 | |
| − | 53.73 | 10.27 | 0.82 | 1.55 | 0 | 3.18 | 2.45 | |
| + | 52.82 | 11 | 0.64 | 1.64 | 0 | 3.55 | 2.36 | |
| − | 53.82 | 11.09 | 1 | 1.55 | 0 | 2.09 | 2.45 | |
| + | 54.09 | 11.36 | 0.73 | 1.64 | 0 | 1.82 | 2.36 |
Appendix C. Isotope Cluster Statistics: Full Quantile Set for PubChem
Appendix D. Software Versions and Processing Parameters
Appendix D.1. xcms/CAMERA
Appendix D.2. AStream
Appendix D.3. mzMatch
Appendix D.4. Prediction of Molecular Formulas Using SIRIUS
References
- Tautenhahn, R.; Böttcher, C.; Neumann, S. Highly sensitive feature detection for high resolution LC/MS. BMC Bioinform. 2008, 9, 504. [Google Scholar] [CrossRef] [PubMed]
- Trutschel, D.; Schmidt, S.; Grosse, I.; Neumann, S. Joint Analysis of Dependent Features within Compound Spectra Can Improve Detection of Differential Features. Front. Bioeng. Biotechnol. 2015, 3. [Google Scholar] [CrossRef] [PubMed]
- Böcker, S.; Letzel, M.C.; Lipták, Z.; Pervukhin, A. SIRIUS: Decomposing isotope patterns for metabolite identification. Bioinformatics 2009, 25, 218–224. [Google Scholar] [CrossRef] [PubMed]
- Dührkop, K.; Hufsky, F.; Böcker, S. Molecular Formula Identification Using Isotope Pattern Analysis and Calculation of Fragmentation Trees. Mass Spectrom. 2014, 3. [Google Scholar] [CrossRef] [PubMed]
- Stoll, N.; Schmidt, E.; Thurow, K. Isotope pattern evaluation for the reduction of elemental compositions assigned to high-resolution mass spectral data from electrospray ionization fourier transform ion cyclotron resonance mass spectrometry. J. Am. Soc. Mass Spectrom. 2006, 17, 1692–1699. [Google Scholar] [CrossRef] [PubMed]
- Kind, T.; Fiehn, O. Metabolomic database annotations via query of elemental compositions: Mass accuracy is insufficient even at less than 1 ppm. BMC Bioinform. 2006, 7, 234. [Google Scholar] [CrossRef] [PubMed]
- Zhang, J.; Gao, W.; Cai, J.; He, S.; Zeng, R.; Chen, R. Predicting molecular formulas of fragment ions with isotope patterns in tandem mass spectra. IEEE/ACM Trans. Comput. Biol. Bioinform. 2005, 2, 217–230. [Google Scholar] [CrossRef] [PubMed]
- Ipsen, A.; Want, E.J.; Ebbels, T.M.D. Construction of Confidence Regions for Isotopic Abundance Patterns in LC/MS Data Sets for Rigorous Determination of Molecular Formulas. Anal. Chem. 2010, 82, 7319–7328. [Google Scholar] [CrossRef] [PubMed]
- Pluskal, T.; Uehara, T.; Yanagida, M. Highly accurate chemical formula prediction tool utilizing high-resolution mass spectra, MS/MS fragmentation, heuristic rules, and isotope pattern matching. Anal. Chem. 2012, 84, 4396–4403. [Google Scholar] [CrossRef] [PubMed]
- Jarussophon, S.; Acoca, S.; Gao, J.M.; Deprez, C.; Kiyota, T.; Draghici, C.; Purisima, E.; Konishi, Y. Automated molecular formula determination by tandem mass spectrometry (MS/MS). Analyst 2009, 134, 690–700. [Google Scholar] [CrossRef] [PubMed]
- Meringer, M.; Reinker, S.; Zhang, J.; Muller, A. MS/MS Data Improves Automated Determination of Molecular Formulas by Mass Spectrometry. MATCH Commun. Math. Comput. Chem. 2011, 2011, 259–290. [Google Scholar]
- Snider, R.K. Efficient calculation of exact mass isotopic distributions. J. Am. Soc. Mass Spectrom. 2007, 18, 1511–1515. [Google Scholar] [CrossRef] [PubMed]
- McLafferty, F.W.; Turecek, F. Interpretation of Mass Spectra, 4th ed. J. Chem. Educ. 1994, 71. [Google Scholar] [CrossRef]
- Clendinen, C.S.; Stupp, G.S.; Ajredini, R.; Lee-McMullen, B.; Beecher, C.; Edison, A.S. An overview of methods using (13)C for improved compound identification in metabolomics and natural products. Front. Plant Sci. 2015, 6. [Google Scholar] [CrossRef] [PubMed]
- Daly, R.; Rogers, S.; Wandy, J.; Jankevics, A.; Burgess, K.E.; Breitling, R. MetAssign: Probabilistic annotation of metabolites from LC-MS data using a Bayesian clustering approach. Bioinformatics 2014, 30, 2764–2771. [Google Scholar] [CrossRef] [PubMed]
- Hussong, R.; Tholey, A.; Hildebrandt, A. Efficient Analysis of Mass Spectrometry Data Using the Isotope Wavelet. In Proceedings of the 3rd International Symposium on Computational Life Science (COMPLIFE 2007), Utrecht, The Netherlands, 4–5 October 2007; Volume 940, pp. 139–149.
- Slawski, M.; Hussong, R.; Tholey, A.; Jakoby, T.; Gregorius, B.; Hildebrandt, A.; Hein, M. Isotope pattern deconvolution for peptide mass spectrometry by non-negative least squares/least absolute deviation template matching. BMC Bioinform. 2012, 13. [Google Scholar] [CrossRef] [PubMed]
- Kenar, E.; Franken, H.; Forcisi, S.; Wörmann, K.; Häring, H.U.U.; Lehmann, R.; Schmitt-Kopplin, P.; Zell, A.; Kohlbacher, O. Automated label-free quantification of metabolites from liquid chromatography-mass spectrometry data. Mol. Cell. Proteom. MCP 2014, 13, 348–359. [Google Scholar] [CrossRef] [PubMed]
- Libiseller, G.; Dvorzak, M.; Kleb, U.; Gander, E.; Eisenberg, T.; Madeo, F.; Neumann, S.; Trausinger, G.; Sinner, F.; Pieber, T.; et al. IPO: A tool for automated optimization of XCMS parameters. BMC Bioinform. 2015, 16. [Google Scholar] [CrossRef] [PubMed]
- Ojanperä, S.; Pelander, A.; Pelzing, M.; Krebs, I.; Vuori, E.; Ojanperä, I. Isotopic pattern and accurate mass determination in urine drug screening by liquid chromatography/time-of-flight mass spectrometry. Rapid Commun. Mass Spectrom. 2006, 20, 1161–1167. [Google Scholar] [CrossRef] [PubMed]
- Fabregat-Cabello, N.; Sancho, J.V.; Vidal, A.; González, F.V.; Roig-Navarro, A.F.F. Development and validation of a liquid chromatography isotope dilution mass spectrometry method for the reliable quantification of alkylphenols in environmental water samples by isotope pattern deconvolution. J. Chromatogr. A 2014, 1328, 43–51. [Google Scholar] [CrossRef] [PubMed]
- Haimi, P.; Uphoff, A.; Hermansson, M.; Somerharju, P. Software tools for analysis of mass spectrometric lipidome data. Anal. Chem. 2006, 78, 8324–8331. [Google Scholar] [CrossRef] [PubMed]
- Smith, C.A.; Want, E.J.; O’Maille, G.; Abagyan, R.; Siuzdak, G. XCMS: Processing Mass Spectrometry Data for Metabolite Profiling Using Nonlinear Peak Alignment, Matching, and Identification. Anal. Chem. 2006, 78, 779–787. [Google Scholar] [CrossRef] [PubMed]
- Kuhl, C.; Tautenhahn, R.; Böttcher, C.; Larson, T.R.; Neumann, S. CAMERA: An integrated strategy for compound spectra extraction and annotation of liquid chromatography/mass spectrometry data sets. Anal. Chem. 2012, 84, 283–289. [Google Scholar] [CrossRef] [PubMed]
- Gentleman, R.C.; Carey, V.J.; Bates, D.M.; Bolstad, B.; Dettling, M.; Dudoit, S.; Ellis, B.; Gautier, L.; Ge, Y.; Gentry, J.; et al. Bioconductor: Open software development for computational biology and bioinformatics. Genome Biol. 2004, 5, R80. [Google Scholar] [CrossRef] [PubMed] [Green Version]
- Meija, J.; Caruso, J.A. Deconvolution of isobaric interferences in mass spectra. J. Am. Soc. Mass Spectrom. 2004, 15, 654–658. [Google Scholar] [CrossRef] [PubMed]
- Johnstone, R.A.W.; Rose, M.E. Mass Spectrometry for Chemists and Biochemists, 2nd ed.; Cambridge University Press: Cambridge, UK, 1996. [Google Scholar]
- Yamagaki, T.; Watanabe, T. Hydrogen radical removal causes complex overlapping isotope patterns of aromatic carboxylic acids in negative-ion matrix-assisted laser desorption/ionization mass spectrometry. Mass Spectrom. 2012, 1. [Google Scholar] [CrossRef] [PubMed]
- Alonso, A.; Julià, A.; Beltran, A.; Vinaixa, M.; Díaz, M.; Ibañez, L.; Correig, X.; Marsal, S. AStream: An R package for annotating LC/MS metabolomic data. Bioinformatics 2011, 27, 1339–1340. [Google Scholar] [CrossRef] [PubMed]
- Scheltema, R.A.; Jankevics, A.; Jansen, R.C.; Swertz, M.A.; Breitling, R. PeakML/mzMatch: A File Format, Java Library, R Library, and Tool-Chain for Mass Spectrometry Data Analysis. Anal. Chem. 2011, 83, 2786–2793. [Google Scholar] [CrossRef] [PubMed]
- Meusel, M.; Hufsky, F.; Panter, F.; Krug, D.; Müller, R.; Böcker, S. Predicting the Presence of Uncommon Elements in Unknown Biomolecules from Isotope Patterns. Anal. Chem. 2016, 88, 7556–7566. [Google Scholar] [CrossRef] [PubMed]
- Degtyarenko, K.; de Matos, P.; Ennis, M.; Hastings, J.; Zbinden, M.; McNaught, A.; Alcántara, R.; Darsow, M.; Guedj, M.; Ashburner, M. ChEBI: A database and ontology for chemical entities of biological interest. Nucleic Acids Res. 2008, 36, D344–D350. [Google Scholar] [CrossRef] [PubMed]
- Ogata, H.; Goto, S.; Sato, K.; Fujibuchi, W.; Bono, H.; Kanehisa, M. KEGG: Kyoto Encyclopedia of Genes and Genomes. Nucleic Acids Res. 1999, 27, 29–34. [Google Scholar] [CrossRef] [PubMed]
- Afendi, F.M.M.; Okada, T.; Yamazaki, M.; Hirai-Morita, A.; Nakamura, Y.; Nakamura, K.; Ikeda, S.; Takahashi, H.; Altaf-Ul-Amin, M.; Darusman, L.K.; et al. KNApSAcK family databases: Integrated metabolite-plant species databases for multifaceted plant research. Plant Cell Physiol. 2012, 53. [Google Scholar] [CrossRef] [PubMed]
- Sud, M.; Fahy, E.; Cotter, D.; Brown, A.; Dennis, E.A.; Glass, C.K.; Merrill, A.H.; Murphy, R.C.; Raetz, C.R.; Russell, D.W.; et al. LMSD: LIPID MAPS structure database. Nucleic Acids Res. 2007, 35, D527–D532. [Google Scholar] [CrossRef] [PubMed]
- Kim, S.; Thiessen, P.A.; Bolton, E.E.; Chen, J.; Fu, G.; Gindulyte, A.; Han, L.; He, J.; He, S.; Shoemaker, B.A.; et al. PubChem Substance and Compound databases. Nucleic Acids Res. 2015, 44, D1202–D1213. [Google Scholar] [CrossRef] [PubMed]
- Loos, M.; Gerber, C.; Corona, F.; Hollender, J.; Singer, H. Accelerated Isotope Fine Structure Calculation Using Pruned Transition Trees. Anal. Chem. 2015, 87, 5738–5744. [Google Scholar] [CrossRef] [PubMed]
- Pluskal, T.; Castillo, S.; Villar-Briones, A.; Oresic, M. MZmine 2: Modular framework for processing, visualizing, and analyzing mass spectrometry-based molecular profile data. BMC Bioinform. 2010, 11. [Google Scholar] [CrossRef] [PubMed]
- Yu, T.; Park, Y.; Johnson, J.M.; Jones, D.P. apLCMS—Adaptive processing of high-resolution LC/MS data. Bioinformatics 2009, 25, 1930–1936. [Google Scholar] [CrossRef] [PubMed]
- Woldegebriel, M.; Vivó-Truyols, G. Probabilistic Model for Untargeted Peak Detection in LC–MS Using Bayesian Statistics. Anal. Chem. 2015, 87, 7345–7355. [Google Scholar] [CrossRef] [PubMed]
- Haug, K.; Salek, R.M.; Conesa, P.; Hastings, J.; de Matos, P.; Rijnbeek, M.; Mahendraker, T.; Williams, M.; Neumann, S.; Rocca-Serra, P.; et al. MetaboLights—An open-access general-purpose repository for metabolomics studies and associated meta-data. Nucleic Acids Res. 2013, 41, D781–D786. [Google Scholar] [CrossRef] [PubMed]
- Koch, B.P.; Dittmar, T.; Witt, M.; Kattner, G. Fundamentals of Molecular Formula Assignment to Ultrahigh Resolution Mass Data of Natural Organic Matter. Anal. Chem. 2007, 79, 1758–1763. [Google Scholar] [CrossRef] [PubMed]


| Substance Name | Sum Formula | Mass | Δm | Int. | No Val. | Val. | ||
|---|---|---|---|---|---|---|---|---|
| Aspartic acid | C4H7NO4 | 133.037508 | 100.00 | 0.00191 | 14.3 | + | + | |
| 134.040468 | 1.00296 | 4.96 | + | + | ||||
| 135.041918 | 2.00441 | 0.93 | + | + | ||||
| 136.044728 | 3.00722 | 0.04 | + | + | ||||
| Cysteine | C3H7NO2S | 121.019749 | 100.00 | 0.00895 | 73.9 | + | + | |
| 122.021976 | 1.00223 | 4.59 | + | + | ||||
| 123.016385 | 1.99664 | 5.05 | + | + | ||||
| 124.019165 | 2.99942 | 0.19 | + | + | ||||
| 125.018404 | 3.99866 | 0.03 | + | + | ||||
| Chloramphenicol | C11H12Cl2N2O5 | 322.012327 | 100.00 | 0.00913 | 28.4 | + | + | |
| 323.015369 | 1.00304 | 13.00 | + | + | ||||
| 324.009595 | 1.99727 | 66.20 | + | + | ||||
| 325.012562 | 3.00024 | 8.53 | + | + | ||||
| 326.007250 | 3.99492 | 11.54 | + | + | ||||
| 327.010016 | 4.99769 | 1.45 | + | + | ||||
| Digoxigenin monodigitoxoside | C29H44O8 | 520.303618 | 100.00 | 0.00078 | 1.5 | + | + | |
| 521.307027 | 1.00341 | 32.24 | + | + | ||||
| 522.309803 | 2.00619 | 6.70 | + | + | ||||
| 523.312531 | 3.00891 | 1.04 | + | + | ||||
| 524.315166 | 4.01155 | 0.13 | + | + | ||||
| 525.317742 | 5.01412 | 0.01 | + | + | ||||
| 2-Chloro-2’-deoxyadenosine-5’-triphosphate | C10H15ClN5O12P3 | 524.961858 | 100.00 | 0.00817 | 15.6 | + | + | |
| 525.964411 | 1.00255 | 13.30 | + | + | ||||
| 526.959596 | 1.99774 | 35.41 | + | + | ||||
| 527.962023 | 3.00017 | 4.63 | + | + | ||||
| 528.963673 | 4.00182 | 1.11 | + | + | ||||
| 529.966017 | 5.00416 | 0.12 | + | + | ||||
| Autoinducer-2 | C5H10BO7 | 192.055590 | 24.37 | 0.00689 | 35.9 | + | – | |
| 193.052059 | 0.99647 | 100.00 | + | + | ||||
| 194.055706 | 2.00012 | 6.13 | + | + | ||||
| 195.056530 | 3.00094 | 1.59 | + | + | ||||
| 196.059851 | 4.00426 | 0.09 | + | + | ||||
| 197.060963 | 5.00537 | 0.01 | + | + |
© 2016 by the authors; licensee MDPI, Basel, Switzerland. This article is an open access article distributed under the terms and conditions of the Creative Commons Attribution (CC-BY) license (http://creativecommons.org/licenses/by/4.0/).
Share and Cite
Treutler, H.; Neumann, S. Prediction, Detection, and Validation of Isotope Clusters in Mass Spectrometry Data. Metabolites 2016, 6, 37. https://doi.org/10.3390/metabo6040037
Treutler H, Neumann S. Prediction, Detection, and Validation of Isotope Clusters in Mass Spectrometry Data. Metabolites. 2016; 6(4):37. https://doi.org/10.3390/metabo6040037
Chicago/Turabian StyleTreutler, Hendrik, and Steffen Neumann. 2016. "Prediction, Detection, and Validation of Isotope Clusters in Mass Spectrometry Data" Metabolites 6, no. 4: 37. https://doi.org/10.3390/metabo6040037