
Impact of Exercise and Aging on Rat Urine and Blood Metabolome. An LC-MS Based Metabolomics Longitudinal Study

 ,
,
Abstract
:1. Introduction
2. Results and Discussion
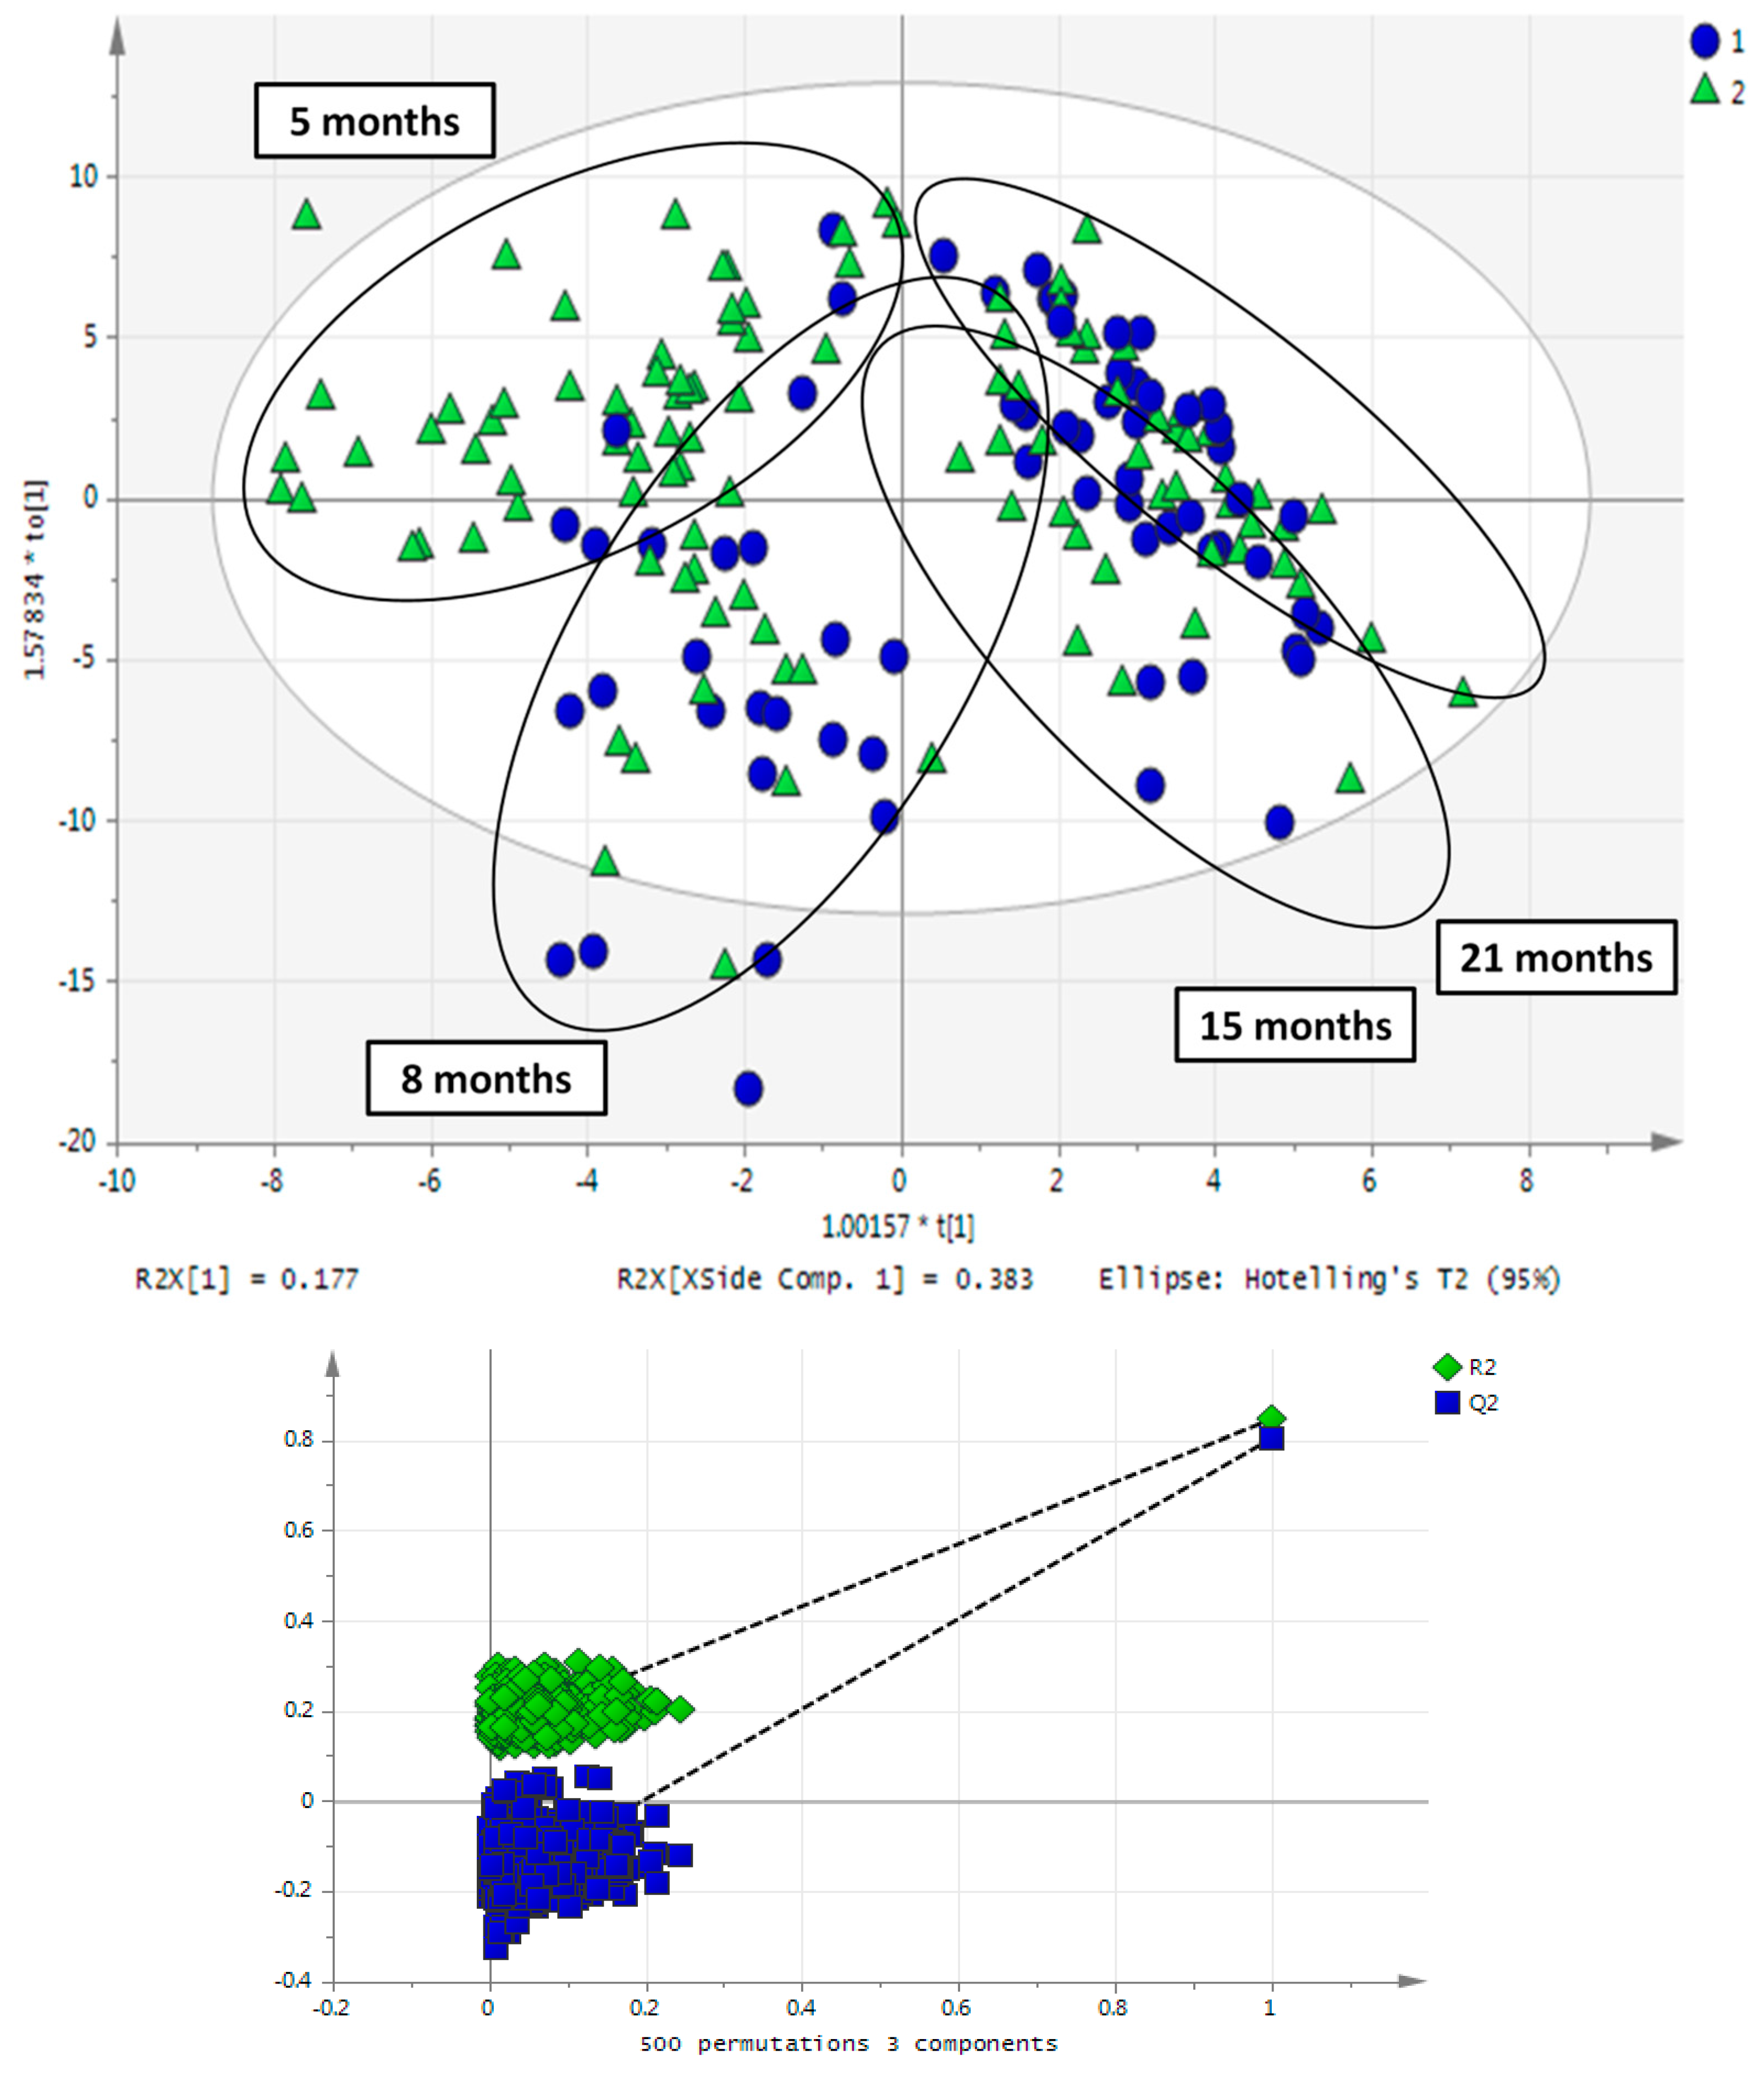
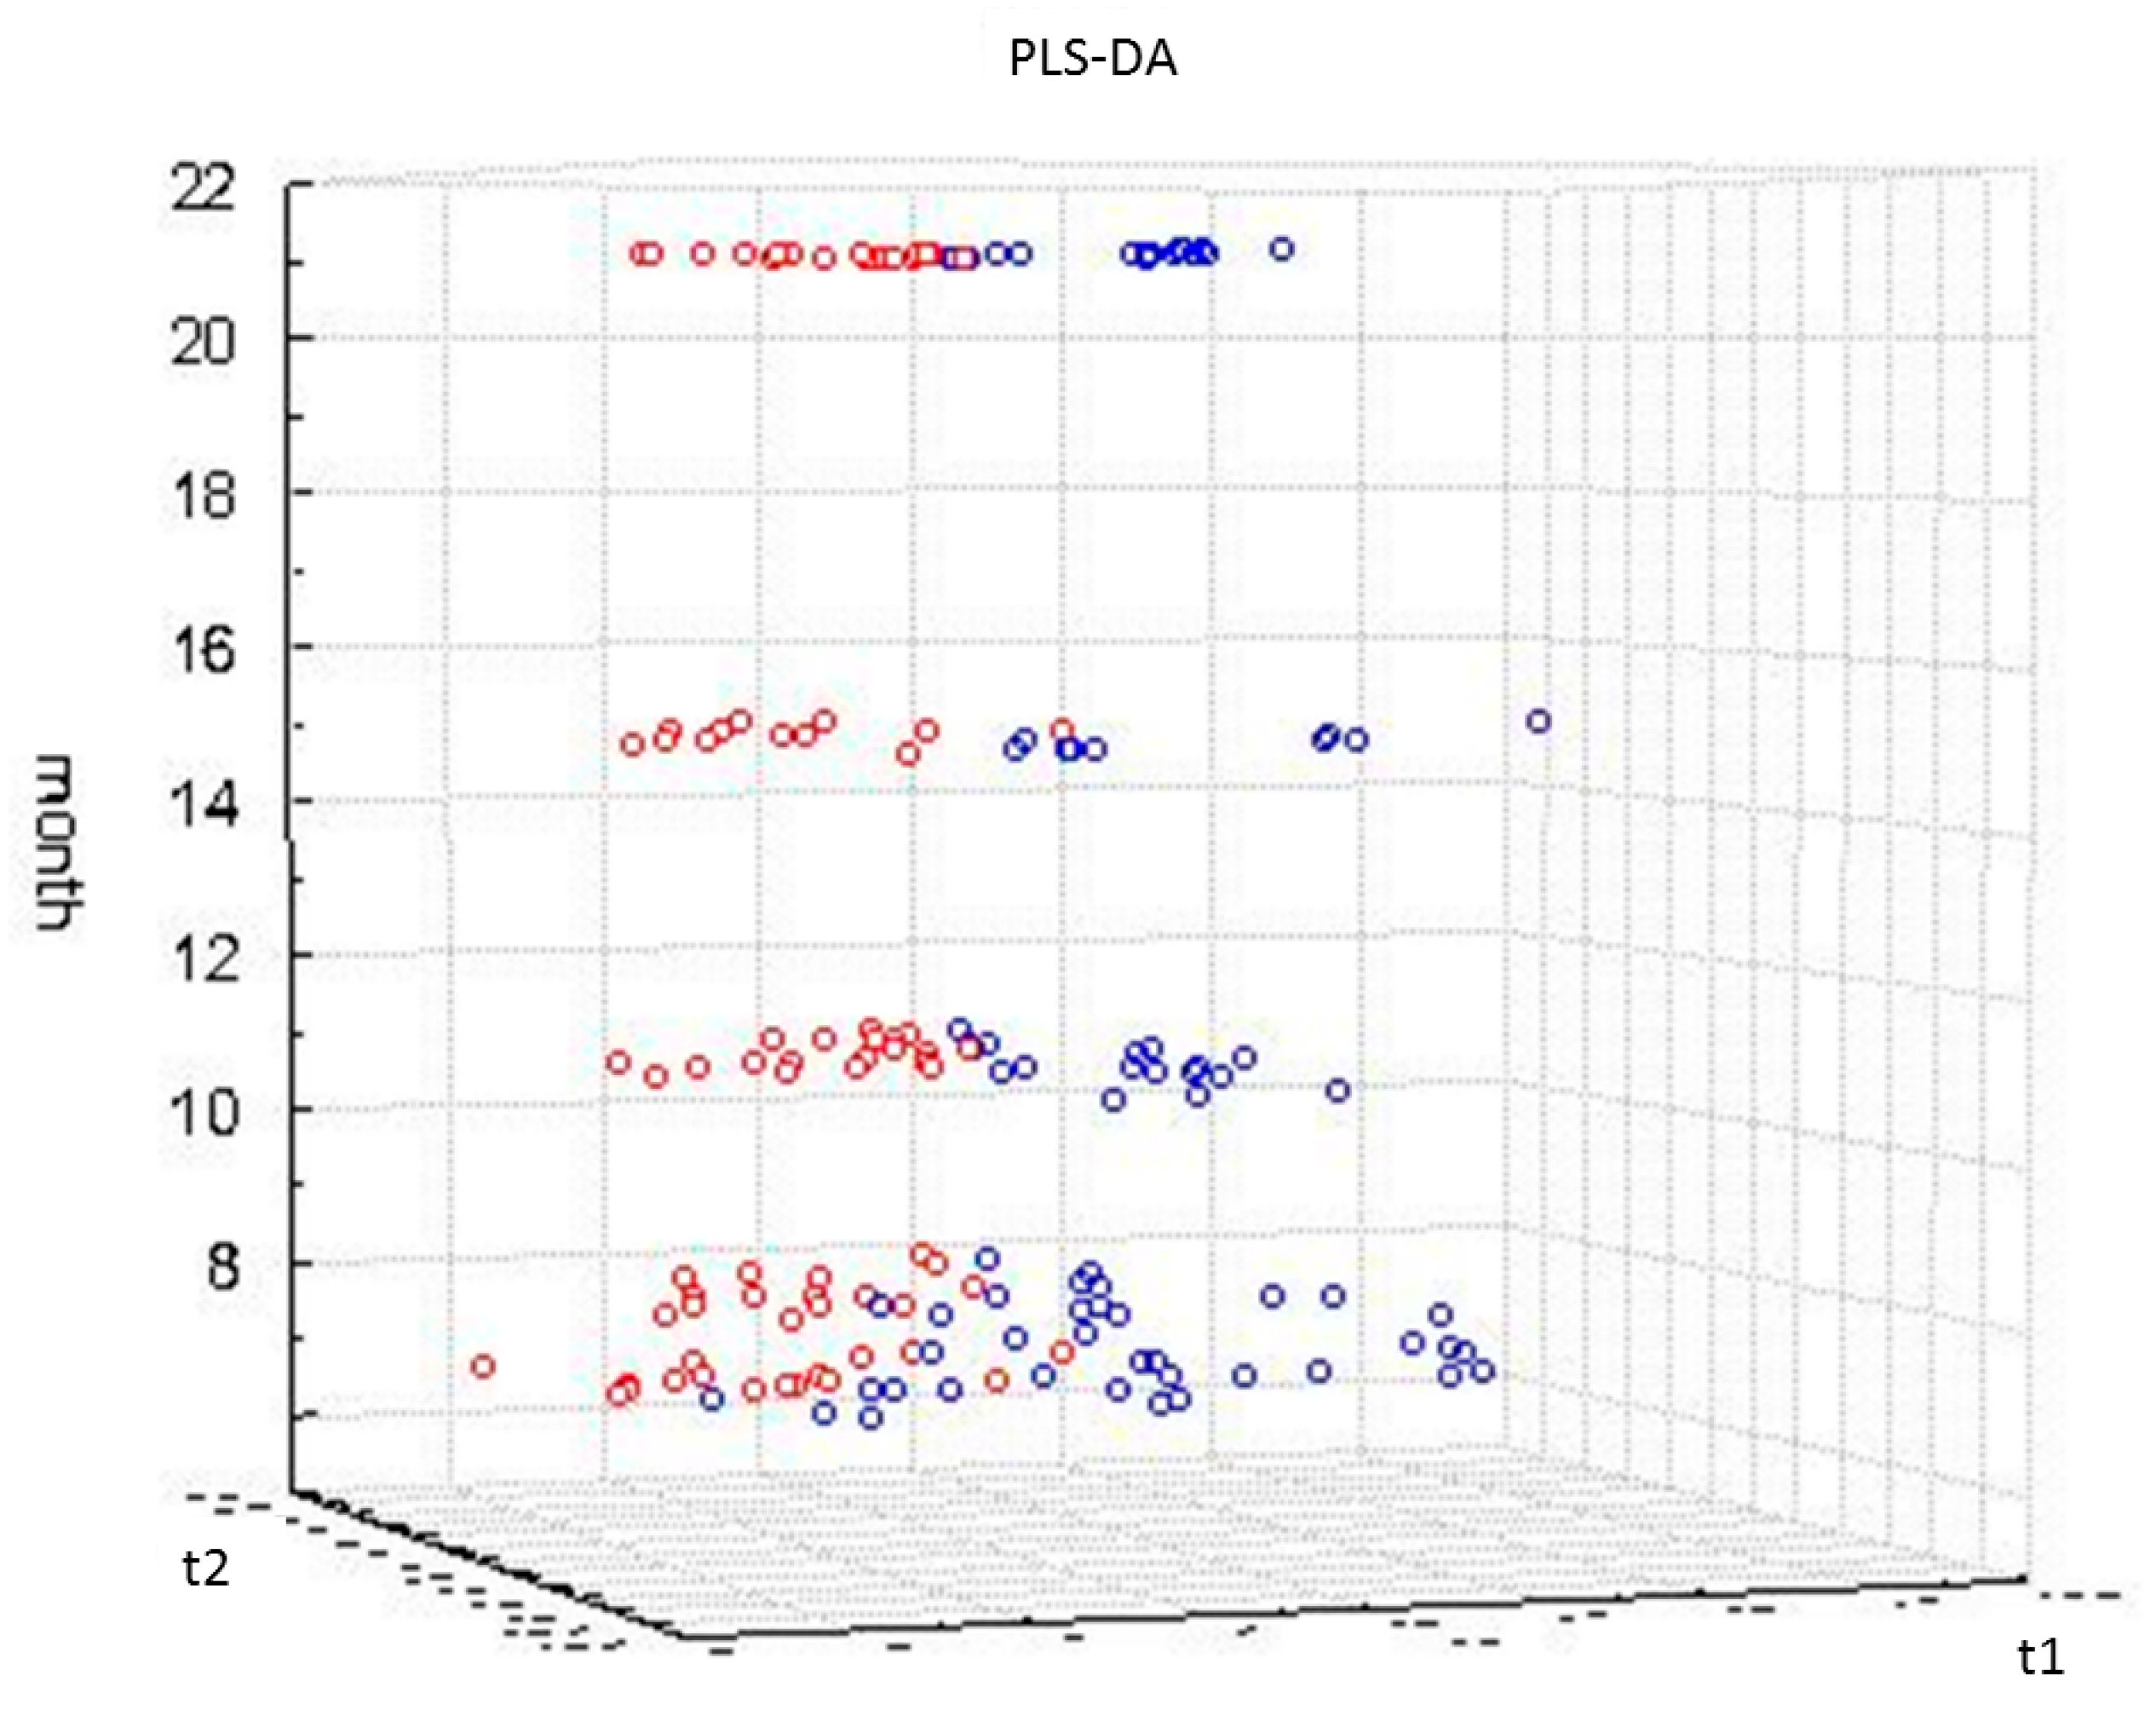
2.1. Long-Term Exercise Effect on Urine Metabolome
2.2. Acute Training Effect on Urine Metabolome
2.3. Impact of Aging
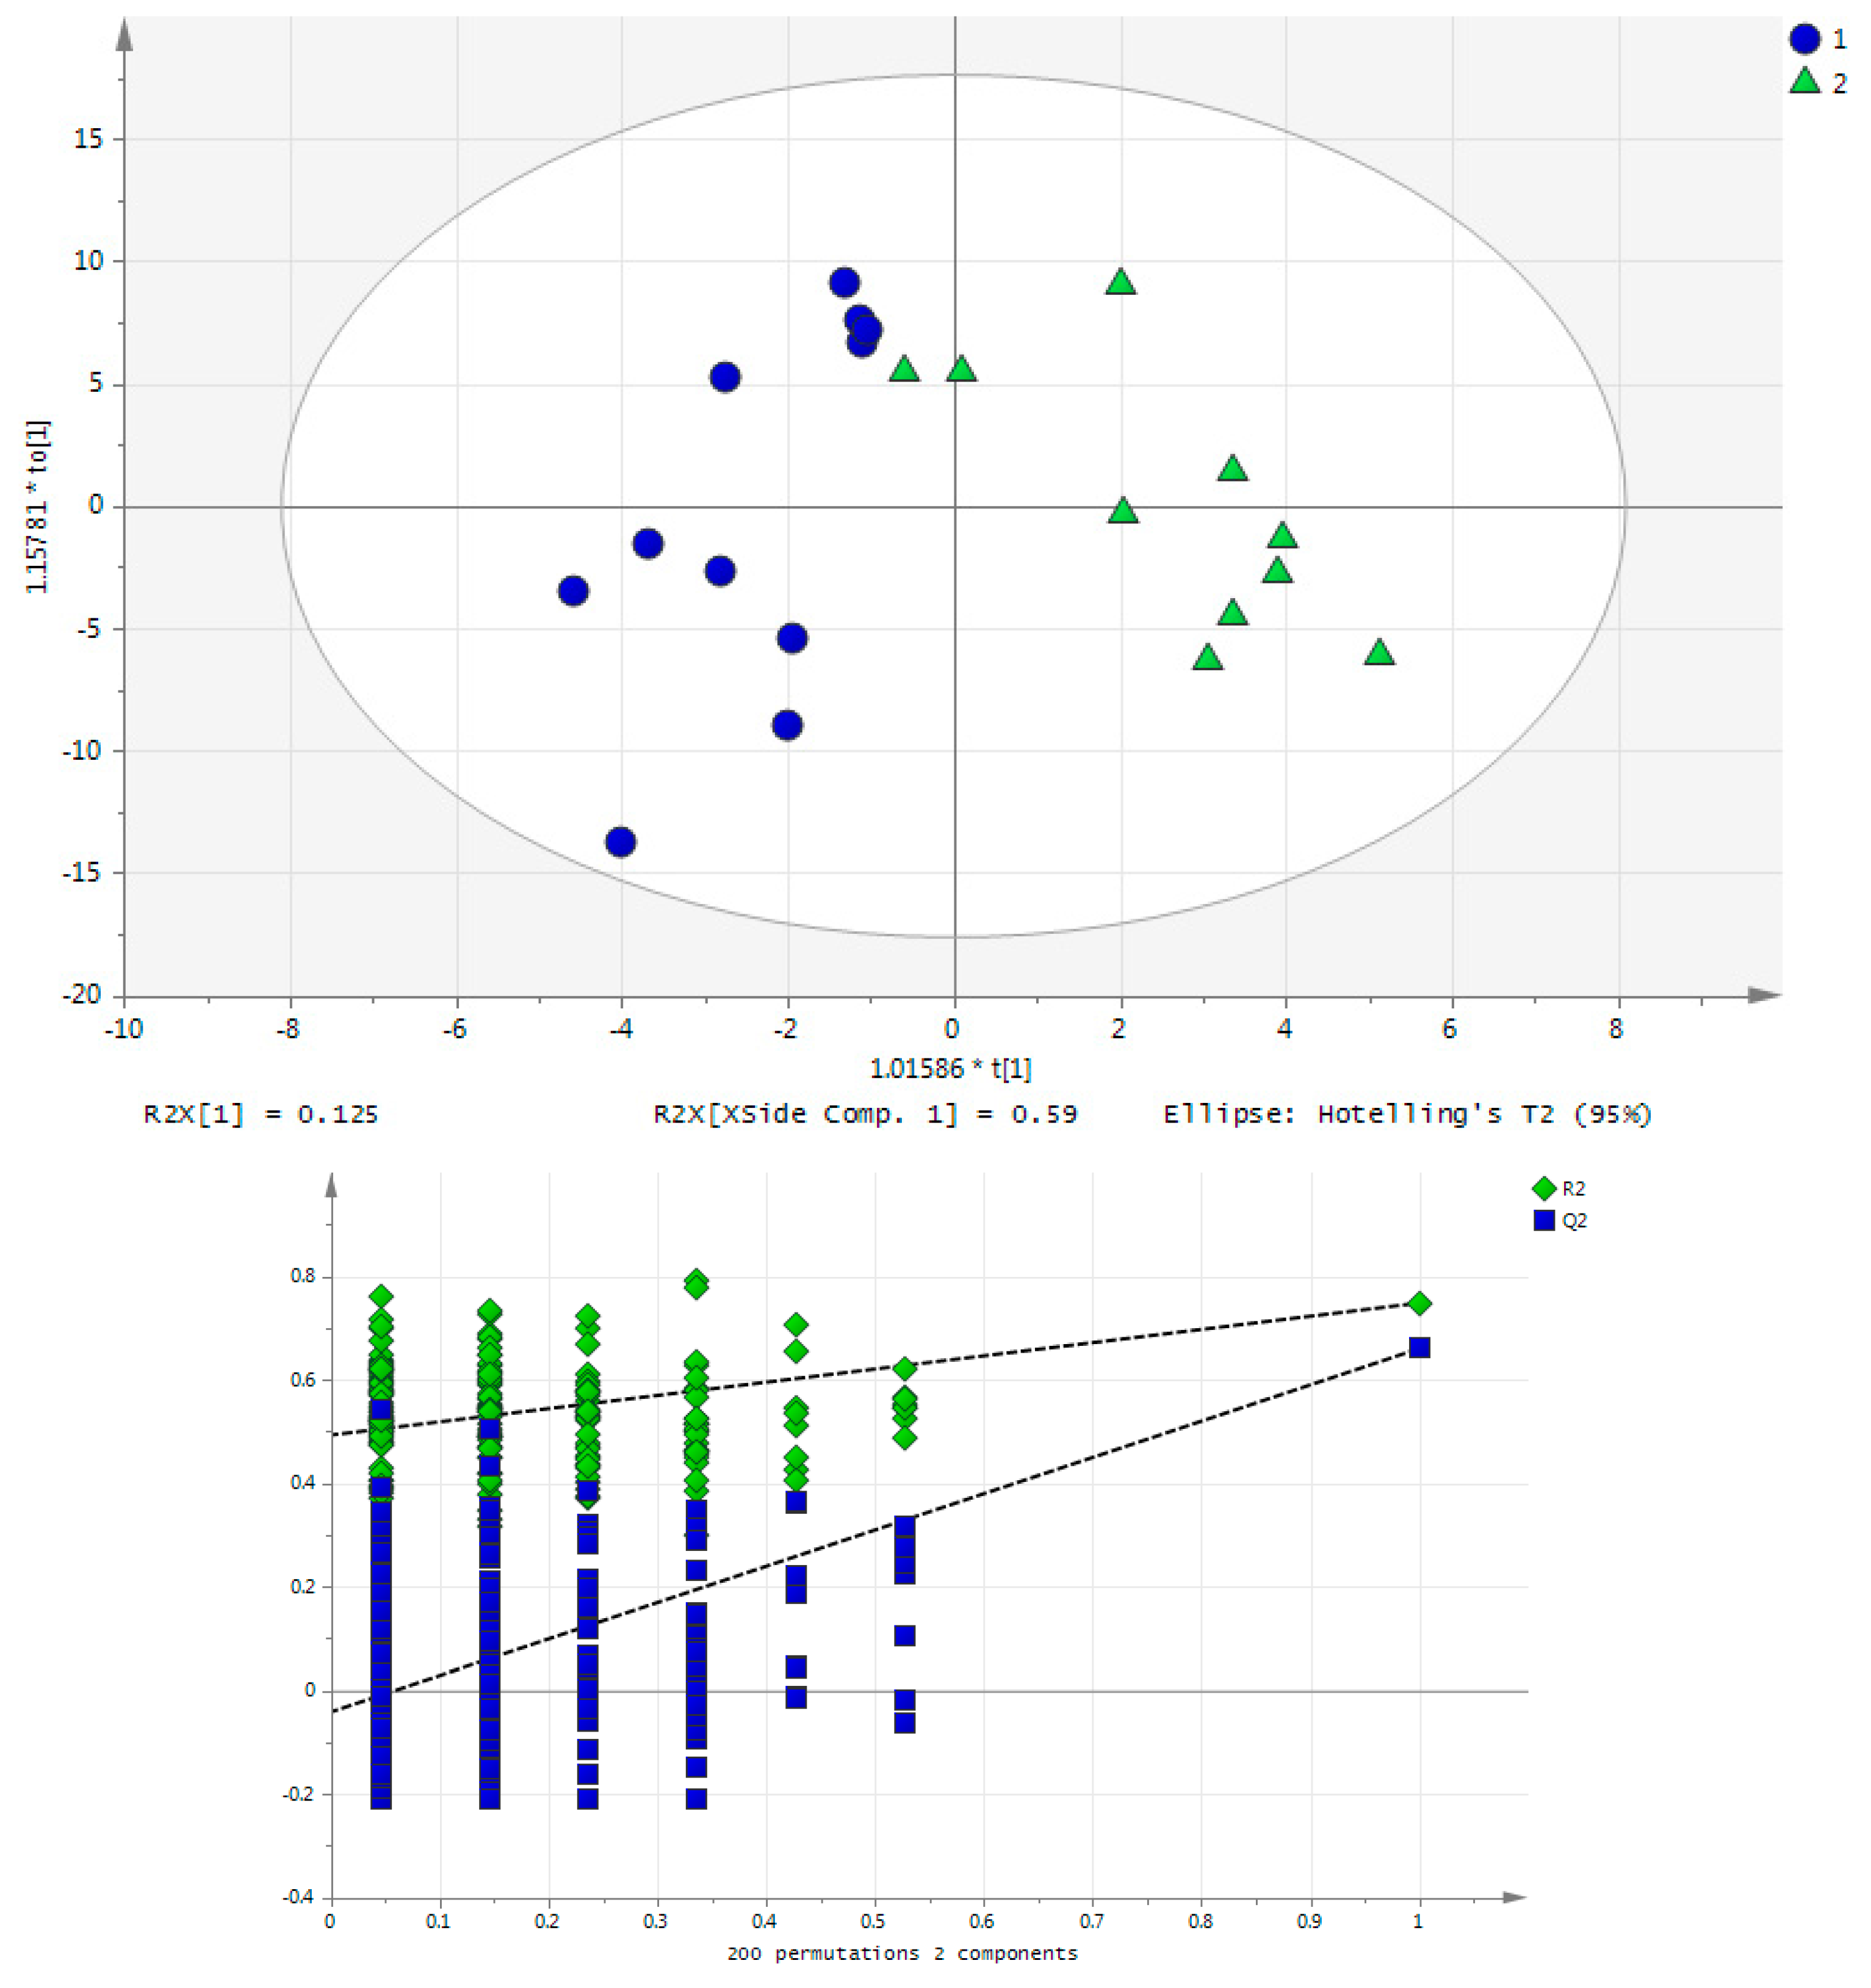
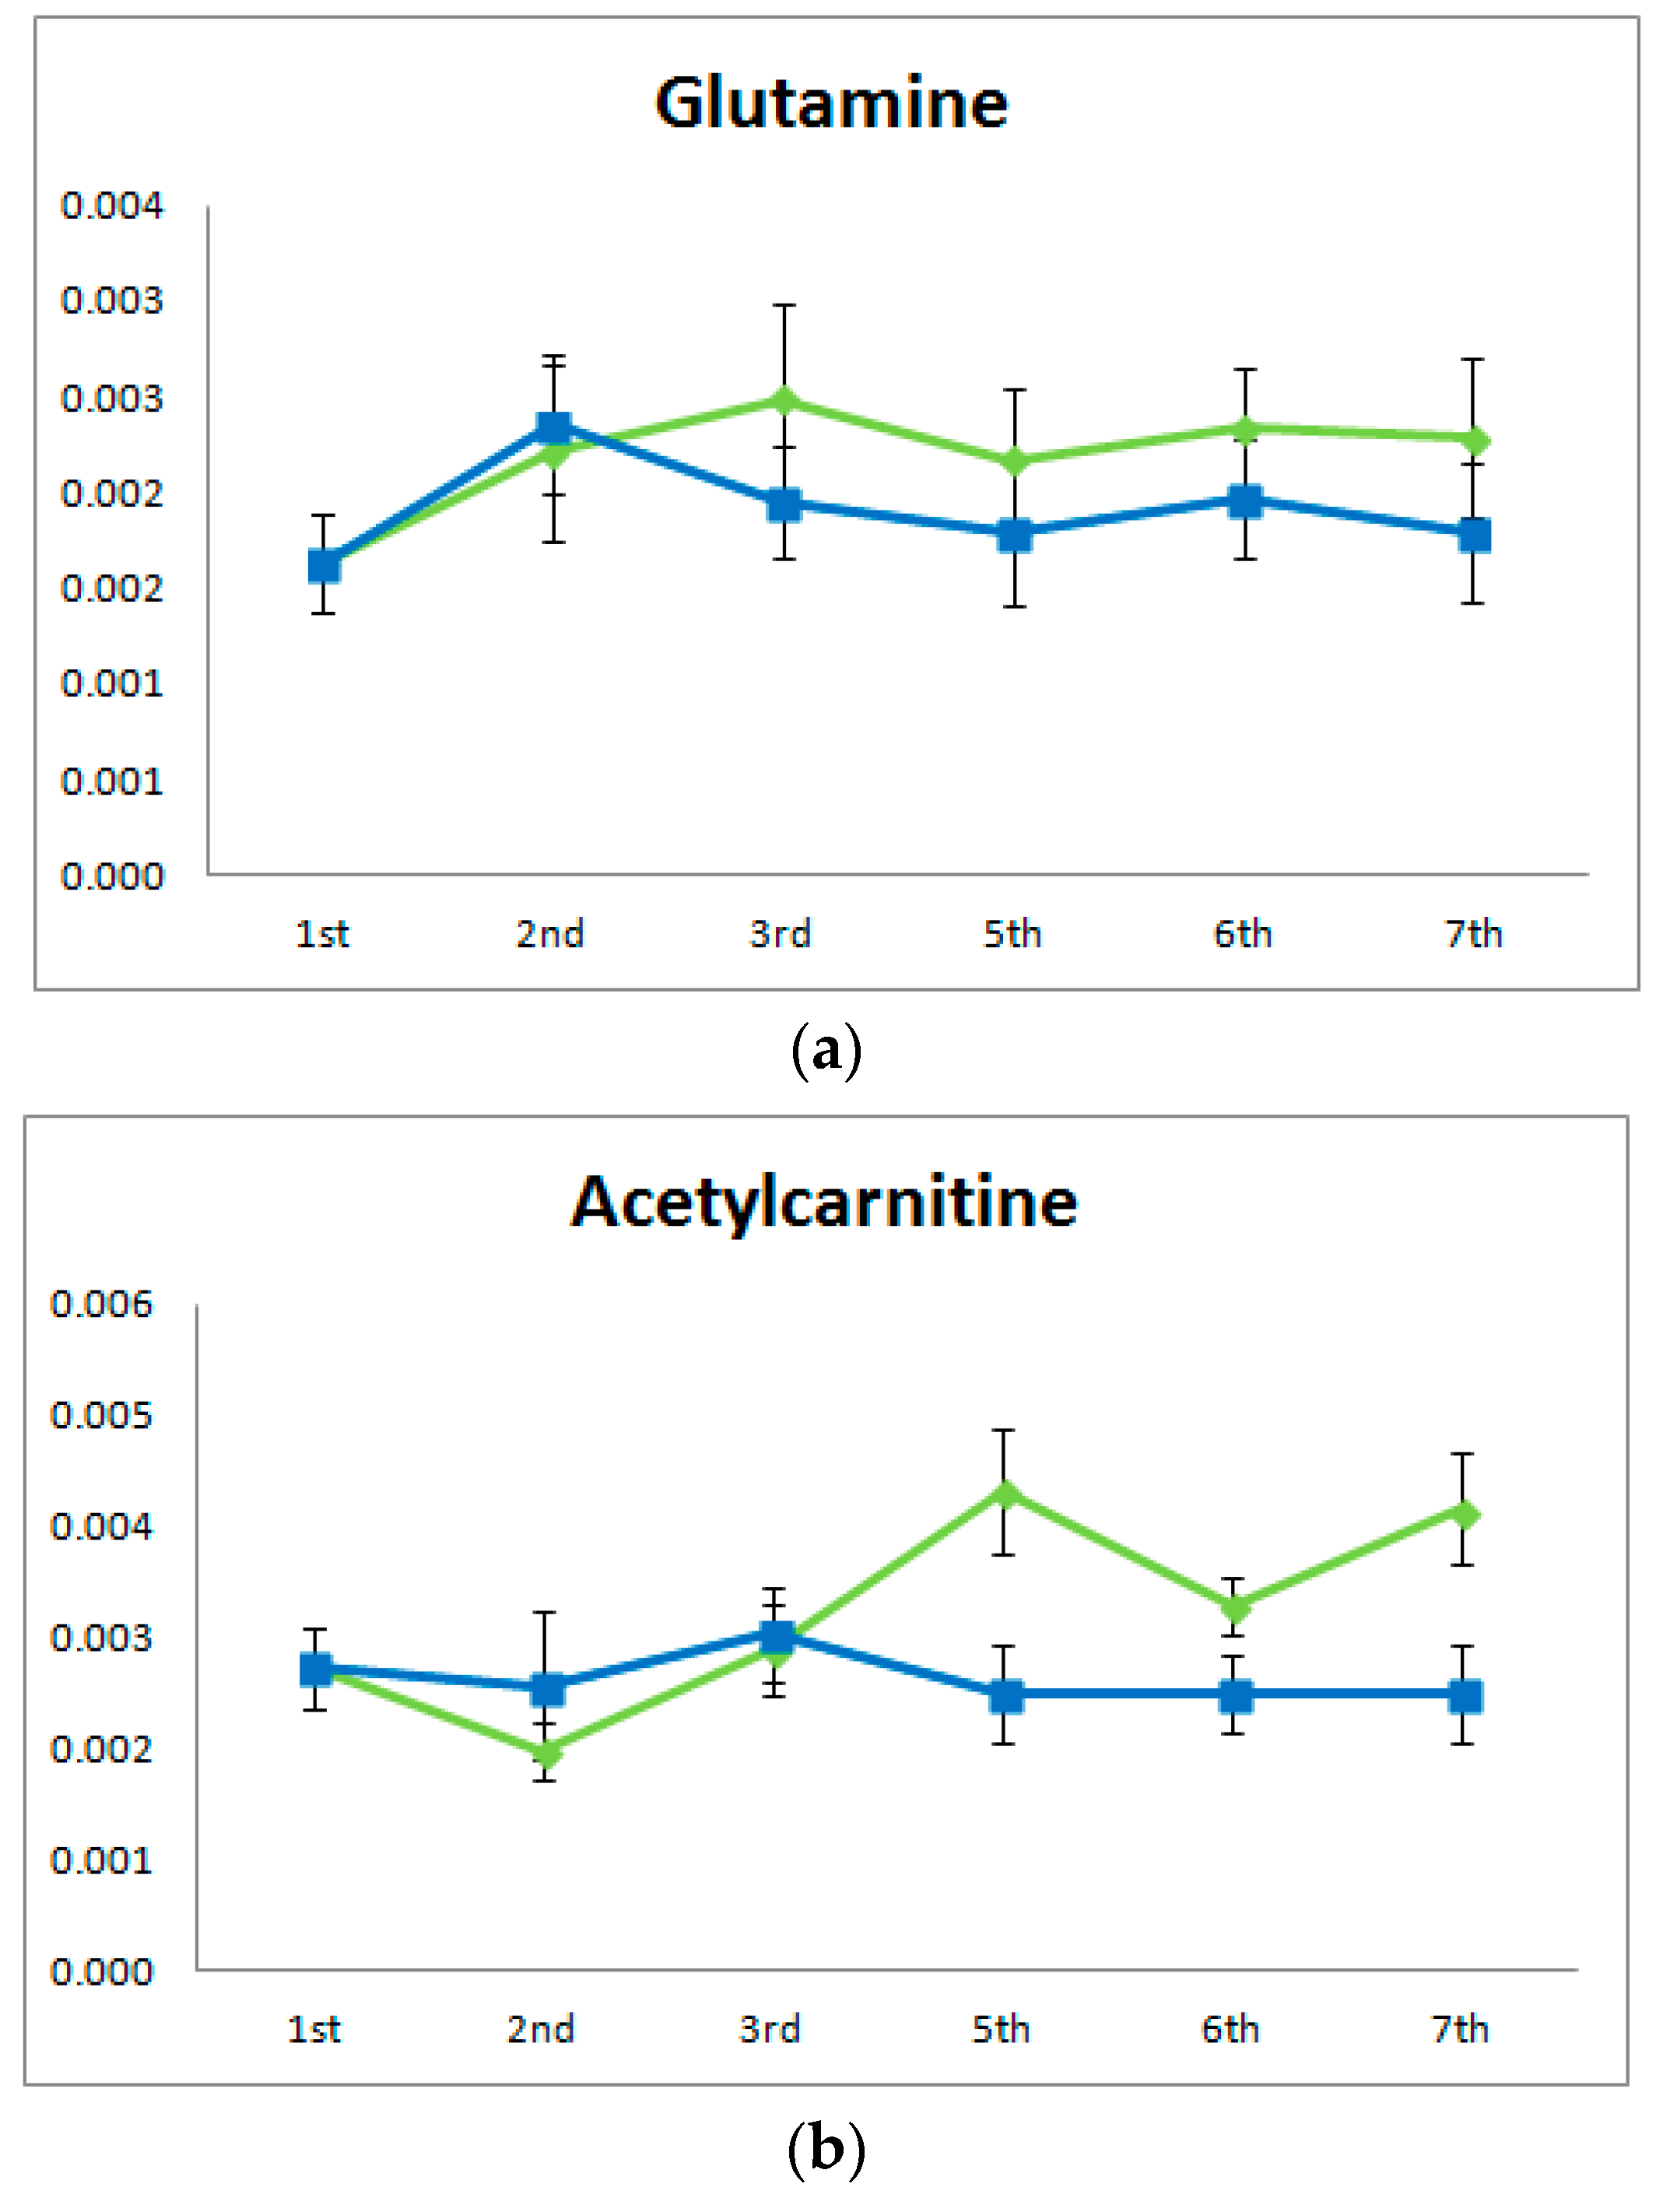
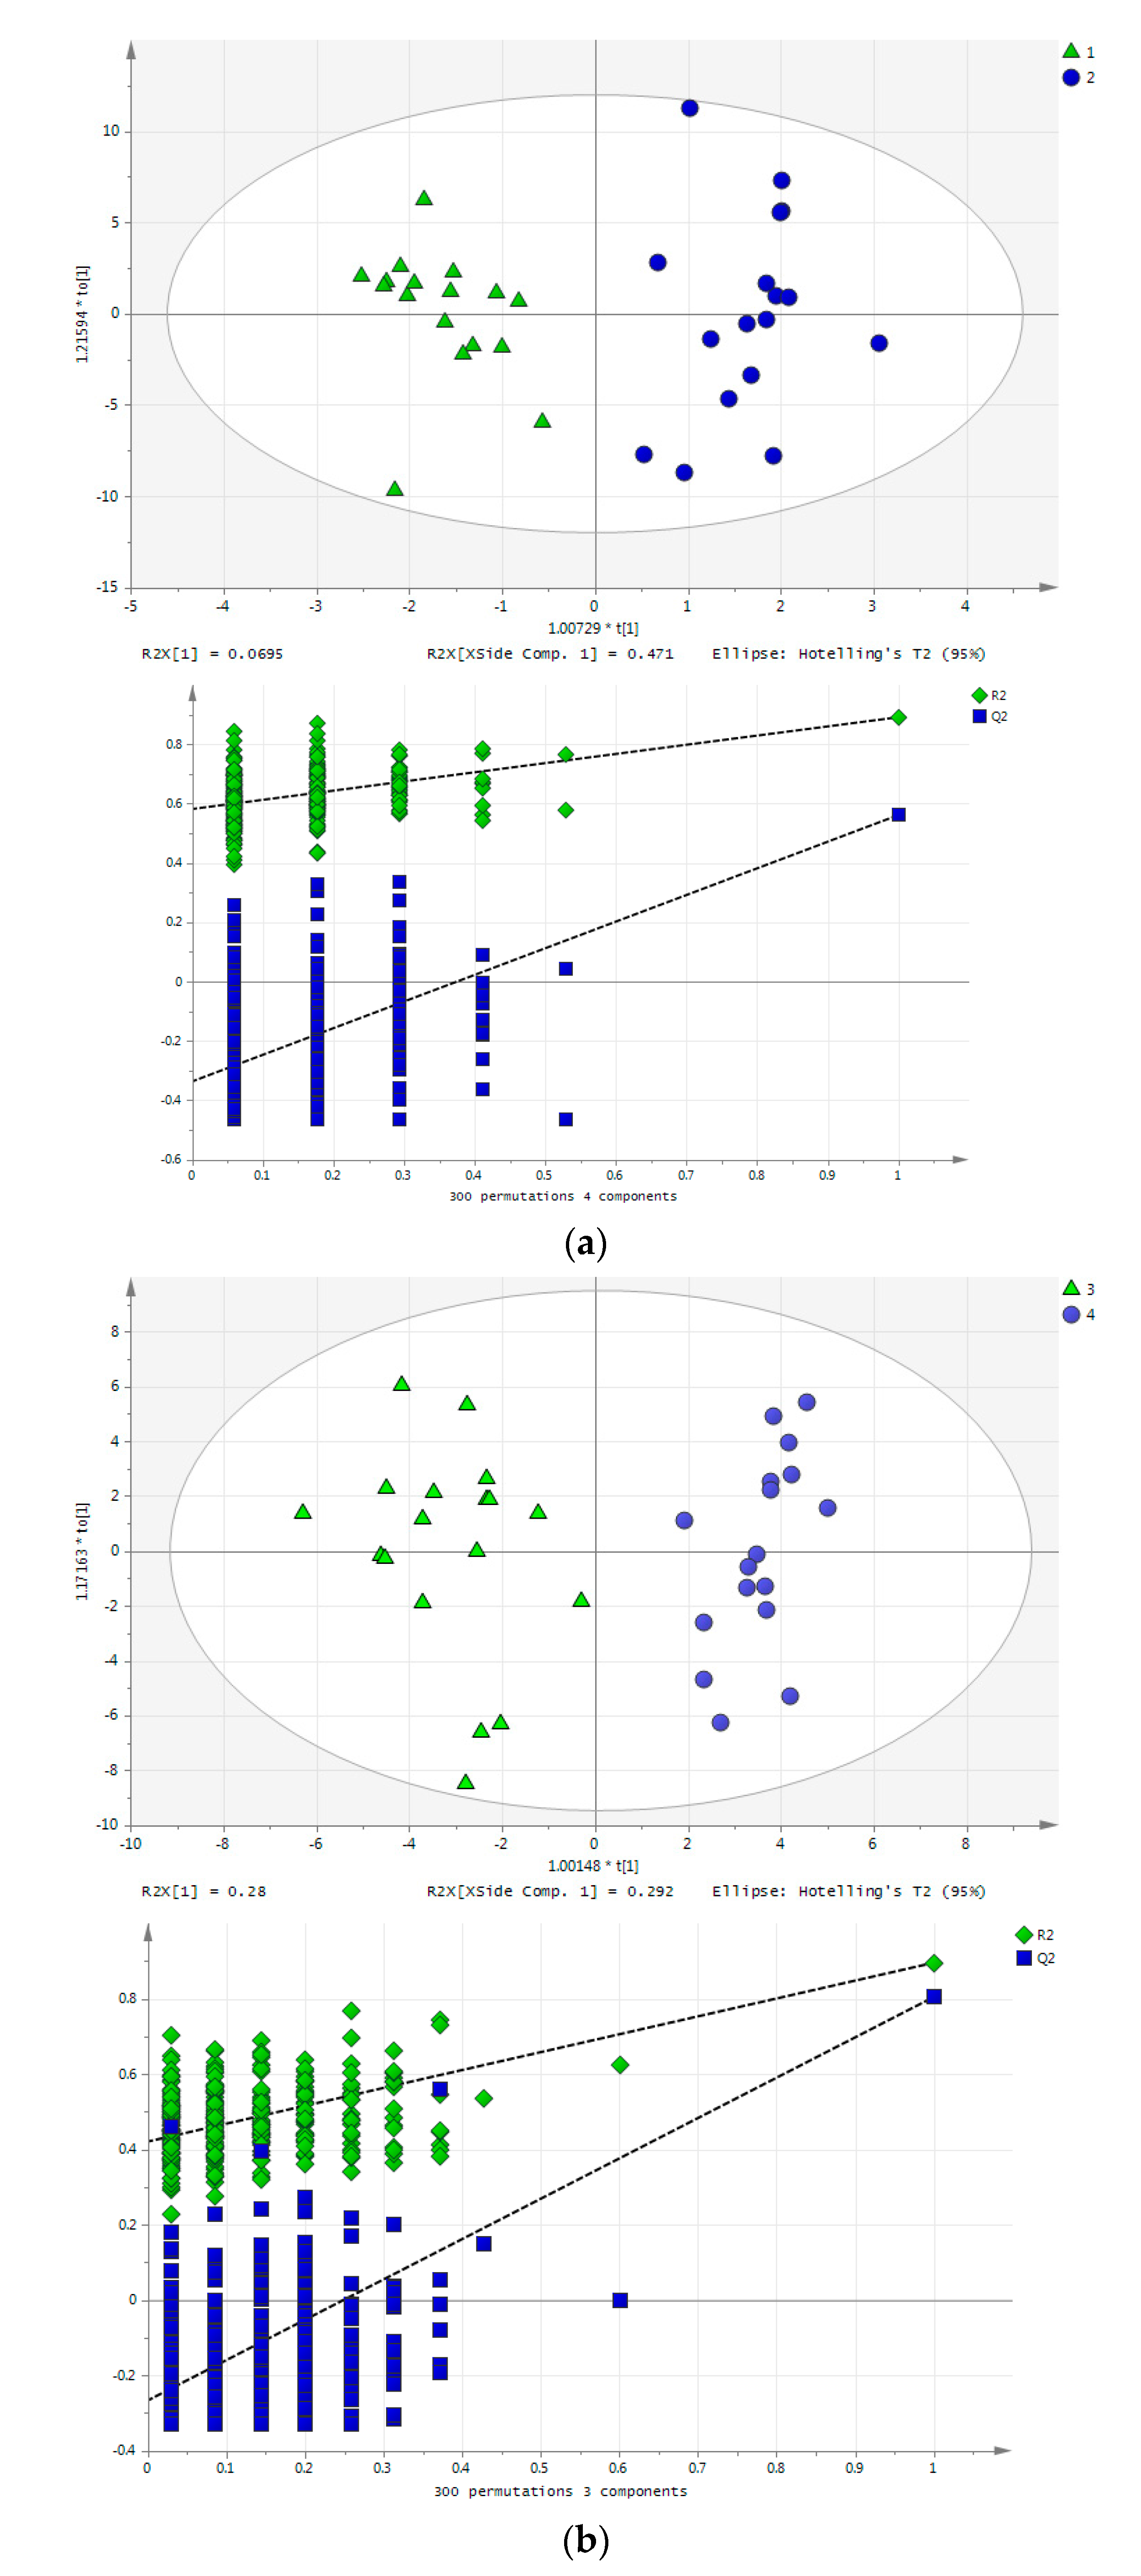
2.4. Effect of Training on Blood Metabolome
3. Experimental
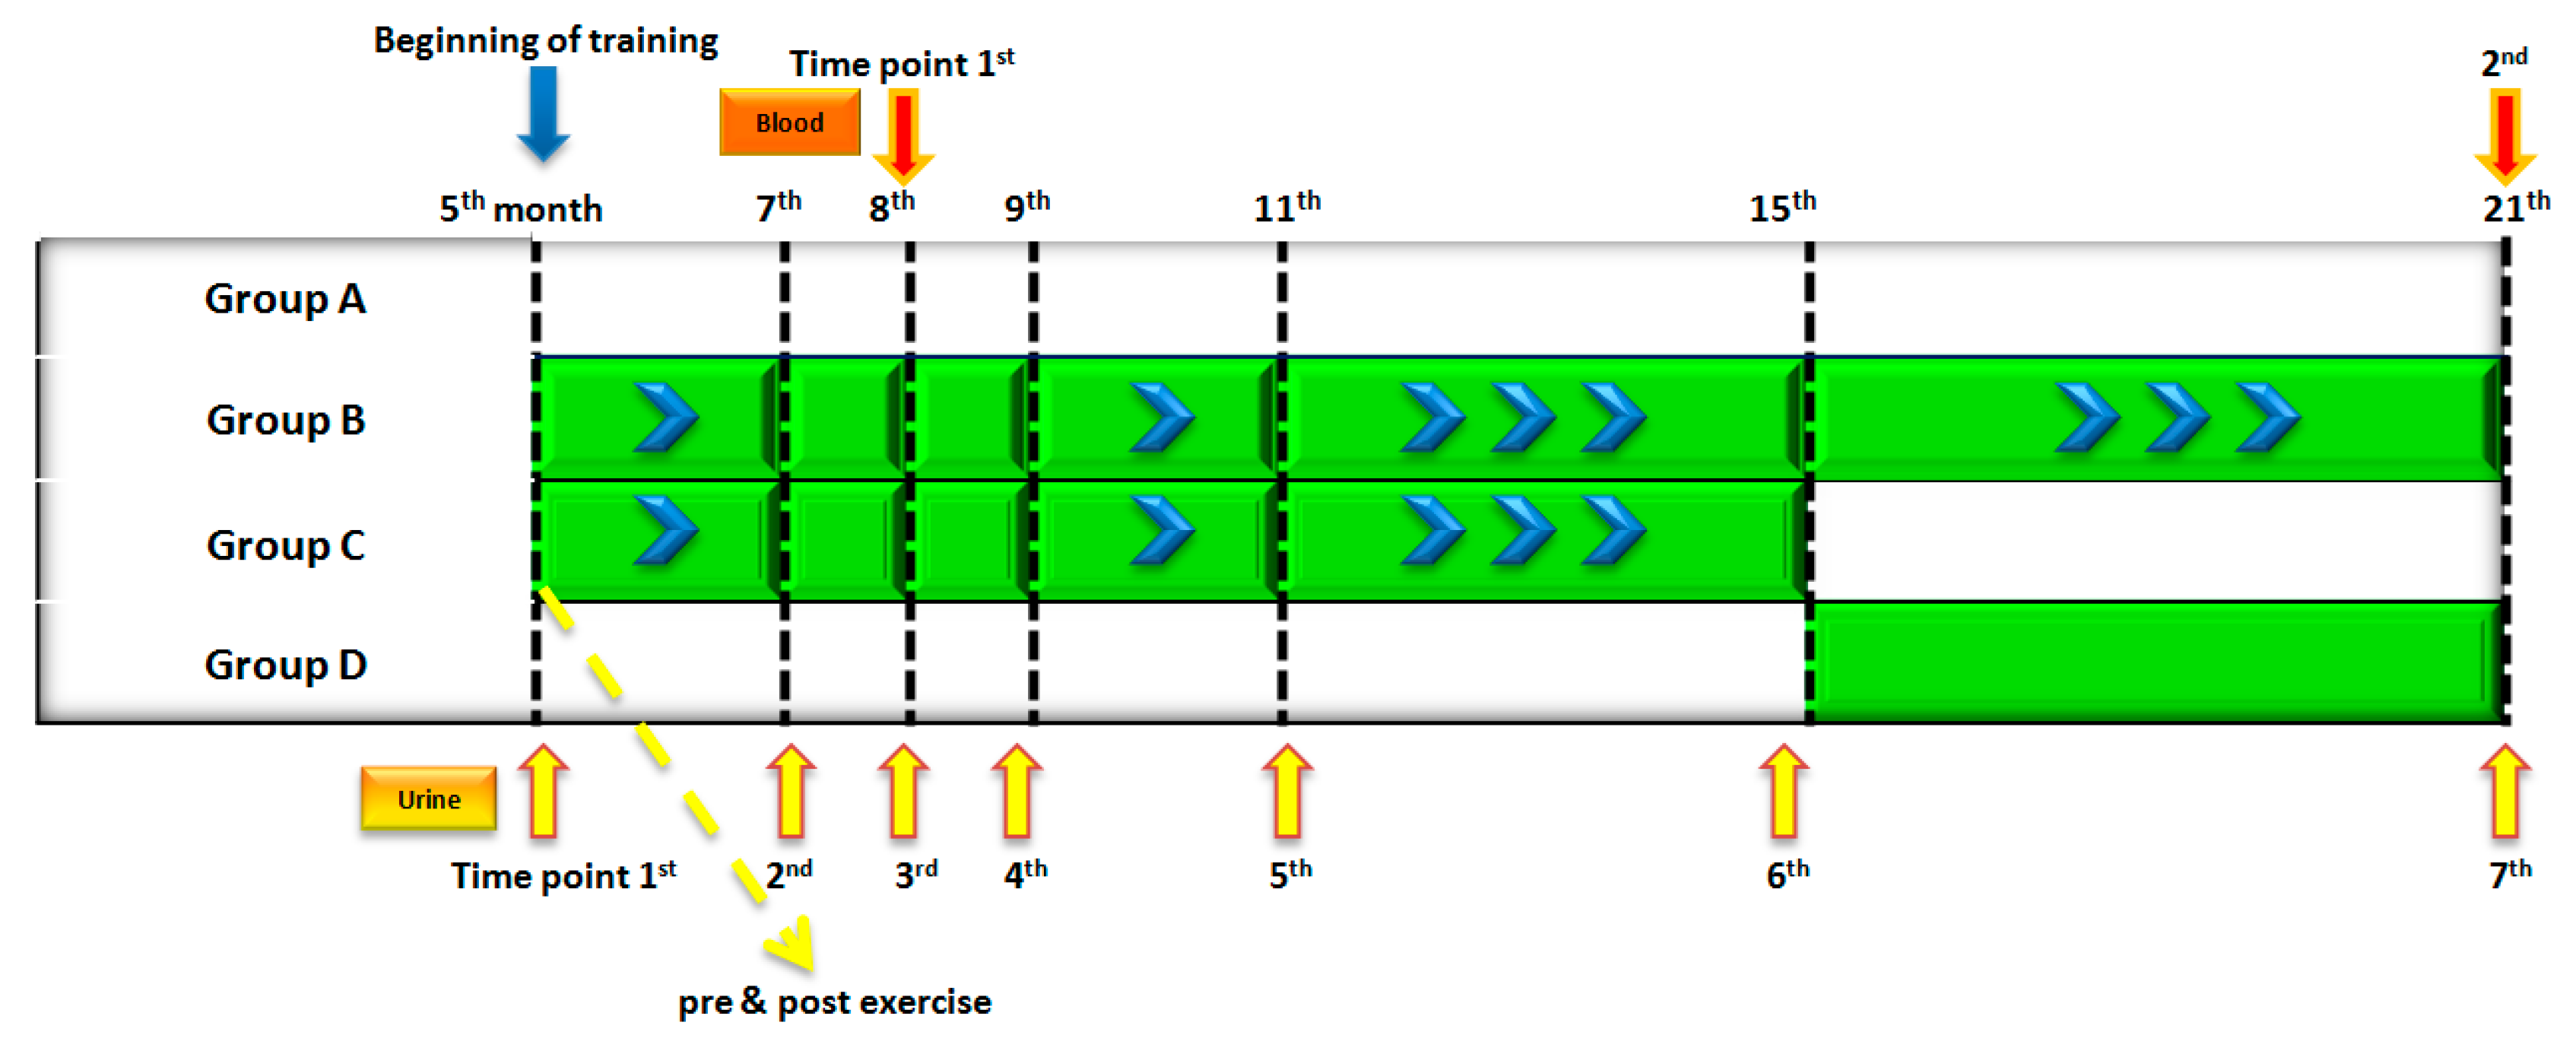
3.1. Samples
3.2. Sample Preparation and Analysis
3.3. Data Analysis
4. Conclusions
Supplementary Materials
Acknowledgments
Author Contributions
Conflicts of Interest
References
- Houtkooper, R.H.; Argmann, C.; Houten, S.M.; Cantó, C.; Jeninga, E.H.; Andreux, P.A.; Thomas, C.; Doenlen, R.; Schoonjans, K.; Auwerx, J. The metabolic footprint of aging in mice. Sci. Rep. 2011, 1, 134. [Google Scholar] [PubMed]
- Williams, R.E.; Lenz, E.M.; Lowden, J.S.; Rantalainen, M.; Wilson, I.D. The metabonomics of aging and development in the rat: An investigation into the effect of age on the profile of endogenous metabolites in the urine of male rats using 1H NMR and HPLC-TOF MS. Mol. BioSyst. 2005, 1, 166–175. [Google Scholar] [CrossRef] [PubMed]
- De Guzman, J.M.; Ku, G.; Fahey, R.; Youm, Y.-H.; Kass, I.; Ingram, D.K.; Dixit, V.D.; Kheterpal, I. Chronic caloric restriction partially protects against age-related alteration in serum metabolome. Age 2013, 35, 1091–1104. [Google Scholar] [CrossRef] [PubMed]
- Son, N.; Hur, H.J.; Sung, M.J.; Kim, M.-S.; Hwang, J.-T.; Park, J.H.; Yang, H.J.; Kwon, D.Y.; Yoon, S.H.; Chung, H.Y.; Kim, H.-J. Liquid chromatography-mass spectrometry-based metabolomic analysis of livers from aged rats. J. Proteome Res. 2012, 11, 2551–2558. [Google Scholar] [CrossRef] [PubMed]
- Plumb, R.S.; Granger, J.H.; Stumpf, C.L.; Johnson, K.A.; Smith, B.W.; Gaulitz, S.; Wilson, I.D.; Castro-Perez, J. A rapid screening approach to metabonomics using UPLC and oa-TOF mass spectrometry: Application to age, gender and diurnal variation in normal/Zucker obese rats and black, white and nude mice. Analyst 2005, 130, 844–849. [Google Scholar] [CrossRef] [PubMed]
- Granger, J.H.; Williams, R.; Lenz, E.M.; Plumb, R.S.; Stumpf, C.L.; Wilson, I.D. A metabonomic study of strain- and age-related differences in the Zucker rat. Rapid Commun. Mass Spectrom. RCM 2007, 21, 2039–2045. [Google Scholar] [CrossRef] [PubMed]
- Yan, S.; Wu, B.; Lin, Z.; Jin, H.; Huang, J.; Yang, Y.; Zhang, X.; Shen, Z.; Zhang, W. Metabonomic characterization of aging and investigation on the anti-aging effects of total flavones of Epimedium. Mol. Biosyst. 2009, 5, 1204–1213. [Google Scholar] [CrossRef] [PubMed]
- Schnackenberg, L.K.; Sun, J.; Espandiari, P.; Holland, R.D.; Hanig, J.; Beger, R.D. Metabonomics evaluations of age-related changes in the urinary compositions of male Sprague Dawley rats and effects of data normalization methods on statistical and quantitative analysis. BMC Bioinform. 2007, 8, S3. [Google Scholar] [CrossRef] [PubMed]
- Tomás-Loba, A.; Bernardes de Jesus, B.; Mato, J.M.; Blasco, M.A. A metabolic signature predicts biological age in mice. Aging Cell 2013, 12, 93–101. [Google Scholar] [CrossRef] [PubMed]
- Calvani, R.; Brasili, E.; Praticò, G.; Capuani, G.; Tomassini, A.; Marini, F.; Sciubba, F.; Finamore, A.; Roselli, M.; Marzetti, E.; et al. Fecal and urinary NMR-based metabolomics unveil an aging signature in mice. Exp. Gerontol. 2014, 49, 5–11. [Google Scholar] [CrossRef] [PubMed]
- Saric, J.; Wang, Y.; Li, J.; Coen, M.; Utzinger, J.; Marchesi, J.R.; Keiser, J.; Veselkov, K.; Lindon, J.C.; Nicholson, J.K.; et al. Species variation in the fecal metabolome gives insight into differential gastrointestinal function. J. Proteome Res. 2008, 7, 352–360. [Google Scholar] [CrossRef] [PubMed]
- Nevedomskaya, E.; Ramautar, R.; Derks, R.; Westbroek, I.; Zondag, G.; van der Pluijm, I.; Deelder, A.M.; Mayboroda, O.A. CE-MS for Metabolic Profiling of Volume-Limited Urine Samples: Application to Accelerated Aging TTD Mice. J. Proteome Res. 2010, 9, 4869–4874. [Google Scholar] [CrossRef] [PubMed]
- Valdes, A.M.; Glass, D.; Spector, T.D. Omics technologies and the study of human ageing. Nat. Rev. Genet. 2013, 14, 601–607. [Google Scholar] [PubMed]
- Mishur, R.J.; Rea, S.L. Applications of mass spectrometry to metabolomics and metabonomics: Detection of biomarkers of aging and of age-related diseases. Mass Spectrom. Rev. 2012, 31, 70–95. [Google Scholar] [CrossRef] [PubMed]
- Wu, J.; Gao, Y. Physiological conditions can be reflected in human urine proteome and metabolome. Expert Rev. Proteom. 2015, 12, 623–636. [Google Scholar] [CrossRef] [PubMed]
- Charansonney, O.L. Physical Activity and Aging: A Life-Long Story. Discov. Med. 2011, 12, 177–185. [Google Scholar] [PubMed]
- Heinonen, I.; Kalliokoski, K.K.; Hannukainen, J.C.; Duncker, D.J.; Nuutila, P.; Knuuti, J. Organ-specific physiological responses to acute physical exercise and long-term training in humans. Physiology 2014, 29, 421–436. [Google Scholar] [CrossRef] [PubMed]
- Feo, P.P.D.; Loreto, C.D.; Lucidi, P.; Murdolo, G.; Parlanti, N.; Cicco, A.D.; Santeusanio, F.P.F. Metabolic response to exercise. J. Endocrinol. Investig. 2014, 26, 851–854. [Google Scholar] [CrossRef]
- Pechlivanis, A.; Kostidis, S.; Saraslanidis, P.; Petridou, A.; Tsalis, G.; Mougios, V.; Gika, H.G.; Mikros, E.; Theodoridis, G.A. 1H NMR-based metabonomic investigation of the effect of two different exercise sessions on the metabolic fingerprint of human urine. J. Proteome Res. 2010, 9, 6405–6416. [Google Scholar] [CrossRef] [PubMed]
- Pechlivanis, A.; Kostidis, S.; Saraslanidis, P.; Petridou, A.; Tsalis, G.; Veselkov, K.; Mikros, E.; Mougios, V.; Theodoridis, G.A. 1H NMR study on the short- and long-term impact of two training programs of sprint running on the metabolic fingerprint of human serum. J. Proteome Res. 2013, 12, 470–480. [Google Scholar] [CrossRef] [PubMed]
- Pechlivanis, A.; Papaioannou, K.G.; Tsalis, G.; Saraslanidis, P.; Mougios, V.; Theodoridis, G.A. Monitoring the Response of the Human Urinary Metabolome to Brief Maximal Exercise by a Combination of RP-UPLC–MS and 1H NMR Spectroscopy. J. Proteome Res. 2015, 14, 4610–4622. [Google Scholar] [CrossRef] [PubMed]
- Lewis, G.D.; Farrell, L.; Wood, M.J.; Martinovic, M.; Arany, Z.; Rowe, G.C.; Souza, A.; Cheng, S.; McCabe, E.L.; Yang, E.; et al. Metabolic Signatures of Exercise in Human Plasma. Sci. Transl. Med. 2010, 2, 33ra37. [Google Scholar] [CrossRef] [PubMed]
- Kuehnbaum, N.L.; Gillen, J.B.; Gibala, M.J.; Britz-McKibbin, P. Personalized metabolomics for predicting glucose tolerance changes in sedentary women after high-intensity interval training. Sci. Rep. 2014, 4, 6166. [Google Scholar] [CrossRef] [PubMed]
- Enea, C.; Seguin, F.; Petitpas-Mulliez, J.; Boildieu, N.; Boisseau, N.; Delpech, N.; Diaz, V.; Eugène, M.; Dugué, B. 1H NMR-based metabolomics approach for exploring urinary metabolome modifications after acute and chronic physical exercise. Anal. Bioanal. Chem. 2010, 396, 1167–1176. [Google Scholar] [CrossRef] [PubMed]
- Huang, C.-C.; Lin, W.-T.; Hsu, F.-L.; Tsai, P.-W.; Hou, C.-C. Metabolomics investigation of exercise-modulated changes in metabolism in rat liver after exhaustive and endurance exercises. Eur. J. Appl. Physiol. 2009, 108, 557–566. [Google Scholar] [CrossRef] [PubMed]
- Pechlivanis, A.; Chatziioannou, A.C.; Veskoukis, A.S.; Kouretas, D.; Mougios, V.; Theodoridis, G.A. GC–MS analysis of blood for the metabonomic investigation of the effects of physical exercise and allopurinol administration on rats. J. Chromatogr. B Anal. Technol. Biomed. Life Sci. 2014, 966, 127–131. [Google Scholar] [CrossRef] [PubMed]
- Wone, B.; Donovan, E.R.; Hayes, J.P. Metabolomics of aerobic metabolism in mice selected for increased maximal metabolic rate. Comp. Biochem. Physiol. Part D Genom. Proteom. 2011, 6, 399–405. [Google Scholar] [CrossRef] [PubMed]
- Monleon, D.; Garcia-Valles, R.; Morales, J.M.; Brioche, T.; Olaso-Gonzalez, G.; Lopez-Grueso, R.; Gomez-Cabrera, M.C.; Viña, J. Metabolomic analysis of long-term spontaneous exercise in mice suggests increased lipolysis and altered glucose metabolism when animals are at rest. J. Appl. Physiol. 2014, 117, 1110–1119. [Google Scholar] [CrossRef] [PubMed]
- Janssens, S.; Jonkers, R.A.M.; Groen, A.K.; Nicolay, K.; van Loon, L.J.C.; Prompers, J.J. Effects of acute exercise on lipid content and dietary lipid uptake in liver and skeletal muscle of lean and diabetic rats. Am. J. Physiol. Endocrinol. Metab. 2015, 309, E874–E883. [Google Scholar] [CrossRef] [PubMed]
- Duggan, G.E.; Hittel, D.S.; Sensen, C.W.; Weljie, A.M.; Vogel, H.J.; Shearer, J. Metabolomic response to exercise training in lean and diet-induced obese mice. J. Appl. Physiol. 2011, 110, 1311–1318. [Google Scholar] [CrossRef] [PubMed]
- Le Moyec, L.; Mille-Hamard, L.; Triba, M.N.; Breuneval, C.; Petot, H.; Billat, V.L. NMR metabolomics for assessment of exercise effects with mouse biofluids. Anal. Bioanal. Chem. 2012, 404, 593–602. [Google Scholar] [CrossRef] [PubMed]
- Hu, C.; Hoene, M.; Zhao, X.; Häring, H.U.; Schleicher, E.; Lehmann, R.; Han, X.; Xu, G.; Weigert, C. Lipidomics analysis reveals efficient storage of hepatic triacylglycerides enriched in unsaturated fatty acids after one bout of exercise in mice. PLoS ONE 2010, 5, e13318. [Google Scholar] [CrossRef] [PubMed]
- Dotzert, M.S.; Murray, M.R.; McDonald, M.W.; Olver, T.D.; Velenosi, T.J.; Hennop, A.; Noble, E.G.; Urquhart, B.L.; Melling, C.W.J. Metabolomic Response of Skeletal Muscle to Aerobic Exercise Training in Insulin Resistant Type 1 Diabetic Rats. Sci. Rep. 2016, 6, 26379. [Google Scholar] [CrossRef] [PubMed]
- Niel, R.; Ayachi, M.; Mille-Hamard, L.; Le Moyec, L.; Savarin, P.; Clement, M.-J.; Besse, S.; Launay, T.; Billat, V.L.; Momken, I. A new model of short acceleration-based training improves exercise performance in old mice. Scand. J. Med. Sci. Sports 2016. [Google Scholar] [CrossRef] [PubMed]
- Daskalaki, E.; Easton, C.; Watson, D.G. The Application of Metabolomic Profiling to the Effects of Physical Activity. Curr. Metab. 2014, 2, 233–263. [Google Scholar] [CrossRef]
- Goutianos, G.; Tzioura, A.; Kyparos, A.; Paschalis, V.; Margaritelis, N.V.; Veskoukis, A.S.; Zafeiridis, A.; Dipla, K.; Nikolaidis, M.G.; Vrabas, I.S. The rat adequately reflects human responses to exercise in blood biochemical profile: A comparative study. Physiol. Rep. 2015, 3. [Google Scholar] [CrossRef] [PubMed]
- Ichikawa, M.; Fujita, Y.; Ebisawa, H.; Ozeki, T. Effects of long-term, light exercise under restricted feeding on age-related changes in physiological and metabolic variables in male Wistar rats. Mech. Ageing Dev. 2000, 113, 23–35. [Google Scholar] [CrossRef]
- Kiran, T.R.; Subramanyam, M.V.V.; Devi, S.A. Swim exercise training and adaptations in the antioxidant defense system of myocardium of old rats: Relationship to swim intensity and duration. Comp. Biochem. Physiol. B Biochem. Mol. Biol. 2004, 137, 187–196. [Google Scholar] [CrossRef] [PubMed]
- Leite, M.R.; Cechella, J.L.; Mantovani, A.C.; Duarte, M.M.M.F.; Nogueira, C.W.; Zeni, G. Swimming exercise and diphenyl diselenide-supplemented diet affect the serum levels of pro- and anti-inflammatory cytokines differently depending on the age of rats. Cytokine 2015, 71, 119–123. [Google Scholar] [CrossRef] [PubMed]
- Ringholm, S.; Olesen, J.; Pedersen, J.T.; Brandt, C.T.; Halling, J.F.; Hellsten, Y.; Prats, C.; Pilegaard, H. Effect of lifelong resveratrol supplementation and exercise training on skeletal muscle oxidative capacity in aging mice; impact of PGC-1α. Exp. Gerontol. 2013, 48, 1311–1318. [Google Scholar] [CrossRef] [PubMed]
- Asha Devi, S.; Prathima, S.; Subramanyam, M.V.V. Dietary vitamin E and physical exercise: I. Altered endurance capacity and plasma lipid profile in ageing rats. Exp. Gerontol. 2003, 38, 285–290. [Google Scholar] [CrossRef]
- Garvey, S.M.; Russ, D.W.; Skelding, M.B.; Dugle, J.E.; Edens, N.K. Molecular and metabolomic effects of voluntary running wheel activity on skeletal muscle in late middle-aged rats. Physiol. Rep. 2015, 3, e12319. [Google Scholar] [CrossRef] [PubMed]
- Deda, O.; Gika, H.; Panagoulis, T.; Taitzoglou, I.; Raikos, N.; Theodoridis, G. Impact of exercise on fecal and cecal metabolome over aging: A longitudinal study in rats. Bioanalysis 2017, 9, 21–36. [Google Scholar] [CrossRef] [PubMed]
- Sutton, J.R.; Toews, C.J.; Ward, G.R.; Fox, I.H. Purine metabolism during strenuous muscular exercise in man. Metabolism 1980, 29, 254–260. [Google Scholar] [CrossRef]
- Bianchi, G.P.; Grossi, G.; Bargossi, A.M.; Fiorella, P.L.; Marchesini, G. Can oxypurines plasma levels classify the type of physical exercise? J. Sports Med. Phys. Fit. 1999, 39, 123–127. [Google Scholar]
- Xia, J.; Sinelnikov, I.V.; Han, B.; Wishart, D.S. MetaboAnalyst 3.0—Making metabolomics more meaningful. Nucleic Acids Res. 2015, 43, W251–W257. [Google Scholar] [CrossRef] [PubMed]
- Manore, M.M. Effect of physical activity on thiamine, riboflavin, and vitamin B-6 requirements. Am. J. Clin. Nutr. 2000, 72, 598s–606s. [Google Scholar] [PubMed]
- Crinò, A.; Schiaffini, R.; Manfrini, S.; Mesturino, C.; Visalli, N.; Beretta Anguissola, G.; Suraci, C.; Pitocco, D.; Spera, S.; Corbi, S.; et al. IMDIAB group A randomized trial of nicotinamide and vitamin E in children with recent onset type 1 diabetes (IMDIAB IX). Eur. J. Endocrinol. 2004, 150, 719–724. [Google Scholar] [CrossRef] [PubMed]
- Pociot, F.; Reimers, J.I.; Andersen, H.U. Nicotinamide—Biological actions and therapeutic potential in diabetes prevention. IDIG Workshop, Copenhagen, Denmark, 4–5 December 1992. Diabetologia 1993, 36, 574–576. [Google Scholar] [CrossRef] [PubMed]
- Kramer, K.; Dijkstra, H.; Bast, A. Control of physical exercise of rats in a swimming basin. Physiol. Behav. 1993, 53, 271–276. [Google Scholar] [CrossRef]
- Virgiliou, C.; Sampsonidis, I.; Gika, H.G.; Raikos, N.; Theodoridis, G.A. Development and validation of a HILIC-MS/MS multitargeted method for metabolomics applications. Electrophoresis 2015, 36, 2215–2225. [Google Scholar] [CrossRef] [PubMed]
- Deda, O.; Chatziioannou, A.C.; Fasoula, S.; Palachanis, D.; Raikos, Ν.; Theodoridis, G.A.; Gika, H.G. Sample preparation optimization in fecal metabolic profiling. J. Chromatogr. B Anal. Technol. Biomed. Life Sci. 2016. [Google Scholar] [CrossRef] [PubMed]
- Gika, H.G.; Zisi, C.; Theodoridis, G.; Wilson, I.D. Protocol for quality control in metabolic profiling of biological fluids by U(H)PLC-MS. J. Chromatogr. B Anal. Technol. Biomed. Life Sci. 2016, 1008, 15–25. [Google Scholar] [CrossRef] [PubMed]
- Gika, H.G.; Theodoridis, G.A.; Plumb, R.S.; Wilson, I.D. Current practice of liquid chromatography–mass spectrometry in metabolomics and metabonomics. J. Pharm. Biomed. Anal. 2014, 87, 12–25. [Google Scholar] [CrossRef] [PubMed]
- Gika, H.G.; Theodoridis, G.A.; Earll, M.; Wilson, I.D. A QC approach to the determination of day-to-day reproducibility and robustness of LC–MS methods for global metabolite profiling in metabonomics/metabolomics. Bioanalysis 2012, 4, 2239–2247. [Google Scholar] [CrossRef] [PubMed]
- Gika, H.G.; Theodoridis, G.A.; Wingate, J.E.; Wilson, I.D. Within-day reproducibility of an HPLC-MS-based method for metabonomic analysis: Application to human urine. J. Proteome Res. 2007, 6, 3291–3303. [Google Scholar] [CrossRef] [PubMed]
- Kanehisa, M.; Goto, S. KEGG: Kyoto encyclopedia of genes and genomes. Nucleic Acids Res. 2000, 28, 27–30. [Google Scholar] [CrossRef] [PubMed]


| Significant Metabolites | VIP Score | p-Value |
|---|---|---|
| Thiamine | 2.096 | 0.001 |
| Adenosine | 2.035 | 0.005 |
| Putrescine | 1.985 | 0.034 |
| Adenine | 1.950 | 0.005 |
| Inosine | 1.860 | 0.015 |
| Acetylcarnitine | 1.779 | 0.011 |
| Niacinamide | 1.723 | 0.016 |
| 3-(4-Hydroxyphenyl)lactate | 1.572 | 0.045 |
| Tryptamine | 1.556 | 0.038 |
| 3-Methylhistidine | 1.470 | 0.023 |
| Glutamic acid | 1.402 | 0.045 |
| Creatine | 1.384 | 0.048 |
© 2017 by the authors. Licensee MDPI, Basel, Switzerland. This article is an open access article distributed under the terms and conditions of the Creative Commons Attribution (CC BY) license ( http://creativecommons.org/licenses/by/4.0/).
Share and Cite
Deda, O.; Gika, H.G.; Taitzoglou, I.; Raikos, Ν.; Theodoridis, G. Impact of Exercise and Aging on Rat Urine and Blood Metabolome. An LC-MS Based Metabolomics Longitudinal Study. Metabolites 2017, 7, 10. https://doi.org/10.3390/metabo7010010
Deda O, Gika HG, Taitzoglou I, Raikos Ν, Theodoridis G. Impact of Exercise and Aging on Rat Urine and Blood Metabolome. An LC-MS Based Metabolomics Longitudinal Study. Metabolites. 2017; 7(1):10. https://doi.org/10.3390/metabo7010010
Chicago/Turabian StyleDeda, Olga, Helen G. Gika, Ioannis Taitzoglou, Νikolaos Raikos, and Georgios Theodoridis. 2017. "Impact of Exercise and Aging on Rat Urine and Blood Metabolome. An LC-MS Based Metabolomics Longitudinal Study" Metabolites 7, no. 1: 10. https://doi.org/10.3390/metabo7010010