
Sample Preparation Strategies for the Effective Quantitation of Hydrophilic Metabolites in Serum by Multi-Targeted HILIC-MS/MS

 ,
,
Abstract
:1. Introduction
2. Results & Discussion
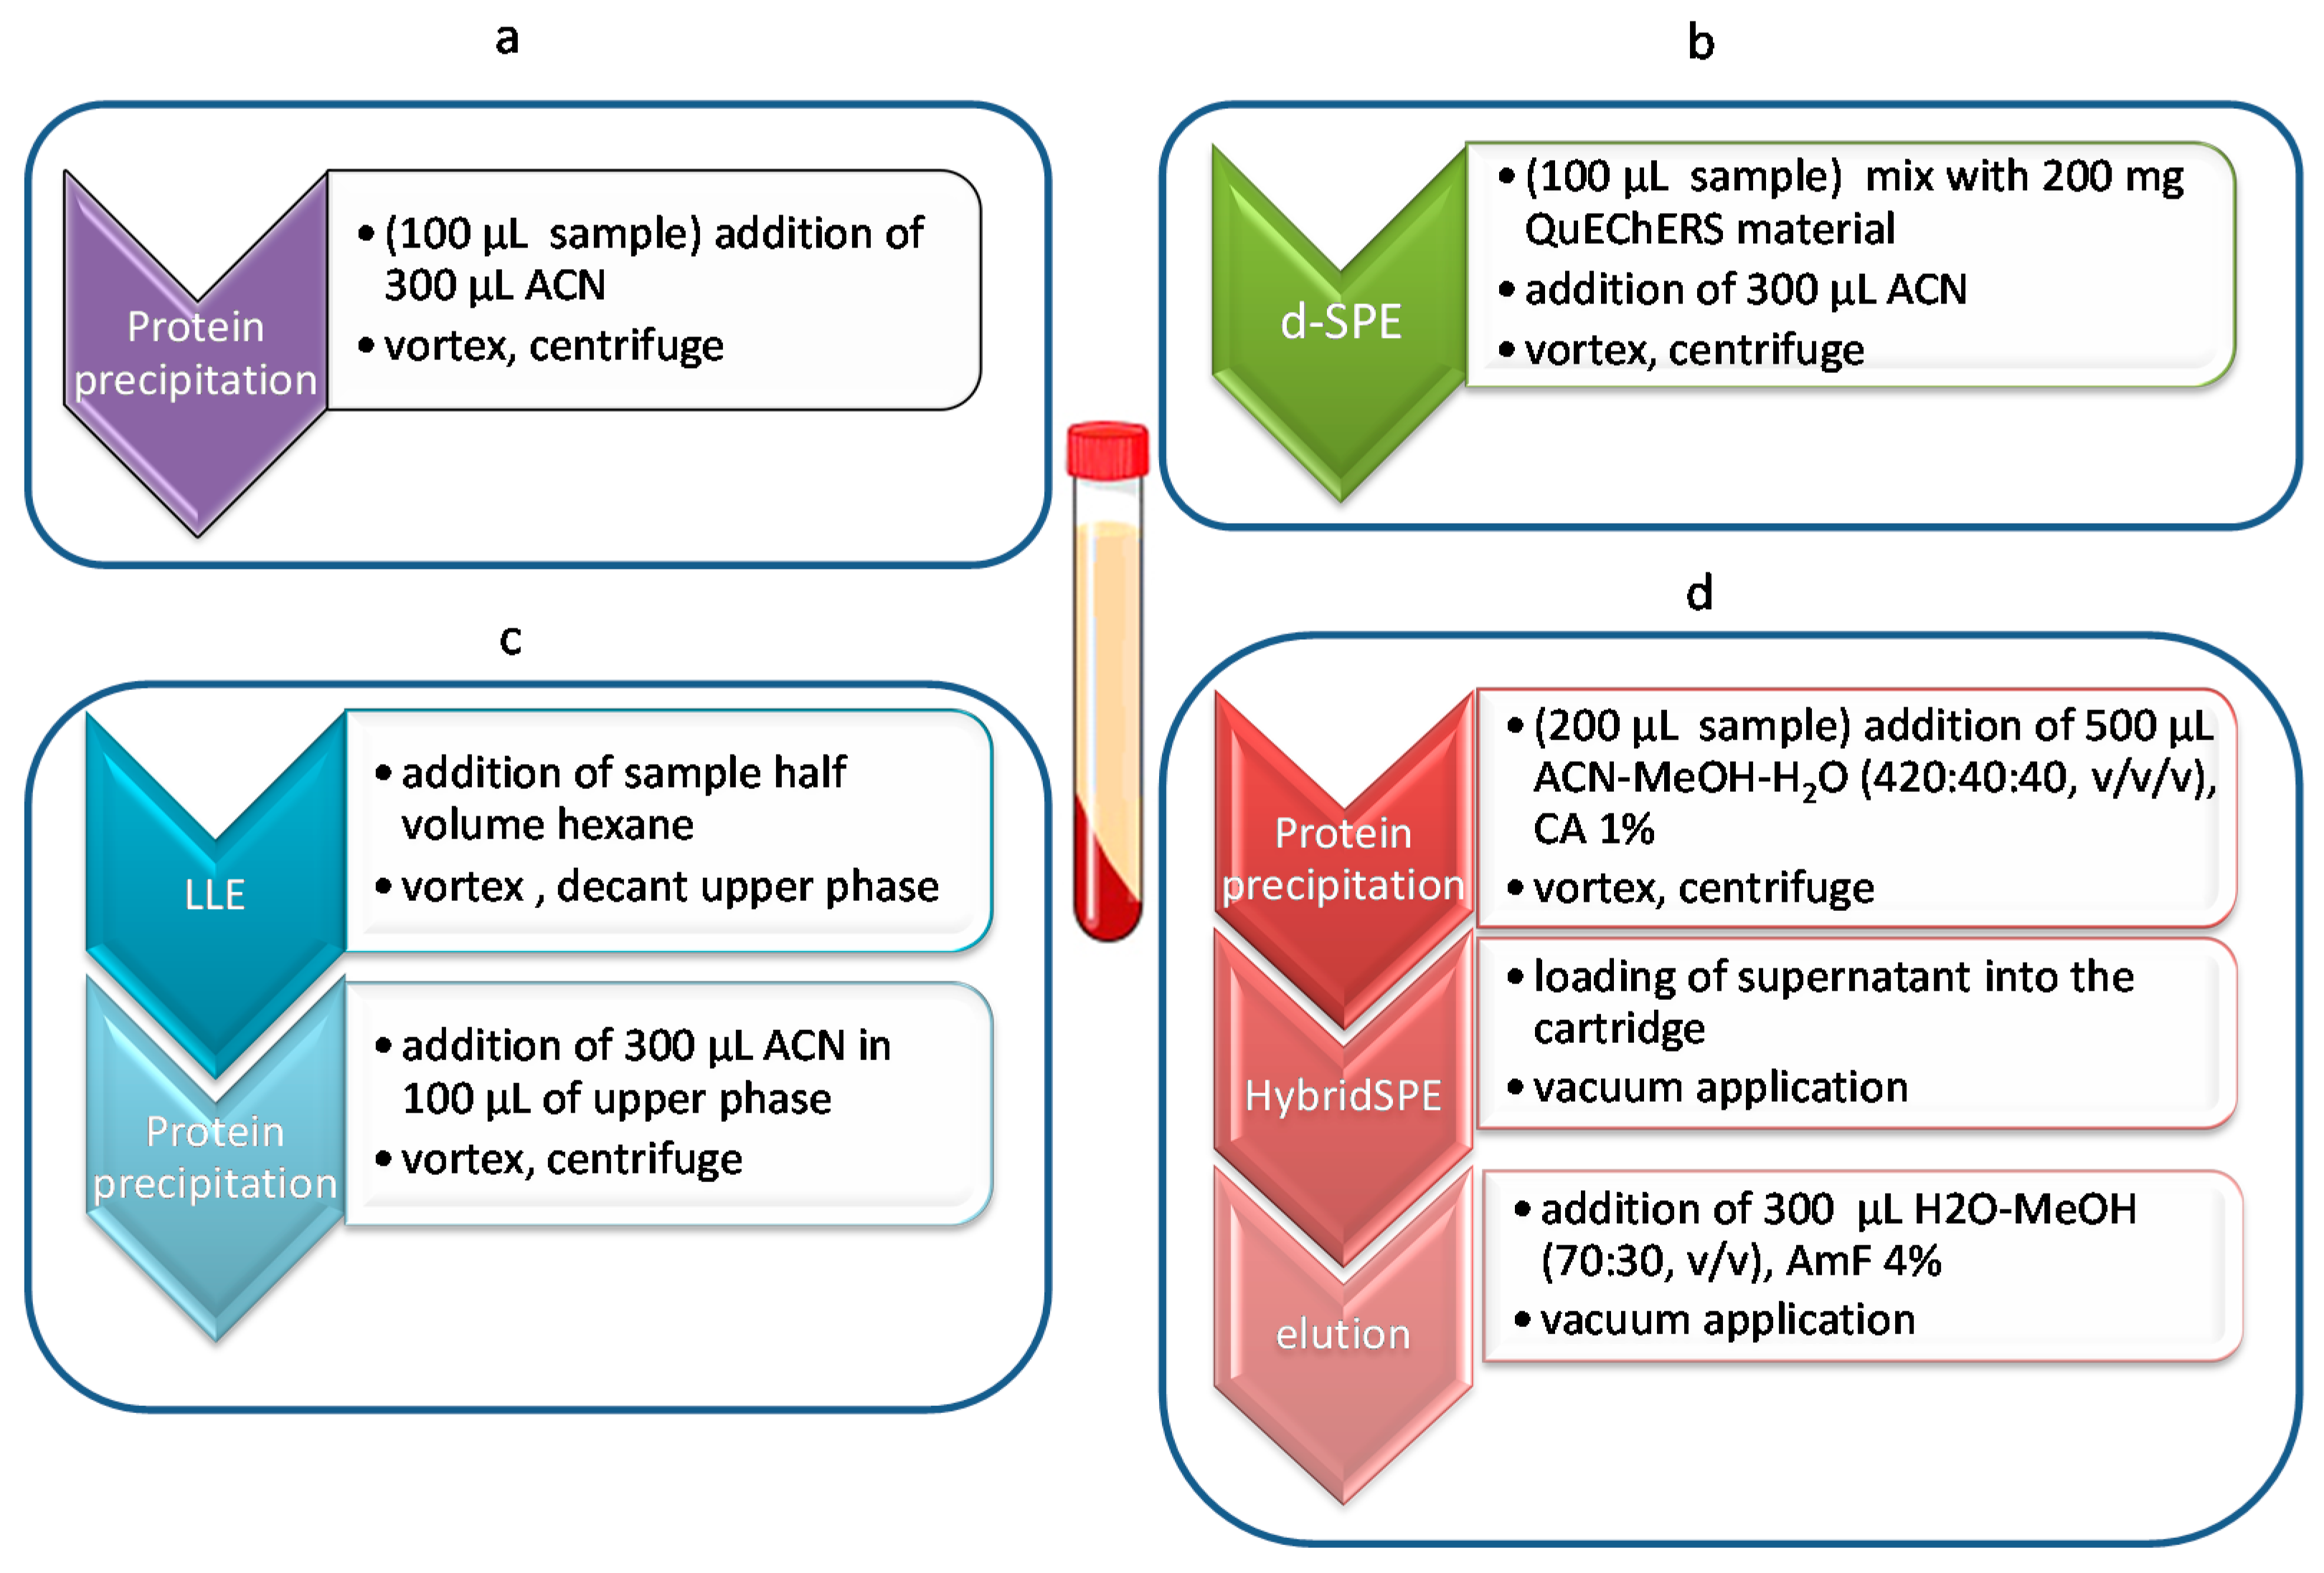
2.1. Dispersive-SPE (QuEChERS)
2.2. LLE
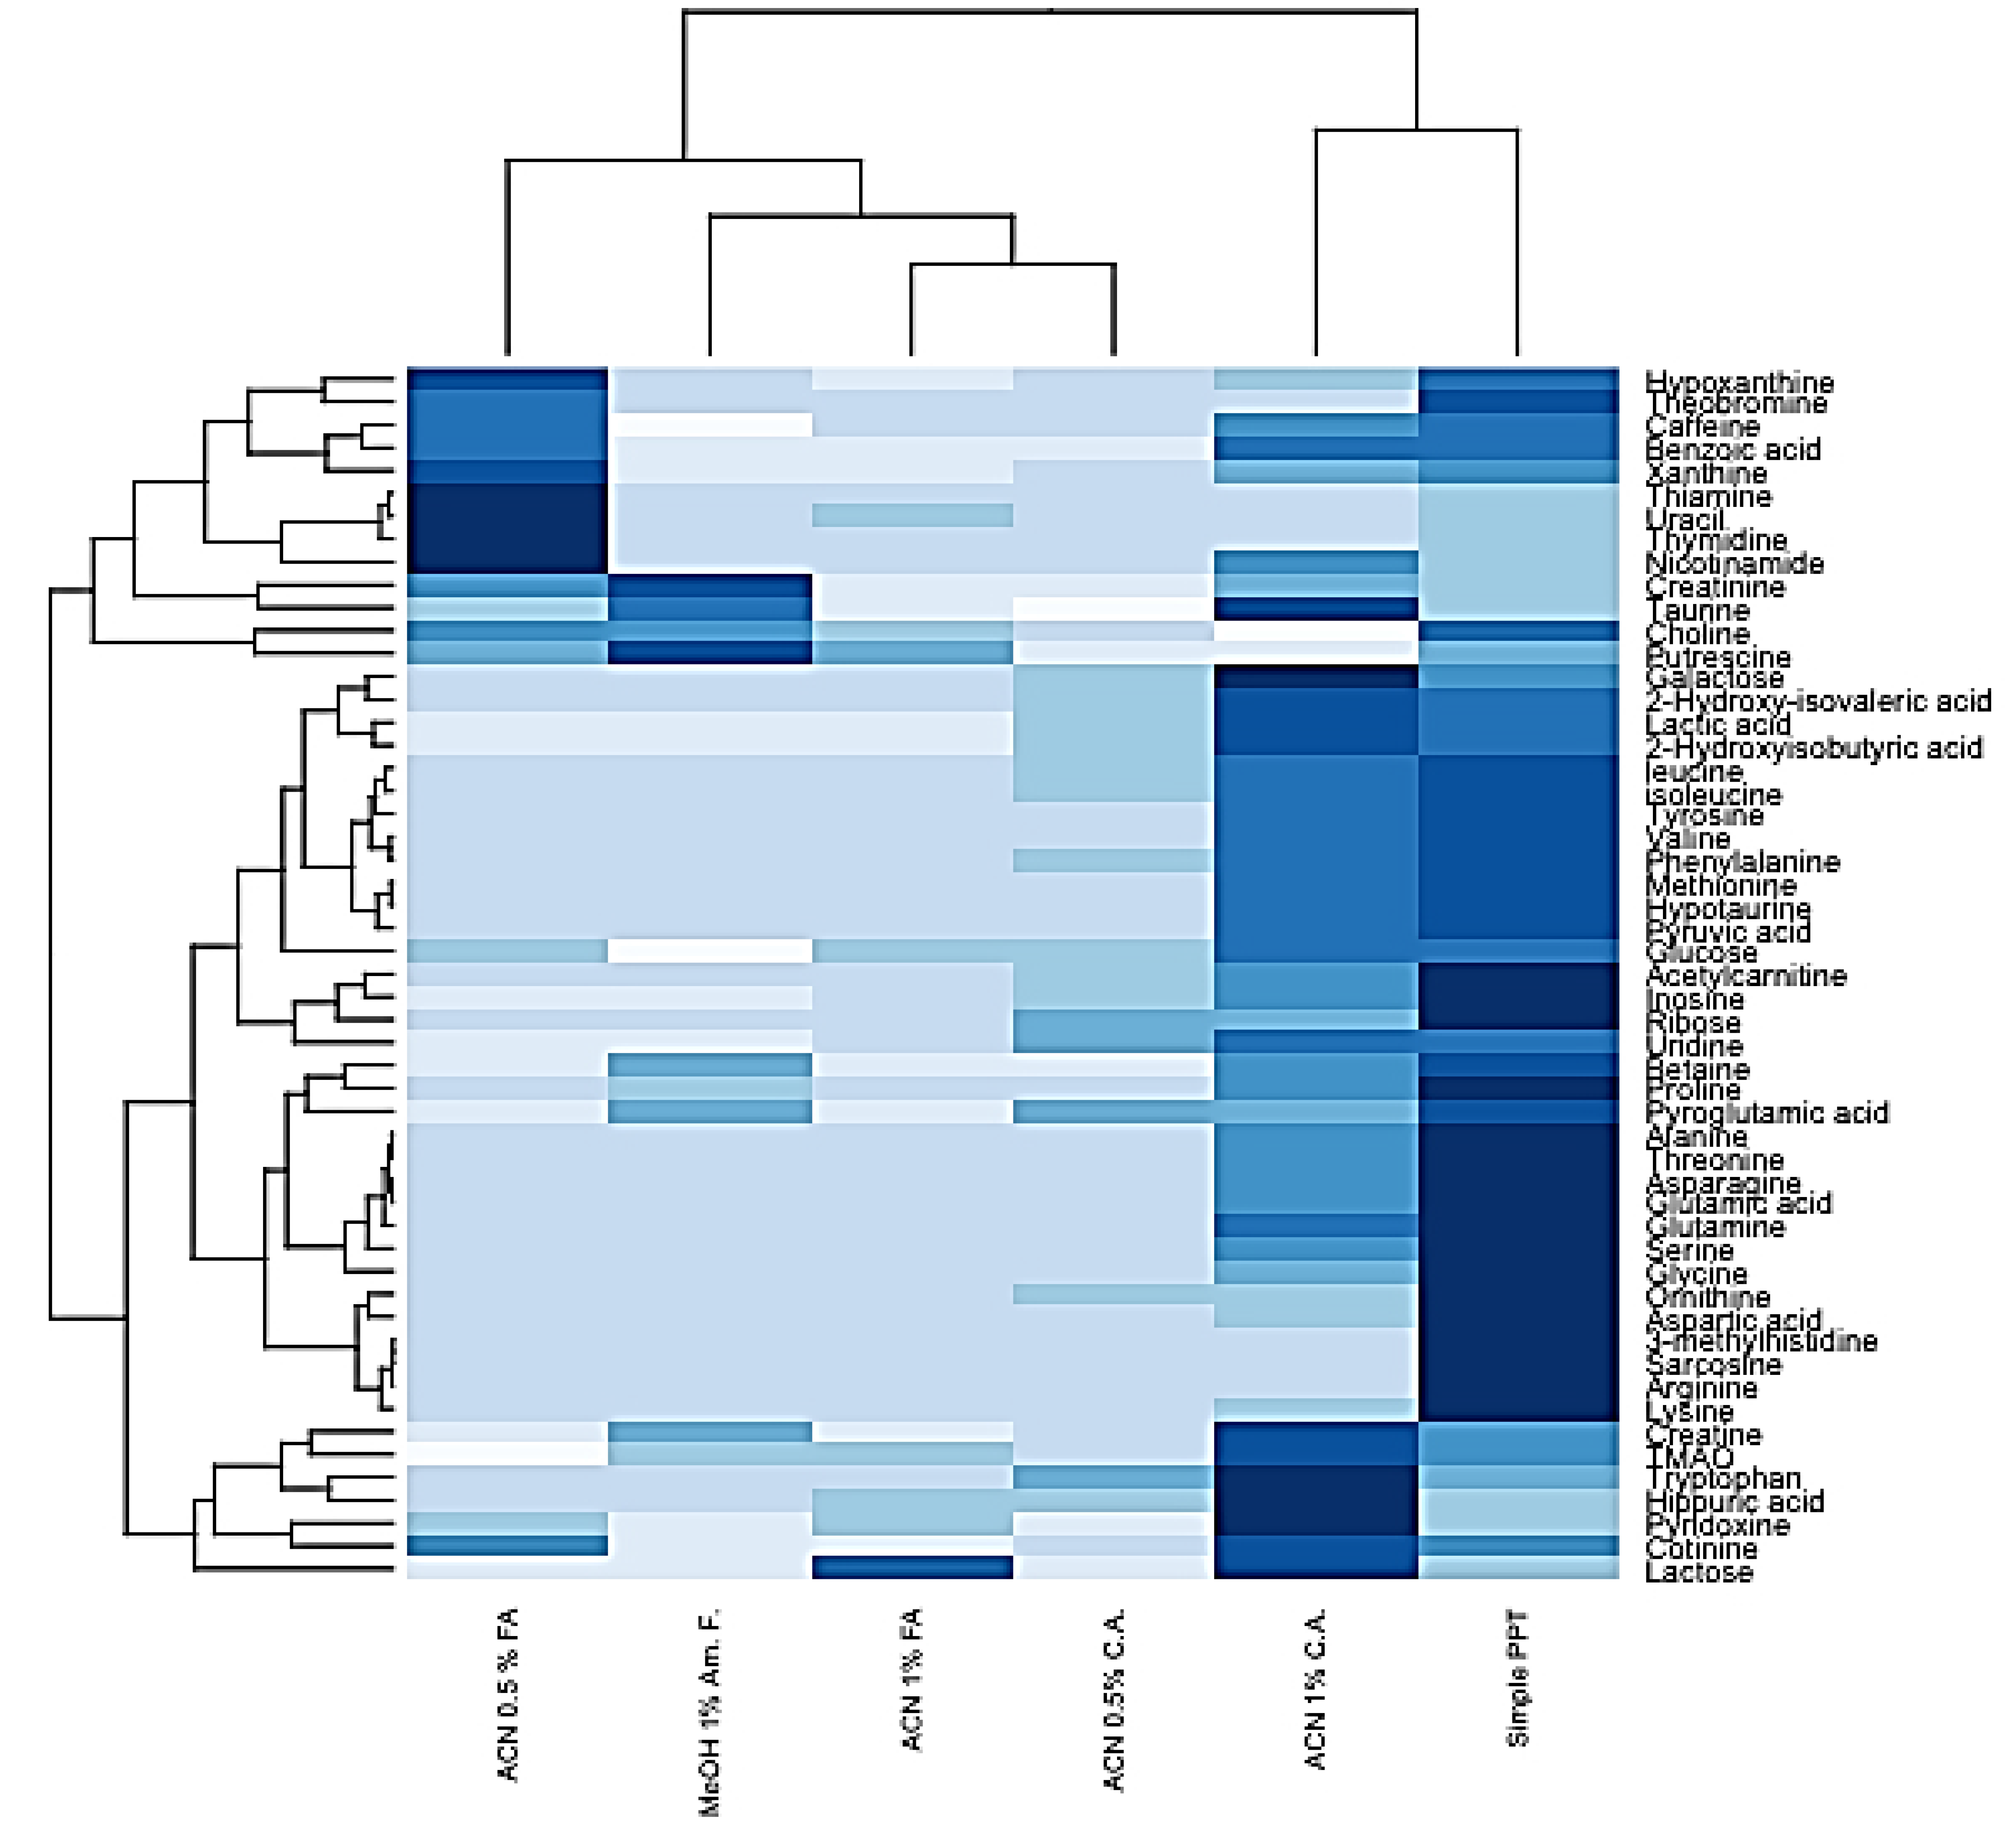
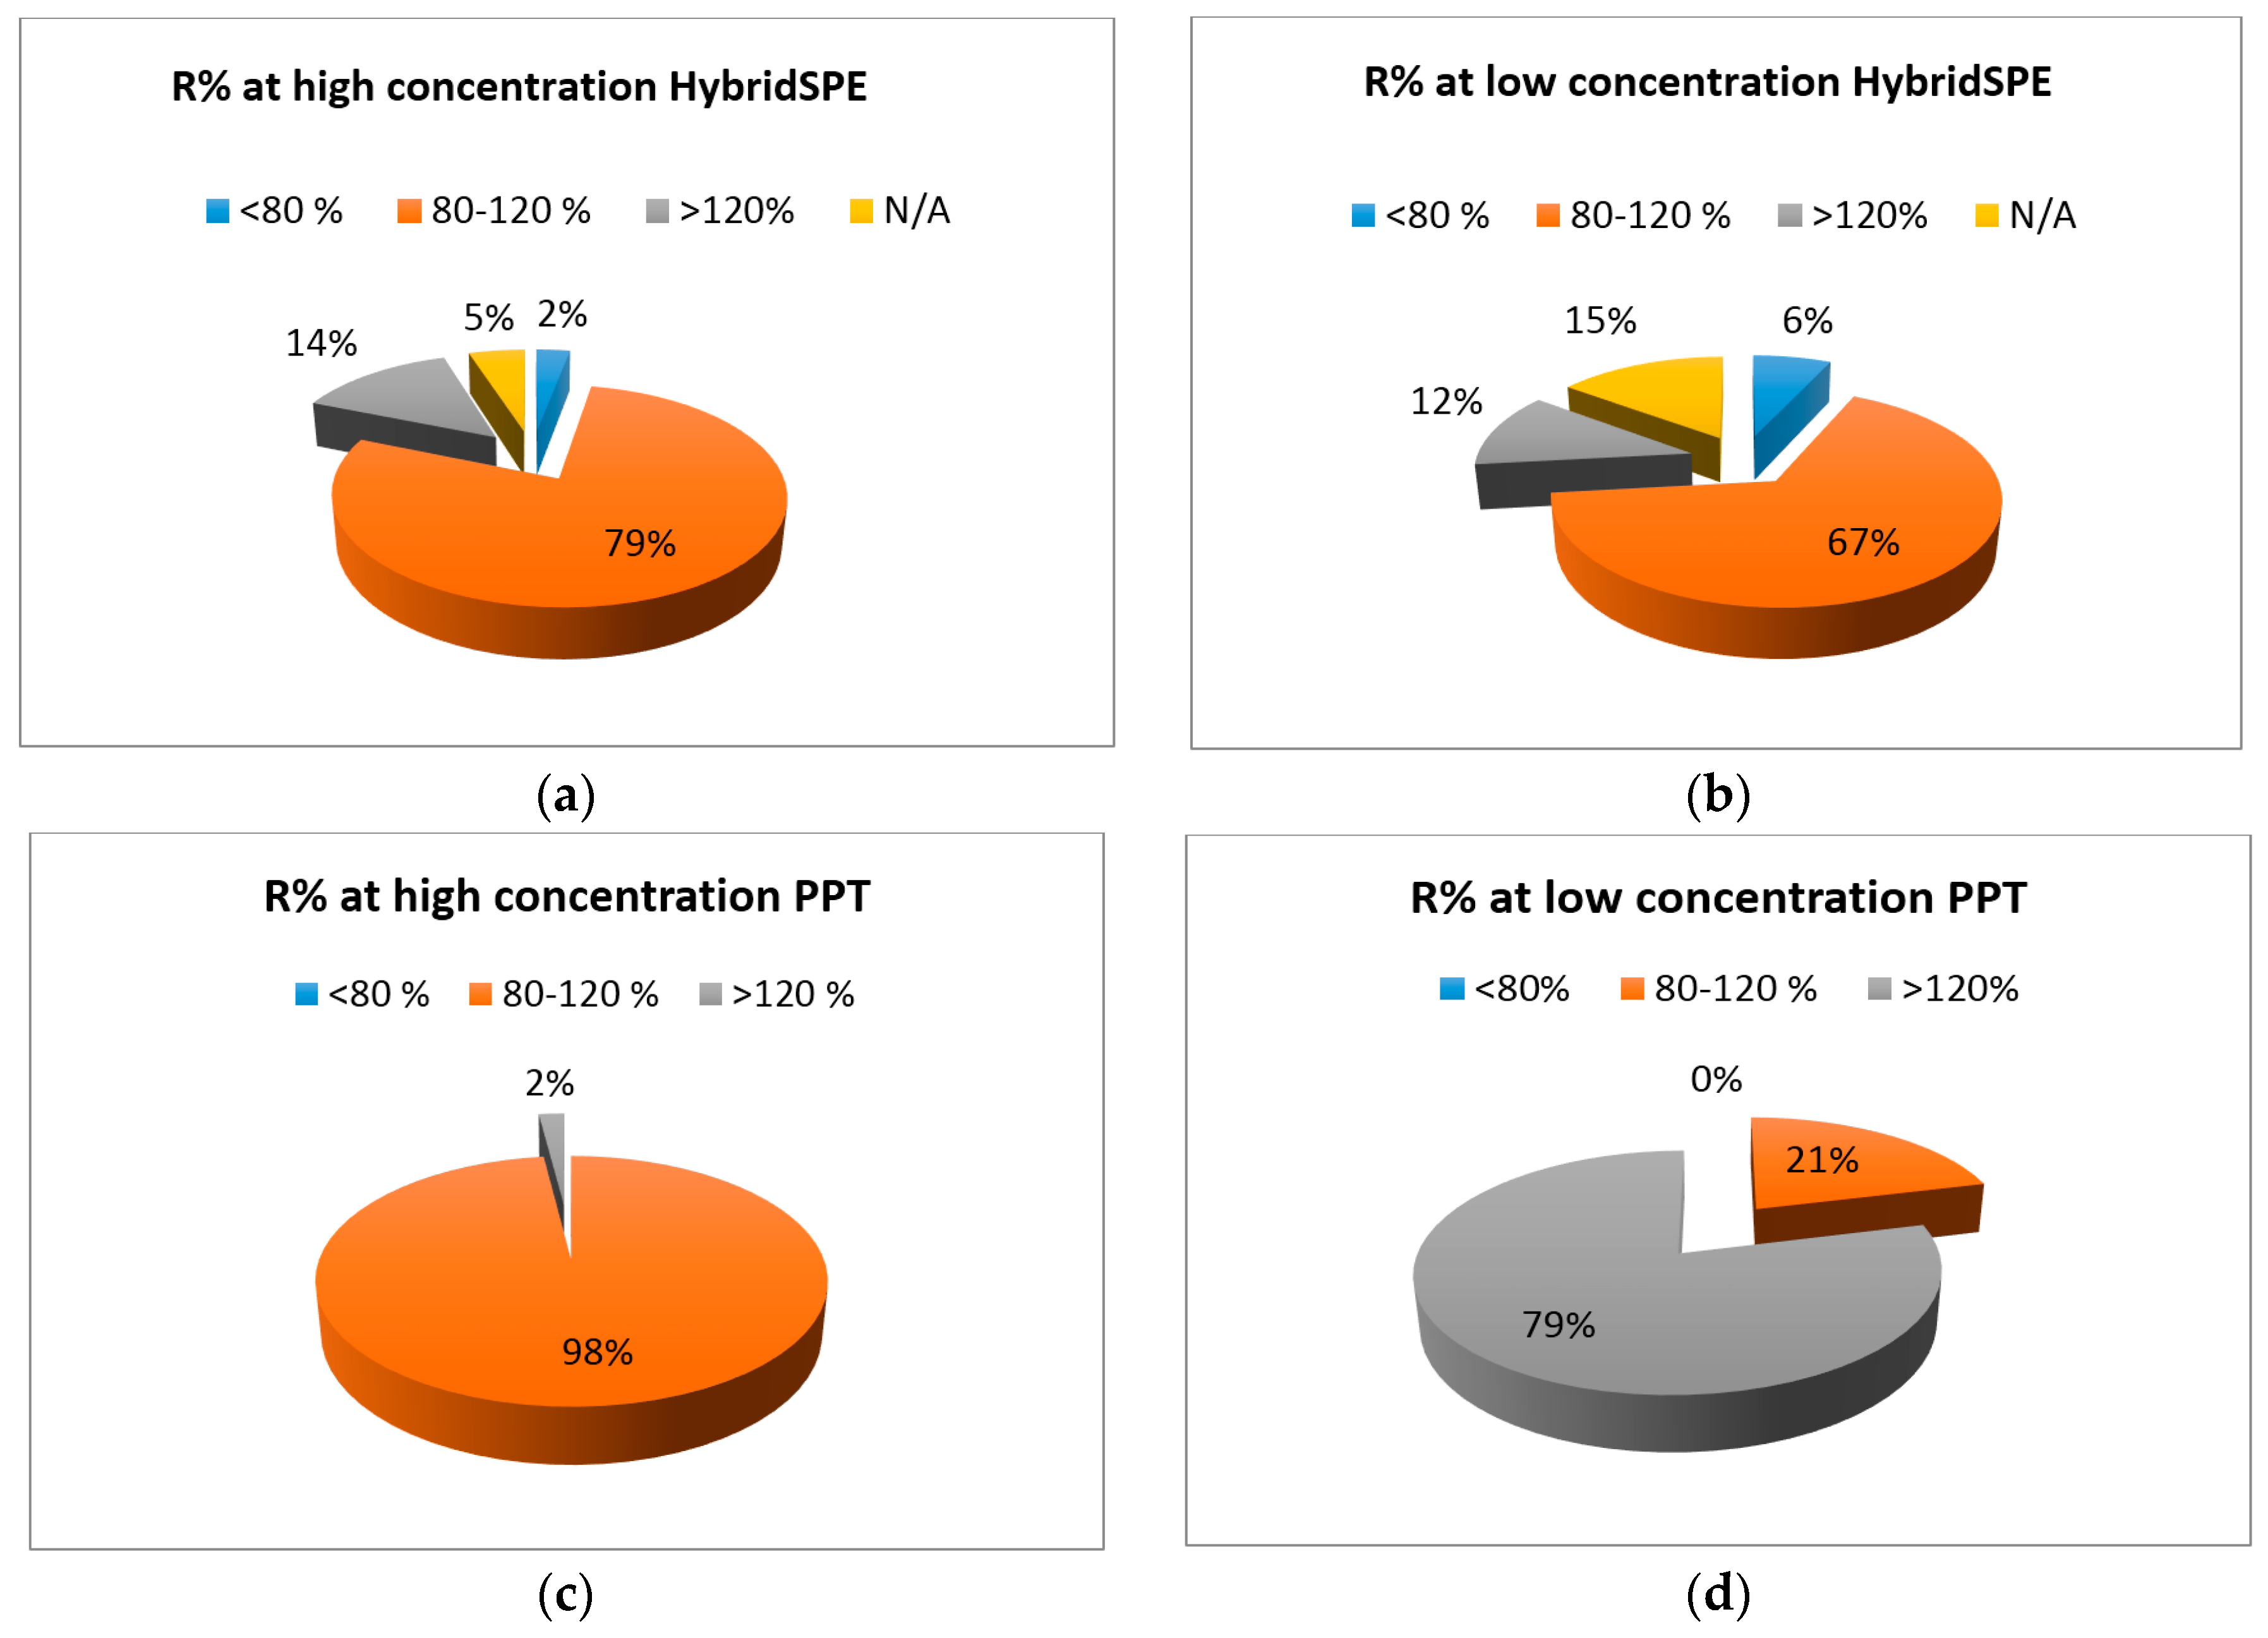
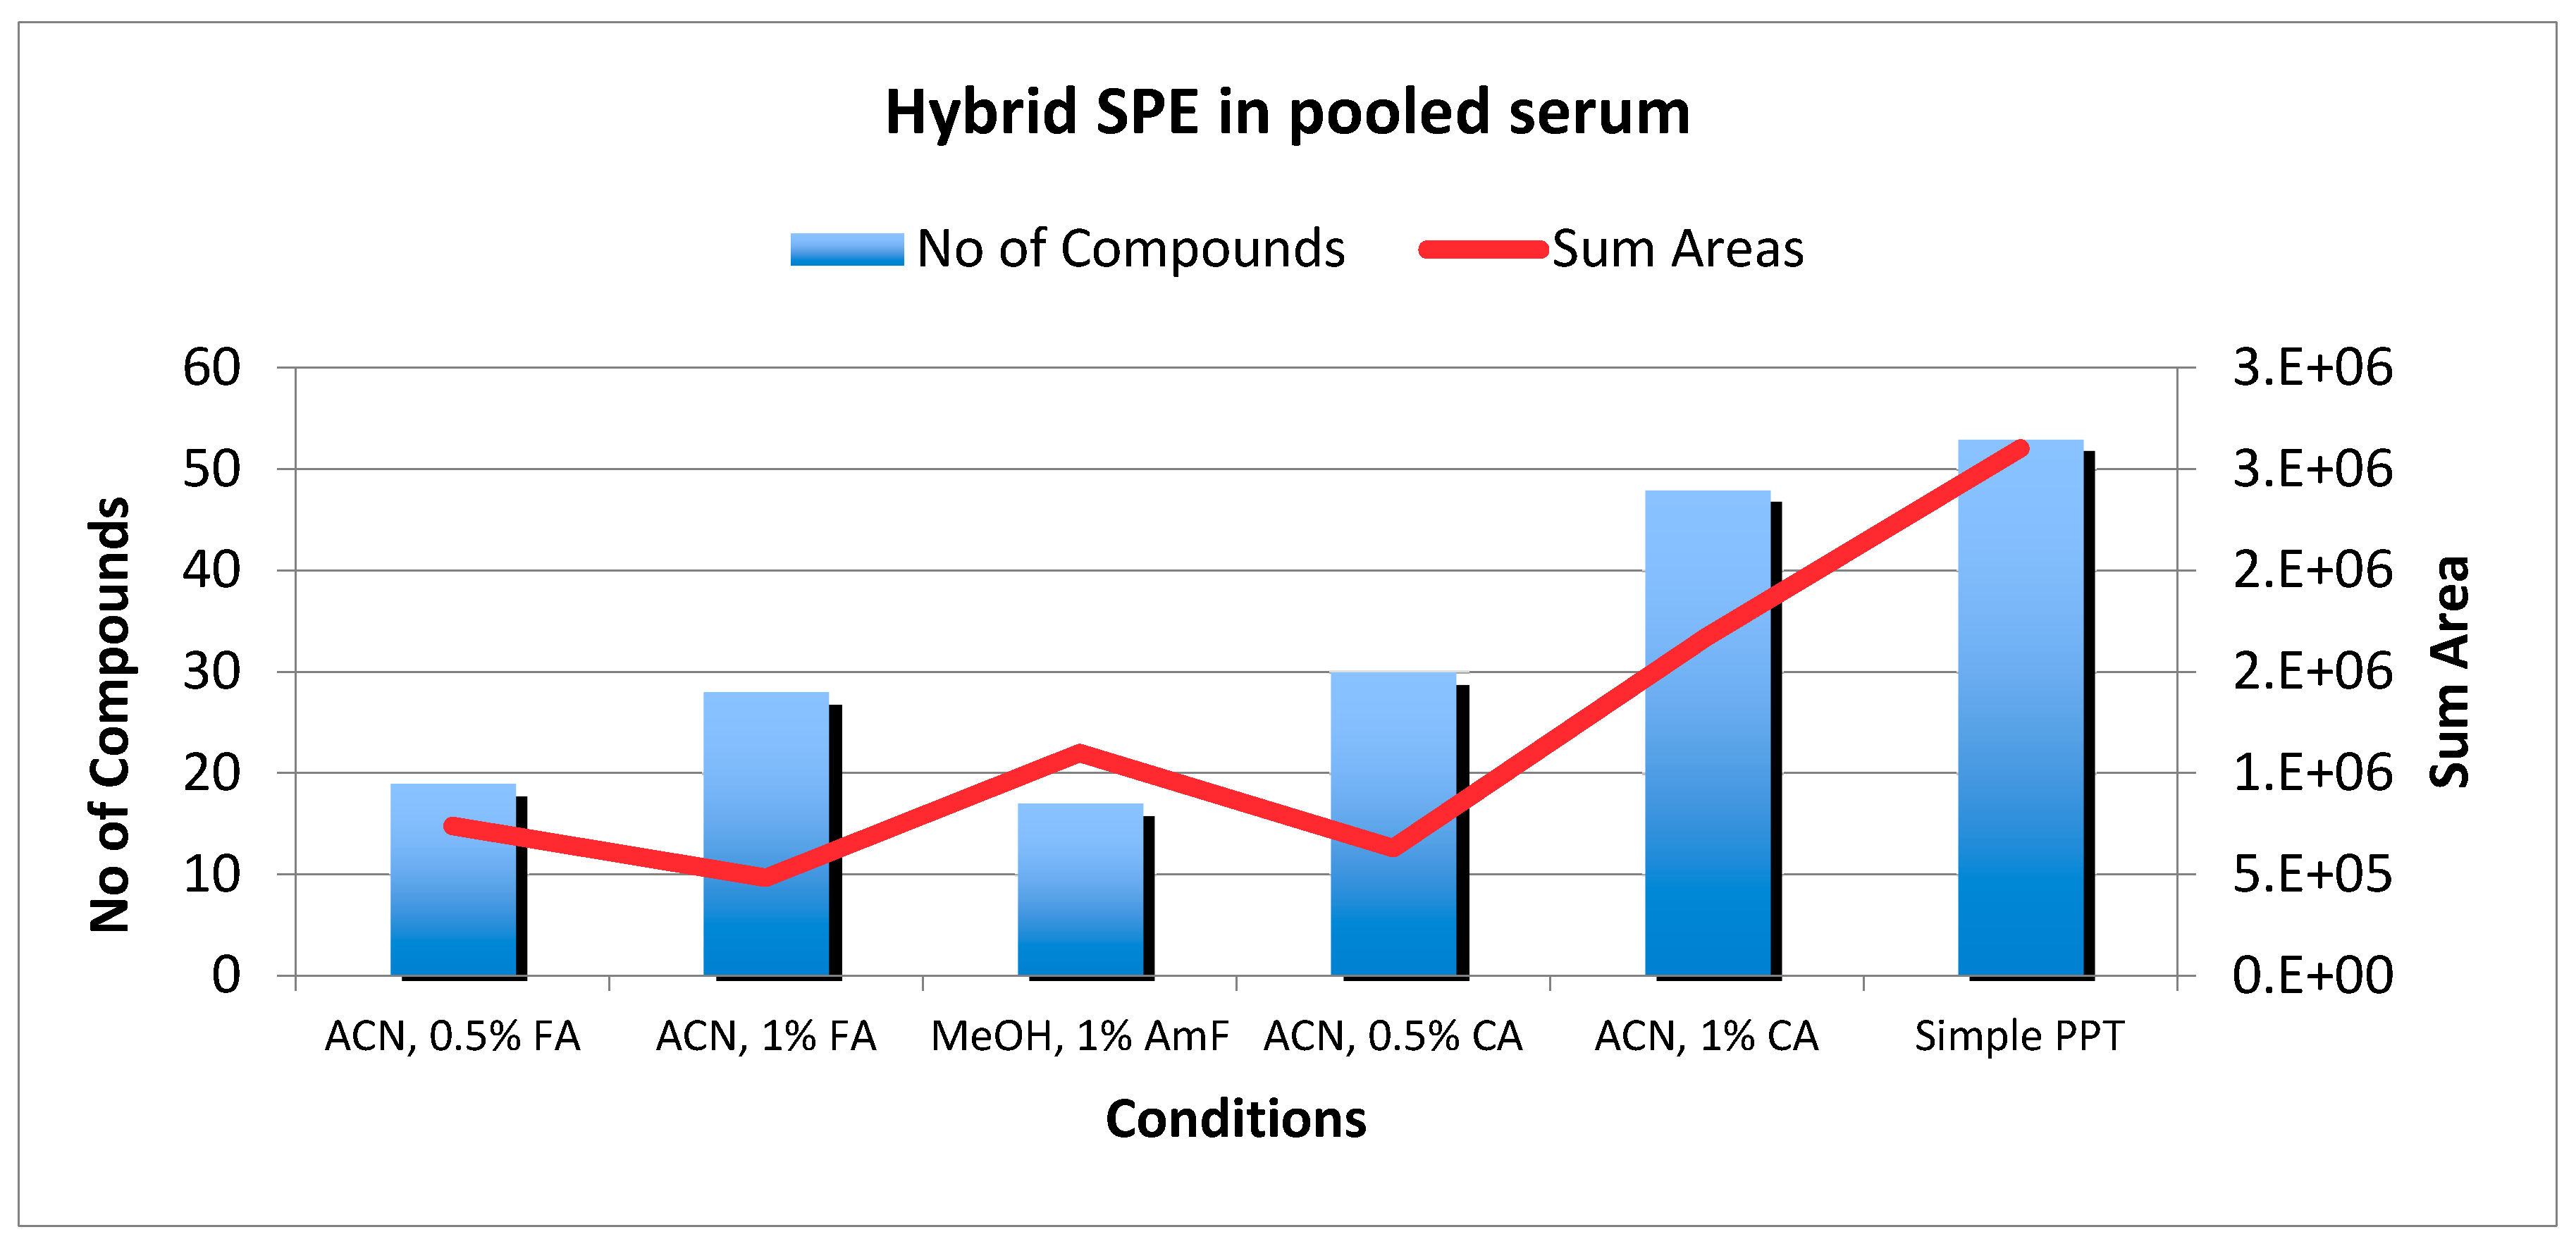
2.3. HybridSPE
3. Conclusions
4. Experimental
4.1. Reagents and Materials
4.2. Analytical System Parameters
4.3. Sample Preparation Methods
4.3.1. Dispersive SPE
4.3.2. LLE Delipidation
4.3.3. HybridSPE
Supplementary Materials
Author Contributions
Conflicts of Interest
References
- Gika, H.G.; Wilson, I.D.; Theodoridis, G.A. LC-MS-based holistic metabolic profiling. Problems, limitations, advantages, and future perspectives. J. Chromatogr. B Anal. Technol. Biomed. Life Sci. 2014, 966, 1–6. [Google Scholar] [CrossRef] [PubMed]
- Gika, H.G.; Theodoridis, G.A.; Plumb, R.S.; Wilson, I.D. Current practice of liquid chromatography—Mass spectrometry in metabolomics and metabonomics. Rev. Pap. Pharm. Biomed. Anal. 2014, 87, 12–25. [Google Scholar] [CrossRef] [PubMed]
- Griffiths, W.J.; Koal, T.; Wang, Y.; Kohl, M.; Enot, D.P.; Deigner, H.-P. Targeted metabolomics for biomarker discovery. Angew. Chem. Int. Ed Engl. 2010, 49, 5426–5445. [Google Scholar] [CrossRef] [PubMed]
- Michopoulos, F.; Whalley, N.; Theodoridis, G.; Wilson, I.D.; Dunkley, T.P.J.; Critchlow, S.E. Targeted profiling of polar intracellular metabolites using ion-pair-high performance liquid chromatography and-ultra high performance liquid chromatography coupled to tandem mass spectrometry: Applications to serum, urine and tissue extracts. J. Chromatogr. A 2014, 1349, 60–68. [Google Scholar] [CrossRef] [PubMed]
- Roberts, L.D.; Souza, A.L.; Gerszten, R.E.; Clish, C.B. Targeted Metabolomics. Curr. Protoc. Mol. Biol. 2012. [Google Scholar] [CrossRef]
- Gika, H.G.; Theodoridis, G.A.; Vrhovsek, U.; Mattivi, F. Quantitative profiling of polar primary metabolites using hydrophilic interaction ultrahigh performance liquid chromatography–tandem mass spectrometry. J. Chromatogr. A 2012, 1259, 121–127. [Google Scholar] [CrossRef] [PubMed]
- Psychogios, N.; Hau, D.D.; Peng, J.; Guo, A.C.; Mandal, R.; Bouatra, S.; Sinelnikov, I.; Krishnamurthy, R.; Eisner, R.; Gautam, B.; et al. The human serum metabolome. PLoS ONE 2011, 6, e16957. [Google Scholar] [CrossRef] [PubMed]
- Hyötyläinen, T. Critical evaluation of sample pretreatment techniques. Anal. Bioanal. Chem. 2009, 394, 743–758. [Google Scholar] [CrossRef] [PubMed]
- Ooga, T.; Sato, H.; Nagashima, A.; Sasaki, K.; Tomita, M.; Soga, T.; Ohashi, Y. Metabolomic anatomy of an animal model revealing homeostatic imbalances in dyslipidaemia. Mol. Biosyst. 2011, 7, 1217–1223. [Google Scholar] [CrossRef] [PubMed]
- Zelena, E.; Dunn, W.B.; Broadhurst, D.; Francis-McIntyre, S.; Carroll, K.M.; Begley, P.; O’Hagan, S.; Knowles, J.D.; Halsall, A.; Wilson, I.D.; et al. Development of a Robust and Repeatable UPLC–MS Method for the Long-Term Metabolomic Study of Human Serum. Anal. Chem. 2009, 81, 1357–1364. [Google Scholar] [CrossRef] [PubMed]
- Pereira, H.; Martin, J.-F.; Joly, C.; Sébédio, J.-L.; Pujos-Guillot, E. Development and validation of a UPLC/MS method for a nutritional metabolomic study of human plasma. Metabolomics 2010, 6, 207–218. [Google Scholar] [CrossRef]
- Lai, L.; Michopoulos, F.; Gika, H.; Theodoridis, G.; Wilkinson, R.W.; Odedra, R.; Wingate, J.; Bonner, R.; Tate, S.; et al. Methodological considerations in the development of HPLC-MS methods for the analysis of rodent plasma for metabonomic studies. Mol. Biosyst. 2009, 6, 108–120. [Google Scholar] [CrossRef] [PubMed]
- Michopoulos, F.; Lai, L.; Gika, H.; Theodoridis, G.; Wilson, I. UPLC-MS-based analysis of human plasma for metabonomics using solvent precipitation or solid phase extraction. J. Proteome Res. 2009, 8, 2114–2121. [Google Scholar] [CrossRef] [PubMed]
- Loftus, N.; Barnes, A.; Ashton, S.; Michopoulos, F.; Theodoridis, G.; Wilson, I.; Ji, C.; Kaplowitz, N. Metabonomic Investigation of Liver Profiles of Nonpolar Metabolites Obtained from Alcohol-Dosed Rats and Mice Using High Mass Accuracy MSN Analysis. J. Proteome Res. 2011, 10, 705–713. [Google Scholar] [CrossRef] [PubMed]
- Souverain, S.; Rudaz, S.; Veuthey, J.-L. Protein precipitation for the analysis of a drug cocktail in plasma by LC-ESI-MS. J. Pharm. Biomed. Anal. 2004, 35, 913–920. [Google Scholar] [CrossRef] [PubMed]
- Polson, C.; Sarkar, P.; Incledon, B.; Raguvaran, V.; Grant, R. Optimization of protein precipitation based upon effectiveness of protein removal and ionization effect in liquid chromatography-tandem mass spectrometry. J. Chromatogr. B Anal. Technol. Biomed. Life Sci. 2003, 785, 263–275. [Google Scholar] [CrossRef]
- Cajka, T.; Fiehn, O. Toward Merging Untargeted and Targeted Methods in Mass Spectrometry-Based Metabolomics and Lipidomics. Anal. Chem. 2016, 88, 524–545. [Google Scholar] [CrossRef] [PubMed]
- Ferreiro-Vera, C.; Priego-Capote, F.; de Castro, M.D.L. Comparison of sample preparation approaches for phospholipids profiling in human serum by liquid chromatography-tandem mass spectrometry. J. Chromatogr. A 2012, 1240, 21–28. [Google Scholar] [CrossRef] [PubMed]
- Carmical, J.; Brown, S. The impact of phospholipids and phospholipid removal on bioanalytical method performance. Biomed. Chromatogr. BMC 2016, 30, 710–720. [Google Scholar] [CrossRef] [PubMed]
- Tulipani, S.; Llorach, R.; Urpi-Sarda, M.; Andres-Lacueva, C. Comparative analysis of sample preparation methods to handle the complexity of the blood fluid metabolome: When less is more. Anal. Chem. 2013, 85, 341–348. [Google Scholar] [CrossRef] [PubMed]
- Chambers, E.; Wagrowski-Diehl, D.M.; Lu, Z.; Mazzeo, J.R. Systematic and comprehensive strategy for reducing matrix effects in LC/MS/MS analyses. J. Chromatogr. B 2007, 852, 22–34. [Google Scholar] [CrossRef] [PubMed]
- Van Eeckhaut, A.; Lanckmans, K.; Sarre, S.; Smolders, I.; Michotte, Y. Validation of bioanalytical LC-MS/MS assays: Evaluation of matrix effects. J. Chromatogr. B Anal. Technol. Biomed. Life Sci. 2009, 877, 2198–2207. [Google Scholar] [CrossRef] [PubMed]
- Jian, W.; Edom, R.W.; Xu, Y.; Weng, N. Recent advances in application of hydrophilic interaction chromatography for quantitative bioanalysis. J. Sep. Sci. 2010, 33, 681–697. [Google Scholar] [CrossRef] [PubMed]
- Michopoulos, F.; Gika, H.; Palachanis, D.; Theodoridis, G.; Wilson, I.D. Solid phase extraction methodology for UPLC-MS based metabolic profiling of urine samples. Electrophoresis 2015, 36, 2170–2178. [Google Scholar] [CrossRef] [PubMed]
- Vogeser, M.; Kirchhoff, F. Progress in automation of LC-MS in laboratory medicine. Clin. Biochem. 2011, 44, 4–13. [Google Scholar] [CrossRef] [PubMed]
- Havlíková, L.; Vlčková, H.; Solich, P.; Nováková, L. HILIC UHPLC-MS/MS for fast and sensitive bioanalysis: Accounting for matrix effects in method development. Bioanalysis 2013, 5, 2345–2357. [Google Scholar] [CrossRef] [PubMed]
- Calderón-Santiago, M.; Priego-Capote, F.; Galache-Osuna, J.G.; de Castro, M.D.L. Analysis of serum phospholipid profiles by liquid chromatography-tandem mass spectrometry in high resolution mode for evaluation of atherosclerotic patients. J. Chromatogr. A 2014, 1371, 154–162. [Google Scholar] [CrossRef] [PubMed]
- Neville, D.; Houghton, R.; Garrett, S. Efficacy of plasma phospholipid removal during sample preparation and subsequent retention under typical UHPLC conditions. Bioanalysis 2012, 4, 795–807. [Google Scholar] [CrossRef] [PubMed]
- Jemal, M.; Ouyang, Z.; Xia, Y.-Q. Systematic LC-MS/MS bioanalytical method development that incorporates plasma phospholipids risk avoidance, usage of incurred sample and well thought-out chromatography. Biomed. Chromatogr. BMC 2010, 24, 2–19. [Google Scholar] [CrossRef] [PubMed]
- Mess, J.-N.; Côté, C.; Bergeron, A.; Furtado, M.; Garofolo, F. Selection of HILIC columns to handle matrix effect due to phospholipids. Bioanalysis 2009, 1, 57–62. [Google Scholar] [CrossRef] [PubMed]
- Virgiliou, C.; Gika, H.G.; Witting, M.; Bletsou, A.A.; Athanasiadis, A.; Zafrakas, M.; Thomaidis, N.S.; Raikos, N.; Makrydimas, G.; Theodoridis, G.A. Amniotic Fluid and Maternal Serum Metabolic Signatures in the Second Trimester Associated with Preterm Delivery. J. Proteome Res. 2017, 16, 898–910. [Google Scholar] [CrossRef] [PubMed]
- Virgiliou, C.; Sampsonidis, I.; Gika, H.G.; Raikos, N.; Theodoridis, G.A. Development and validation of a HILIC-MS/MS multitargeted method for metabolomics applications. Electrophoresis 2015, 36, 2215–2225. [Google Scholar] [CrossRef] [PubMed]
- Virgiliou, C.; Valianou, L.; Witting, M.; Moritz, F.; Fotakis, C.; Zoumpoulakis, P.; Chatziioannou, A.C.; Lazaros, L.; Makrydimas, G.; Chatzimeletiou, K.; et al. Metabolic profile of human coelomic fluid. Bioanalysis 2016, 9, 37–51. [Google Scholar] [CrossRef] [PubMed]
- Matuszewski, B.K.; Constanzer, M.L.; Chavez-Eng, C.M. Strategies for the assessment of matrix effect in quantitative bioanalytical methods based on HPLC-MS/MS. Anal. Chem. 2003, 75, 3019–3030. [Google Scholar] [CrossRef] [PubMed]
- Ahmad, S.; Kalra, H.; Gupta, A.; Raut, B.; Hussain, A.; Rahman, M.A. HybridSPE: A novel technique to reduce phospholipid-based matrix effect in LC-ESI-MS Bioanalysis. J. Pharm. Bioallied Sci. 2012, 4, 267–275. [Google Scholar] [PubMed]


| Class | Metabolites | |
|---|---|---|
| Purine/Pyrimidine/Pyridoxine Derivatives | Hypoxanthine | Theobromine |
| Caffeine | Thymidine | |
| Cotinine | Uracil | |
| Inosine | Uridine | |
| Nicotinamide | Xanthine | |
| Pyridoxine | ||
| Acids | Benzoic acid | Hippuric acid |
| 2-Hydroxyisovaleric acid | Lactic acid | |
| 2-Hydroxyisobutyric acid | Pyroglutamic acid | |
| g-Aminobutyric acid | Pyruvic acid | |
| Polyamines | Putrescine | |
| Amino acids medium polarity | Alanine | Proline |
| Glycine | Tryptophan | |
| Leucine | Tyrosine | |
| Methionine | Valine | |
| Phenylalanine | Ιsoleucine | |
| Charged Amino acids /Amines | Acetylcarnitine | Lysine |
| Arginine | Thiamine | |
| Betaine | Trimethylamine-n-oxide | |
| Choline | ||
| Polar Chain, Ionisable Amino acids /Derivatives | Aspartic acid | Glutamic acid |
| Asparagine | Ornithine | |
| Creatine | Threonine | |
| Creatinine | Sarcosine | |
| Glutamine | Serine | |
| Hypotaurine | Taurine | |
| 3-Methylhistidine | ||
| Carbohydrates | Galactose | Lactose |
| Glucose | Ribose | |
| Analyte | Rt (min) | MF* | |
|---|---|---|---|
| Conventional PPT | HybridSPE | ||
| 2-Hydroxyisobutyric acid | 7.53 | 1.20 | 0.97 |
| 2-Hydroxyisovaleric acid | 5.4 | 1.00 | 1.02 |
| 3-methylhistidine | 19.32 | 1.13 | 1.22 |
| Acetylcarnitine | 14.22 | 0.96 | 0.92 |
| Alanine | 15.91 | 1.12 | 1.09 |
| Galactose | 12.08 | 0.83 | 0.86 |
| Arginine | 21.84 | 2.62 | 1.75 |
| Asparagine | 18.29 | 1.04 | 1.04 |
| Aspartic acid | 21.37 | 0.99 | 0.80 |
| Betaine | 12.11 | 0.73 | 0.79 |
| Caffeine | 0.87 | 0.77 | 0.80 |
| Choline | 6.72 | 0.95 | 0.91 |
| Cotinine | 1.10 | 0.96 | 0.87 |
| Creatine | 16.10 | 0.73 | 0.85 |
| Creatinine | 4.65 | 0.92 | 0.77 |
| g-aminobutyric acid | 16.69 | 1.01 | 0.88 |
| Glucose | 14.24 | 0.62 | 1.07 |
| Glutamic acid | 20.83 | 1.05 | 1.07 |
| Glutamine | 17.65 | 1.32 | 1.31 |
| Glycine | 16.86 | 1.36 | 1.29 |
| Hippuric acid | 9.2 | 1.10 | 1.14 |
| Hypoxanthine | 4.71 | 0.89 | 0.91 |
| Inosine | 8.97 | 1.24 | 1.07 |
| Ιsoleucine | 13.27 | 2.25 | 1.87 |
| Lactic acid | 11.12 | 0.48 | 0.68 |
| Leucine | 12.82 | 1.49 | 1.42 |
| Lysine | 22.3 | 1.47 | 1.27 |
| Methionine | 14.00 | 1.09 | 0.88 |
| Valine | 14.26 | 0.98 | 1.00 |
| Ornithine | 22.52 | 1.42 | 0.74 |
| Phenylalanine | 12.54 | 1.22 | 1.19 |
| Proline | 14.24 | 0.81 | 1.09 |
| Putrescine | 20.84 | 1.00 | 0.83 |
| Pyridoxine | 2.00 | 1.00 | 0.89 |
| Pyroglutamic acid | 14.78 | 1.07 | 1.02 |
| Pyruvic acid | 7.06 | 0.89 | 0.84 |
| Ribose | 4.25 | 0.87 | 0.93 |
| Sarcosine | 15.1 | 0.90 | 1.04 |
| Serine | 17.78 | 1.21 | 1.02 |
| Taurine | 14.24 | 1.04 | 0.86 |
| Theobromine | 1.15 | 0.93 | 0.44 |
| Thiamine | 11.57 | 1.12 | 1.06 |
| Threonine | 16.62 | 1.13 | 1.11 |
| Thymidine | 1.91 | 1.02 | 0.64 |
| Trimethylamine-n-oxide | 12.64 | 1.02 | 1.01 |
| Tryptophan | 12.66 | 1.18 | 1.10 |
| Tyrosine | 14.42 | 1.01 | 1.05 |
| Uracil | 1.82 | 1.13 | 0.83 |
| Uridine | 4.56 | 0.85 | 0.96 |
| Xanthine | 7.28 | 1.10 | 1.04 |
| Benzoic acid | 1.63 | 0.20 | 0.28 |
| Hypotaurine | 15.62 | 1.32 | 1.24 |
| Lactose | 18.31 | 1.01 | 1.16 |
| Nicotinamide | 1.16 | 1.10 | 0.86 |
© 2017 by the authors. Licensee MDPI, Basel, Switzerland. This article is an open access article distributed under the terms and conditions of the Creative Commons Attribution (CC BY) license (http://creativecommons.org/licenses/by/4.0/).
Share and Cite
Tsakelidou, E.; Virgiliou, C.; Valianou, L.; Gika, H.G.; Raikos, N.; Theodoridis, G. Sample Preparation Strategies for the Effective Quantitation of Hydrophilic Metabolites in Serum by Multi-Targeted HILIC-MS/MS. Metabolites 2017, 7, 13. https://doi.org/10.3390/metabo7020013
Tsakelidou E, Virgiliou C, Valianou L, Gika HG, Raikos N, Theodoridis G. Sample Preparation Strategies for the Effective Quantitation of Hydrophilic Metabolites in Serum by Multi-Targeted HILIC-MS/MS. Metabolites. 2017; 7(2):13. https://doi.org/10.3390/metabo7020013
Chicago/Turabian StyleTsakelidou, Elisavet, Christina Virgiliou, Lemonia Valianou, Helen G. Gika, Nikolaos Raikos, and Georgios Theodoridis. 2017. "Sample Preparation Strategies for the Effective Quantitation of Hydrophilic Metabolites in Serum by Multi-Targeted HILIC-MS/MS" Metabolites 7, no. 2: 13. https://doi.org/10.3390/metabo7020013