RaMP: A Comprehensive Relational Database of Metabolomics Pathways for Pathway Enrichment Analysis of Genes and Metabolites

 and
and
Abstract
:1. Introduction
2. Results
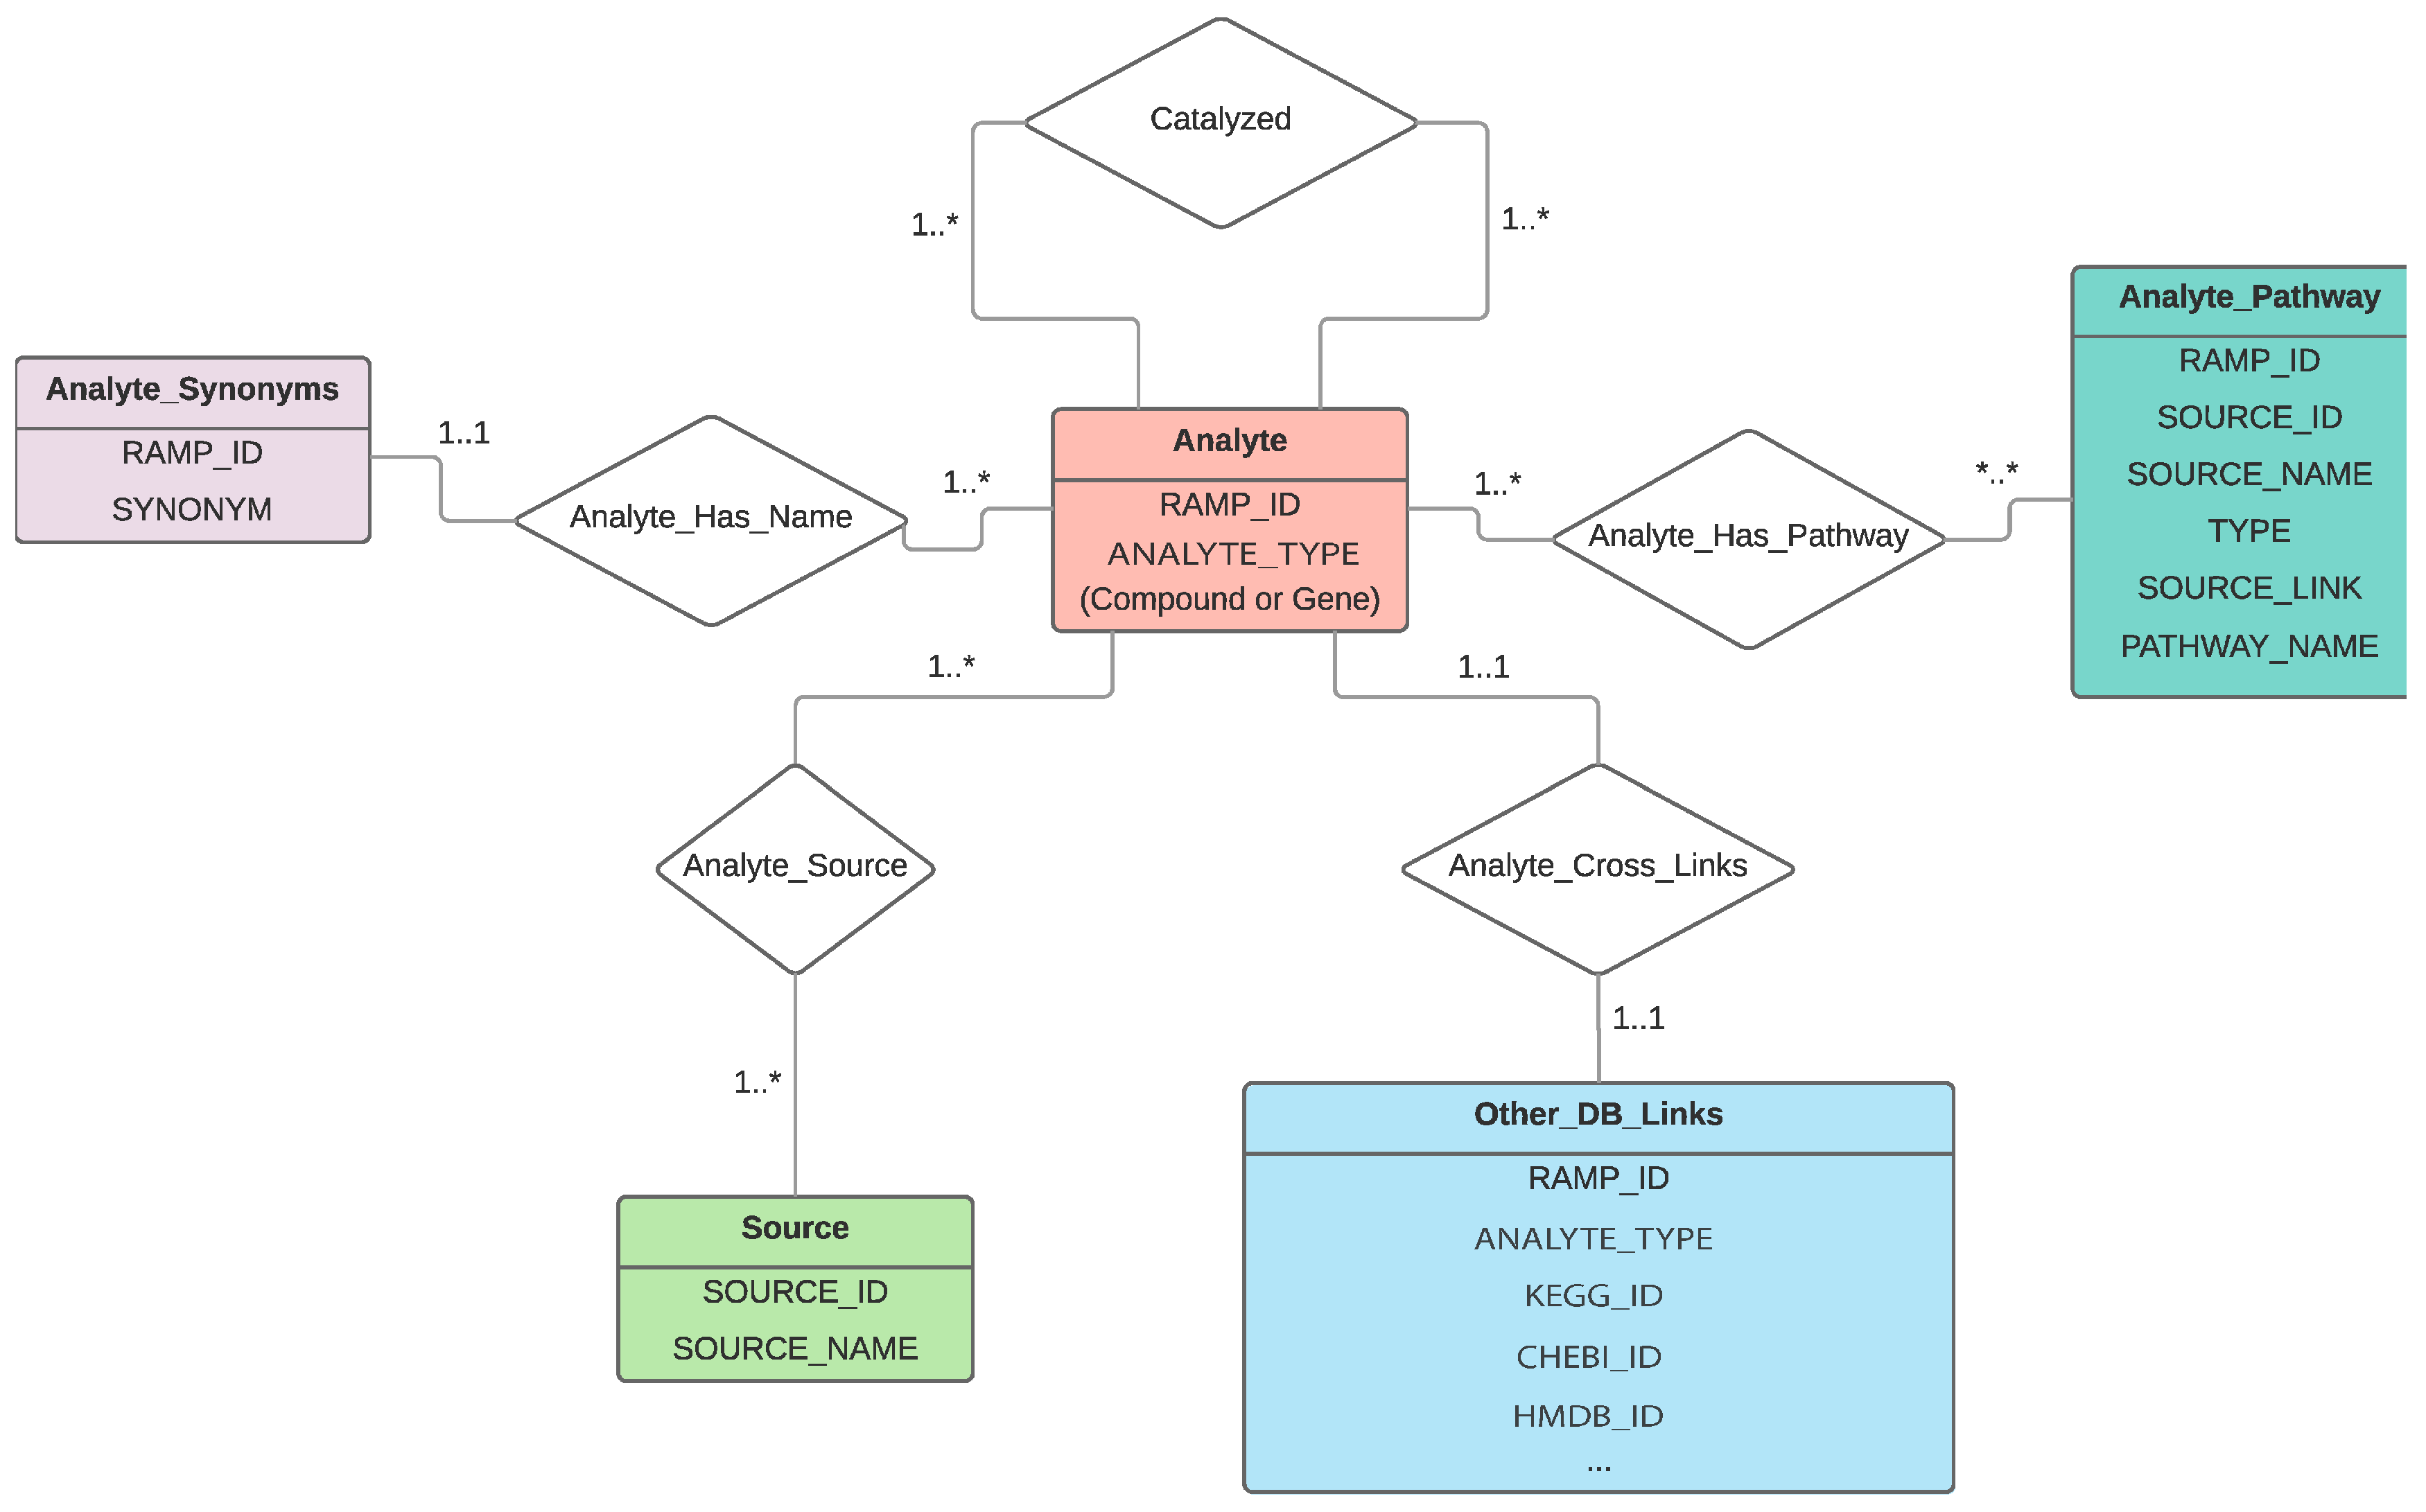
2.1. RaMP Design
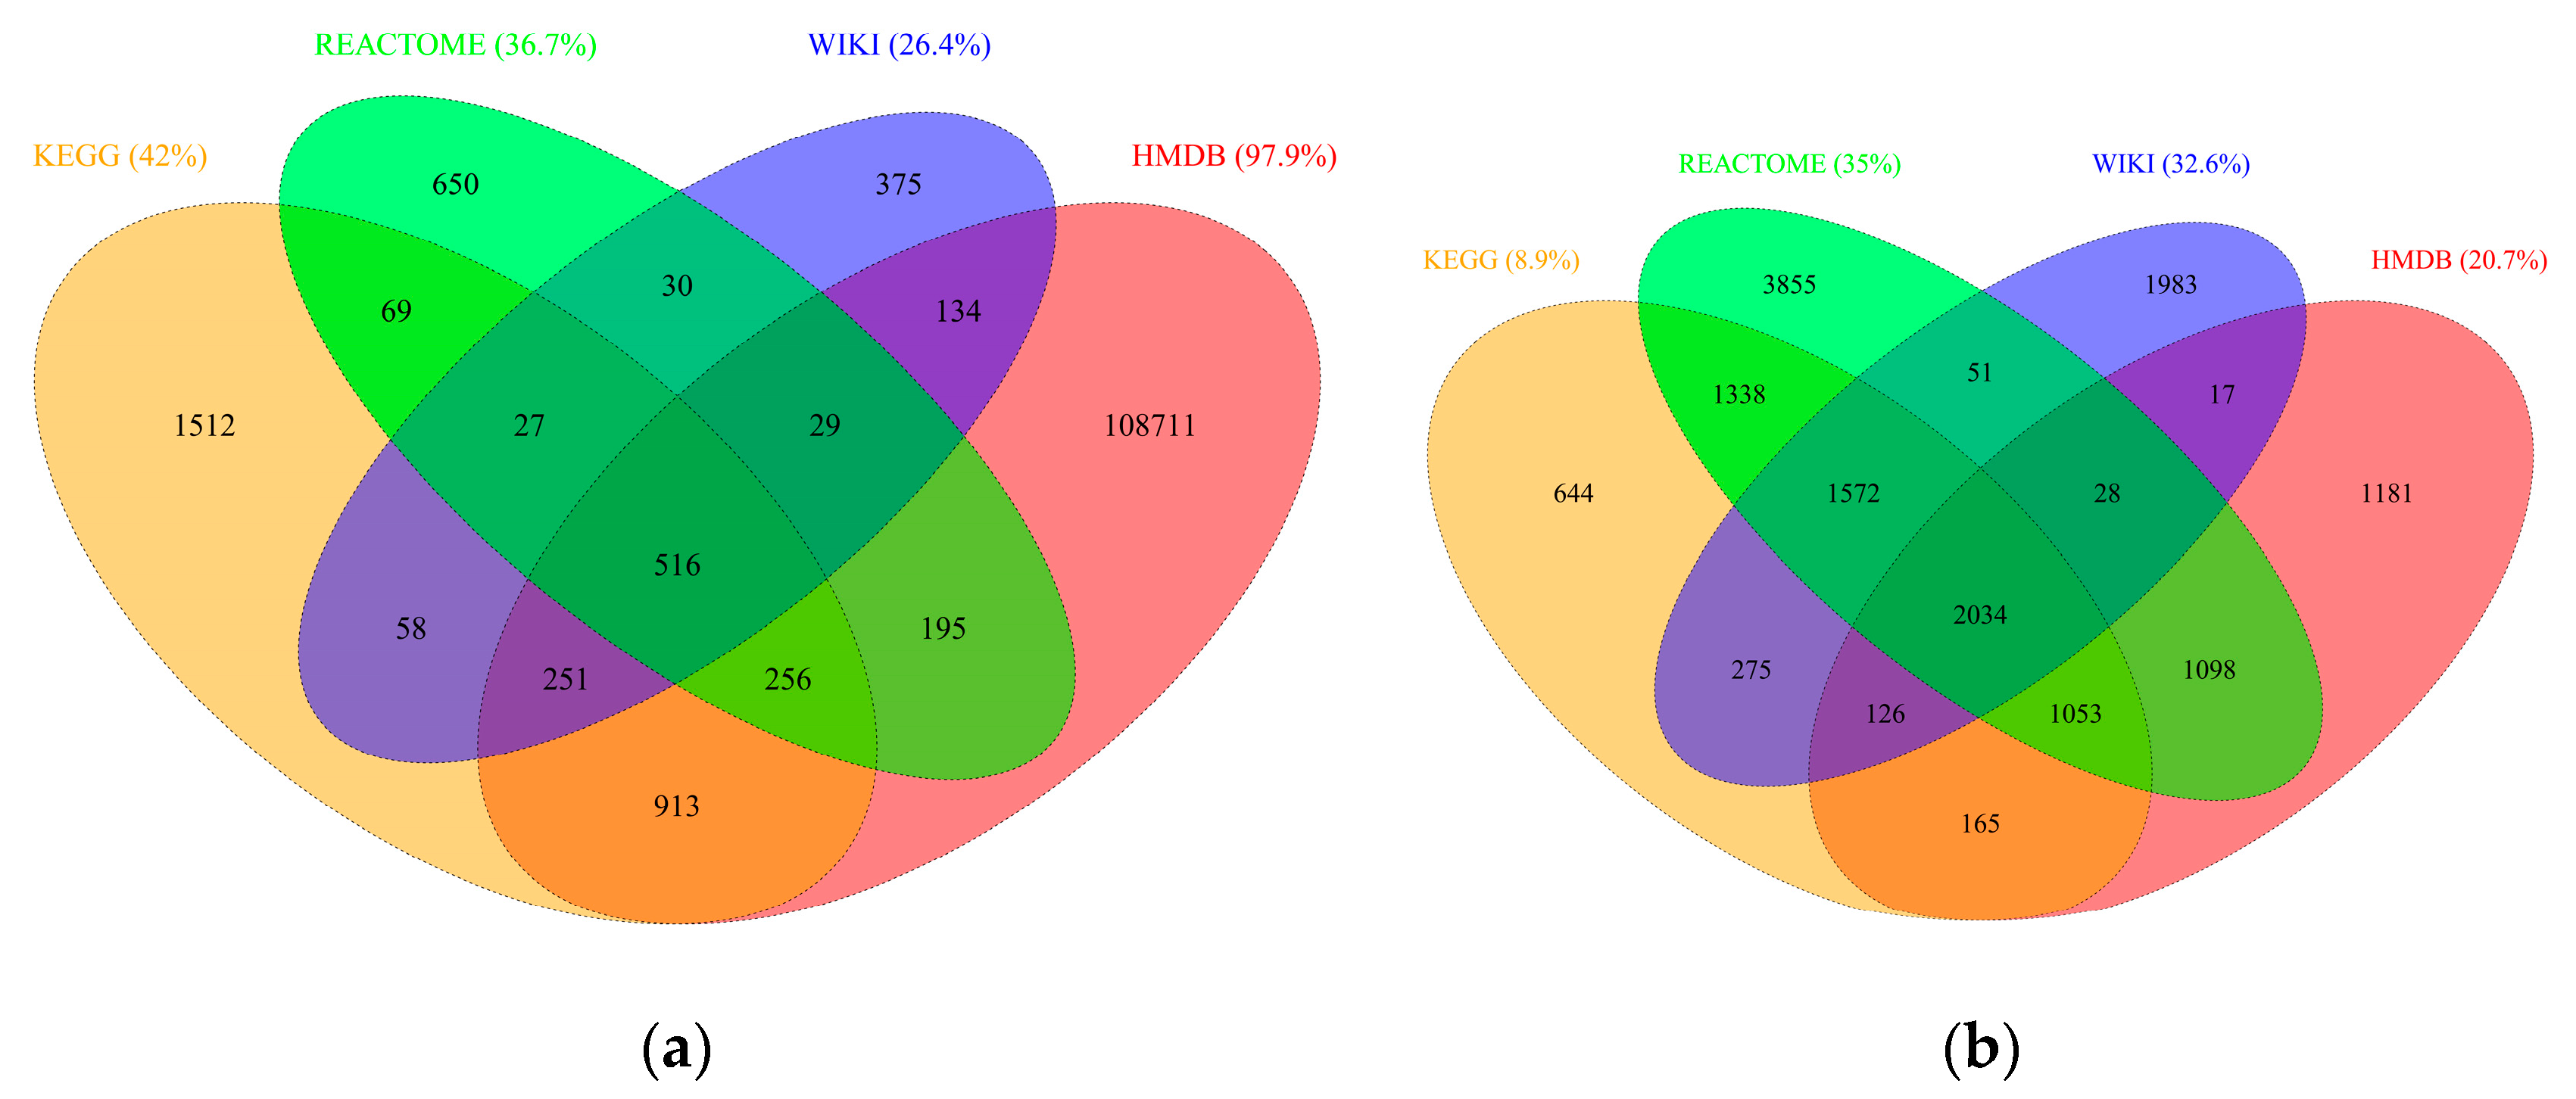
2.2. RaMP Content
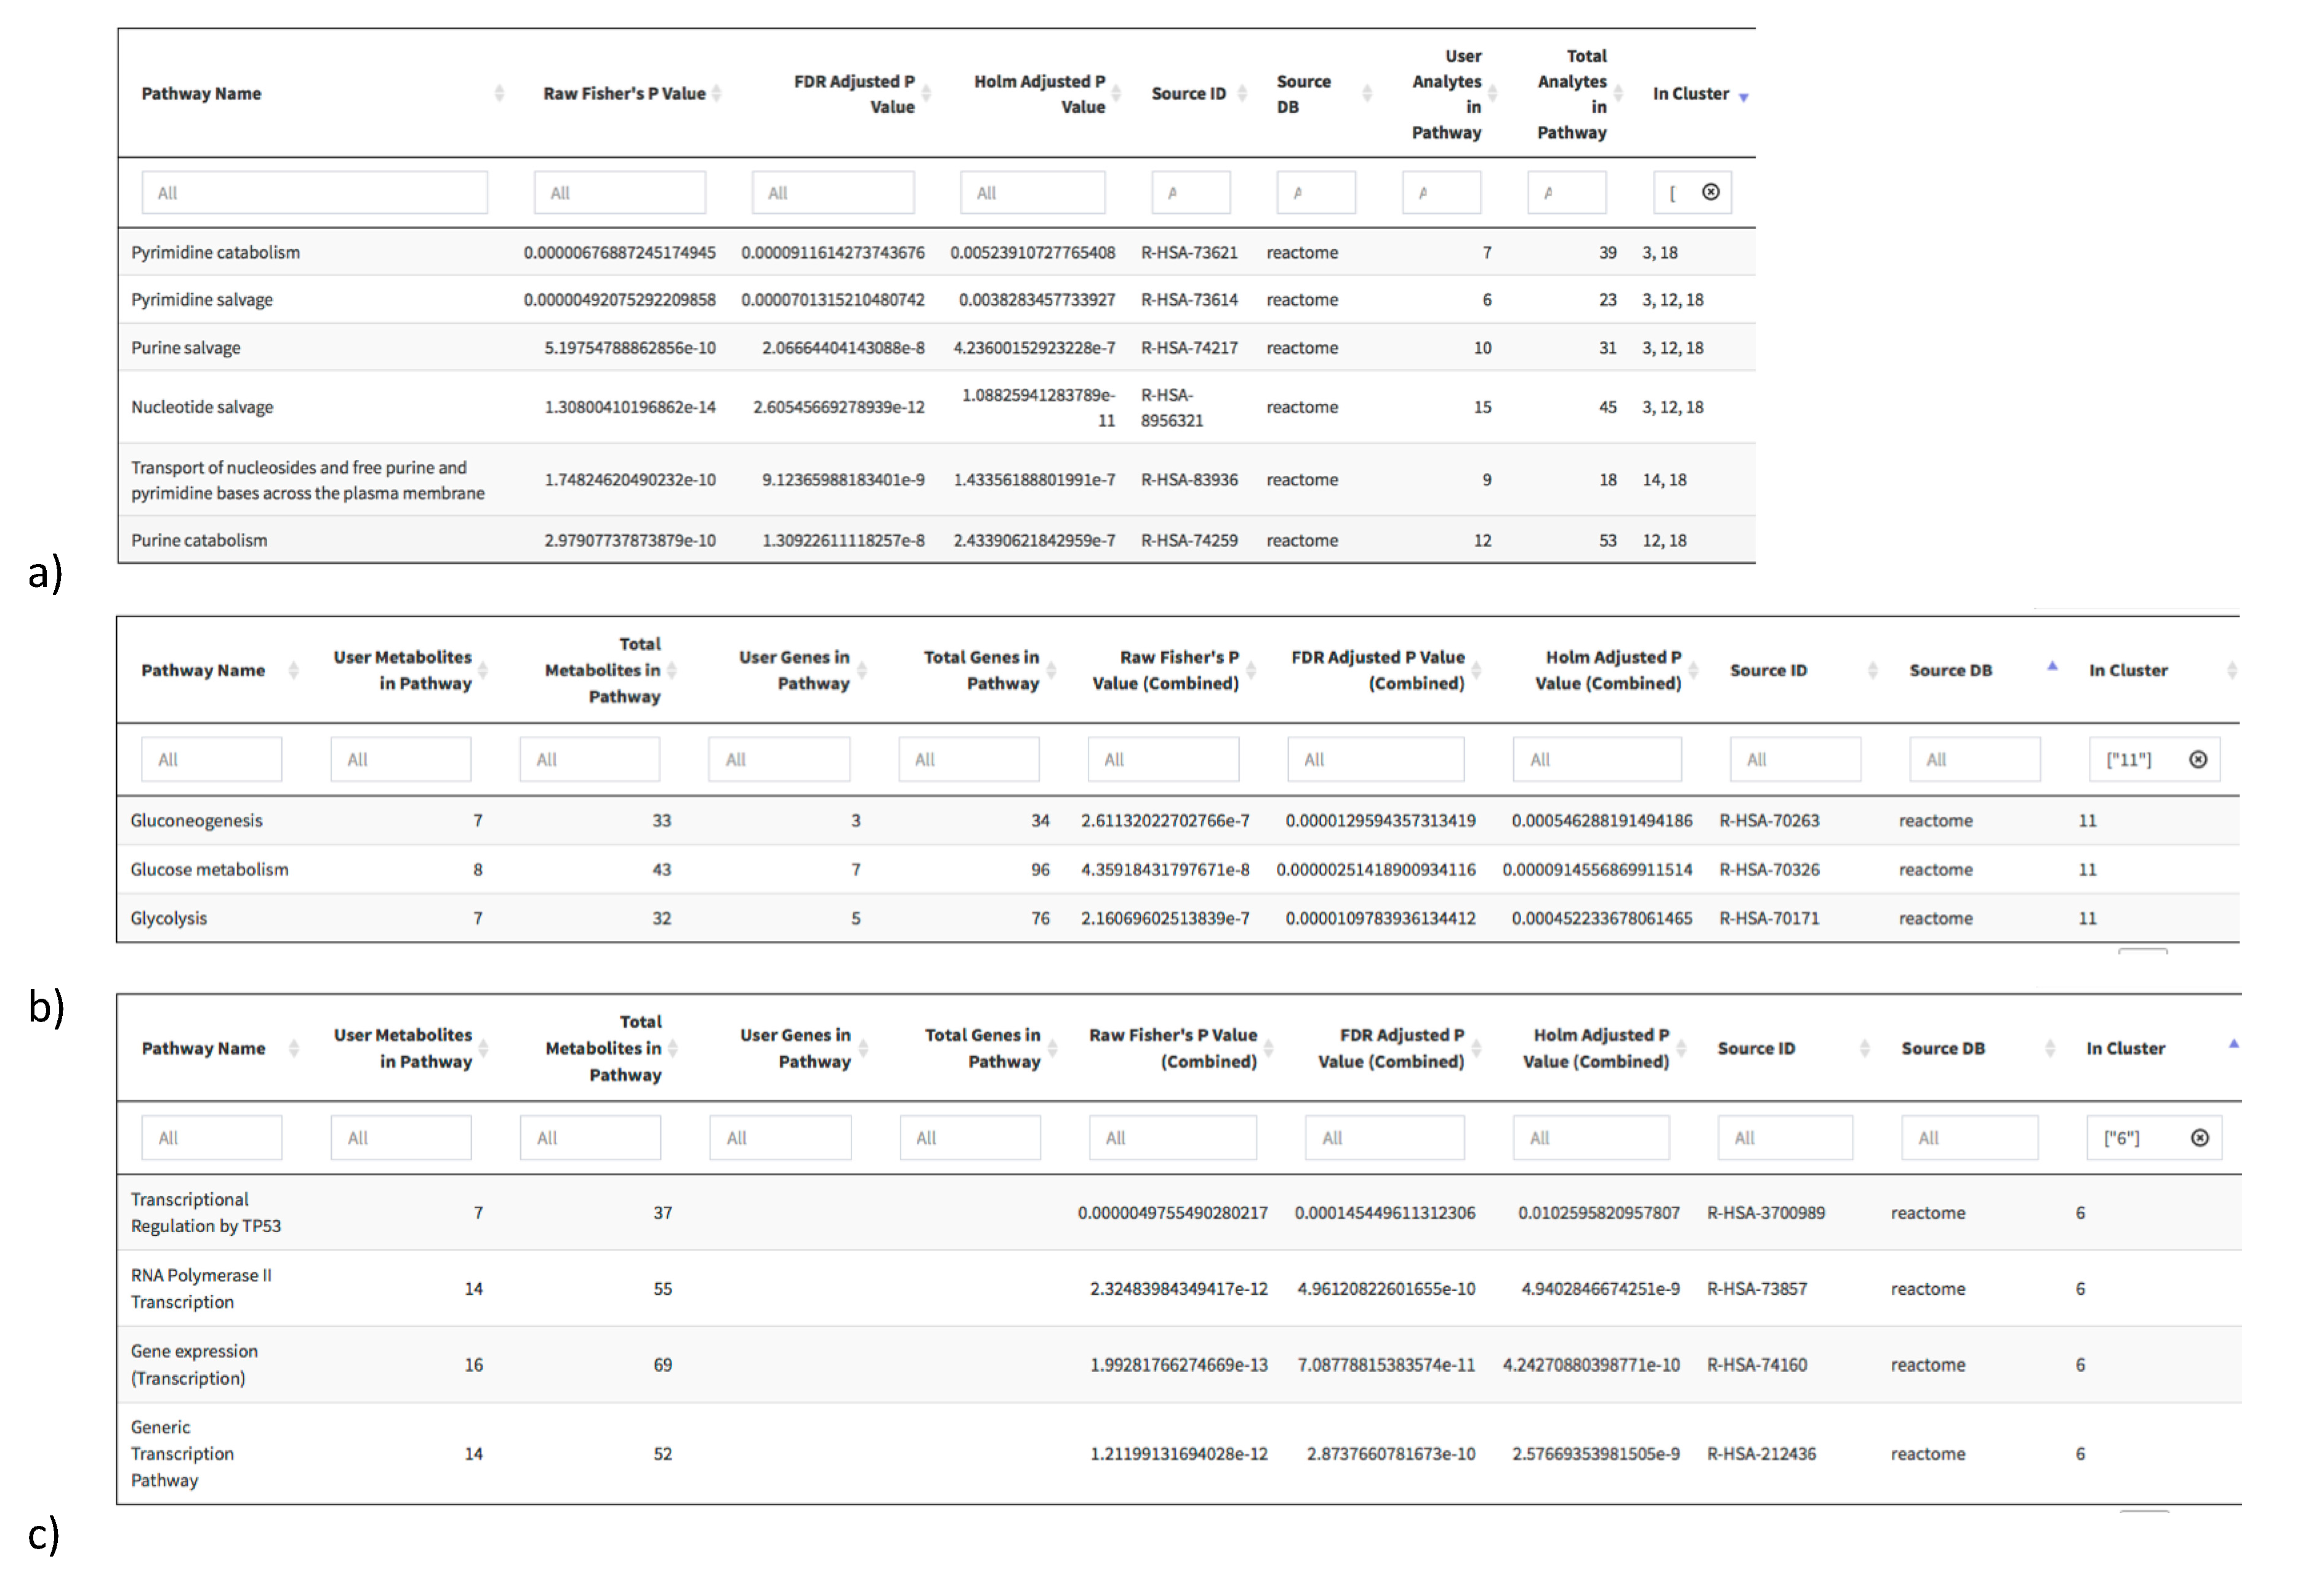
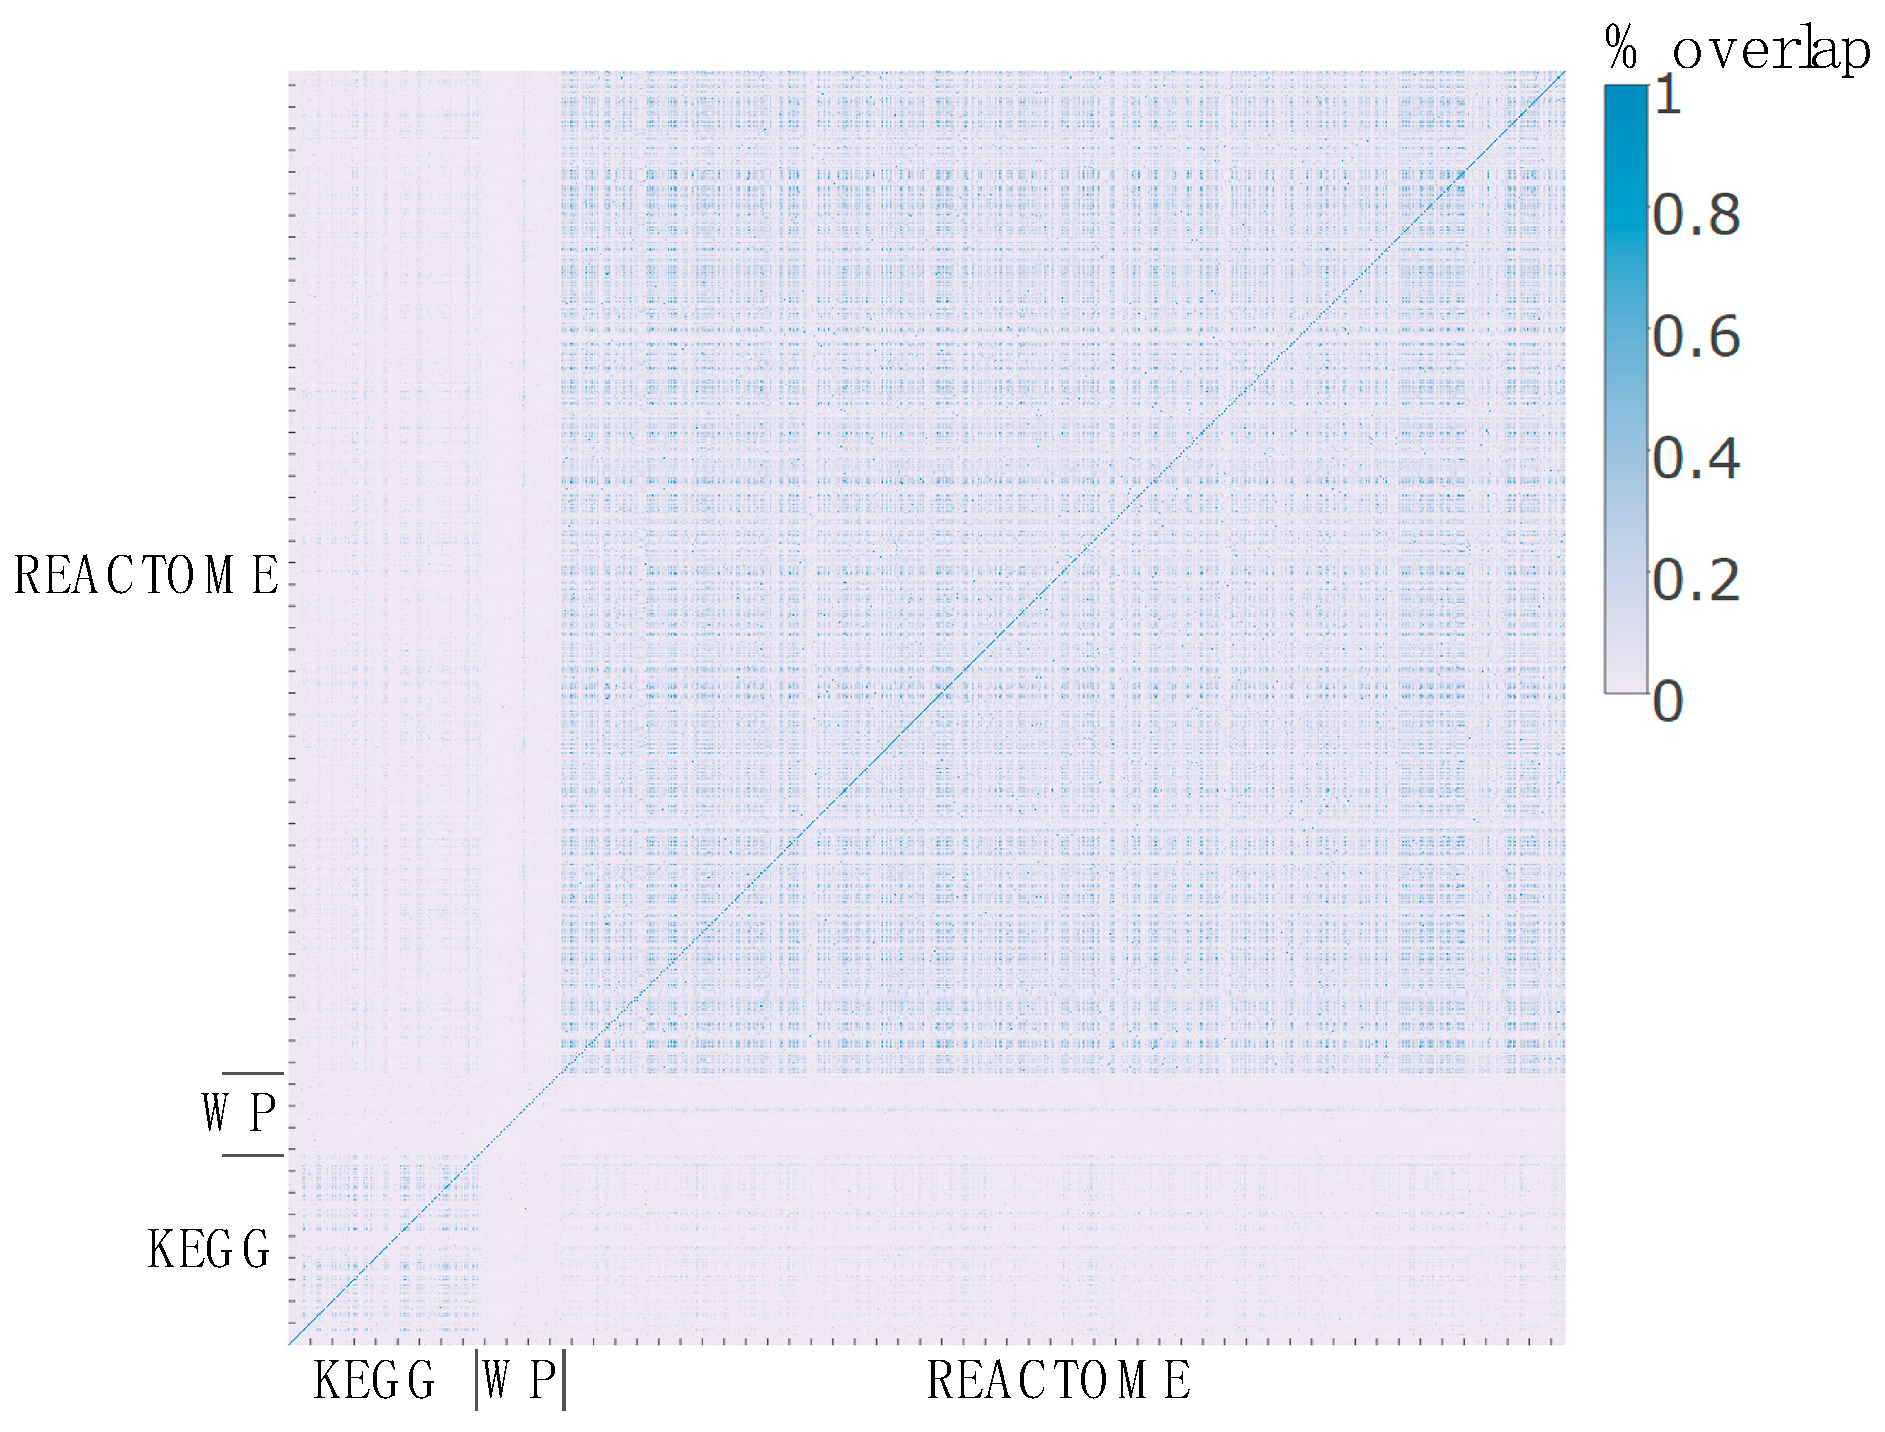
2.3. Pathway Redundancy and Clustering of Enriched Pathways
2.4. RaMP Access and User Interface
3. Discussion
4. Materials and Methods
4.1. Parsing Raw Database Files
4.2. Creating Unique RaMP IDs
4.3. R Package
4.4. Pathway Overrepresentation Analysis
4.5. Clustering of Pathway Enrichment Analysis Results
- Calculating analyte overlap: The degree of analyte overlap was calculated for all possible pairs of pathways. Gene overlap and metabolite overlaps were calculated separately. Given two pathways, m and n, the overlap score Omn represents the Jaccard index, which is calculated as:where Imn is the number of analytes (genes or metabolites) present in both pathways, and Lm and Ln are the number of total analytes in pathways m and n, respectively. When no analytes are in common between two pathways, Omn = 0. Conversely, Omn = 1 if all analytes overlap between two pathways.
- Identifying seeds: The overlap scores Omn are used to identify cluster seeds. Pathways with a high degree of overlap with multiple other pathways (e.g., ≥30% overlap with at least 2 other pathways) are considered “seeds”. Thresholds for percent overlap and number of pathways to overlap with can be defined by the user.
- Initial pathway clustering: Once seeds are identified, pathways are clustered to the seeds based on the overlap scores. Pathways that have overlap scores with seed pathways greater than or equal to a user-defined threshold (e.g., 30%) are clustered with the corresponding seed pathway. Of note, this approach allows for a single pathway to belong to multiple clusters, as long as it is sufficiently similar to the seed pathway of those clusters.
- Calculate cluster overlap: Overlap scores between clusters are calculated with the same formula as Equation (2), with the following definitions for I and L: Imn is now the number of pathways in common (based on their names) between clusters m and n, and Lm and Ln are now the number of pathways in clusters m and n, respectively. All pairwise cluster similarities (e.g., cluster overlap scores) are ranked, and the cluster pair with the highest overlap score is merged into a single cluster, provided that their overlap score is greater than a user-defined merge threshold (e.g., 30%).
- Repeat cluster overlaps: Step 4 is repeated until there are no cluster overlap scores above the merge threshold.
4.6. Pathway Analysis in Breast Cancer Dataset
Supplementary Materials
Acknowledgments
Author Contributions
Conflicts of Interest
References
- Zhang, A.; Sun, H.; Yan, G.; Wang, P.; Wang, X. Metabolomics for biomarker discovery: Moving to the clinic. Biomed Res. Int. 2015, 2015, 354671. [Google Scholar] [CrossRef] [PubMed]
- Mathé, E.A.; Patterson, A.D.; Haznadar, M.; Manna, S.K.; Krausz, K.W.; Bowman, E.D.; Shields, P.G.; Idle, J.R.; Smith, P.B.; Anami, K. Noninvasive urinary metabolomic profiling identifies diagnostic and prognostic markers in lung cancer. Cancer Res. 2014, 74, 3259–3270. [Google Scholar] [CrossRef] [PubMed]
- Beger, R.D.; Dunn, W.; Schmidt, M.A.; Gross, S.S.; Kirwan, J.A.; Cascante, M.; Brennan, L.; Wishart, D.S.; Oresic, M.; Hankemeier, T. Metabolomics enables precision medicine: “A white paper, community perspective”. Metabolomics 2016, 12, 149. [Google Scholar] [CrossRef] [PubMed]
- Johnson, C.H.; Ivanisevic, J.; Siuzdak, G. Metabolomics: Beyond biomarkers and towards mechanisms. Nat. Rev. Mol. Cell Biol. 2016, 17, 451–459. [Google Scholar] [CrossRef] [PubMed]
- Terunuma, A.; Putluri, N.; Mishra, P.; Mathé, E.A.; Dorsey, T.H.; Yi, M.; Wallace, T.A.; Issaq, H.J.; Zhou, M.; Killian, J.K. Myc-driven accumulation of 2-hydroxyglutarate is associated with breast cancer prognosis. J. Clin. Investig. 2014, 124, 398–412. [Google Scholar] [CrossRef] [PubMed]
- Stempler, S.; Yizhak, K.; Ruppin, E. Integrating transcriptomics with metabolic modeling predicts biomarkers and drug targets for Alzheimer’s disease. PLoS ONE 2014, 9, e105383. [Google Scholar] [CrossRef] [PubMed]
- Budhu, A.; Roessler, S.; Zhao, X.; Yu, Z.; Forgues, M.; Ji, J.; Karoly, E.; Qin, L.X.; Ye, Q.H.; Jia, H.L. Integrated metabolite and gene expression profiles identify lipid biomarkers associated with progression of hepatocellular carcinoma and patient outcomes. Gastroenterology 2013, 144, 1066–1075. [Google Scholar] [CrossRef] [PubMed]
- Zhang, G.; He, P.; Tan, H.; Budhu, A.; Gaedcke, J.; Ghadimi, B.M.; Ried, T.; Yfantis, H.G.; Lee, D.H.; Maitra, A. Integration of metabolomics and transcriptomics revealed a fatty acid network exerting growth inhibitory effects in human pancreatic cancer. Clin. Cancer Res. 2013, 19, 4983–4993. [Google Scholar] [CrossRef] [PubMed]
- Su, G.; Burant, C.F.; Beecher, C.W.; Athey, B.D.; Meng, F. Integrated metabolome and transcriptome analysis of the nci60 dataset. BMC Bioinforma. 2011, 12 (Suppl. 1), S36. [Google Scholar] [CrossRef] [PubMed]
- Ritchie, M.D.; Holzinger, E.R.; Li, R.; Pendergrass, S.A.; Kim, D. Methods of integrating data to uncover genotype-phenotype interactions. Nat. Rev. Genet. 2015, 16, 85–97. [Google Scholar] [CrossRef] [PubMed]
- Cavill, R.; Jennen, D.; Kleinjans, J.; Briede, J.J. Transcriptomic and metabolomic data integration. Brief Bioinform. 2015, 17, 891–901. [Google Scholar] [CrossRef] [PubMed]
- Wanichthanarak, K.; Fahrmann, J.F.; Grapov, D. Genomic, proteomic, and metabolomic data integration strategies. Biomark. Insights 2015, 10, 1–6. [Google Scholar] [CrossRef] [PubMed]
- Xia, J.; Sinelnikov, I.V.; Han, B.; Wishart, D.S. Metaboanalyst 3.0––Making metabolomics more meaningful. Nucleic Acids Res. 2015, 43, 251–257. [Google Scholar] [CrossRef] [PubMed]
- Kamburov, A.; Cavill, R.; Ebbels, T.M.; Herwig, R.; Keun, H.C. Integrated pathway-level analysis of transcriptomics and metabolomics data with impala. Bioinformatics 2011, 27, 2917–2918. [Google Scholar] [CrossRef] [PubMed]
- Gowda, H.; Ivanisevic, J.; Johnson, C.H.; Kurczy, M.E.; Benton, H.P.; Rinehart, D.; Nguyen, T.; Ray, J.; Kuehl, J.; Arevalo, B. Interactive xcms online: Simplifying advanced metabolomic data processing and subsequent statistical analyses. Anal. Chem. 2014, 86, 6931–6939. [Google Scholar] [CrossRef] [PubMed]
- Tautenhahn, R.; Patti, G.J.; Rinehart, D.; Siuzdak, G. Xcms online: A web-based platform to process untargeted metabolomic data. Anal. Chem. 2012, 84, 5035–5039. [Google Scholar] [CrossRef] [PubMed]
- Wanichthanarak, K.; Fan, S.; Grapov, D.; Barupal, D.K.; Fiehn, O. Metabox: A toolbox for metabolomic data analysis, interpretation and integrative exploration. PLoS ONE 2017, 12, e0171046. [Google Scholar] [CrossRef] [PubMed]
- Cerami, E.G.; Gross, B.E.; Demir, E.; Rodchenkov, I.; Babur, O.; Anwar, N.; Schultz, N.; Bader, G.D.; Sander, C. Pathway commons, a web resource for biological pathway data. Nucleic Acids Res. 2011, 39, 685–690. [Google Scholar] [CrossRef] [PubMed]
- Sud, M.; Fahy, E.; Cotter, D.; Azam, K.; Vadivelu, I.; Burant, C.; Edison, A.; Fiehn, O.; Higashi, R.; Nair, K.S. Metabolomics workbench: An international repository for metabolomics data and metadata, metabolite standards, protocols, tutorials and training, and analysis tools. Nucleic Acids Res. 2016, 44, 463–470. [Google Scholar] [CrossRef] [PubMed]
- Xia, J.; Fjell, C.D.; Mayer, M.L.; Pena, O.M.; Wishart, D.S.; Hancock, R.E. Inmex––A web-based tool for integrative meta-analysis of expression data. Nucleic Acids Res. 2013, 41, 63–70. [Google Scholar] [CrossRef] [PubMed]
- Kuo, T.C.; Tian, T.F.; Tseng, Y.J. 3omics: A web-based systems biology tool for analysis, integration and visualization of human transcriptomic, proteomic and metabolomic data. BMC Syst. Biol. 2013, 7, 64. [Google Scholar] [CrossRef] [PubMed]
- Kanehisa, M.; Furumichi, M.; Tanabe, M.; Sato, Y.; Morishima, K. Kegg: New perspectives on genomes, pathways, diseases and drugs. Nucleic Acids Res. 2017, 45, 353–361. [Google Scholar] [CrossRef] [PubMed]
- Kanehisa, M.; Goto, S. Kegg: Kyoto encyclopedia of genes and genomes. Nucleic Acids Res. 2000, 28, 27–30. [Google Scholar] [CrossRef] [PubMed]
- Kanehisa, M.; Sato, Y.; Kawashima, M.; Furumichi, M.; Tanabe, M. Kegg as a reference resource for gene and protein annotation. Nucleic Acids Res. 2016, 44, 457–462. [Google Scholar] [CrossRef] [PubMed]
- Croft, D.; Mundo, A.F.; Haw, R.; Milacic, M.; Weiser, J.; Wu, G.; Caudy, M.; Garapati, P.; Gillespie, M.; Kamdar, M.R. The reactome pathway knowledgebase. Nucleic Acids Res. 2014, 42, 472–477. [Google Scholar] [CrossRef] [PubMed]
- Milacic, M.; Haw, R.; Rothfels, K.; Wu, G.; Croft, D.; Hermjakob, H.; D‘Eustachio, P.; Stein, L. Annotating cancer variants and anti-cancer therapeutics in reactome. Cancers 2012, 4, 1180–1211. [Google Scholar] [CrossRef] [PubMed]
- Wishart, D.S.; Jewison, T.; Guo, A.C.; Wilson, M.; Knox, C.; Liu, Y.; Djoumbou, Y.; Mandal, R.; Aziat, F.; Dong, E. HMDB 3.0––The human metabolome database in 2013. Nucleic Acids Res. 2013, 41, 801–807. [Google Scholar] [CrossRef] [PubMed]
- Wishart, D.S.; Knox, C.; Guo, A.C.; Eisner, R.; Young, N.; Gautam, B.; Hau, D.D.; Psychogios, N.; Dong, E.; Bouatra, S. HMDB: A knowledgebase for the human metabolome. Nucleic Acids Res. 2009, 37, 603–610. [Google Scholar] [CrossRef] [PubMed]
- Wishart, D.S.; Tzur, D.; Knox, C.; Eisner, R.; Guo, A.C.; Young, N.; Cheng, D.; Jewell, K.; Arndt, D.; Sawhney, S. HMDB: The human metabolome database. Nucleic Acids Res. 2007, 35, 521–526. [Google Scholar] [CrossRef] [PubMed]
- Kelder, T.; van Iersel, M.P.; Hanspers, K.; Kutmon, M.; Conklin, B.R.; Evelo, C.T.; Pico, A.R. Wikipathways: Building research communities on biological pathways. Nucleic Acids Res. 2012, 40, 1301–1307. [Google Scholar] [CrossRef] [PubMed]
- Kutmon, M.; Riutta, A.; Nunes, N.; Hanspers, K.; Willighagen, E.L.; Bohler, A.; Mélius, J.; Waagmeester, A.; Sinha, S.R.; Miller, R. Wikipathways: Capturing the full diversity of pathway knowledge. Nucleic Acids Res. 2016, 44, 488–494. [Google Scholar] [CrossRef] [PubMed]
- Slenter, D.N.; Kutmon, M.; Hanspers, K.; Riutta, A.; Windsor, J.; Nunes, N.; Mélius, J.; Cirillo, E.; Coort, S.L.; Digles, D.; et al. Wikipathways: A multifaceted pathway database bridging metabolomics to other omics research. Nucleic Acids Res. 2018, 46, 661–667. [Google Scholar] [CrossRef] [PubMed]
- Frolkis, A.; Knox, C.; Lim, E.; Jewison, T.; Law, V.; Hau, D.D.; Liu, P.; Gautam, B.; Ly, S.; Guo, A.C. Smpdb: The small molecule pathway database. Nucleic Acids Res. 2010, 38, 480–487. [Google Scholar] [CrossRef] [PubMed]
- Jewison, T.; Su, Y.; Disfany, F.M.; Liang, Y.; Knox, C.; Maciejewski, A.; Poelzer, J.; Huynh, J.; Zhou, Y.; Arndt, D. Smpdb 2.0: Big improvements to the small molecule pathway database. Nucleic Acids Res. 2014, 42, 478–484. [Google Scholar] [CrossRef] [PubMed]
- Huang, D.W.; Sherman, B.T.; Tan, Q.; Collins, J.R.; Alvord, W.G.; Roayaei, J.; Stephens, R.; Baseler, M.W.; Lane, H.C.; Lempicki, R.A. The david gene functional classification tool: A novel biological module-centric algorithm to functionally analyze large gene lists. Genome Biol. 2007, 8, 183. [Google Scholar] [CrossRef] [PubMed]
- Aird, K.M.; Zhang, R. Nucleotide metabolism, oncogene-induced senescence and cancer. Cancer Lett. 2015, 356, 204–210. [Google Scholar] [CrossRef] [PubMed]
- Hay, N. Reprogramming glucose metabolism in cancer: Can it be exploited for cancer therapy? Nat. Rev. Cancer 2016, 16, 635–649. [Google Scholar] [CrossRef] [PubMed]
- Bradner, J.E.; Hnisz, D.; Young, R.A. Transcriptional addiction in cancer. Cell 2017, 168, 629–643. [Google Scholar] [CrossRef] [PubMed]
- Alaimo, S.; Giugno, R.; Acunzo, M.; Veneziano, D.; Ferro, A.; Pulvirenti, A. Post-transcriptional knowledge in pathway analysis increases the accuracy of phenotypes classification. Oncotarget 2016, 7, 54572–54582. [Google Scholar] [CrossRef] [PubMed]
- Draghici, S.; Khatri, P.; Tarca, A.L.; Amin, K.; Done, A.; Voichita, C.; Georgescu, C.; Romero, R. A systems biology approach for pathway level analysis. Genome Res. 2007, 17, 1537–1545. [Google Scholar] [CrossRef] [PubMed]
- Tarca, A.L.; Draghici, S.; Khatri, P.; Hassan, S.S.; Mittal, P.; Kim, J.S.; Kim, C.J.; Kusanovic, J.P.; Romero, R. A novel signaling pathway impact analysis. Bioinformatics 2009, 25, 75–82. [Google Scholar] [CrossRef] [PubMed]
- Alaimo, S.; Marceca, G.P.; Ferro, A.; Pulvirenti, A. Detecting disease specific pathway substructures through an integrated systems biology approach. Non-Coding RNA 2017, 3, 20. [Google Scholar] [CrossRef]
- Fisher, R. Statistical Methods for Research Workers, 11th ed.; Oliver & Boyd: London, UK, 1950. [Google Scholar]


| Tools | Databases Included | Access and Availability | Batch Queries | Pathway Analysis | Network Visualization/Analysis | Pathway Clustering | Output |
|---|---|---|---|---|---|---|---|
| RaMP
https://github.com/Mathelab/RaMP-DB/ | KEGG, Reactome, WikiPathways, HMDB/SMPDB | - R package
- MySQL Dump - Python code to build MySQL Dump | Yes | ORA | Yes | Yes | - Interactive tables of query results - Interactive tables of pathway analysis results - Clustering of enriched pathways by pathway similarity |
| IMPaLA https://impala.molgen.mpg.de | KEGG, Reactome, BioCyC, PID, BioCarta, NetPath, INOH, EHMN, PharmGKB, WikiPathways, SMPDB | Web services programming interface | No | - ORA - Wilcoxon enrichment analysis | Yes | No | - Interactive tables of pathway analysis results with clickable links |
| MetaboAnalyst https://www.metaboanalyst.ca | KEGG, HMDB, SMPDB | R package | No | - ORA - Metabolite set enrichment analysis - Integrated topology and enrichment analysis (metabolites only) - Integrated gene and metabolite pathway analysis | Yes | No | - Interactive tables and plots of pathway analysis results with clickable links - Interactive pathway viewer |
| Metabox https://kwanjeeraw.github.io/metabox | KEGG, PubChem, UniProt, ENSEMBL, miRTarBase, BioGRID, Pathway Commons | R package | No | - ORA - Set enrichment analysis | Yes | No | - Interactive tables of pathway analysis results - Interactive visualization of networks (with table of nodes/edges) with clickable links |
| XCMS https://xcmsonline.scripps.edu/ | METLIN, KEGG, HMDB, Lipid Maps, NIST, MassBank | - R package - Web interface | No | Predictive Pathway Analysis | No | No | - Interactive tables of pathway results with clickable links - Interactive pathway cloud plot for visualization |
| Pathway Commons http://www.pathwaycommons.org | Reactome, NCI PID, PhosphoSitePlus, HumanCyc, HPRD, PANTHER, DIP, BioGRID, intAct, BIND, CORUM, MSigDB, miRTarBase, DrugBank, Recon X, CTG, KEGG, SMPD, INOH, NetPath, WikiPathways, ChEBI, SwissProt, UniChem | - R package - Web services programming interface | No | Gene set enrichment analysis | Yes | No | - Interactive pathway visualization |
| Database | # Metabolites | # Genes | # Pathways | Access |
|---|---|---|---|---|
| Human Metabolome Database | 111,005 | 5,645 | 48,623 * | http://www.hmdb.ca/ |
| KEGG | 3653 | 7298 | 323 | http://www.genome.jp/kegg/pathway.html |
| Reactome | 1771 | 11,035 | 2169 | https://reactome.org/ |
| WikiPathways | 1421 | 7727 | 411 | https://www.wikipathways.org/ |
| Query | Input | Tabular Output | Analysis/Visualization |
|---|---|---|---|
| Retrieve analytes for a given pathway | Pathway name(s) or pathway id(s) | Analytes that are within input pathway | |
| Retrieve pathway(s) for one or more analytes | Analyte name(s) or id(s) | Pathways that contain input analytes | Pathway enrichment analysis and clustering of enriched pathways |
| Retrieve analytes that are in the same reaction | Analyte name(s) | Analytes catalyzing or catalyzed by input analytes | Network visualization of gene-metabolite relationships |
| Retrieve ontologies from given metabolites | Metabolite name(s) or id(s), or ontology name | List of ontologies or metabolites that pertain to input |
© 2018 by the authors. Licensee MDPI, Basel, Switzerland. This article is an open access article distributed under the terms and conditions of the Creative Commons Attribution (CC BY) license (http://creativecommons.org/licenses/by/4.0/).
Share and Cite
Zhang, B.; Hu, S.; Baskin, E.; Patt, A.; Siddiqui, J.K.; Mathé, E.A. RaMP: A Comprehensive Relational Database of Metabolomics Pathways for Pathway Enrichment Analysis of Genes and Metabolites. Metabolites 2018, 8, 16. https://doi.org/10.3390/metabo8010016
Zhang B, Hu S, Baskin E, Patt A, Siddiqui JK, Mathé EA. RaMP: A Comprehensive Relational Database of Metabolomics Pathways for Pathway Enrichment Analysis of Genes and Metabolites. Metabolites. 2018; 8(1):16. https://doi.org/10.3390/metabo8010016
Chicago/Turabian StyleZhang, Bofei, Senyang Hu, Elizabeth Baskin, Andrew Patt, Jalal K. Siddiqui, and Ewy A. Mathé. 2018. "RaMP: A Comprehensive Relational Database of Metabolomics Pathways for Pathway Enrichment Analysis of Genes and Metabolites" Metabolites 8, no. 1: 16. https://doi.org/10.3390/metabo8010016