GC-MS-Based Endometabolome Analysis Differentiates Prostate Cancer from Normal Prostate Cells

 ,
, 
 ,
,  ,
, 

Abstract
: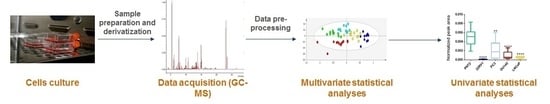
1. Introduction
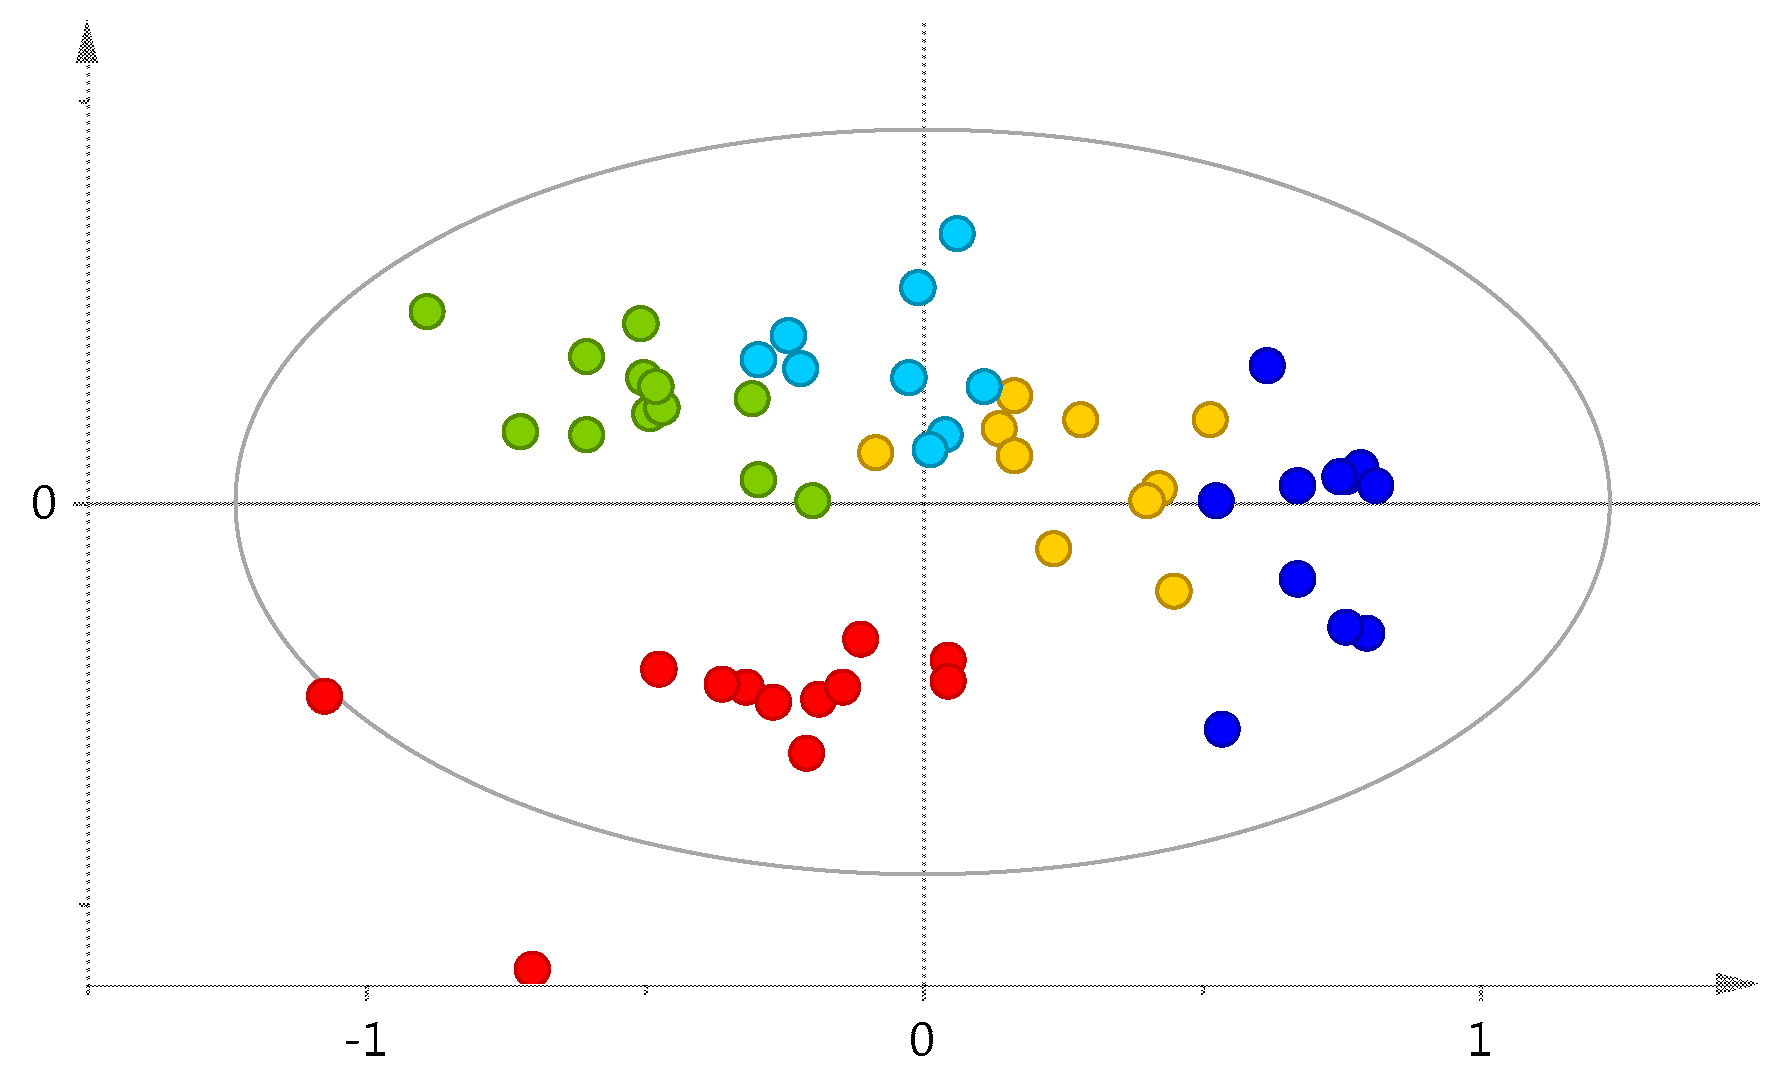
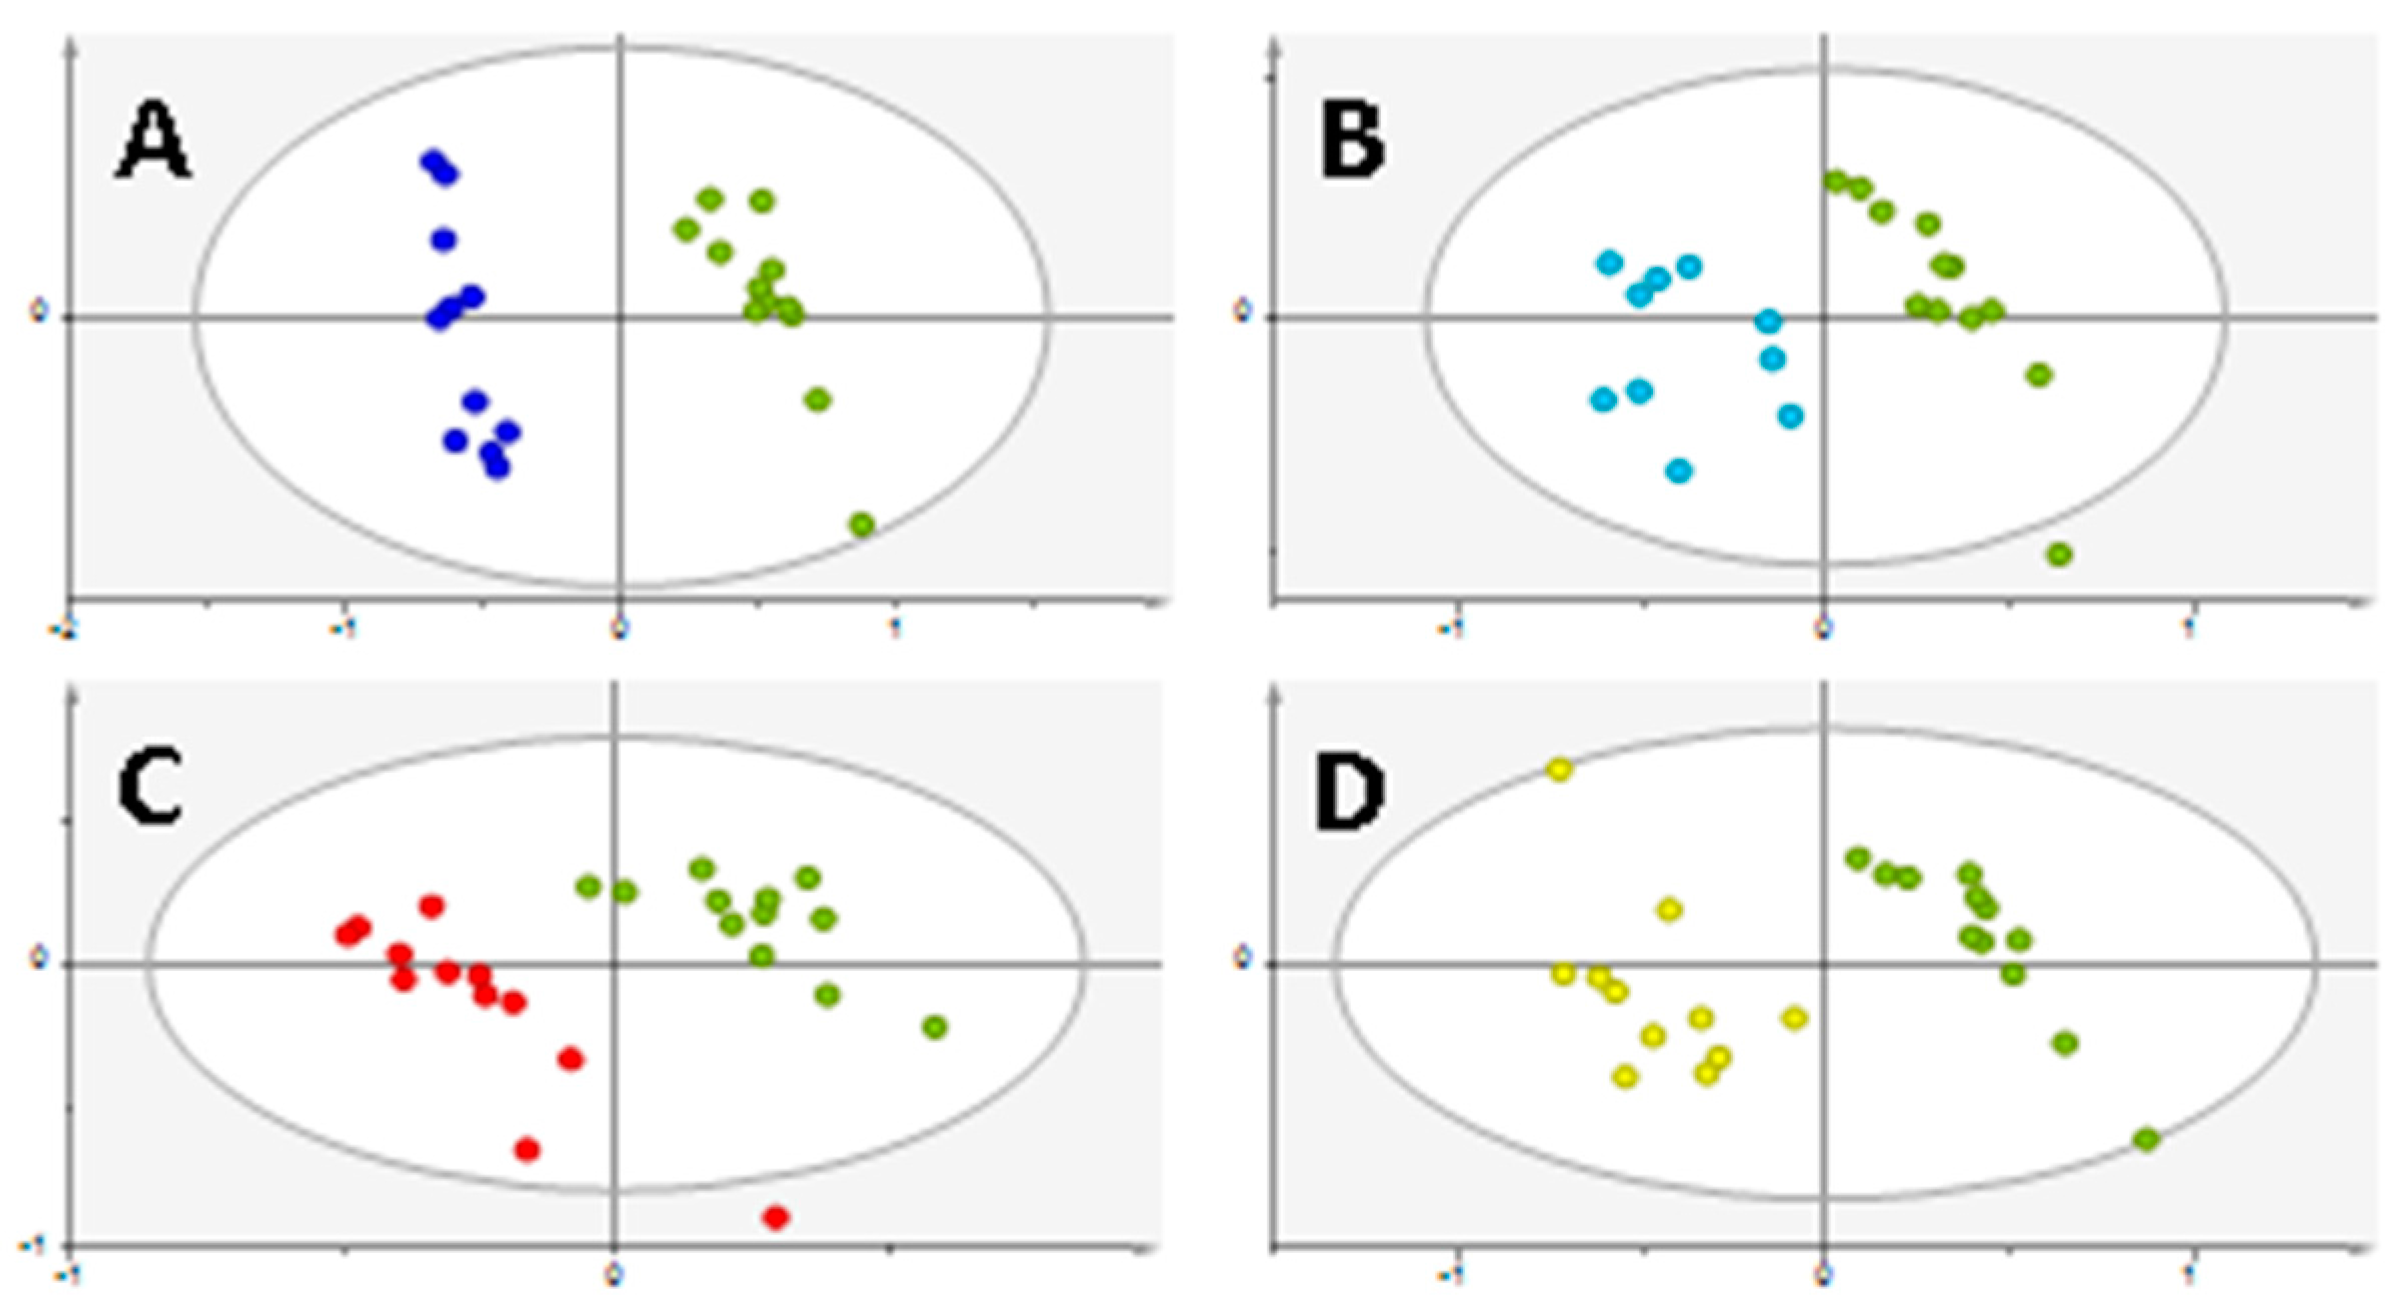
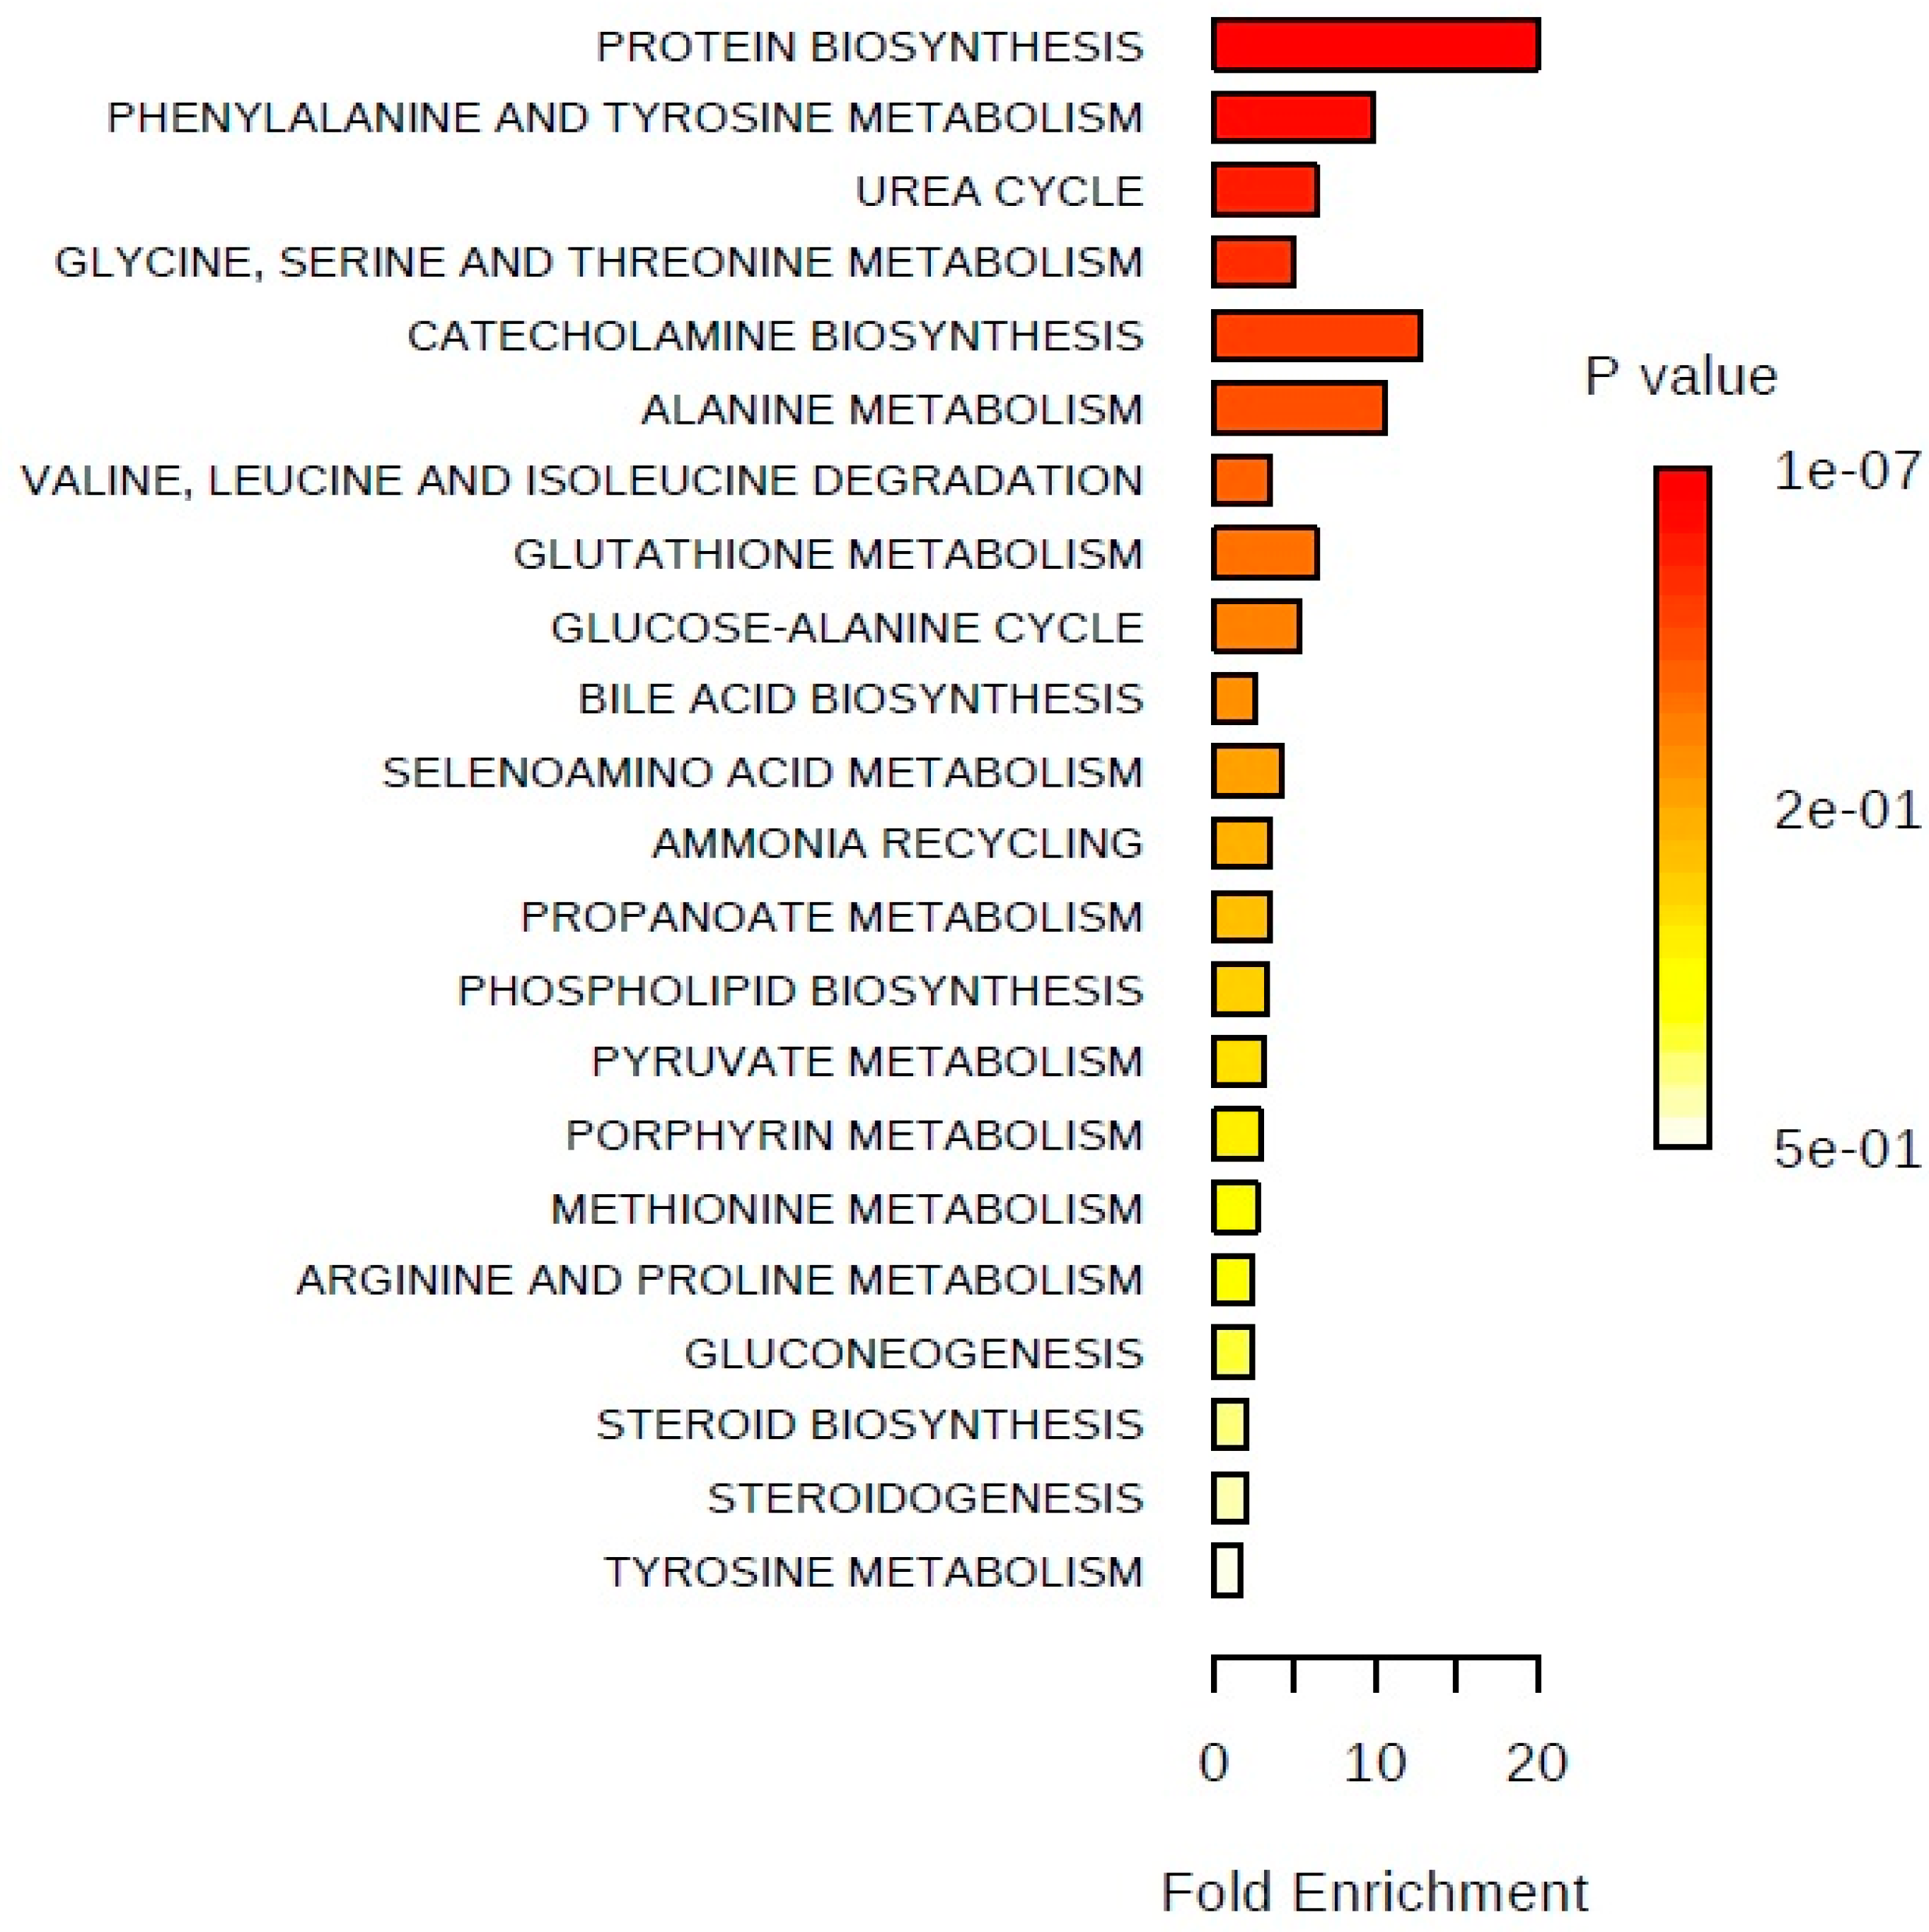
2. Results
3. Discussion
4. Materials and Methods
4.1. Chemicals
4.2. Cell Culture
4.3. Sample Collection
4.4. Metabolites Derivatization
4.5. GC-MS System and Data Acquisition
4.5.1. GC-MS Analysis
4.5.2. Statistical Analysis
5. Conclusions
Supplementary Materials
Acknowledgments
Author Contributions
Conflicts of Interest
References
- Rigau, M.; Olivan, M.; Garcia, M.; Sequeiros, T.; Montes, M.; Colas, E.; Llaurado, M.; Planas, J.; Torres, I.; Morote, J.; et al. The Present and Future of Prostate Cancer Urine Biomarkers. Int. J. Mol. Sci. 2013, 14, 12620–12649. [Google Scholar] [CrossRef] [PubMed]
- Siegel, R.L.; Miller, K.D.; Jemal, A. Cancer Statistics, 2017. CA Cancer J. Clin. 2017, 67, 7–30. [Google Scholar] [CrossRef] [PubMed]
- Decelle, E.A.; Cheng, L.L. High-Resolution Magic Angle Spinning 1 h Mrs in Prostate Cancer. NMR Biomed. 2014, 27, 90–99. [Google Scholar] [CrossRef] [PubMed]
- Trock, B.J. Application of Metabolomics to Prostate Cancer. Urol. Oncol. 2011, 29, 572–581. [Google Scholar] [CrossRef] [PubMed]
- Dimakakos, A.; Armakolas, A.; Koutsilieris, M. Novel Tools for Prostate Cancer Prognosis, Diagnosis, and Follow-Up. BioMed Res. Int. 2014, 2014, 890697. [Google Scholar] [CrossRef] [PubMed]
- Abrate, A.; Lughezzani, G.; Gadda, G.M.; Lista, G.; Kinzikeeva, E.; Fossati, N.; Larcher, A.; Dell’Oglio, P.; Mistretta, F.; Buffi, N.; et al. Clinical Use of [−2] Propsa (P2psa) and Its Derivatives (%P2psa and Prostate Health Index) for the Detection of Prostate Cancer: A Review of the Literature. Korean J. Urol. 2014, 55, 436–445. [Google Scholar] [CrossRef] [PubMed]
- Link, R.E.; Shariat, S.F.; Nguyen, C.V.; Farr, A.; Weinberg, A.D.; Morton, R.A.; Richardson, B.; Bernard, D.; Slawin, K.M. Variation in Prostate Specific Antigen Results from 2 Different Assay Platforms: Clinical Impact on 2304 Patients Undergoing Prostate Cancer Screening. J. Urol. 2004, 171, 2234–2238. [Google Scholar] [CrossRef] [PubMed]
- Moyer, V.A.; U.S. Preventive Services Task Force. Screening for Prostate Cancer: U.S. Preventive Services Task Force Recommendation Statement. Ann. Intern. Med. 2012, 157, 120–134. [Google Scholar] [CrossRef] [PubMed]
- Sreekumar, A.; Poisson, L.M.; Rajendiran, T.M.; Khan, A.P.; Cao, Q.; Yu, J.; Laxman, B.; Mehra, R.; Lonigro, R.J.; Li, Y.; et al. Metabolomic Profiles Delineate Potential Role for Sarcosine in Prostate Cancer Progression. Nature 2009, 457, 910–914. [Google Scholar] [CrossRef] [PubMed]
- Khan, A.P.; Rajendiran, T.M.; Ateeq, B.; Asangani, I.A.; Athanikar, J.N.; Yocum, A.K.; Mehra, R.; Siddiqui, J.; Palapattu, G.; Wei, J.T.; et al. The Role of Sarcosine Metabolism in Prostate Cancer Progression. Neoplasia 2013, 15, 491–501. [Google Scholar] [CrossRef] [PubMed]
- Kumar, D.; Gupta, A.; Mandhani, A.; Sankhwar, S.N. Metabolomics-Derived Prostate Cancer Biomarkers: Fact or Fiction? J. Proteome Res. 2015, 14, 1455–1464. [Google Scholar] [CrossRef] [PubMed]
- McDunn, J.E.; Li, Z.; Adam, K.P.; Neri, B.P.; Wolfert, R.L.; Milburn, M.V.; Lotan, Y.; Wheeler, T.M. Metabolomic Signatures of Aggressive Prostate Cancer. Prostate 2013, 73, 1547–1560. [Google Scholar] [CrossRef] [PubMed]
- Putluri, N.; Shojaie, A.; Vasu, V.T.; Nalluri, S.; Vareed, S.K.; Putluri, V.; Vivekanandan-Giri, A.; Byun, J.; Pennathur, S.; Sana, T.R.; et al. Metabolomic Profiling Reveals a Role for Androgen in Activating Amino Acid Metabolism and Methylation in Prostate Cancer Cells. PLoS ONE 2011, 6, e21417. [Google Scholar] [CrossRef] [PubMed]
- Wu, H.; Liu, T.; Ma, C.; Xue, R.; Deng, C.; Zeng, H.; Shen, X. Gc/Ms-Based Metabolomic Approach to Validate the Role of Urinary Sarcosine and Target Biomarkers for Human Prostate Cancer by Microwave-Assisted Derivatization. Anal. Bioanal. Chem. 2011, 401, 635–646. [Google Scholar] [CrossRef] [PubMed]
- Jentzmik, F.; Stephan, C.; Lein, M.; Miller, K.; Kamlage, B.; Bethan, B.; Kristiansen, G.; Jung, K. Sarcosine in Prostate Cancer Tissue Is Not a Differential Metabolite for Prostate Cancer Aggressiveness and Biochemical Progression. J. Urol. 2011, 185, 706–711. [Google Scholar] [CrossRef] [PubMed]
- Jentzmik, F.; Stephan, C.; Miller, K.; Schrader, M.; Erbersdobler, A.; Kristiansen, G.; Lein, M.; Jung, K. Sarcosine in Urine after Digital Rectal Examination Fails as a Marker in Prostate Cancer Detection and Identification of Aggressive Tumours. Eur. Urol. 2010, 58, 20–21. [Google Scholar] [CrossRef] [PubMed]
- Lima, A.R.; Mde, L.B.; Carvalho, M.; de Pinho, P.G. Biomarker Discovery in Human Prostate Cancer: An Update in Metabolomics Studies. Transl. Oncol. 2016, 9, 357–370. [Google Scholar] [CrossRef] [PubMed]
- Cuperlovic-Culf, M.; Barnett, D.A.; Culf, A.S.; Chute, I. Cell Culture Metabolomics: Applications and Future Directions. Drug Discov. Today 2010, 15, 610–621. [Google Scholar] [CrossRef] [PubMed]
- Halama, A. Metabolomics in Cell Culture—A Strategy to Study Crucial Metabolic Pathways in Cancer Development and the Response to Treatment. Arch. Biochem. Biophys. 2014, 564, 100–109. [Google Scholar] [CrossRef] [PubMed]
- Zhang, A.; Sun, H.; Xu, H.; Qiu, S.; Wang, X. Cell Metabolomics. OMICS 2013, 17, 495–501. [Google Scholar] [CrossRef] [PubMed]
- Keshari, K.R.; Sriram, R.; van Criekinge, M.; Wilson, D.M.; Wang, Z.J.; Vigneron, D.B.; Peehl, D.M.; Kurhanewicz, J. Metabolic Reprogramming and Validation of Hyperpolarized 13c Lactate as a Prostate Cancer Biomarker Using a Human Prostate Tissue Slice Culture Bioreactor. Prostate 2013, 73, 1171–1181. [Google Scholar] [CrossRef] [PubMed]
- Marcias, G.; Erdmann, E.; Lapouge, G.; Siebert, C.; Barthelemy, P.; Duclos, B.; Bergerat, J.P.; Ceraline, J.; Kurtz, J.E. Identification of Novel Truncated Androgen Receptor (Ar) Mutants Including Unreported Pre-Mrna Splicing Variants in the 22rv1 Hormone-Refractory Prostate Cancer (Pca) Cell Line. Hum. Mutat. 2010, 31, 74–80. [Google Scholar] [CrossRef] [PubMed]
- Costello, L.C.; Franklin, R.B. Concepts of Citrate Production and Secretion by Prostate. 1. Metabolic Relationships. Prostate 1991, 18, 25–46. [Google Scholar] [CrossRef] [PubMed]
- Costello, L.C.; Franklin, R.B. Prostatic Fluid Electrolyte Composition for the Screening of Prostate Cancer: A Potential Solution to a Major Problem. Prostate Cancer Prostatic Dis. 2009, 12, 17–24. [Google Scholar] [CrossRef] [PubMed]
- Pertega-Gomes, N.; Baltazar, F. Lactate Transporters in the Context of Prostate Cancer Metabolism: What Do We Know? Int. J. Mol. Sci. 2014, 15, 18333–18348. [Google Scholar] [CrossRef] [PubMed] [Green Version]
- Ramautar, R.; Berger, R.; van der Greef, J.; Hankemeier, T. Human Metabolomics: Strategies to Understand Biology. Curr. Opin. Chem. Biol. 2013, 17, 841–846. [Google Scholar] [CrossRef] [PubMed]
- Lucarelli, G.; Rutigliano, M.; Galleggiante, V.; Giglio, A.; Palazzo, S.; Ferro, M.; Simone, C.; Bettocchi, C.; Battaglia, M.; Ditonno, P. Metabolomic Profiling for the Identification of Novel Diagnostic Markers in Prostate Cancer. Expert Rev. Mol. Diagn. 2015, 15, 1211–1224. [Google Scholar] [CrossRef] [PubMed]
- Wang, Q.; Hardie, R.A.; Hoy, A.J.; van Geldermalsen, M.; Gao, D.; Fazli, L.; Sadowski, M.C.; Balaban, S.; Schreuder, M.; Nagarajah, R.; et al. Targeting Asct2-Mediated Glutamine Uptake Blocks Prostate Cancer Growth and Tumour Development. J. Pathol. 2015, 236, 278–289. [Google Scholar] [CrossRef] [PubMed] [Green Version]
- Struck-Lewicka, W.; Kordalewska, M.; Bujak, R.; Mpanga, A.Y.; Markuszewski, M.; Jacyna, J.; Matuszewski, M.; Kaliszan, R.; Markuszewski, M.J. Urine Metabolic Fingerprinting Using Lc-Ms and Gc-Ms Reveals Metabolite Changes in Prostate Cancer: A Pilot Study. J. Pharm. Biomed. Anal. 2015, 111, 351–361. [Google Scholar] [CrossRef] [PubMed]
- Kufe, D.W. Mucins in Cancer: Function, Prognosis and Therapy. Nat. Rev. Cancer 2009, 9, 874–885. [Google Scholar] [CrossRef] [PubMed]
- Cernei, N.; Heger, Z.; Gumulec, J.; Zitka, O.; Masarik, M.; Babula, P.; Eckschlager, T.; Stiborova, M.; Kizek, R.; Adam, V. Sarcosine as a Potential Prostate Cancer Biomarker—A Review. Int. J. Mol. Sci. 2013, 14, 13893–13908. [Google Scholar] [CrossRef] [PubMed]
- Zhou, Y.; Song, R.; Ma, C.; Zhou, L.; Liu, X.; Yin, P.; Zhang, Z.; Sun, Y.; Xu, C.; Lu, X.; et al. Discovery and Validation of Potential Urinary Biomarkers for Bladder Cancer Diagnosis Using a Pseudotargeted Gc-Ms Metabolomics Method. Oncotarget 2017, 8, 20719–20728. [Google Scholar] [CrossRef] [PubMed]
- Miyagi, Y.; Higashiyama, M.; Gochi, A.; Akaike, M.; Ishikawa, T.; Miura, T.; Saruki, N.; Bando, E.; Kimura, H.; Imamura, F.; et al. Plasma Free Amino Acid Profiling of Five Types of Cancer Patients and Its Application for Early Detection. PLoS ONE 2011, 6, e24143. [Google Scholar] [CrossRef] [PubMed]
- Teahan, O.; Bevan, C.L.; Waxman, J.; Keun, H.C. Metabolic Signatures of Malignant Progression in Prostate Epithelial Cells. Int. J. Biochem. Cell Biol. 2011, 43, 1002–1009. [Google Scholar] [CrossRef] [PubMed]
- Eley, H.L.; Russell, S.T.; Baxter, J.H.; Mukerji, P.; Tisdale, M.J. Signaling Pathways Initiated by Beta-Hydroxy-Beta-Methylbutyrate to Attenuate the Depression of Protein Synthesis in Skeletal Muscle in Response to Cachectic Stimuli. Am. J. Physiol. Endocrinol. Metab. 2007, 293, E923–E931. [Google Scholar] [CrossRef] [PubMed]
- Jung, K.; Reszka, R.; Kamlage, B.; Bethan, B.; Stephan, C.; Lein, M.; Kristiansen, G. Tissue Metabolite Profiling Identifies Differentiating and Prognostic Biomarkers for Prostate Carcinoma. Int. J. Cancer 2013, 133, 2914–2924. [Google Scholar] [CrossRef] [PubMed]
- Thysell, E.; Surowiec, I.; Hornberg, E.; Crnalic, S.; Widmark, A.; Johansson, A.I.; Stattin, P.; Bergh, A.; Moritz, T.; Antti, H.; et al. Metabolomic Characterization of Human Prostate Cancer Bone Metastases Reveals Increased Levels of Cholesterol. PLoS ONE 2010, 5, e14175. [Google Scholar] [CrossRef] [PubMed]
- Awad, A.B.; Fink, C.S.; Williams, H.; Kim, U. In Vitro and in Vivo (Scid Mice) Effects of Phytosterols on the Growth and Dissemination of Human Prostate Cancer Pc-3 Cells. Eur. J. Cancer Prev. 2001, 10, 507–513. [Google Scholar] [CrossRef] [PubMed]
- Zhou, X.; Mao, J.; Ai, J.; Deng, Y.; Roth, M.R.; Pound, C.; Henegar, J.; Welti, R.; Bigler, S.A. Identification of Plasma Lipid Biomarkers for Prostate Cancer by Lipidomics and Bioinformatics. PLoS ONE 2012, 7, e48889. [Google Scholar] [CrossRef] [PubMed]
- Swanson, M.G.; Keshari, K.R.; Tabatabai, Z.L.; Simko, J.P.; Shinohara, K.; Carroll, P.R.; Zektzer, A.S.; Kurhanewicz, J. Quantification of Choline- and Ethanolamine-Containing Metabolites in Human Prostate Tissues Using 1 h Hr-Mas Total Correlation Spectroscopy. Magn. Reson. Med. 2008, 60, 33–40. [Google Scholar] [CrossRef] [PubMed]
- Mintz, A.; Wang, L.; Ponde, D.E. Comparison of Radiolabeled Choline and Ethanolamine as Probe for Cancer Detection. Cancer Biol. Ther. 2008, 7, 742–747. [Google Scholar] [CrossRef] [PubMed]
- Wishart, D.S.; Tzur, D.; Knox, C.; Eisner, R.; Guo, A.C.; Young, N.; Cheng, D.; Jewell, K.; Arndt, D.; Sawhney, S.; et al. Hmdb: The Human Metabolome Database. Nucleic Acids Res. 2007, 35, D521–D526. [Google Scholar] [CrossRef] [PubMed]
- Wishart, D.S.; Knox, C.; Guo, A.C.; Eisner, R.; Young, N.; Gautam, B.; Hau, D.D.; Psychogios, N.; Dong, E.; Bouatra, S.; et al. Hmdb: A Knowledgebase for the Human Metabolome. Nucleic Acids Res. 2009, 37, D603–D610. [Google Scholar] [CrossRef] [PubMed]
- Wishart, D.S.; Jewison, T.; Guo, A.C.; Wilson, M.; Knox, C.; Liu, Y.; Djoumbou, Y.; Mandal, R.; Aziat, F.; Dong, E.; et al. Hmdb 3.0—The Human Metabolome Database in 2013. Nucleic Acids Res. 2013, 41, D801–D807. [Google Scholar] [CrossRef] [PubMed]
- Zang, X.; Jones, C.M.; Long, T.Q.; Monge, M.E.; Zhou, M.; Walker, L.D.; Mezencev, R.; Gray, A.; McDonald, J.F.; Fernandez, F.M. Feasibility of Detecting Prostate Cancer by Ultraperformance Liquid Chromatography-Mass Spectrometry Serum Metabolomics. J. Proteome Res. 2014, 13, 3444–3454. [Google Scholar] [CrossRef] [PubMed]
- Saylor, P.J.; Karoly, E.D.; Smith, M.R. Prospective Study of Changes in the Metabolomic Profiles of Men During Their First Three Months of Androgen Deprivation Therapy for Prostate Cancer. Clin. Cancer Res. 2012, 18, 3677–3685. [Google Scholar] [CrossRef] [PubMed]
- Crowe, F.L.; Allen, N.E.; Appleby, P.N.; Overvad, K.; Aardestrup, I.V.; Johnsen, N.F.; Tjonneland, A.; Linseisen, J.; Kaaks, R.; Boeing, H.; et al. Fatty Acid Composition of Plasma Phospholipids and Risk of Prostate Cancer in a Case-Control Analysis Nested within the European Prospective Investigation into Cancer and Nutrition. Am. J. Clin. Nutr. 2008, 88, 1353–1363. [Google Scholar] [PubMed]
- Xia, J.; Wishart, D.S. Msea: A Web-Based Tool to Identify Biologically Meaningful Patterns in Quantitative Metabolomic Data. Nucleic Acids Res. 2010, 38, W71–W77. [Google Scholar] [CrossRef] [PubMed]
- Pereira, D.M.; Vinholes, J.; de Pinho, P.G.; Valentao, P.; Mouga, T.; Teixeira, N.; Andrade, P.B. A Gas Chromatography-Mass Spectrometry Multi-Target Method for the Simultaneous Analysis of Three Classes of Metabolites in Marine Organisms. Talanta 2012, 100, 391–400. [Google Scholar] [CrossRef] [PubMed]
- Mastrangelo, A.; Ferrarini, A.; Rey-Stolle, F.; Garcia, A.; Barbas, C. From Sample Treatment to Biomarker Discovery: A Tutorial for Untargeted Metabolomics Based on Gc-(Ei)-Q-Ms. Anal. Chim. Acta 2015, 900, 21–35. [Google Scholar] [CrossRef] [PubMed]
- Pluskal, T.; Castillo, S.; Villar-Briones, A.; Oresic, M. Mzmine 2: Modular Framework for Processing, Visualizing, and Analyzing Mass Spectrometry-Based Molecular Profile Data. BMC Bioinform. 2010, 11, 395. [Google Scholar] [CrossRef] [PubMed]
- Berben, L.; Sereika, S.M.; Engberg, S. Effect Size Estimation: Methods and Examples. Int. J. Nurs Stud. 2012, 49, 1039–1047. [Google Scholar] [CrossRef] [PubMed]
- Aickin, M.; Gensler, H. Adjusting for Multiple Testing When Reporting Research Results: The Bonferroni vs. Holm Methods. Am. J. Public Health 1996, 86, 726–728. [Google Scholar] [CrossRef] [PubMed]
- Xia, J.; Broadhurst, D.I.; Wilson, M.; Wishart, D.S. Translational Biomarker Discovery in Clinical Metabolomics: An Introductory Tutorial. Metabolomics 2013, 9, 280–299. [Google Scholar] [CrossRef] [PubMed]

| Chemical Name (IUPAC) or Common Name | 22RV1 vs. PNT2 | PC3 vs. PNT2 | DU145 vs. PNT2 | LNCaP vs. PNT2 | ||||||||||||
|---|---|---|---|---|---|---|---|---|---|---|---|---|---|---|---|---|
| p Value | Variation ± Uncertainty | ES ± ESSE | AUC | p Value | Variation ± Uncertainty | ES ± ESSE | AUC | p Value | Variation ± Uncertainty | ES ± ESSE | AUC | p Value | Variation ± Uncertainty | ES ± ESSE | AUC | |
| Amino acids | ||||||||||||||||
| L-Alanine | 0.0034 | ↓ 24.92 ± 8.48 | ↓ 1.18 ± 0.90 | 0.85 | <0.0001 P | ↓ 53.75 ± 8.88 | ↓ 3.26 ± 1.20 | 0.98 | 0.0171 | ↓ 24.11 ± 9.88 | ↓ 1.13 ± 0.85 | 0.77 | ||||
| Glycine | 0.0004 P | ↑ 335.89 ± 27.22 | ↑ 1.99 ± 0.98 | 0.90 | 0.0015 | ↑ 111.09 ± 27.01 | ↑ 1.35 ± 0.93 | 0.88 | >0.05 | ↑ | ↑ | 0.0042 | ↑ 118.14 ± 20.13 | ↑ 1.57 ± 0.91 | 0.86 | |
| Sarcosine (N-methylglycine) | >0.05 | ↓ | ↓ | |||||||||||||
| β-Alanine | <0.0001 P | ↓ 83.07 ± 21.15 | ↓ 2.52 ± 1.07 | 0.99 | 0.0066 | ↑ 78.49 ± 18.46 | ↑ 1.43 ± 0.94 | 0.84 | <0.0001 P | ↑ 729.64 ± 20.99 | ↑ 2.95 ± 1.14 | 1 | <0.0001 P | ↓ 87.83 ± 21.39 | ↓ 2.73 ± 1.12 | 1 |
| L-Valine | <0.0001 P | ↓ 92.03 ± 12.16 | ↓ 5.20 ± 1.70 | 1 | <0.0001 P | ↓ 62.12 ± 15.18 | ↓ 2.40 ± 1.10 | 0.97 | <0.0001 P | ↓ 58.58 ± 11.82 | ↓ 2.76 ± 1.10 | 0.97 | <0.0001 P | ↓ 71.40 ± 10.70 | ↓ 3.92 ± 1.38 | 1 |
| L-Leucine | <0.0001 P | ↓ 72.24 ± 10.06 | ↓ 4.29 ± 1.47 | 1 | 0.0420 | ↓ 25.18 ± 12.60 | ↓ 1.00 ± 0.88 | 0.75 | <0.0001 P | ↓ 45.52 ± 10.07 | ↓ 2.97 ± 1.16 | 0.95 | <0.0001 P | ↓ 51.55 ± 9.06 | ↓ 2.97 ± 1.16 | 0.98 |
| L-Proline | >0.05 | ↑ 21.11 ± 17.59 | ↑ | >0.05 | ↑ | ↑ | >0.05 | ↓ | ↓ | >0.05 | ↓ | ↓ | ||||
| L-Threonine | 0.0187 | ↓ 37.40 ± 17.94 | ↓ 1.02 ± 0.84 | 0.79 | 0.0104 | ↓ 39.33 ± 16.31 | ↓ 1.18 ± 0.90 | 0.79 | 0.0499 | ↓ 26.44 ± 13.94 | ↓ 0.86 ± 0.81 | 0.0445 | ↓ 27.58 ± 14.13 | ↓ 0.88 ± 0.82 | 0.75 | |
| L-Aspartic acid | >0.05 | ↓ | ↓ | >0.05 | ↑ | ↑ | >0.05 | ↑ | ↑ | >0.05 | ↓ 25.32 ± 22.20 | ↓ | ||||
| L-Glutamine | <0.0001 P | ↑ 122.44 ± 13.48 | ↑ 2.36 ± 1.04 | 0.95 | >0.05 | ↑ 35.65 ± 19.27 | ↑ | >0.05 | ↓ | ↓ | <0.0001 P | ↑ 108.67 ± 12.83 | ↑ 2.29 ± 1.03 | 0.92 | ||
| Phenylalanine | 0.0075 | ↑ 29.96 ± 8.45 | ↑ 1.23 ± 0.87 | 1 | 0.0056 | ↓ 35.65 ± 13.25 | ↓ 1.34 ± 0.92 | 0.86 | 0.0447 | ↓ 20.14 ± 10.71 | ↓ | 0.0036 | ↓ 42.45 ± 13.45 | ↓ 1.59 ± 0.91 | 0.85 | |
| L-Tyrosine | 0.0002 P | ↑ 43.50 ± 7.52 | ↑ 1.92 ± 0.96 | 0.92 | 0.0322 | ↑ 27.81 ± 10.49 | ↑ 1.04 ± 0.89 | 0.73 | 0.0406 | ↓ 20.27 ± 8.09 | ↓ 0.90 ± 0.81 | 0.76 | <0.0001 P | ↓ 44.38 ± 9.74 | ↓ 2.28 ± 1.03 | 0.93 |
| Sugars | ||||||||||||||||
| Sorbose | <0.0001 P | ↓ 73.09 ± 10.30 | ↓ 4.22 ± 1.45 | 1 | >0.05 | ↓ | ↓ | 0.0009 P | ↓ 37.57 ± 11.50 | ↓ 1.59 ± 0.89 | 0.86 | <0.0001 P | ↓ 64.31 ± 10.68 | ↓ 3.41 ± 1.26 | 1 | |
| Organic acids derivatives | ||||||||||||||||
| Lactic Acid | <0.0001 P | ↓ 84.79 ± 7.44 | ↓ 7.43 ± 2.29 | 1 | <0.0001 P | ↓ 31.78 ± 6.23 | ↓ 2.38 ± 1.10 | 0.96 | 0.0213 | ↓ 18.06 ± 7.62 | ↓ 1.03 ± 0.85 | 0.81 | <0.0001 P | ↓ 55.39 ± 7.88 | ↓ 3.83 ± 1.36 | 1 |
| 3-Hydroxy-propionic acid | >0.05 | ↑ | ↑ | |||||||||||||
| 2-Butenoic acid | >0.05 | ↑ 29.61 ± 20.94 | ↑ | >0.05 | ↑ 28.98 ± 11.45 | ↑ | <0.0001 P | ↑ 130.36 ± 12.10 | ↑ 2.57 ± 1.06 | 0.99 | >0.05 | ↑ 20.13 ± 14.41 | ↑ | |||
| 3-Hydroxy-isovaleric acid | <0.0001 P | ↑ 802.11 ± 48.46 | ↑ 1.84 ± 1.00 | 1 | <0.0001 P | ↑ 789.83 ± 18.65 | ↑ 3.37 ± 1.23 | 1 | <0.0001 P | ↑ 3161.67 ± 34.43 | ↑ 2.40 ± 1.04 | 1 | ||||
| Toluic acid | >0.05 | ↓ 16.04 ± 10.59 | ↓ | |||||||||||||
| Galacturonic acid | >0.05 | ↑ 115.65 ± 78.05 | ↑ | >0.05 | ↑ | ↑ | >0.05 | ↑ | ↑ | >0.05 | ↑ | ↑ | ||||
| Fatty acids | ||||||||||||||||
| Tridecanoic acid | >0.05 | ↑ | ↑ | >0.05 | ↑ 63.28 ± 58.62 | ↑ | ||||||||||
| Palmitic Acid | >0.05 | ↓ 13.54 ± 6.80 | ↓ 0.86 ± 0.83 | >0.05 | ↑ | ↑ | >0.05 | ↑ | ↑ | 0.0424 | ↑ 21.27 ± 8.34 | ↑ 0.95 ± 0.84 | 0.78 | |||
| 9-Hexadecenoic acid (palmitoleic acid) | <0.0001 P | ↑ 284.2 ± 18.01 | ↑ 2.81 ± 1.13 | 1 | 0.0048 | ↑ 85.75 ± 23.12 | ↑ 1.02 ± 0.83 | 0.83 | ||||||||
| 13-Octadecenoic acid | <0.0001 P | ↑ 560.66 ± 18.06 | ↑ 3.54 ± 1.29 | 1 | ||||||||||||
| Steroids | ||||||||||||||||
| Cholesterol | 0.0004 P | ↑ 110.4 ± 15.40 | ↑ 1.96 ± 0.97 | 0.91 | <0.0001 P | ↑ 65.91 ± 7.57 | ↑ 3.01 ± 1.23 | 0.99 | >0.05 | ↑ 20.85 ± 12.10 | ↑ | 0.0004 P | ↑ 73.42 ± 14.39 | ↑ 1.58 ± 0.91 | 0.91 | |
| Others | ||||||||||||||||
| Ethanolamine | <0.0001 P | ↓ 97.18 ± 18.37 | ↓ 3.80 ± 1.35 | 1 | 0.0052 | ↓ 54.13 ± 21.78 | ↓ 1.41 ± 0.93 | 0.83 | <0.0001 P | ↓ 80.14 ± 18.04 | ↓ 2.92 ± 1.31 | 0.99 | <0.0001 P | ↓ 89.19 ± 17.26 | ↓ 3.47 ± 1.28 | 1 |
| Urea | 0.0002 P | ↓ 36.52 ± 9.04 | ↓ 1.93 ± 0.97 | 0.92 | <0.0001p | ↓ 45.10 ± 9.41 | ↓ 2.36 ± 1.09 | 0.97 | <0.0001 P | ↓ 47.59 ± 9.66 | ↓ 2.31 ± 1.01 | 0.97 | >0.05 | ↑ 8.39 ± 7.20 | ↑ | |
| Glycerol | >0.05 | ↑ 32.43 ± 19.85 | ↑ | 0.0005 P | ↓ 60.06 ± 18.39 | ↓ 1.84 ± 0.93 | 0.90 | 0.0004 P | ↓ 58.18 ± 15.77 | ↓ 1.97 ± 0.97 | 0.98 | |||||
| Creatinine | >0.05 | ↓ 51.11 ± 46.5 | ↓ | |||||||||||||
| Methyl 2-acetamido-2-deoxy-3-O-methyl-a-d-galactopyrano-side | >0.05 | ↑ 196.92 ± 50.03 | ↑ 1.05 ± 0.89 | 0.0037 | ↑ 88.07 ± 16.92 | ↑ 1.42 ± 0.87 | 0.82 | 0.0050 | ↑ 374.03 ± 5.88 | ↑ 1.57 ± 0.91 | 0.89 | |||||
| Unknowns | ||||||||||||||||
| Unknown 1 | >0.05 | ↑ 69.09 ± 27.41 | ↑ 0.90 ± 0.87 | 0.0001 P | ↓ 70.35 ± 22.44 | ↓ 1.82 ± 0.94 | 0.94 | |||||||||
| Unknown 2 | 0.0309 | ↑ 55.75 ± 17.47 | ↑ 1.04 ± 0.84 | 0.71 | 0.0006 P | ↓ 44.67 ± 12.70 | ↓ 1.67 ± 0.97 | 0.69 | <0.0001 P | ↓ 56.86 ± 15.31 | ↓ 2.05 ± 0.97 | 0.92 | 0.0321 | ↑ 93.47 ± 25.21 | ↑ 1.07 ± 0.84 | 0.70 |
| Unknown 3 | >0.05 | ↓ 54.68 ± 39.46 | ↓ | >0.05 | ↓ 37.52 ± 36.65 | ↓ | >0.05 | ↓ | ↓ | >0.05 | ↓ 40.90 ± 32.77 | ↓ | ||||
| Unknown 4 | <0.0001 P | ↑ 182.71 ± 16.77 | ↑ 2.97 ± 1.22 | 1 | 0.0018 | ↑ 82.93 ± 11.28 | ↑ 2.05 ± 0.97 | 0.86 | <0.0001 P | ↑ 64.27 ± 7.16 | ↑ 2.80 ± 1.13 | 0.95 | ||||
| Unknown 5 | >0.05 | ↑ 47.15 ± 41.17 | ↑ | |||||||||||||
| Unknown 6 | <0.0001 P | ↑ 222.97 ± 14.87 | ↑ 3.03 ± 1.17 | 1 | 0.0008 P | ↑ 132.53 ± 18.38 | ↑ 2.18 ± 1.06 | 0.95 | 0.0078 | ↑ 70.10 ± 16.23 | ↑ 1.26 ± 0.85 | 0.83 | ||||
| Unknown 7 | >0.05 | ↓ | ↓ | >0.05 | ↑ 63.22 ± 58.62 | ↑ | ||||||||||
| Unknown 8 | 0.0002 P | ↑ 71.71 ± 10.89 | ↑ 1.91 ± 0.94 | 0.93 | ||||||||||||
| Unknown 9 | 0.0106 | ↑ 25.74 ± 8.04 | ↑ 1.16 ± 0.85 | 0.81 | >0.05 | ↓ 16.43 ± 9.53 | ↓ | 0.0014 | ↑ 27.91 ± 7.39 | ↑ 1.31 ± 0.87 | 0.87 | >0.05 | ↑ 15.5 ± 7.07 | ↑ | ||
| Unknown 10 | 0.0252 | ↑ 24.74 ± 8.62 | ↑ 1.04 ± 0.84 | 0.79 | 0.0032 | ↓ 29.52 ± 9.79 | ↓ 1.48 ± 0.94 | 0.90 | >0.05 | ↑ 11.09 ± 7.51 | ↑ | 0.0256 | ↑ 20.39 ± 7.37 | ↑ 1.02 ± 0.84 | 0.76 | |
| Unknown 11 | <0.0001 P | ↑ 147.83 ± 10.00 | ↑ 3.53 ± 1.29 | 1 | ||||||||||||
| Unknown 12 | >0.05 | ↑ 25.39 ± 16.87 | ↑ | |||||||||||||
| Unknown 13 | <0.0001 P | ↓ 56.54 ± 9.08 | ↓ 3.52 ± 1.35 | 0.99 | ||||||||||||
| Unknown 14 | >0.05 | ↑ | ↑ | |||||||||||||
| Unknown | <0.0001 P | ↑ 326.66 ± 19.57 | ↑ 2.50 ± 1.04 | 0.96 | ||||||||||||
| Sensitivity | Specificity | |
|---|---|---|
| 22RV1 vs. PNT2 | 100% | 100% |
| PC3 vs. PNT2 | 100% | 100% |
| DU145 vs. PNT2 | 100% | 100% |
| LNCaP vs. PNT2 | 97% | 100% |
© 2018 by the authors. Licensee MDPI, Basel, Switzerland. This article is an open access article distributed under the terms and conditions of the Creative Commons Attribution (CC BY) license (http://creativecommons.org/licenses/by/4.0/).
Share and Cite
Lima, A.R.; Araújo, A.M.; Pinto, J.; Jerónimo, C.; Henrique, R.; Bastos, M.D.L.; Carvalho, M.; Guedes de Pinho, P. GC-MS-Based Endometabolome Analysis Differentiates Prostate Cancer from Normal Prostate Cells. Metabolites 2018, 8, 23. https://doi.org/10.3390/metabo8010023
Lima AR, Araújo AM, Pinto J, Jerónimo C, Henrique R, Bastos MDL, Carvalho M, Guedes de Pinho P. GC-MS-Based Endometabolome Analysis Differentiates Prostate Cancer from Normal Prostate Cells. Metabolites. 2018; 8(1):23. https://doi.org/10.3390/metabo8010023
Chicago/Turabian StyleLima, Ana Rita, Ana Margarida Araújo, Joana Pinto, Carmen Jerónimo, Rui Henrique, Maria De Lourdes Bastos, Márcia Carvalho, and Paula Guedes de Pinho. 2018. "GC-MS-Based Endometabolome Analysis Differentiates Prostate Cancer from Normal Prostate Cells" Metabolites 8, no. 1: 23. https://doi.org/10.3390/metabo8010023