Article

Evaluation of State-Resolved Reaction Probabilities and Their Application in Population Models for He, H, and H2

1
Max-Planck-Institut für Plasmaphysik, Boltzmannstraße 2, 85748 Garching, Germany
1
(Bari, Italy)
*
Author to whom correspondence should be addressed.
Atoms 2016, 4(4), 26; https://doi.org/10.3390/atoms4040026
Submission received: 6 July 2016 / Revised: 2 September 2016 / Accepted: 21 September 2016 / Published: 29 September 2016
(This article belongs to the Special Issue Atomic and Molecular Data for Hydrogen and Helium in Fusion Plasma)

Abstract

:
Population models are a prerequisite for performing qualitative analysis of population densities measured in plasmas or predicting the dependence of plasma emission on parameter variations. Models for atomic helium and hydrogen as well as molecular hydrogen in low-pressure plasmas are introduced. The cross-sections and transition probabilities used as input in the atomic models are known very accurately, and thus a benchmark of these models against experiments is very successful. For H2, in contrast, significant deviations exist between reaction probabilities taken from different literature sources. The reason for this is the more complex internal structure of molecules compared to atoms. Vibrationally resolved models are applied to demonstrate how these deviations affect the model results. Steps towards a consistent input data set are presented: vibrationally resolved Franck–Condon factors, transition probabilities, and ionization cross-sections have been calculated and are available now. Additionally, ro-vibrational models for selected transitions are applied successfully to low-density, low-temperature plasmas. For further improving the accuracy of population models for H2, however, it is necessary to establish a comprehensive data set for ro-vibrationally resolved excitation cross-sections based on the most recent calculation techniques.

1. Introduction

Helium and atomic as well as molecular hydrogen are present in different kinds of plasmas, ranging from astrophysics to plasma-processing devices and fusion experiments. For characterizing these plasmas, knowledge of the plasma parameters is mandatory. Among the common diagnostic techniques are optical emission spectroscopy (OES) [1], optical absorption spectroscopy [2], two-photon excited laser-induced fluorescence (TALIF) [3], and tunable diode laser absorption spectroscopy (TDLAS) [4], which all require population models to deduce the plasma parameters from measured population densities.
Population models predict the population densities of excited states in atoms or molecules and their dependence on parameters as electron temperature Te, electron density ne, and the quasi-constant densities of the ground states of one or more particle species. While in equilibrium plasmas the (local) thermodynamic equilibrium is fulfilled, for nonequilibrium plasmas, corona or collisional radiative (CR) models have to be applied.
Such models describe the excited state population densities in a zero-dimensional approximation and they can be used either for backward or for forward calculations. Backward application is used for determining plasma parameters (typically Te and ne): the plasma parameters used as input to the model are varied until the simulated population densities best match the measured population densities of one or more excited states in the respective atom or molecule [1,5]. Forward calculations allow for known plasma parameters predicting the population densities of excited states. The latter information can be useful; for example, for predicting the photon emission of atomic lines as well as molecular bands, and the impact of this radiation on surfaces [6].
The accuracy of the results of population models is directly correlated on the one hand to the completeness of the model: all processes relevant for populating and depopulating excited states in the plasma under investigation have to be considered by the model. The set of reactions to be implemented can strongly depend on the plasma parameters. On the other hand, the accuracy of the model results correlates with the error bar of the implemented reaction probabilities.
This paper focusses on population models for helium and hydrogen plasmas. Described first is the theory of population modeling in such plasmas and the used solver. Then, models for the helium atom, the hydrogen atom, and the hydrogen molecule are introduced. The models are benchmarked extensively versus measurements made in low-pressure, low temperature plasmas, and the accuracy of the implemented reaction probabilities is assessed. Efforts are undertaken to improve and enlarge the available set of reaction probabilities for molecular hydrogen.

2. Population Models

2.1. Theory of Population Modeling

The basis of population models are ordinary differential equations—the so-called rate equations—balancing the probabilities for populating and depopulating each excited state of an atom or molecule. The accuracy of the model results—and consequently also the results of diagnostic evaluations based on the model—is strongly correlated to the accuracy of all ingoing reaction probabilities.
If direct excitation from the ground state is the dominant excitation process (Te ≥ a few eV and/or low densities of ionic species) and collision reactions connecting different excited states are negligible (ne < 1017 m−3), corona models can be applied. These models balance electron collision excitation from the atomic or molecular ground state with spontaneous emission. The density of the ground state is assumed to be quasi-constant and is used as an input parameter.
CR models consider a much larger number of reaction channels than corona models, including stepwise excitation and excitation by cascades from energetically higher levels. Additionally, processes like self-absorption of emission lines due to optical thickness [7], transport of metastable states and radiation transfer can be added to CR models. Again, the ground state density is used as input parameter. Compared to corona models, CR models are applicable in a much broader parameter range. The rate equations for all excited states form a system of coupled ordinary differential equations.
Besides the ground state of the atom or molecule, other particle species with quasi-constant population densities can play a role for populating the excited states. Examples are metastable states, diatomic molecules (dissociative excitation can result in one excited atom and one atom in its ground state) and ions (recombination processes can end in atomic or molecular excited states). These particle species and the reaction probabilities for the relevant population processes have to be included to the CR model.
For very high ne (>1022 m−3) the results of population models should approach the local thermodynamic equilibrium or even the thermodynamic equilibrium. The latter is, however, not always the case for CR models applied to low-pressure plasmas since these models often neglect or strongly simplify the radiation transport.

2.2. The Flexible Sover Yacora

The flexible code Yacora [5] can determine the solution of coupled ordinary differential equations by integrating the equation system. This procedure allows implementing nonlinear and time-dependent processes (e.g., optical thickness) into the rate equations.
Typically, the timescales on which collisional and radiative processes in plasma take place are drastically different. Thus, the system of coupled rate equations has a high stiffness. Ordinary solution techniques like the Runge–Kutta method are too slow, and instead the solver CVODE [8] is used. Yacora allows the user to easily define the name of all species and states, the probabilities for all reactions, and the initial conditions. The probabilities of collision processes can be given either as rate coefficients or cross-sections. In the latter case, additionally an electron energy distribution function (EEDF) has to be defined. This offers the possibility to perform calculations for plasma regimes with non-Maxwellian EEDF, as is often observed in low-pressure, low-temperature plasmas [9].

3. Atomic Population Models
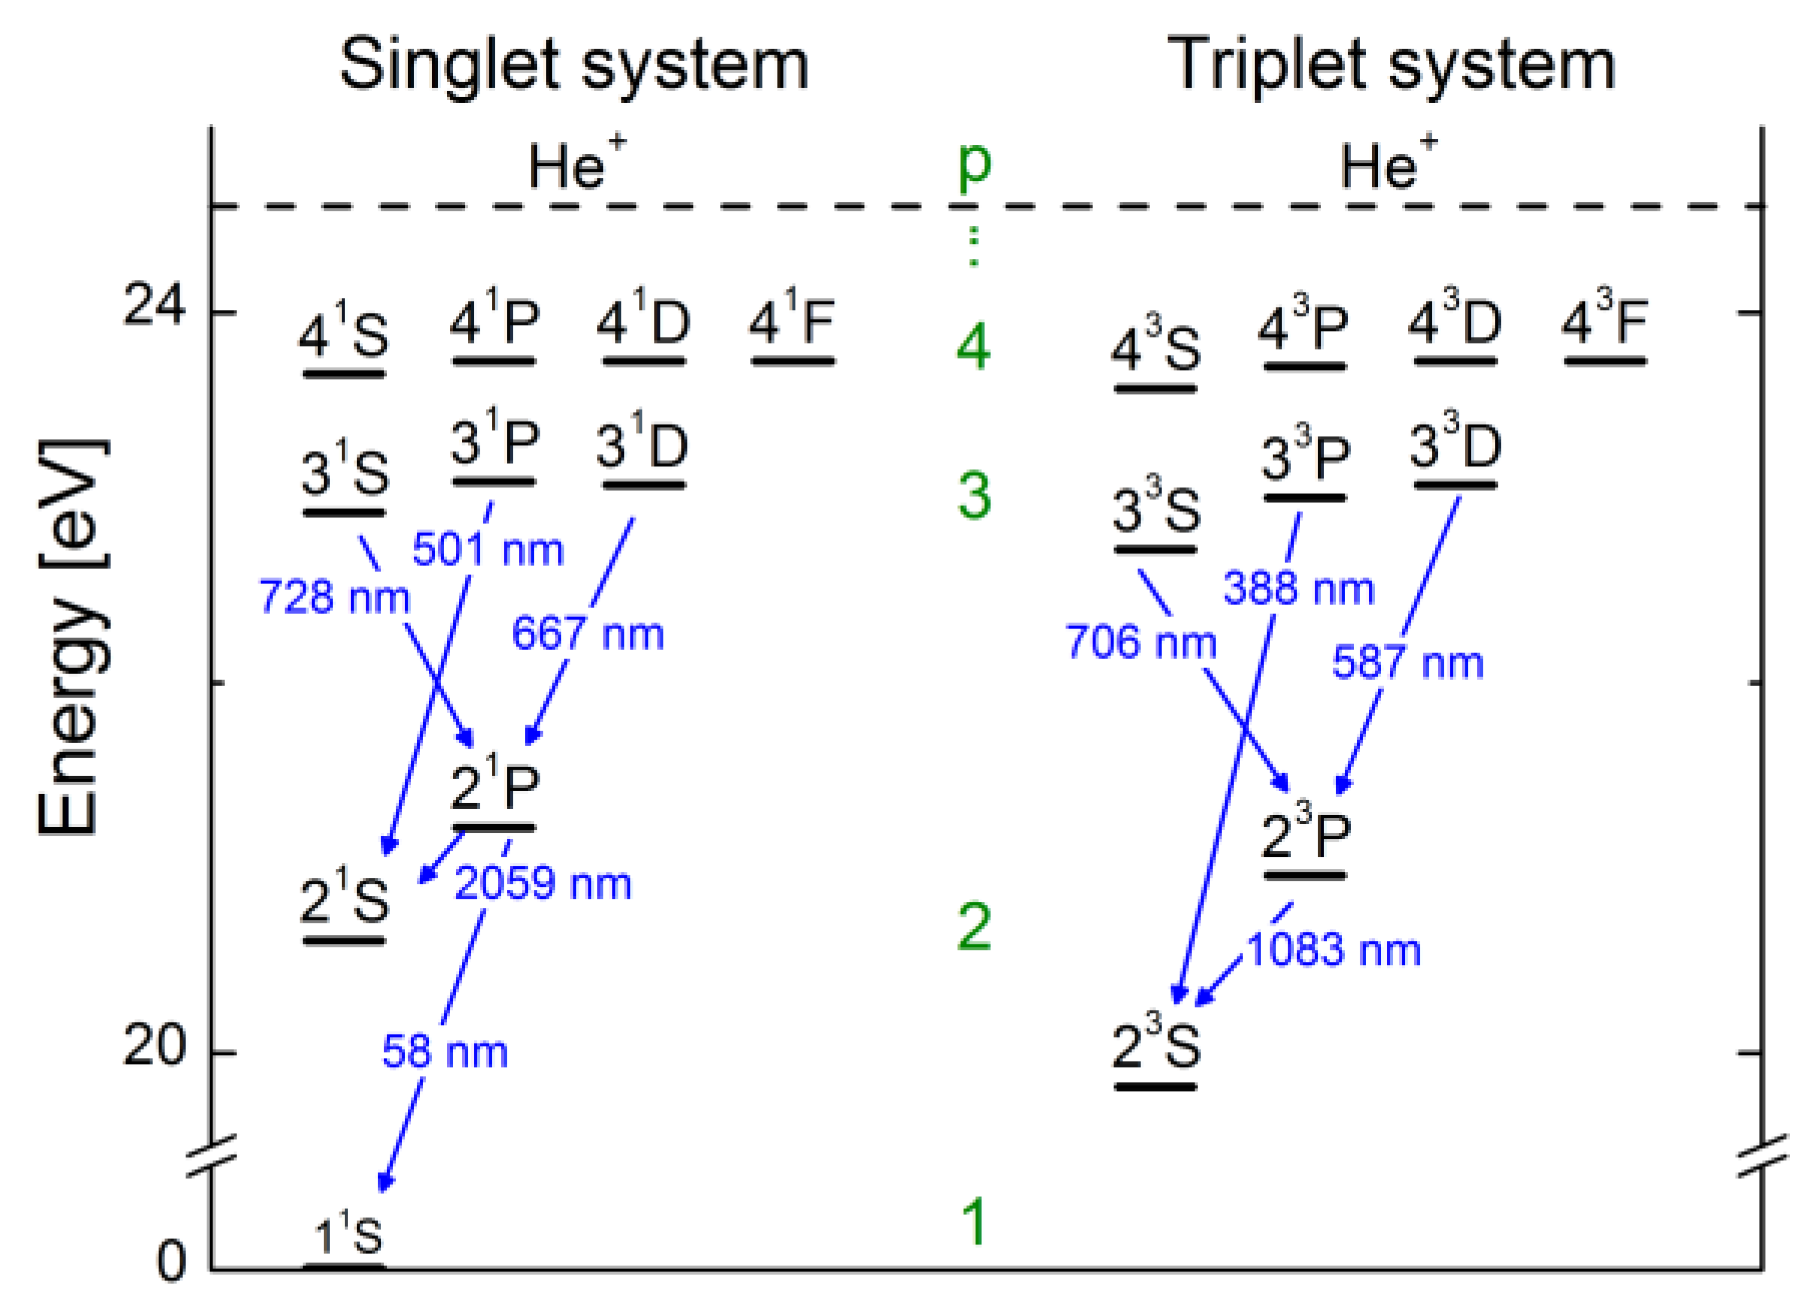
3.1. Helium

3.1.1. Properties of the Helium Atom

Figure 1 shows an energy-level diagram for the helium atom, including all states with principal quantum number p ≤ 4. The fine structure-splitting of the triplet states with angular momentum L of the electrons larger than zero is not shown. Helium is a two electron system. Due to the different possible orientations of the electron spins, the energy levels split up into a singlet system (antiparallel orientation, parahelium) and a triplet system (parallel configuration, orthohelium). All allowed dipole transitions originating from states with p ≤ 3 are indicated together with their wavelength.
Spontaneous emission from one of the multiplet systems to the other is forbidden. Together with the selection rule ΔL = ±1, this results in the presence of two metastable states: 21S in the singlet system and 23S in the triplet system. For high electron densities, the dominant depopulating process for these states is excitation and de-excitation by electron collisions. In plasmas with low ne transport of particles in the metastable states can take over. If population models for helium are applied to such plasmas, the relevant loss processes for the metastable states have to be included either self-consistently or by using fixed transport coefficients as input.
Depending on the ground state density, optical thickness can play an important role for the resonant emission lines. For high population densities of the metastable states (caused by a low probability for processes depopulating these states), optical thickness of the emission lines ending on 21S and 23S can also be of relevance.

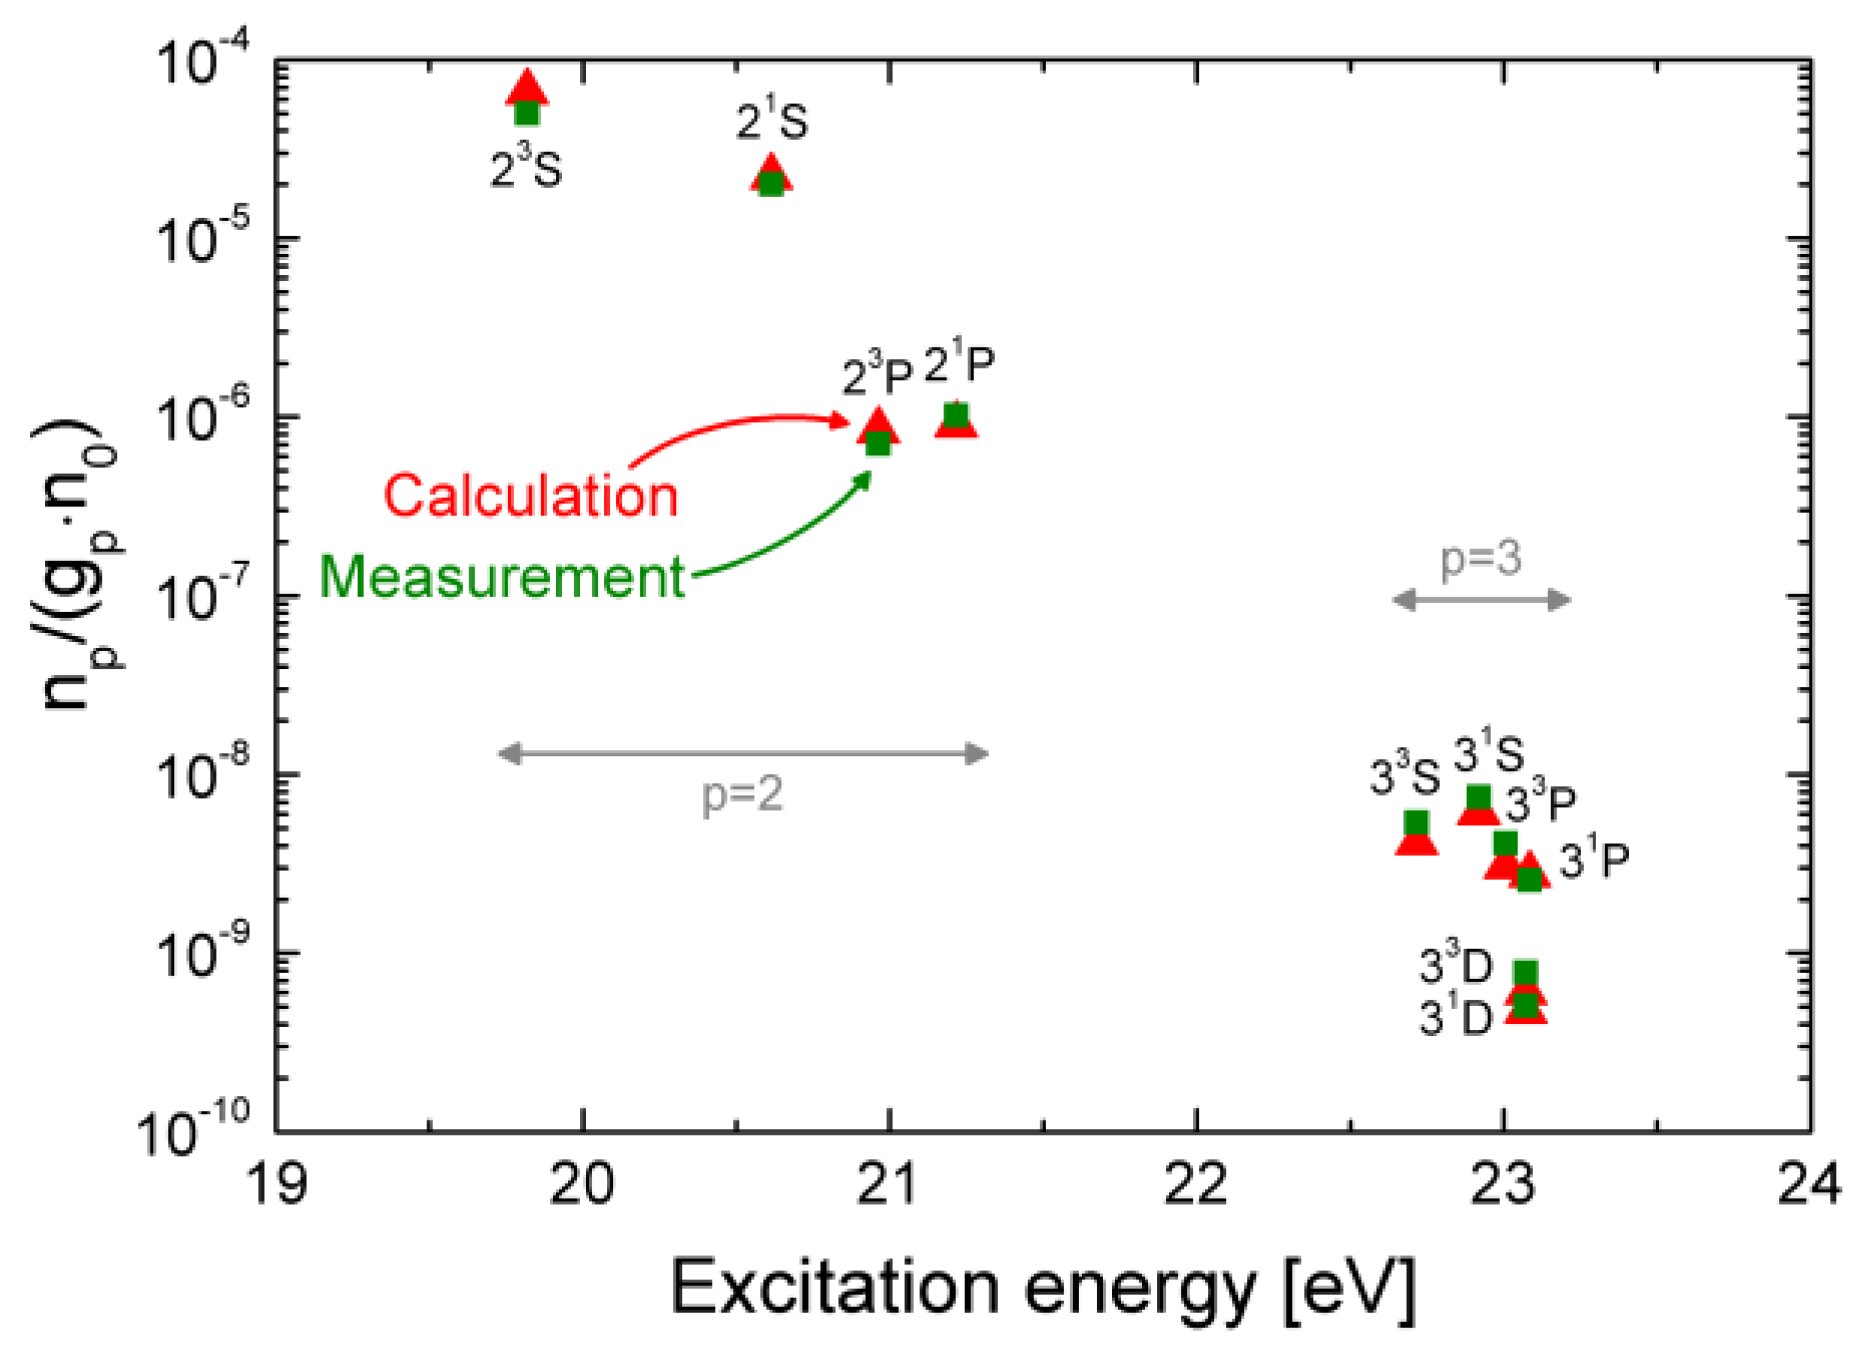
3.1.2. The CR Model for Helium and Results

The CR model for helium based on Yacora comprises all states with p ≤ 4 and the singly ionized positive ion.
The electron excitation cross-sections are taken from [10,11], and the probabilities for spontaneous emission from [12]. De-excitation cross-sections are calculated by the detailed balance principle [13]. Optical thickness of all resonant emission lines and lines ending at the two metastable states is included based on population escape factors calculated following [7]. The transport of the metastable states via diffusion is approximated by an effective lifetime valid for low-pressure plasmas, calculated from the diffusion constant for helium atoms in a helium background [14].
Figure 2 shows the model results for the excited states with p = 2 and p = 3 (divided by the statistical weight and normalized to the ground state density n0) together with line-of-sight averaged population densities measured for a pressure of 10 Pa by absorption spectroscopy (p = 2) and OES (p = 3) in a microwave electron cyclotron resonance (ECR) discharge (f = 2.45 GHz) in which the magnetic field is created by permanent magnets attached to one of the outer walls of the vacuum vessel (diameter d = 15 cm, height h = 56 cm). The plasma experiment is described in detail in [15]. For deducing the population densities of the excited states with p = 3, measured intensities of emission lines originating from these states have been divided by the respective Einstein coefficients.
The plasma parameters used as input for the model have been measured independently (Te = 3.8 eV from a Langmuir probe, ne = 7 × 10¹⁶ m−3 from microwave interferometry) and the calculations have been performed using a Maxwell EEDF. The agreement between model and measurement is excellent (deviations well below 35%), indicating a high accuracy of the experimental results (population densities and plasma parameters) but in particular also of the reaction probabilities used in the CR model.

3.2. Atomic Hydrogen

3.2.1. Properties of the Hydrogen Atom

The hydrogen atom, consisting of one proton and one electron, is the simplest existing atom. The excited states can split up into sublevels due to different possible orientations of the angular momentum and the spin of the electron. In absence of strong external (electric or magnetic) fields these sub-levels are degenerated.
Due to strong coupling processes with non-metastable states of the same principal quantum number, the metastable substate 2 s is not needed to be considered explicitly [2]. Thus, it is sufficient to resolve in population models for the hydrogen atom only the principal quantum number. Depending on the ground state density, self-absorption due to optical thickness can affect the population density of excited states. If optical thickness takes place in low-pressure plasmas, in most cases it affects the resonant Lyman emission lines only.
Different particle species with quasi-constant density play a role in populating the excited atomic states. The respective reaction channels are shown in Figure 3a. The probabilities for these reactions strongly depend on the plasma parameters and the densities of the involved particle species. In ionizing (typically Te > a few eV) plasmas direct excitation from the ground state H(1) and dissociative excitation from H2 take place predominately (Figure 3b). In recombining (typically Te ≤ 1 eV) plasmas, (dissociative) recombination of positive ions and mutual neutralization of negative ions, H and positive ions can dominate (Figure 3c). Models for so-called partially recombining plasmas have to include all six particle species and reaction channels shown in Figure 3.

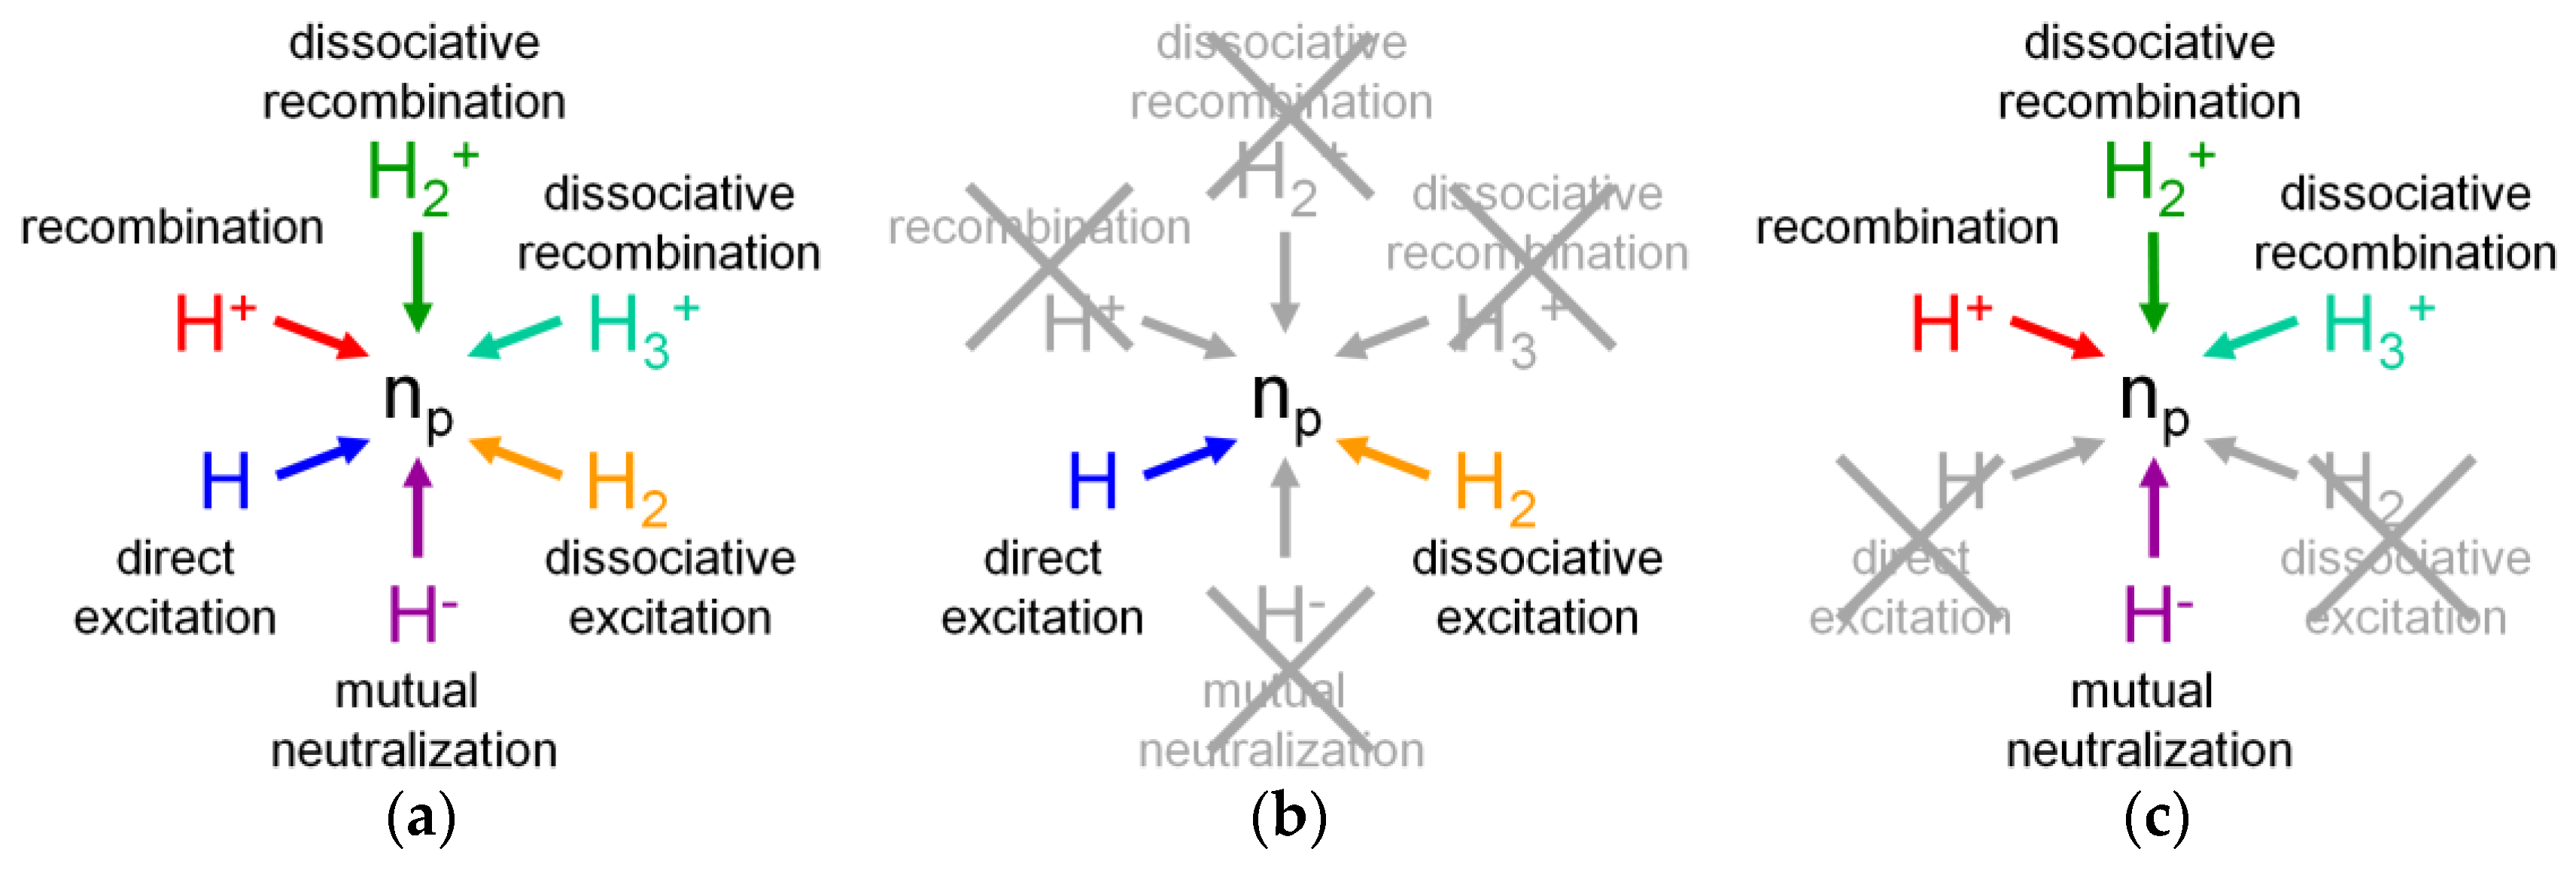
3.2.2. The CR Model for Atomic Hydrogen

The CR model for atomic hydrogen comprises all excited states with p ≤ 40, including the transition to the ionic continuum. This number is much higher than the number of states included to the model for helium (Section 3.1.2) and it is a prerequisite for performing calculations of population densities up to the principal quantum number p = 9, as described in Section 3.2.4. In order to reproduce the transition to the ionic continuum, the population density of the states with p ≥ 36 is deduced from the population of the positive ion by applying the Saha equation. The cross-sections for electron collision excitation are from [16,17]. De-excitation cross-sections are calculated by the detailed balance. Optical thickness of the resonant Lyman emission lines is included based on population escape factors calculated as described in [7].
Cross-sections for the coupling reactions shown in Figure 3 are taken from the following sources: direct excitation from H [16,17], recombination of H+ [18], dissociative excitation of H2 [18], dissociative recombination of H2+ [17], dissociative recombination of H3+ [19,20], mutual neutralization of H with positive ions [17,21].
As described in detail in [5] for collision energies close to the threshold, the electron collision cross-sections for direct excitation from [17] showed a discontinuous nonphysical behavior over the principal quantum number. A fitting procedure based on the rate coefficients from [22] was performed in order to smooth this discontinuity. The obtained modified set of reaction probabilities was successfully benchmarked [5] using the Yacora model for atomic hydrogen and Balmer line intensities measured in a uniform and stationary low-pressure, low-temperature ECR plasma experiment (f = 2.45 MHz) with a cylindrical vacuum vessel (d = 15 cm, h = 31 cm).
For dissociative recombination of H3+, two different reaction channels are possible: producing either three atoms in the ground state or one molecule in its ground state and an excited atom. While the total cross-section for this recombination process and the branching ratio for the two reaction channels are well known, mainly from storage ring experiments [20], not much is known about the quantum state distribution of the excited atom produced by the second reaction. It is stated in [19] that for low-collision energies, predominately atoms in p = 2 are produced. Thus, in the CR model for atomic hydrogen, p = 2 is implemented as the only product for dissociative recombination of H3+.
While all existing cross-section calculations and measurements show that mutual neutralization of H with the atomic positive ion H+ produces an atom in its ground state and a second atom in p = 2 or p = 3 (depending on the collision energy), disagreement exists regarding the reaction channels for mutual neutralization with H2+: while in [21] it is stated that this reaction ends in a hydrogen molecule in its ground state and an excited atom, according to [17] the reaction products are an atom in the ground state and an excited molecule. In order to enable investigations on this topic, both reaction channels have been implemented to the CR model. By changing the respective branching ratio, the relative relevance of the two channels can be varied.

3.2.3. Application of the CR Model for H to an Ionizing Plasma

The Yacora CR model for atomic hydrogen is applied to the ionizing plasma in the plasma generation region (d = 24.5 cm, h = 16 cm) of the radio frequency (RF)-driven negative hydrogen ion source prototype for the internuclear thermonuclear experimental reactor (ITER) neutral beam injection (NBI) [23,24]. The plasma is generated by inductive coupling (f = 1 MHz) and the typical pressure range is 0.3–0.6 Pa. As shown in Figure 3b, in fully ionizing plasmas only two reaction channels have to be taken into account, namely direct excitation from the ground state H and dissociative excitation of H2.
A frequently used method for determining the plasma parameters Te and ne in ionizing plasmas is to compare measured line ratios Hα/Hβ and Hβ/Hγ with results of an atomic CR model, as described in detail in [1,25]. If, additionally, the molecular emission is taken into account, also the ratio n(H)/n(H2) can be determined and additionally the uncertainty of the results can be reduced. The aim of the present work was to implement and benchmark an automated version of this technique, based on a fitting procedure.
Several plasma pulses have been performed with different values PRF of the RF power coupled into the plasma and of the filling pressure pfill. Measured are the Balmer lines Hα … Hδ and the Q lines of the first four diagonal vibrational bands (0→0 … 3→3) of the molecular transition d3→a3 (see Section 4.1). By assigning rotational temperatures to the vibrational bands of this band and appropriate scaling based on the CR model for H2 (see Section 4.2) the total emission of d3→a3 is deduced.
Figure 4a shows the smallest obtainable residual found by the fitting procedure for PRF = 70 kW, pfill = 0.8 Pa, and a broad range of Te and ne. The residual is defined as the absolute value of the logarithm of the deviation between calculated (based on a Maxwell EEDF) and measured emission, summed for Hα, Hβ, Hγ, Hδ, and d3→a3. The blue band depicts the parameter space with the smallest residuals. The band shows a horizontal structure and ne can be determined with an acceptable error bar to 1.25 ± 0.75 × 10¹⁸ m−3.
Due to the flat behavior of electron collision excitation cross-sections for temperatures well above the threshold it is, however, in principle not possible to determine Te with good accuracy. Thus, Te is taken from the absolute minimum of the residuals (12.1 eV).
Figure 4b shows (in green) the measured emission of the first four Balmer lines and the molecular band d3→a3 as well as (in red) the model result for Te = 12.1 eV and ne = 1.25 × 10¹⁸ m−3. The agreement between measurement and the model is excellent (the deviations are below 12%). Additionally shown are the fractions of the Balmer radiation that can be attributed to direct (“H”) and dissociative (“H2”) excitation.
These results demonstrate that it is possible to apply an automated fitting routine to the Balmer and Fulcher emission measured in ionizing plasmas. Even in this very simple case (only two relevant excitation channels), however, due to the ambiguity in determining Te, the result can have a high uncertainty.

3.2.4. Application of the CR Model for H to a Recombining Plasma

A second test case for the CR model for atomic hydrogen is a magnetized plasma expansion, described in detail in [26,27]. The plasma in this experiment is generated by a cascaded arc, leaves a nozzle and expands into a low-pressure surrounding (typically p ≈ 10 Pa) where it is confined by an axial magnetic field. An electron current driven between anode and cathode is present in the first few centimeters of the discharge. This current heats the plasma by means of ohmic heating. The current decreases with the distance from the nozzle and at a certain position (at z ≈ 20 cm) the ohmic heating becomes inefficient: a sudden drop in electron temperature (from ≈1.2 eV to ≈0.1 eV) and electron density (from ≈2 × 10¹⁹ m−3 to ≈1017 m−3) is observed. The drop of the plasma parameters is accompanied with a change of the plasma emission: for smaller distances from the nozzle the plasma is red (partially recombining plasma), for larger distances it is blue (fully recombining plasma).
Measurements taken at this magnetized plasma and the CR model for H have been used for the following two purposes: firstly, to check the assumption that excited atoms produced by dissociative recombination of H3+ are predominately in the state p = 2 (Section 3.2.2); secondly, to check the existence and relevance of the two different reaction channels for mutual neutralization of H with H2+ (production of either excited atoms or excited molecules) suggested by [17,21] (Section 3.2.2).
The electron temperature and density have been measured by a double Langmuir probe. Line-of-sight averaged densities of the atomic ground state have been determined [28] by TALIF, population densities of the state p = 2 by TDLAS, and the population densities of all other exited states by OES. Axially and radially resolved profiles for the population densities have been obtained by deconvoluting the results of the optical measurements by means of Abel inversion [29].
Based on the measured profiles of Te and ne, a fitting procedure was performed in order to adapt the measured excited state population densities to results of the CR model for H, calculated using a Maxwell EEDF. Variable parameters in this fit are the unknown particle densities (n(H2), n(H+), n(H2+), n(H3+), and n(H)), considering the plasma quasi-neutrality. An additional free parameter is the branching ratio of the two reaction channels for mutual neutralization of H with H3+. Since in recombining plasmas the amount of relevant excitation channels can be higher than in ionizing plasmas (as shown in Figure 3), the fitting procedure was performed manually.
Figure 5 shows (in green) the population densities of the first eight excited states of H (divided by their statistical weight) measured in the center and along the axis of the plasma expansion as well as (in red) the respective model results. Figure 5a shows the results for the partially recombining red plasma and Figure 5b shows the results for the blue fully recombining plasma. The agreement between measurement and the model is very good.
Additionally shown in both parts of Figure 5 are the fractions of the Balmer radiation than can be attributed to the different excitation channels. While in the partially recombining plasma, besides the recombining processes, direct excitation (and for p = 2 dissociative excitation) also plays a minor role, in the fully recombining plasma only (dissociative) recombination and mutual neutralization are of relevance.
This result allows provision of the following answers to the questions raised above: firstly, using the cross-section data implemented to the CR model and for the parameters of the magnetized plasma expansion, the assumption that excited atoms produced by dissociative recombination of H3+ are predominately in the state p = 2 is correct. Secondly, in the plasma under investigation both proposed reaction channels for mutual neutralization of H with H2+ take place. The branching ratio between the two channels was determined to be approximately 0.16:0.84 over the complete volume of the plasma expansion, i.e., 16% of such reactions create an excited atom and the other 84% an excited molecule.

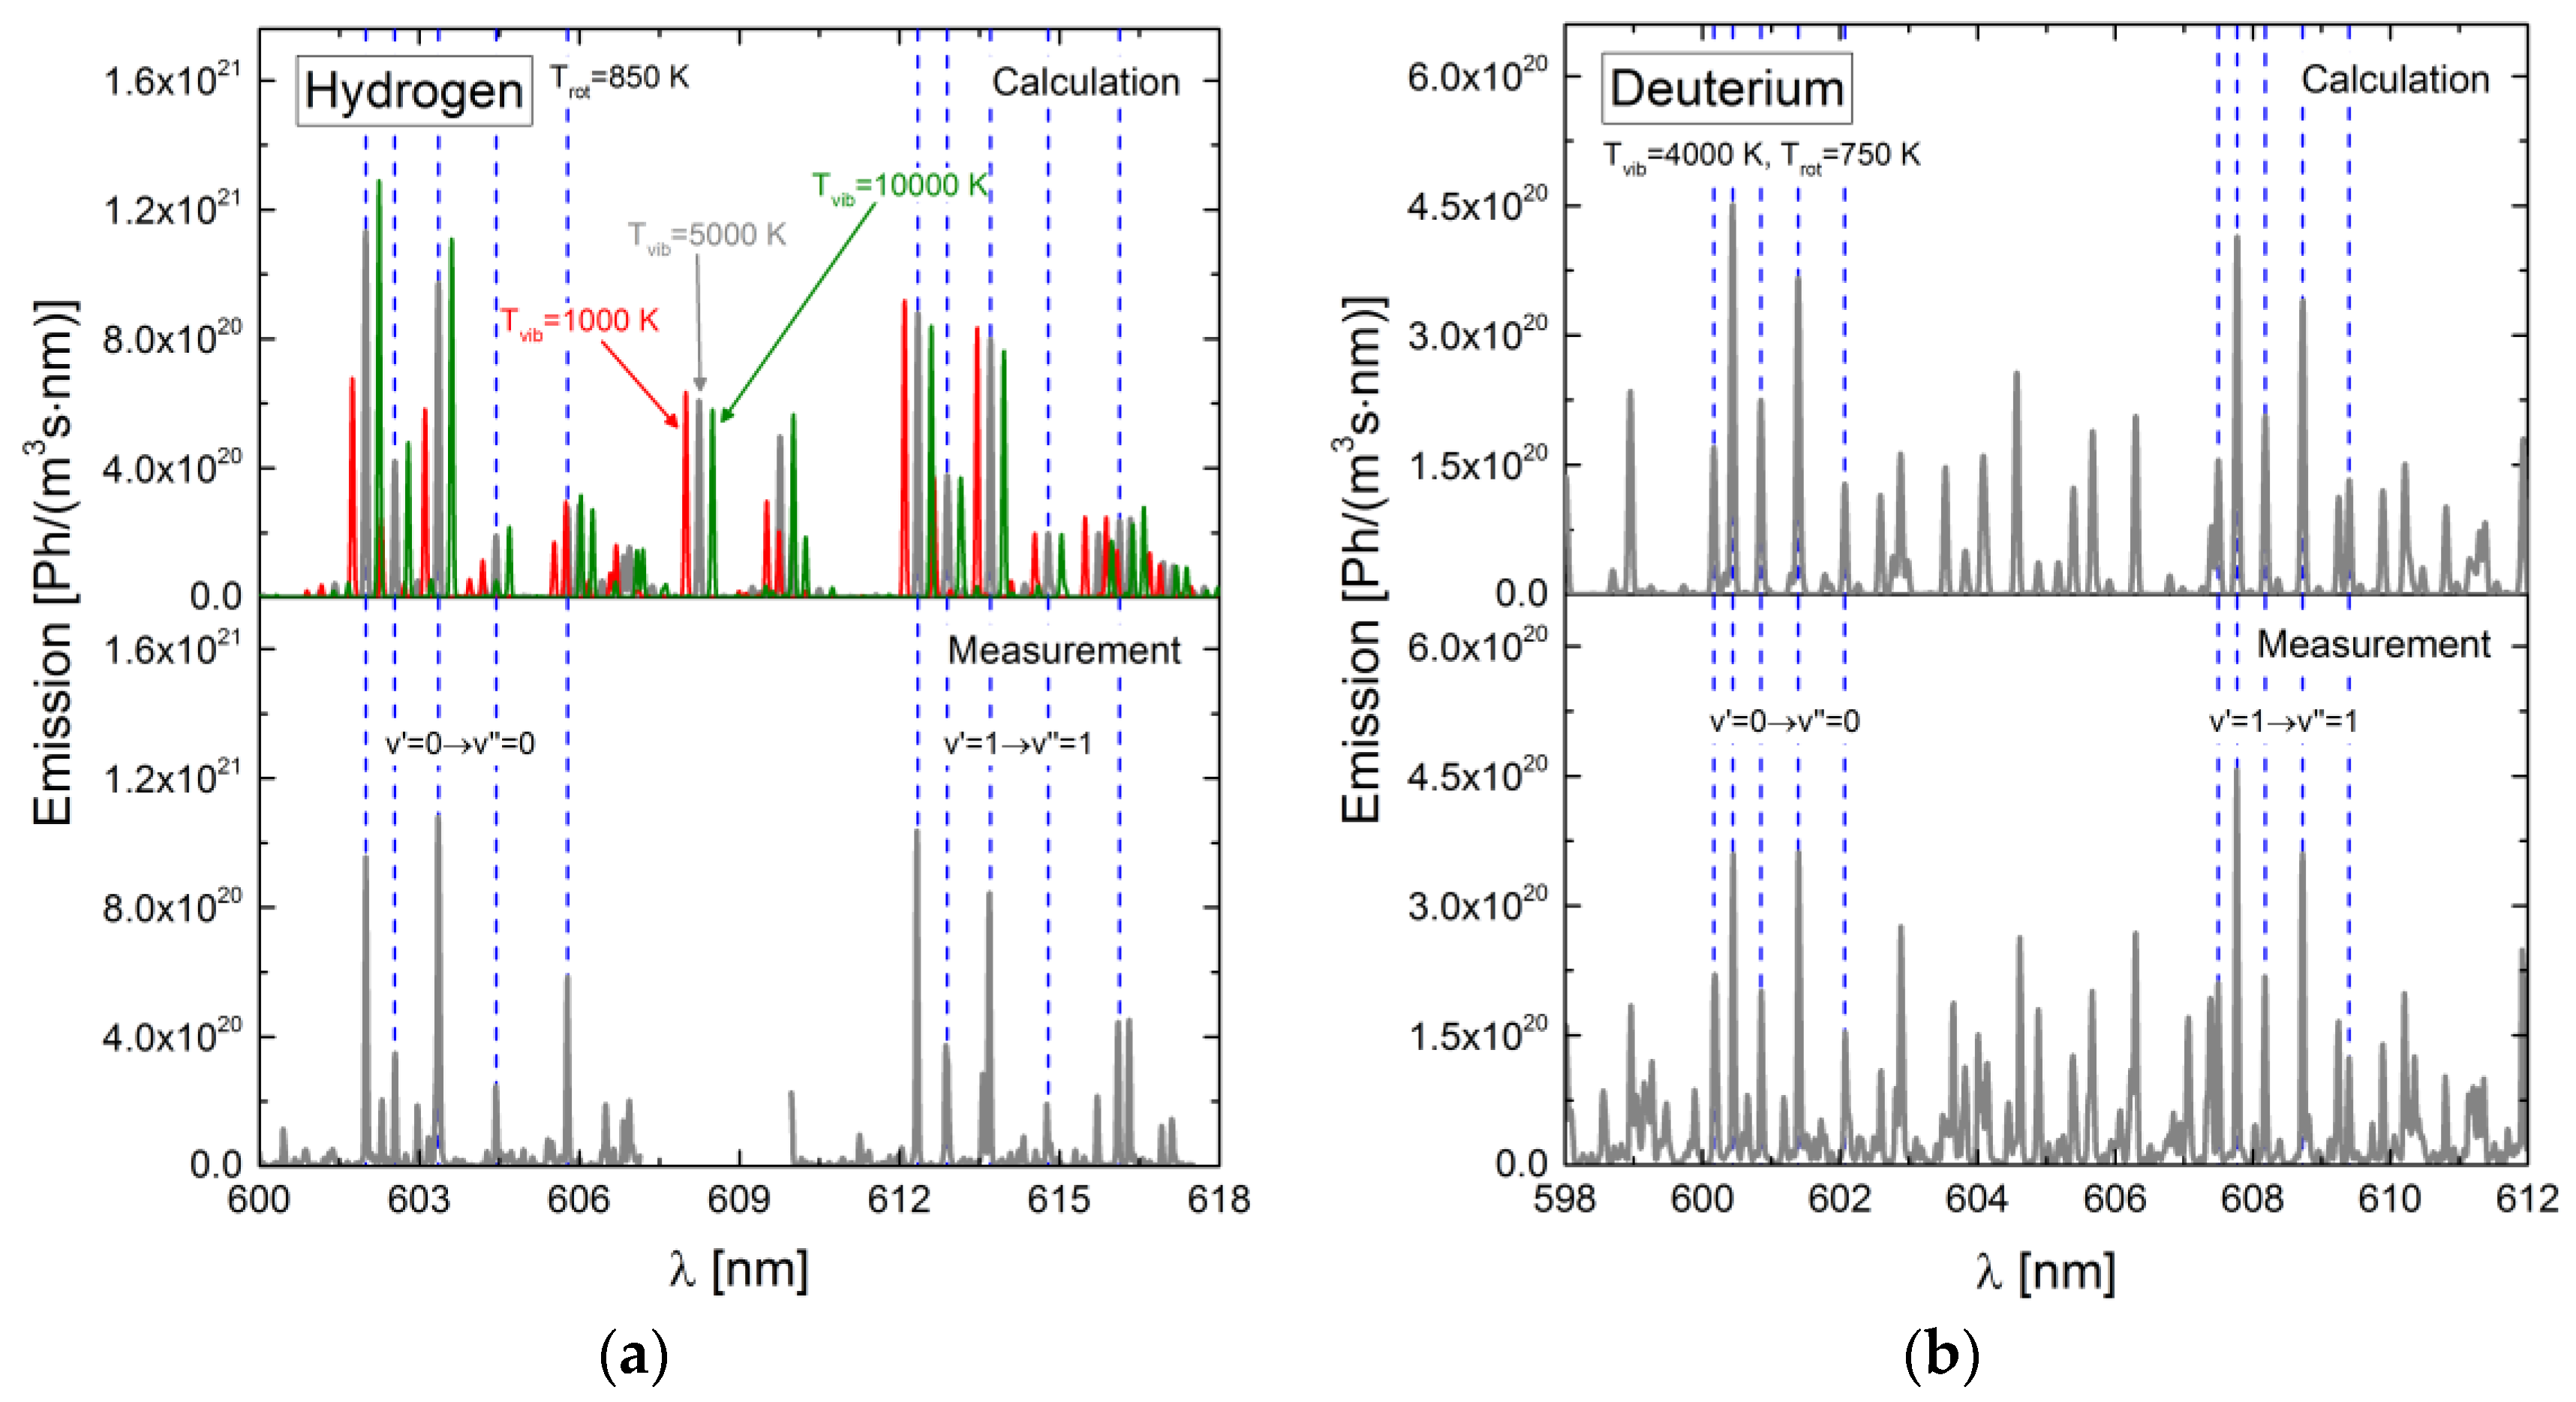
4. Population Models for Molecular Hydrogen and Deuterium

4.1. The Hydrogen Molecule

Shown in Figure 6 is an energy-level diagram for molecular hydrogen. Similar as in the case of atomic helium, a singlet and a triplet system exist; the reason is the quantization of the projection of the total electron angular momentum onto the axis connecting the two protons (the two cores of the molecule). The electronic energy levels are abbreviated by upper (singlet system) and lower case (triplet system) letters, followed by a digit indicating the multiplet system. The electronic ground state, for example, is X1.
Due to the different forms of movement of the two protons against each other, each electronic state consists of a set of vibrational (quantum number v) and rotational (quantum number J) sublevels. The vibrational levels of X1 are indicated in the figure. The rotational levels are not shown since the energy difference between two consecutive rotational levels is significantly smaller than the one between the vibrational levels.
Due to the presence of vibrational and rotational excitation, optical transitions between two electronic states in diatomic molecules consist of vibrational bands with a rotational substructure. The ro-vibrational bands of a transition between two electronic states can spread over a broad wavelength range (up to hundreds of nanometers). As a consequence of this ro-vibrational band structure, the relevance of self-absorption due to optical thickness is much lower than in atoms and it is often neglected in population models for molecules.
As a result of the higher mass the energetic distances between rotational and vibrational eigenvalues in deuterium are smaller than in hydrogen. This results in an increased number of rotational and vibrational levels and consequently also of reactions interconnecting these levels. Population models that do not neglect ro-vibrational excitation need to take this isotope effect into account, and for application in deuterium the development of specific models is necessary.
As result of the small energy difference between vibrational and rotational sublevels in the electronic ground state X1, even in in low-density, low-temperature plasmas the population of these states can (partially) thermalize [30]. Typically, the population of the lowest rotational levels can be described by a rotational temperature that is identical to the gas temperature [30]. For higher rotational quantum numbers, a significantly increased population can occur—caused most likely by surface recombination of H atoms to H2—resulting in a so-called hockey-stick structure of the rotational population distribution [31]. Typical vibrational temperatures are much higher than the rotational temperature [32]. The rotational and vibrational population distributions in X1 are correlated to the respective distributions in the electronically excited states by an excitation–deactivation balance [30].
Indicated by blue arrows are selected optically allowed transitions. These transitions are of high relevance for plasma diagnostics based on emission spectroscopy [30,32,33,34]. The wavelength given in the figure represents the most intense part of the bands.
The electronic states of a principal quantum number in both multiplet systems split up due to different angular momentum of the excited electron and symmetry of the electronic wave function. Additionally, two different modifications of the hydrogen molecule exist, caused by different orientation of the proton spins: orthohydrogen (parallel configuration) and parahydrogen (antiparallel configuration).
For the first exited state in the triplet system, b3, an energy interval is indicated because the potential energy curve (the electronic eigenvalues of the total wave function vs the internuclear distance) for this state is repulsive, i.e., it shows no minimum. The internuclear distance of a hydrogen molecule in b3 will increase until dissociation into two atoms takes place. Radiative transition into b3 does not result in a ro-vibrational emission band structure but in continuum radiation [35].
Depopulation of the vibrational level v = 0 in c3 in the triplet system by spontaneous emission can take place only via electric quadrupol or magnetic dipole radiation with very low transition probability, and the radiative lifetime is around 1 ms [17]. Other reactions will take over the role as relevant depopulation mechanisms. One of these reactions can be electron collision transfer into the state a3. These two states are energetically very close and depending on the involved vibrational and rotational sublevels, the cross-section for electron collision can reach high values (up to 10−16 m2 [17]). Secondly, quenching (de-excitation by heavy particle collisions) can be dominant for high molecular densities. Cross-sections of 7.5 × 10⁻¹⁶ m2 have been measured for gas temperatures of 300 K [36]. Implementing such processes as accurately as possible in population models for H2 is of high relevance since, as shown in [37], stepwise excitation via the c3 state can play an important role for populating energetically higher levels.
In case of a small distance between potential energy curves of two electronic states, even optically forbidden transitions from one state to the other one are possible. The probability for such reactions can be calculated by the perturbation theory (e.g., by techniques like the Landau–Zener method). If a bound state of H2 couples with the molecular ion or with the continuum of another bound state, such a transition will be equivalent to an ionizing reaction (autoionization) or dissociation (predissociation), respectively.
Additionally, for high vibrational and rotational quantum numbers the Born–Oppenheimer approximation may break down completely. As a consequence, the wave function of the molecule can no longer be split up into an electronic, a vibrational, and a rotational part that can be treated independently from each other.

4.2. Characteristics of the Models for H2 and D2

For the hydrogen molecule several models based on the Yacora solver are available. The first model is a CR model including all states of the singlet and triplet systems up to the principal quantum number p = 10. For the electronically excited states with p ≤ 3 the splitting due to the angular momentum of the electrons is considered.
Vibrational excitation of molecular states in low-temperature plasmas can drastically enhance the probabilities for processes like electron collision excitation or dissociation. The reason is the reduced energy threshold for these processes for molecules in excited vibrational levels. In order to reproduce these enhanced reaction probabilities, the ground state, all states in p = 2 and the states GK1, I1, e3, and d3 in p = 3 (the states indicated in red in Figure 6) are resolved for their vibrational levels. The population density of the vibrational levels in the ground state is treated as quasi-constant and thus Tvib is an input parameter for the CR model.
Nonvibrationally resolved cross-sections for electron collision excitation from the ground state to the excited states with p = 2 and p = 3 in both multiplet systems have been taken from [17] or [38]; the code can be switched from the data from the one reference to the other one. For excitation of states with higher principal quantum numbers, cross-sections from [18] are used. The excitation cross-sections were vibrationally resolved—where necessary—by applying the Gryzinski [39] method. For two excitation processes (X1→B1, X1→C1) vibrationally resolved cross-sections from [40,41] are available; these data are implemented instead of the cross-sections from [17] or [38]. The total cross-sections for the transition X1→C1 from [17,38,40,41] are compared in Figure 8a. The cross-sections from [40,41] have been used while generating the data from [17] also, and thus these two curves show small deviations only (with the exception of the region close to the threshold energy).
The Gryzinski method was used to calculate cross sections for electron collision processes between electronically excited states. Spin-exchange collisions between excited states are neglected. A comprehensive database for vibrationally resolved transition probabilities has been assembled [42] (see Section 4.3) and included in the model. Transition probabilities for the only electronically resolved states with p > 3 have been taken from [18].
Ro-vibrationally resolved CR models allow predicting the ro-vibrational structure of emission bands. The number of energy levels to be implemented in such models and the number of reactions interconnecting these levels is huge. Due to the lack of a consistent ro-vibrationally resolved set of reaction probabilities, instead of a CR model several ro-vibrationally resolved corona models for the transitions B1→X1 (Lyman band), C1→X1 (Werner band), and d3→a3 (Fulcher band) in H2 have been set up. Additionally, a ro-vibrationally resolved corona model for d3→a3 in D2 was constructed. Due to the quasi-constant character of the sublevels in the ground state Tvib and Trot of X1 are input parameters for the model.
As input for the ro-vibrationally resolved corona models, the vibrationally resolved cross-sections used in the CR model have been used. Again, the models can be switched between the data from [17] or [38]. The cross-sections have been scaled and split such that the cross-sections for excitation from v to v’ (i.e., summed over J and J’ in the corona model) used in both models are identical (the quantum numbers of the ro-vibrational levels in X1 are denominated by v and J, the ones in the electronically excited states by v’ and J’). In the corona model for constant v and v’ the identical cross-section is used for all combinations of rotational substates J and J’. As a result of this approach the rotational distribution in the ground state X1 is not mapped correctly to the rotational sublevels in the upper electronic state of the modeled transition. Thus, it is necessary to introduce an artificial thermalization process for the rotational sublevels, taking into account the rotational constants of the ground state and the upper electronic state.
A newly established set of ro-vibrationally resolved Einstein coefficients (see Section 4.3) is used in the corona model.

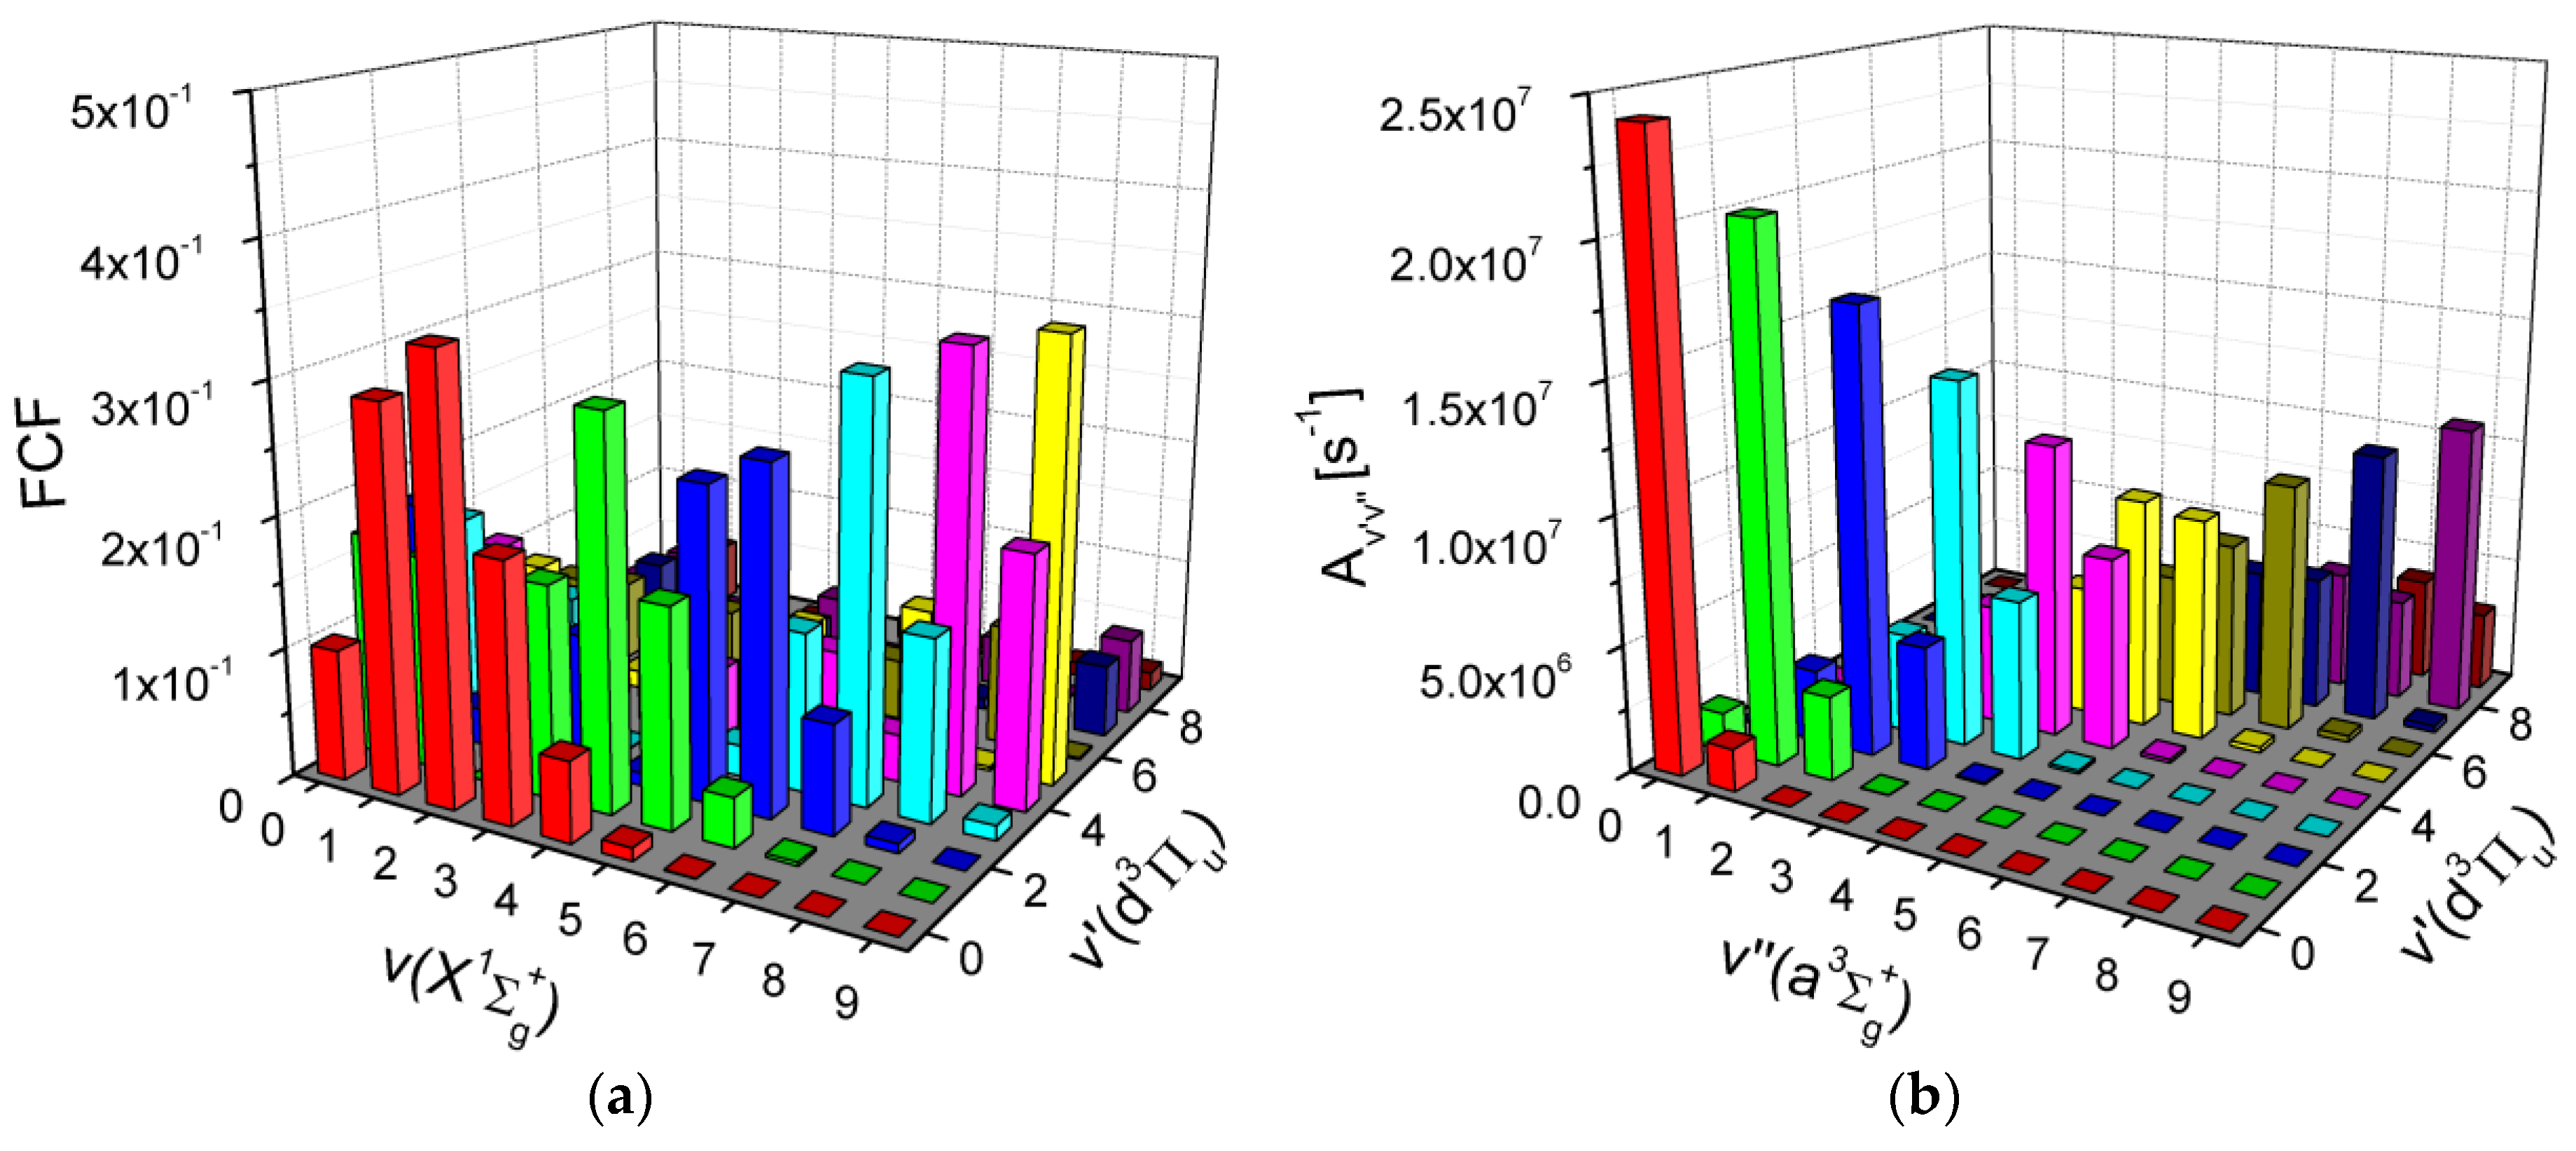
4.3. Franck–Condon Factors and Einstein Coefficients

Franck–Condon factors (FCF) are a measure of the overlap of two vibrational eigenfunctions in a molecule [43,44]. In the Franck–Condon approximation, the internuclear distance is considered to be fixed during an electronic transition. If the perturbing Hamiltonian of the transition does not depend on the internuclear distance, then according to Fermi’s golden rule the FCF quantify the transition probability from one vibrational eigenstate to another. FCF can be applied to determine, for example, how much the vibrational population of an electronic state contributes by electron collisional excitation to the vibrational population of another electronic state [32].
If the perturbing Hamiltonian depends on the internuclear distance, an operator describing the physical interaction between the initial and the final state of the system has to be additionally taken into account. For optically allowed spontaneous (dipole) transitions, this operator is equivalent to the dipole transition moment. Together with an appropriate prefactor, the transition probability (Einstein coefficient) of dipole transitions is equal to the overlap of two vibrational wave functions, convoluted with the dipole transition moment [45].
The described calculation technique for vibrationally resolved FCF and Einstein coefficients can be applied in principle also for obtaining ro-vibrationally resolved results. For calculating ro-vibrational transition probabilities, additionally the Hönl–London factors characterizing the distribution amongst the different rotational emission branches have to be considered [46].
Based on a set of potential energy curves for the hydrogen molecule taken from the literature (described in detail in [42]) vibrationally resolved FCF and Einstein coefficients have been calculated for all states up to the principal quantum number p = 4 in H2 and its isotopomeres (D2, T2, HD, DT) [42]. Additionally available are FCF for coupling of the neutral molecule H2 with its positive ion H2+ [47]. Both datasets are accessible online [48,49]. Recently, ro-vibrationally resolved Einstein coefficients for some selected emission bands (B1→X1, C1→X1 and d3→a3) in H2 (and d3→a3 in D2) have been calculated.
The vibrationally resolved FCF can be used as basis for efforts to extend the existing database of electron collision cross-sections (see Section 4.4 and Section 4.5). The Einstein coefficients are essential for constructing population models for the hydrogen molecule.
Shown in Figure 7 are—as an example—results for the excitation of d3 from the ground state X1 and de-excitation of d3 via spontaneous transition to a3. Figure 7a shows for v and v’ < 10 vibrationally resolved FCF for X1(v)→d3(v’). The highest values of the FCF do not follow the diagonal defined by v = v’. The reason is that the minima of the potential curves of X1 and d3 are located at different internuclear distances (0.74 Å for X1 compared to 1.1 Å for d3). As a consequence, the vibrational population in X1 and d3 differs and techniques like scaling with the FCF [32] have to be applied in order to deduce the vibrational population in d3 from the one in X1.
Since the shape of the potential curves of d3 and a3 is very similar, the Einstein coefficients for the emission band d3(v’)→a3(v’’) follow—as can be seen in Figure 7b for v’ and v’’ < 10—the diagonal defined by v’ = v’’. The diagonal transitions v’ = v’’ = 0 … 3, in the wavelength range 600–640 nm are the strongest parts of this system.

4.4. Electron Collision Excitation Cross-Sections

As described in Section 4.2, the electron collision excitation cross sections used in the CR model and the corona models have been taken from literature. Two different datasets with cross-sections for excitation from the ground state X1 to different electronically excited states exist: the one from [38] was created by semiempiric methods based on experimental information and phenomenological extensions of the Born approximation into the low-energy region. The data given in [17] represents a summary of recent measurements and calculations. Within the process of validating and benchmarking the models, a critical check of these cross-sections has been performed.
Figure 8a shows cross-sections for electron collision excitation from v = 0 in the ground state X1 to the excited state C1 (optically allowed transition), Figure 8b shows cross-sections for excitation of c3 (spin-exchange process). The difference in the type of excitation process results in a distinctively different shape of the cross-sections.
Besides the cross-sections from [17,38] shown in Figure 8a,b are theoretical and experimental data from other different literature sources ([40,41,50,51,52] for excitation of C1 and [50,53,54,55,56] for excitation of c3; some of these data have been used for compiling the cross-sections given in [17]). All these cross-sections—with the exception of the vibrationally resolved data from [40,41]—are resolved only for the electronic levels. To do this comparison, the vibrationally resolved cross-sections for excitation X1→C1 were summed over the vibrational levels v’ in C1.
Close to the threshold energy (Ethr = 12.3 eV) of the excitation X1→C1 the discrepancies between the cross-sections from the different data sources reach factors of larger than 10, for X1→c3 they reach a factor of about 5 at Ethr = 11.8 eV. Thus, also the uncertainty of plasma parameters determined using the current population models for H2 will be quite high for low Te (see Section 4.6).

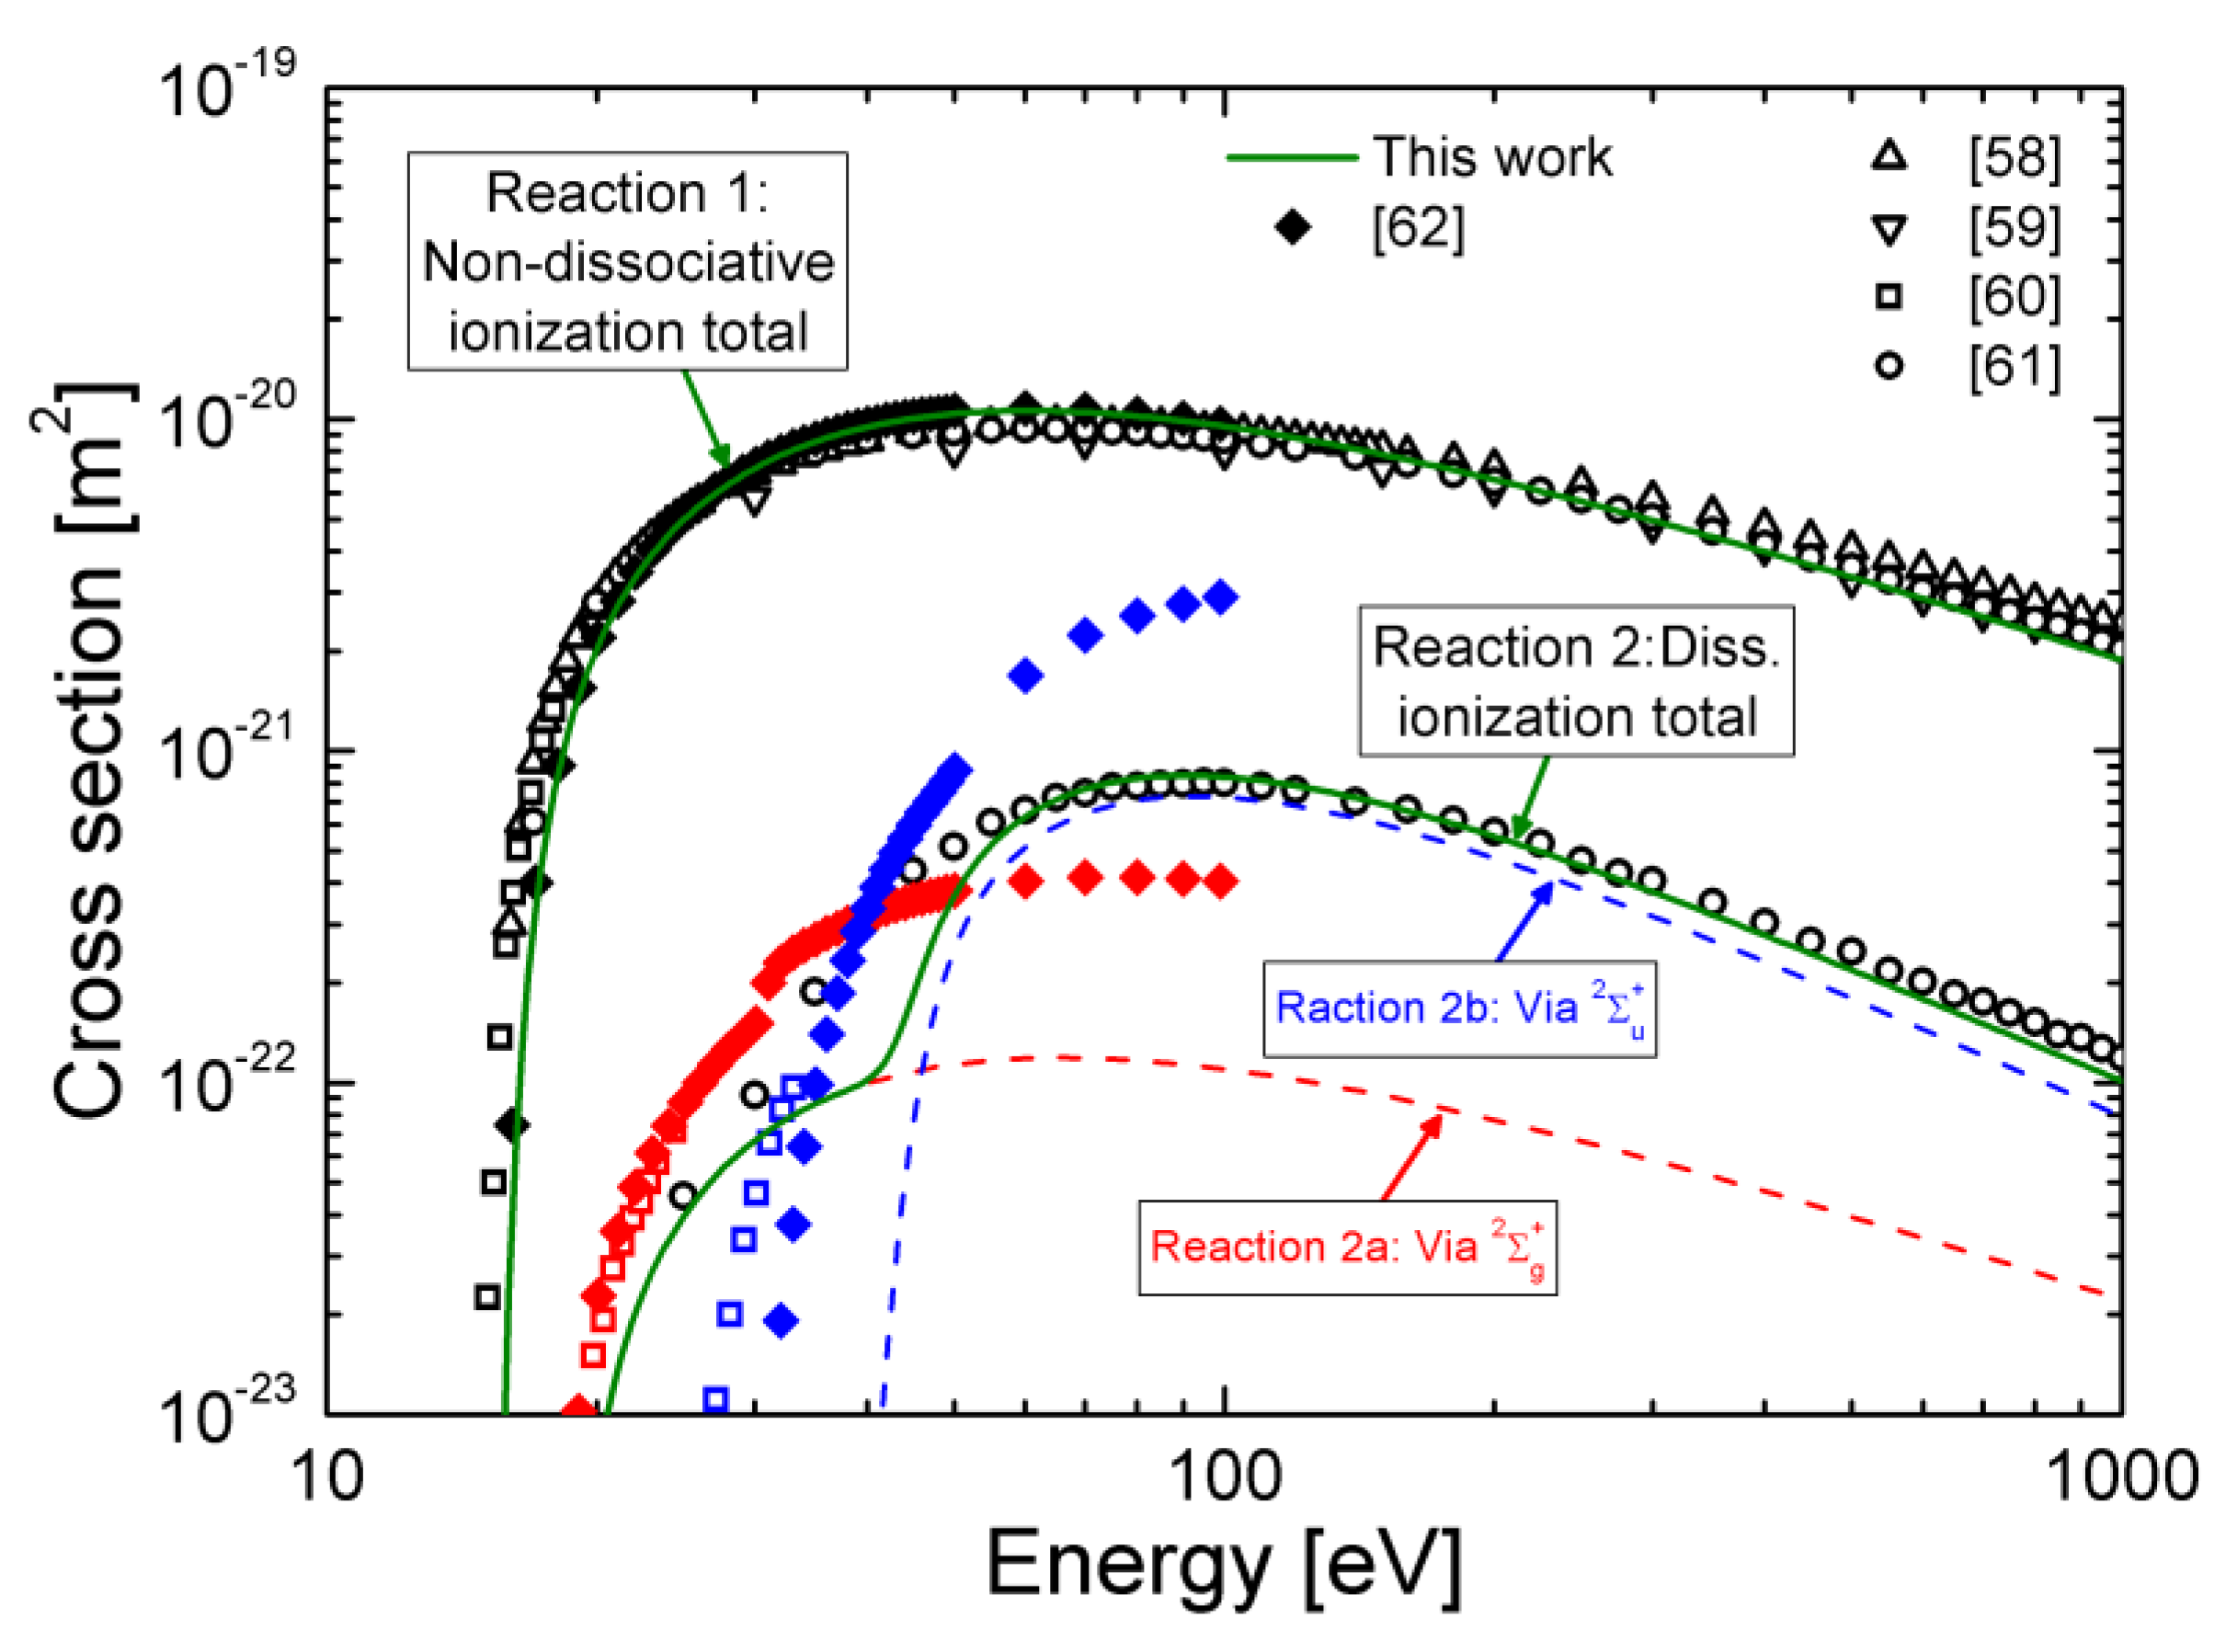
4.5. Electron Collision Ionization Cross-Sections

In order to fill one of the gaps in the available set of cross sections for H2, vibrationally resolved electron collision ionization cross-sections for the ground state X1 and the first five electronically excited states (EF1, B1, C1, a3, and c3) have been calculated using the Gryzinski method [39] together with the Franck–Condon theory.
The Gryzinski method is based on classical theory. For electron collision excitation—one electron gains a certain amount of energy and ends up in a specific excited state—the results of this method have large error bars [17]. Within the scope of the present work it was demonstrated, however, by comparison with experimental results from the literature for ionization of X1 (v = 0) that for ionization of H2—one electron is completely removed from the molecule—the Gryzinski method produces surprisingly accurate results [57].
Ionization of H2 can take place via two different reactions: non-dissociative ionization, ending in a molecular ion H2+, and dissociative ionization, producing an atom H in its ground state and a positive atomic ion H+:
H2 + e → H2+ + 2e
H2 + e → H + H+ + 2e
The dissociative process itself consists of two reaction channels: excitation from H2 into the vibrational continuum of the H2+ ground state 2Σg+ (reaction 2a) and excitation into the repulsive state 2Σu+ (reaction 2b). As a prerequisite for determining cross-sections for Reactions 1 and 2, the respective Franck–Condon densities have been calculated [57].
Figure 9 shows a comparison of the present cross sections for non-dissociative and dissociative ionization of X1 (v = 0) with cross-sections available in the literature. For non–dissociative ionization an excellent agreement was found between the present data and experimentally determined data [58,59,60,61] as well as theoretical [62] cross-sections.
While for dissociative ionization the agreement of the present data with the most reliable experimental results [60,61] is very good, deviations within a factor of 3.5 are observed when comparing with theoretical cross-sections from literature [62]. These deviations are caused by a simplified theoretical framework which was applied for the previous calculations. Within this framework one of the reaction channels was neglected and simple approximation for the Franck–Condon densities have been used. Thus, presently the new set of cross-sections represents the best available theoretical data for electron collision ionization of H2.
Fit parameters for the vibrationally resolved non-dissociative and dissociative ionization cross-sections for the ground state and the first five electronically excited states are available online [63]. These data represent an important step toward a comprehensive set of vibrationally resolved cross-sections for the hydrogen molecule, and they are used as input in the present CR and corona models for H2.

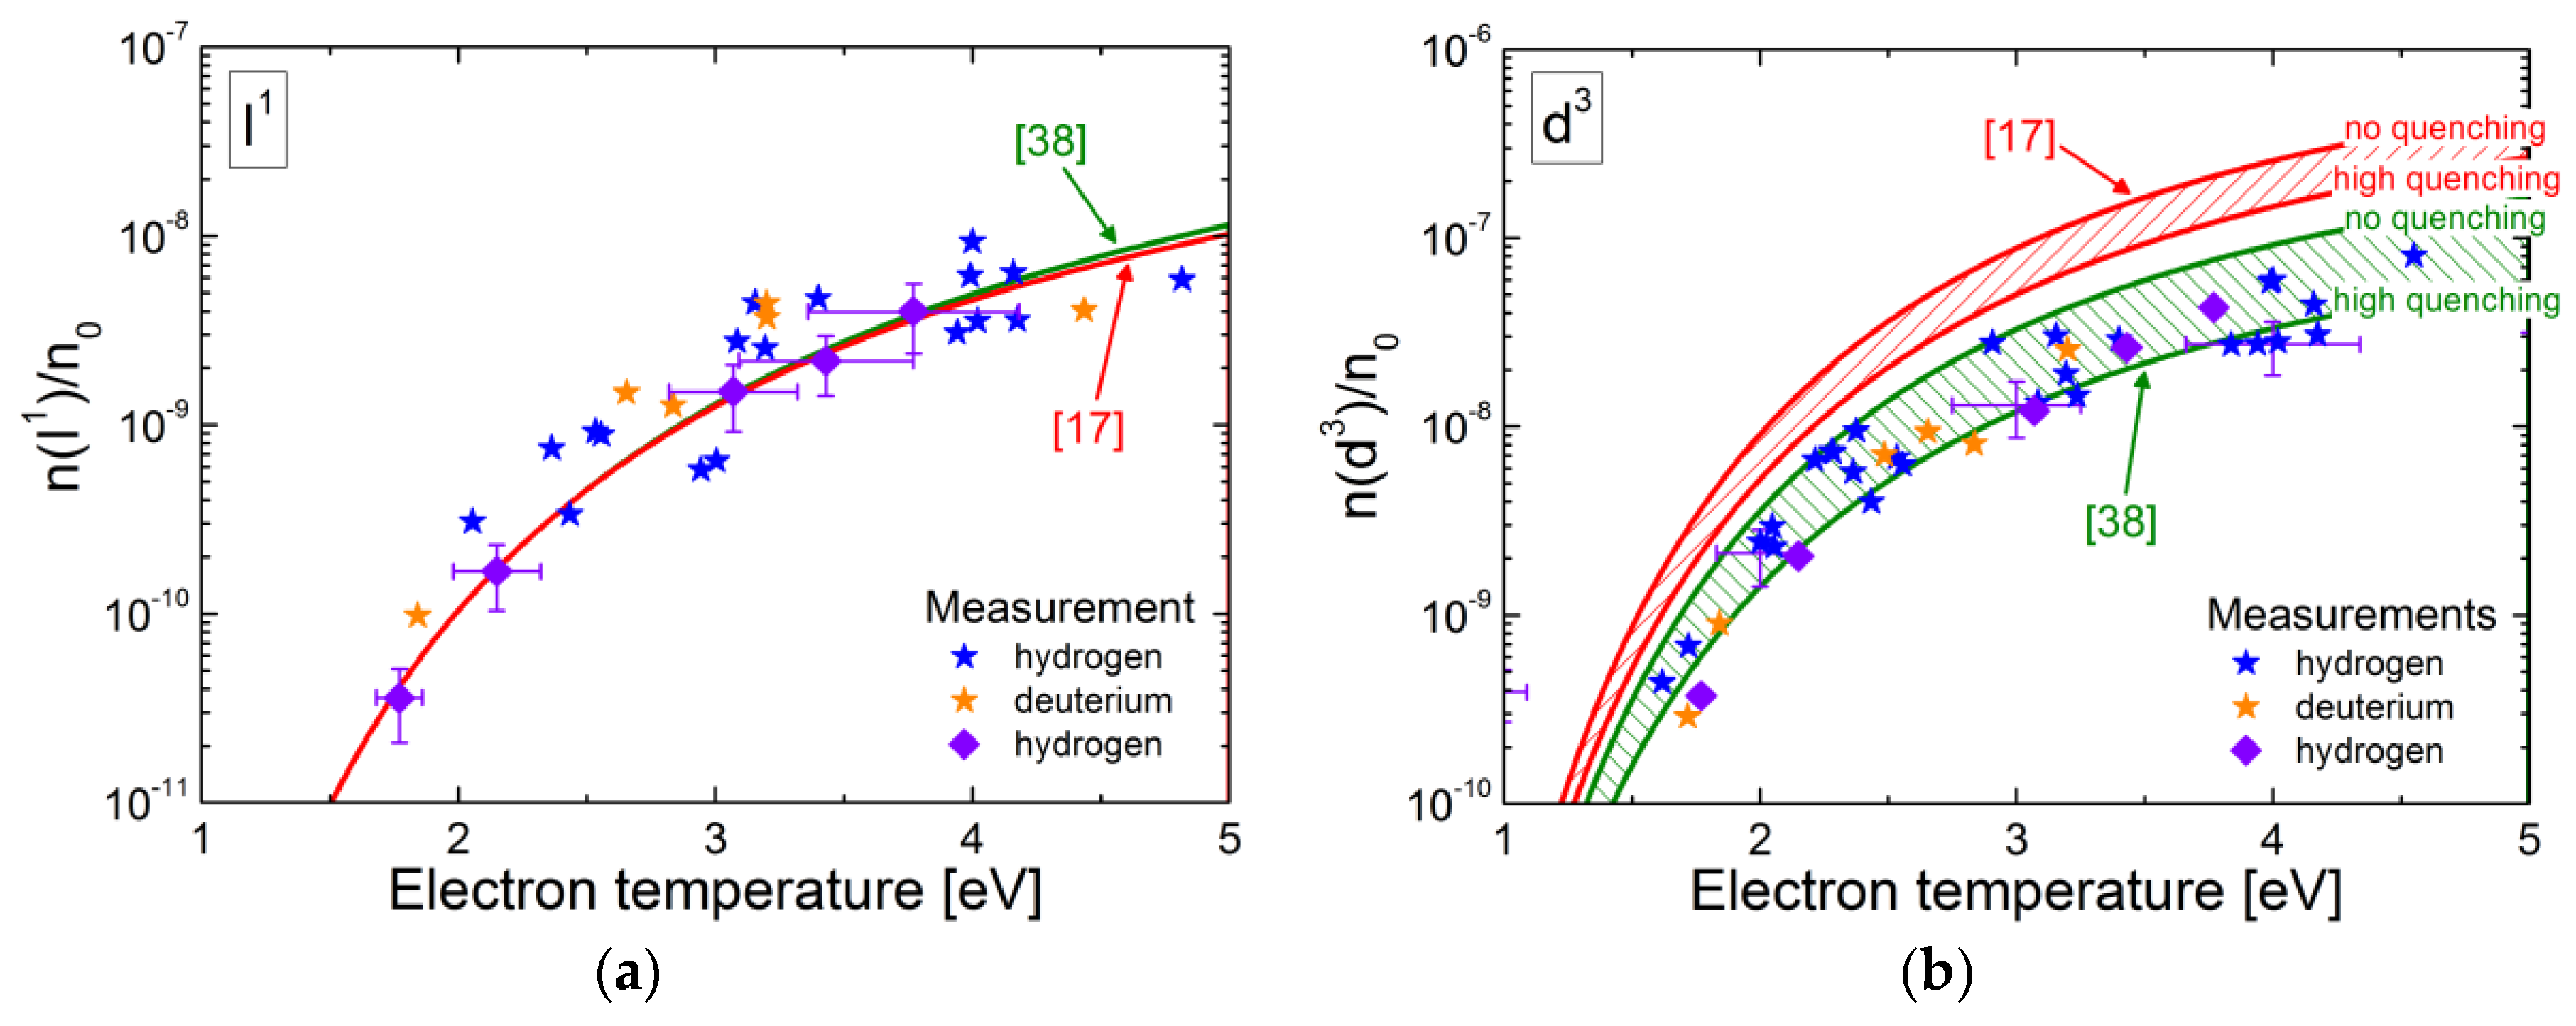
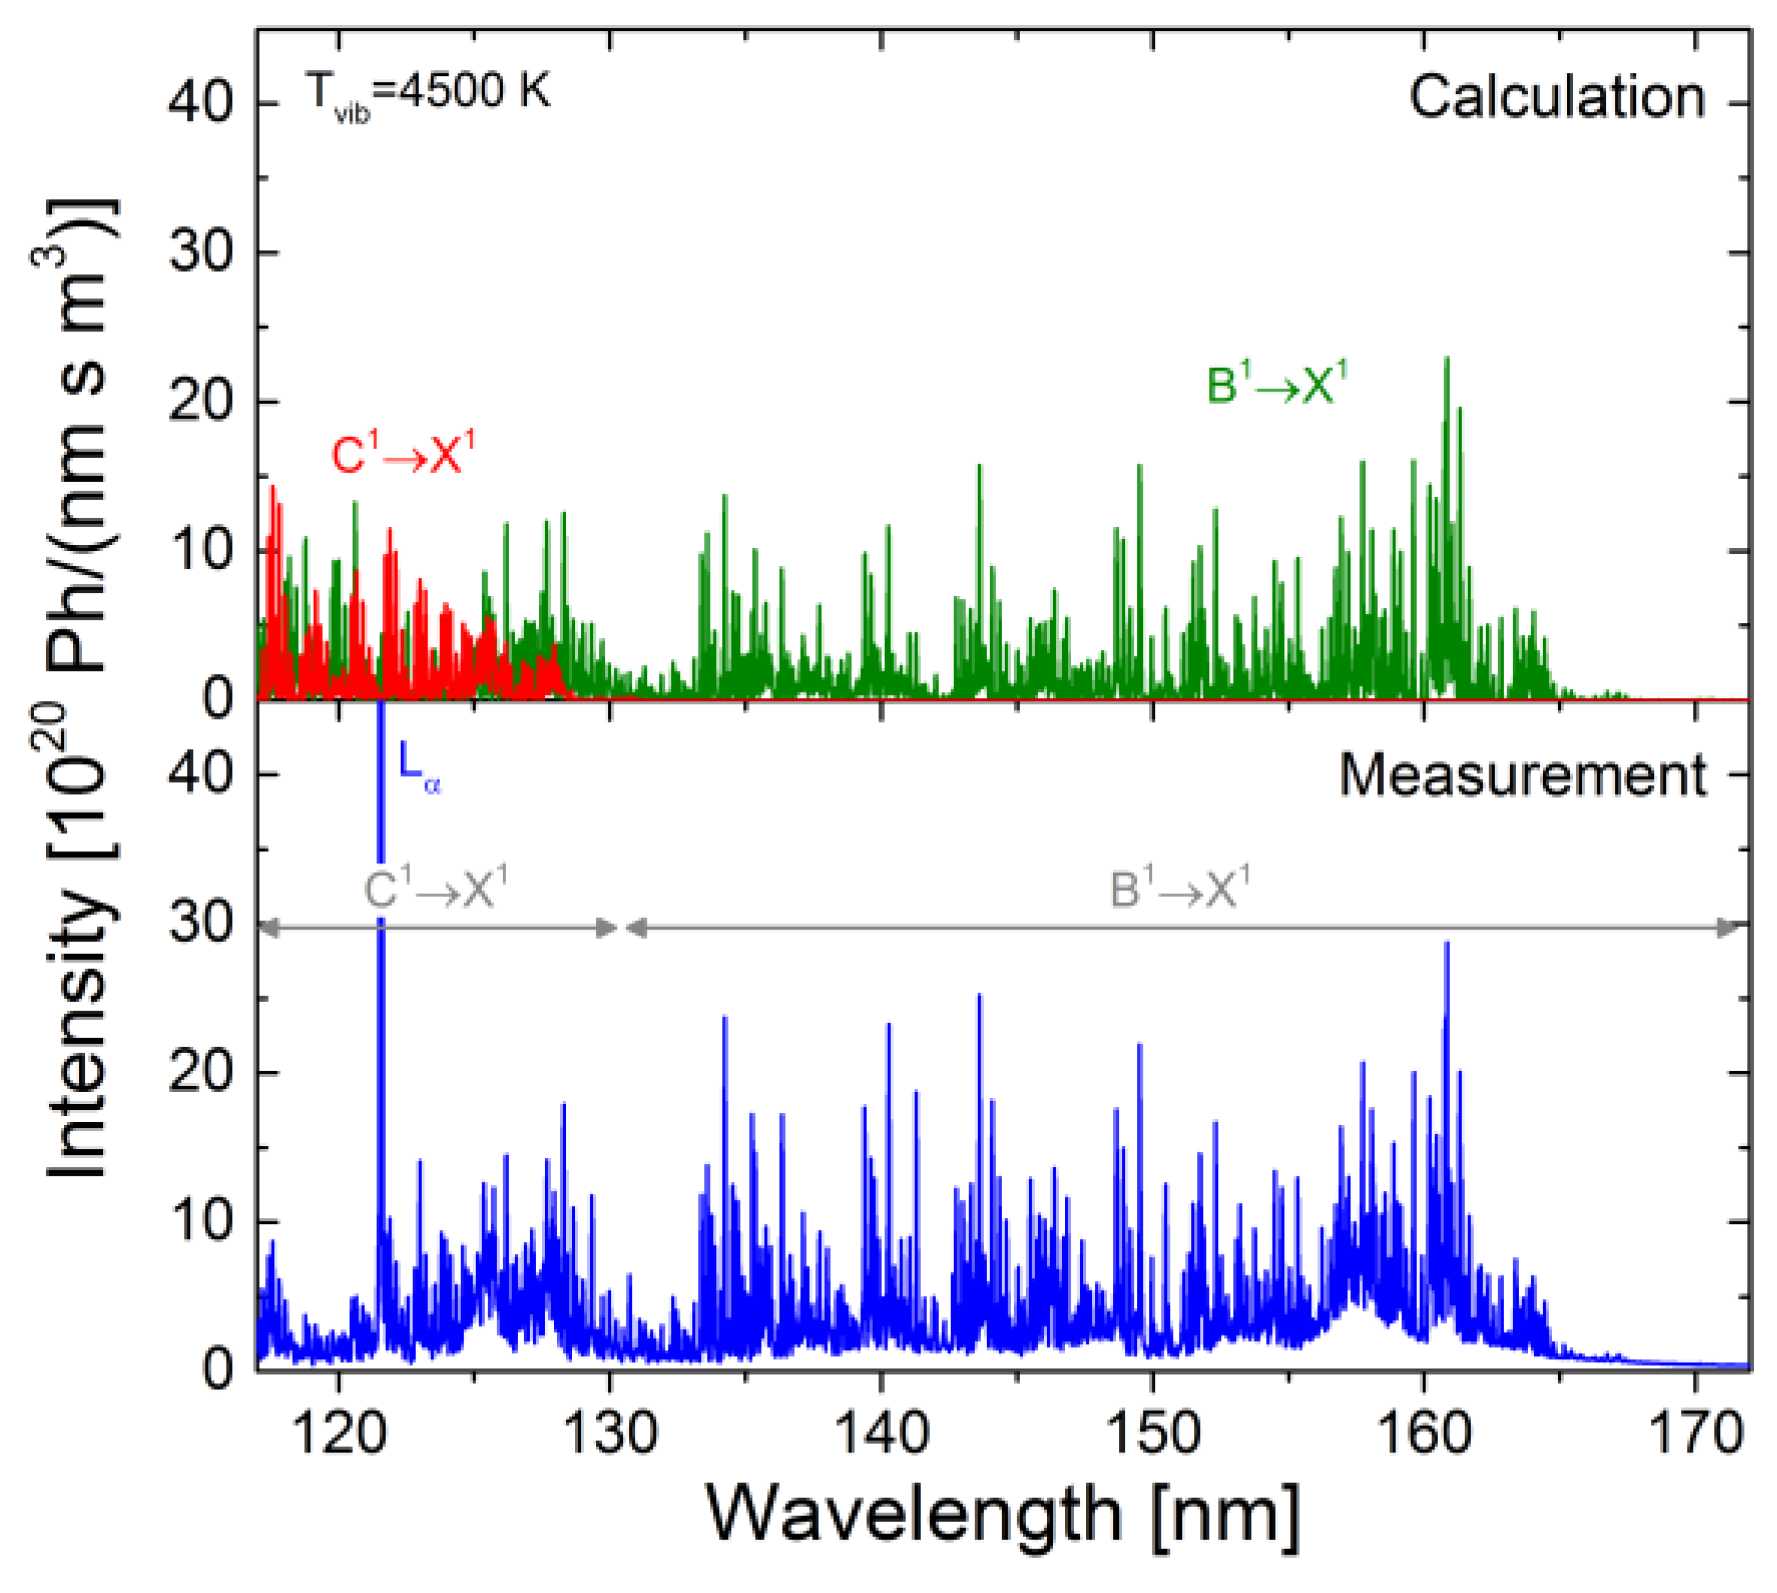
4.6. Application of the Models

In order to enable a critical check of the sensitivity of model results for H2 on the input data, measurements have been performed at two different low-pressure, low-temperature laboratory experiments: first, the emissivity of the molecular bands GK1→B1, I1→B1, e3→a3, and d3→a3 (see Figure 6) have been measured at the uniform ECR plasma experiment described in Section 3.2.2 both in hydrogen and deuterium. And second, the emission of all emission bands indicated by the blue arrows in Figure 6 has been determined for a hydrogen plasma in the microwave experiment described in Section 3.1.2.
From the band emission the population densities of the respective upper electronically excited states have been determined (summed over the ro-vibrational substates) by dividing with the appropriate Einstein coefficients. Figure 10 shows for both plasma devices the population densities, normalized to the ground state densities, of the states I1 (i.e., an optically allowed excitation mechanism) and d3 (spin-exchange excitation) vs the electron temperature. Additionally shown in Figure 10 (in green and red lines) are the CR model results (summed over the vibrational substates) based on the input data sets by [17,38]. Te used as input for the calculations was determined by evaluating the Balmer line emission, as described in Section 3.2.3, and ne (≈1017 m−3) by means of microwave interferometry and double probe measurements. Different values of the electron temperature were achieved by varying the pressure. The ground state density was deduced from the ideal gas law, taking into account in an iterative way the dissociation of H2 into hydrogen atoms.
The calculations for d3 were performed for different probabilities for quenching of the c3 state: no quenching and the quenching cross-section taken from [36]. Thus, for the calculated population density of d3, shaded areas are shown. This strong influence of the quenching probability (more than a factor of 2) demonstrates the high relevance of stepwise excitation via the c3 state for the population of the triplet states in H2.
Symbolized by the blue and orange stars are the measurements results for hydrogen and deuterium plasmas, respectively, from the first plasma device; the diamonds depict the results from the second experiment.
The discrepancies between the different sets of input cross-sections are directly reflected in the model results: while the two calculations for I1 are more or less on top of each other, the results for d3 based on the data from [17] are higher by a factor of 3–4 than the results calculated using the data from [38]. This strong correlation of model results to input data is valid for all investigated emission bands.
Regarding the investigated excited states in the singlet system (B1, C1, GK1 and I1), no clear statement can be made which of the two cross-section sets describes the measurement best. In the triplet system (a3, b3, d3), however, generally the data from [38] seems to yield better results—as can be seen exemplarily for the state d3 in Figure 10b. This result is quite surprising since the cross-sections from [17] are a summary of measurements and calculations that are based on much more sophisticated techniques than the data from [38]. Either processes relevant for the population densities of triplet states missing in the current status of the CR model or discrepancies in the underlying cross-sections result in high error bars of the data suggested in [17]. In order to check the second explanation—and since most available cross-sections are not vibrationally or rotationally resolved—calculations aiming at a comprehensive electron collision excitation cross-section database for both multiplet systems are highly desirable.
The lines of the diagonal part (v’ = v’’) of d3→a3 in the visible wavelength range (600–640 nm) can easily be distinguished from each other and the overlap with lines originating from other emission bands is negligible. Thus, this emission band is frequently used for plasma diagnostics [32,64,65,66]. Figure 11a,b show spectra of this band for v’ = v’’ = 0 and v’ = v’’ = 1 in hydrogen (between 600 nm and 618 nm) and deuterium (between 598 nm and 612 nm), respectively. The spectra in the upper part of the figures have been calculated using the ro-vibrationally resolved corona models (Te = 10 eV, ne = 1018 m−3) whereas the ones in the lower part are measurements (taken in the plasma generation region of the negative ion source prototype for ITER NBI, PRF = 70 kW and pfill = 0.6 Pa). The calculations have been performed using the excitation cross-sections from [38] since these data, as discussed above, yield better results for the triplet states. The theoretical position of the most intense emission lines (the lines of the Q branch) is symbolized in Figure 11 by the blue stripes.
The values for Te, ne, the vibrational temperature Tvib, and the rotational temperature Trot used as input for the model are taken from the experiment. For H2, besides the nominal Tvib = 5000 K, calculations for 1000 K and 10,000 K were performed in order to demonstrate the sensitivity of the band structure on Tvib. The resulting spectra are shown in red and green in the upper part of Figure 11a (in order to increase the visibility of these spectra, the wavelength axes have been shifted slightly toward smaller and larger values, respectively).
The model reproduces well the differences between the band structure in hydrogen and deuterium. The agreement in the absolute emission and the ro-vibrational structure between the model results and the measurement is good. However, some deviations are observed (for example in the relative emission of the Q lines of the v’ = 0→v’’ = 0 band). These deviations cannot be abolished by slightly adjusting Tvib or Trot. This result can be explained on the one hand by the fact that the model does not calculate the rotational population distribution in d3 self-consistently (due to the lack of ro-vibrationally excitation cross-sections, an artificial thermalization process was introduced, see Section 4.2). On the other hand, corona models do not take into account stepwise excitation (e.g., via the c3 state) and population via cascades from energetically higher states. For the future it is planned to construct an extended corona model including such processes.
In contrast to the easily distinguishable lines of the diagonal part of the d3→a3 band, the lines in each of the two emission bands B1→X1 and C1→X1 are much closer together and—depending on the apparatus profile of the used spectroscopic system—a significant overlap of lines can occur. Additionally, as can be seen in Figure 12, the two bands themselves overlap. The figure shows for the wavelength range between 110 nm and 175 nm in the upper part a spectrum calculated using the corona models for B1→X1 and C1→X1 (the radiation emitted by the two bands is shown in green and red, respectively) and in the lower part a spectrum measured for a pressure of 3 Pa (inductively coupled plasma (ICP) discharge, f = 13.56 MHz, d = 10 cm, h = 40 cm). While the measured spectrum comprises also the Lyman line Lα, this line was omitted by purpose in the calculation. In the model the cross-sections for excitation from the ground state by [40,41] have been used. Te and ne used as input for the calculations (Te = 2.7 eV, ne = 1.3 × 10¹⁷ m−3) have been determined by evaluating the Balmer line emission, as described in Section 3.2.3.
The agreement between the calculated spectrum and the measurement is good. Compared to the intensity of the band head of B1→X1 (at 160 nm) the modeled spectrum, however, shows a smaller number of photons emitted in the wavelength range between 135 nm and 155 nm. This smaller number of photons is most probably due to cascading processes (e.g., EF1→B1) that will be implemented to extended corona models for B1 and C1 in a next step.
Due to the described overlapping, usually the total photon emission of these bands is—in contrast to the d3→a3 band—not determined by scaling the emission of a few measured lines. Instead, it is possible to fit a simulated spectrum (free parameters: Te, ne, ground state density, Tvib, and Trot) to the measured one. A similar procedure is described in [67] for the emission band C3→B3 of molecular nitrogen. However, identifying proper values for all free parameters during performing such a fitting procedure can be quite elaborate.
Presented here is a different method that is described already in [6]: for each emission band a wavelength interval is defined (indicated in Figure 12 by grey arrows): 130–190 nm for B1→X1 and 117–130 nm for C1→X1). The integrated radiation in these intervals can be scaled to the total band emission by multiplication with a scaling factor. The following scaling factors have been derived from the simulated of the molecular bands for the parameters of the used ICP discharge: 2.0 for B1→X1 and 2.9 for C1→X1.
In order to investigate the dependence of the scaling factors on the plasma parameters, calculations for two different values of Tvib have been performed: with decreasing Tvib from 4500 K to 3000 K the relative changes in the scaling factors are below 6%. This indicates that a rough knowledge of the plasma parameters is sufficient for determining the scaling factors with sufficient accuracy. Preparing a set of scaling factors for the typical range of plasma parameters in a specific plasma discharge and scaling to the full band emission using these factors can significantly speed up the evaluation process compared to the fitting procedure mentioned above.

5. Conclusions

Population models for atomic helium and atomic hydrogen have reached a status in which population densities (or line emission) predicted for known plasma parameters agree extremely well with measurement results.
Due to the existence of several different excitation channels, the complexity for hydrogen is significantly higher than for helium. For some of these channels (namely dissociative recombination of H3+ and mutual neutralization of H with positive ions) cross-sections or branching ratios are known only with large error bars or are missing completely.
After filling these last gaps in the available set of input data for these atomic population models, the models are ideally suited for plasma diagnostics. Users of such models will have to deal, however, with the restriction that in zero-dimensional models transport processes like the diffusion of metastable species of optical thickness can be included only in a simplified form.
The final aim of population models for the hydrogen molecule is to predict for known plasma parameters both the absolute values of band emissions and the ro-vibrational band structure. Although the present results are impressive steps toward such a full description, still some issues remain. The most urgent of these issues regards the set of reaction probabilities used in the model. Although vibrationally resolved FCF, Einstein coefficients and electron collision ionization cross-sections have been calculated, the uncertainty in the available electron collision cross-sections is still too high.
Establishing a new, complete, and comprehensive database for electron collision excitation cross-sections for molecular hydrogen is highly desirable. This database should take into account the vibrational substates, and ideally also the rotational substates. The latter requirements imply that the cross-section data has to be based on theory since performing ro-vibrational measurements for all transitions of interest would be by far too elaborate. Since involved are optically allowed transitions, optically forbidden transitions and spin-exchange processes, simple techniques like the impact parameter method cannot be applied; instead a full quantum mechanical treatment is necessary. Due to the mass dependence of the ro-vibrational structure, also efforts regarding a set of cross-sections for deuterium are desirable.
Only population models based on such an improved set of input data will be capable of predicting the ro-vibrational structure of molecular emission bands with a high accuracy.

Abbreviations

The following abbreviations are used in this manuscript:
OESOptical emission spectroscopy
TALIFTwo-Photon Excited laser Induced Fluorescence
TDLASTunable Diode Laser Absorption Spectroscopy
CR modelCollisional radiative model
EEDFElectron energy distribution function
ECRElectron cyclotron resonance
RFRadio frequency
ITERThe internuclear thermonuclear experimental reactor (or latin for “the way”)
NBINeutral beam injection
FCFFranck-Condon factor
ICPInductively coupled plasma

References

  1. Fantz, U.; Falter, H.D.; Franzen, P.; Wünderlich, D.; Berger, M.; Lorenz, A.; Kraus, W.; McNeely, P.; Riedl, R.; Speth, E. Spectroscopy—A powerful diagnostic tool in source development. Nucl. Fusion 2006, 46, S297–S306. [Google Scholar] [CrossRef]
  2. Otorbaev, D.K.; Buuron, A.J.M.; Guerassimov, N.T.; van de Sanden, M.C.M.; Schram, D.C. Spectroscopic measurement of atomic hydrogen level populations and hydrogen dissociation degree in expanding cascaded arc plasmas. J. Appl. Phys. 1994, 76, 4499–4510. [Google Scholar] [CrossRef]
  3. Amorim, J.; Baravian, G.; Jolly, J. Laser-induced resonance fluorescence as a diagnostic technique in non-thermal equilibrium plasmas. J. Phys. D 2000, 33, R51–R65. [Google Scholar] [CrossRef]
  4. Hinkley, E.D. High-resolution infrared spectroscopy with a tunable diode. Appl. Phys. Lett. 1970, 16, 351–354. [Google Scholar] [CrossRef]
  5. Wünderlich, D.; Dietrich, S.; Fantz, U. Application of a collisional radiative model to atomic hydrogen for diagnostic purposes. J. Quant. Spectrosc. Radiat. Transf. 2009, 110, 62–71. [Google Scholar] [CrossRef]
  6. Fantz, U.; Briefi, D.; Rauner, D.; Wünderlich, D. Quantification of the VUV radiation in low pressure hydrogen and nitrogen plasmas. Plasma Sources Sci. Technol. 2016, 25, 045006. [Google Scholar] [CrossRef]
  7. Behringer, K.; Fantz, U. The influence of opacity on hydrogen excited-state population and applications to low-temperature plasmas. New J. Phys. 2000, 2, 23. [Google Scholar] [CrossRef]
  8. Cohen, S.D.; Hindmarsh, A.C.; Dubois, P.F. CVODE, A Stiff/Nonstiff ODE Solver in C. Comput. Phys. 1996, 10, 138–143. [Google Scholar] [CrossRef]
  9. Godyak, V.A. Nonequilibrium EEDF in gas discharge plasmas. IEEE Trans. Plasma Sci. 2006, 34, 755–766. [Google Scholar] [CrossRef]
  10. De Heer, F.J. Critically Assessed Electron-Impact Excitation Cross Sections for He (11S). In IAEA Nuclear Data Section Report; INDC(NDS)-385; IAEA: Vienna, Austria, 1998. [Google Scholar]
  11. Ralchenko, Y.V.; Janev, R.K.; Kato, T.; Fursa, D.V.; Bray, I.; de Heer, F.J. Cross Section Database for Collision Processes of Helium Atom with Charged Particles. I. Electron Impact Processes. In Research Reports NIFS DATA; NIFS-DATA-59; NIFS: Toki, Japan, 2000. [Google Scholar]
  12. Drake Gordon, W.F. Springer Handbook of Atomic, Molecular, and Optical Physics; Springer Science+Business Media, Inc.: New York, NY, USA, 2006; pp. 199–219. [Google Scholar]
  13. Fowler, R.H. Statistical equilibrium with special reference to the mechanism of ionization by electronic impacts. Philos. Mag. 1926, 47, 257–277. [Google Scholar] [CrossRef]
  14. Möller, W. Plasma and surface modeling of the deposition of hydrogenated carbon films from low-pressure methane plasmas. Appl. Phys. A 1993, 56, 527–546. [Google Scholar] [CrossRef]
  15. Fantz, U. Spectroscopic diagnostics and modelling of silane microwave plasmas. Plasma Phys. Control. Fusion 1998, 40, 1035–1056. [Google Scholar] [CrossRef]
  16. Janev, R.K. Atomic and Plasma-Material Interaction Data for Fusion. Suppl. Nucl. Fusion 1993, 4, 192. [Google Scholar]
  17. Janev, R.K.; Reiter, D.; Samm, U. Report Jül–4105. Forschungszentrum Jülich: Jülich, Germany, 2003; Available online: www.eirene.de/report_4105.pdf (accessed on 23 September 2016).
  18. Sawada, K.; Fujimoto, T. Effective ionization and dissociation rate coefficients of molecular hydrogen in plasma. J. Appl. Phys. 1995, 78, 2913–2924. [Google Scholar] [CrossRef]
  19. Kulander, F.C.; Guest, M.F. Excited electronic states of H3 and their role in the dissociative recombination of H3+. J. Phys. B 1979, 12, L501–L504. [Google Scholar] [CrossRef]
  20. Datz, S.; Sundström, G.; Biedermann, C.; Broström, L.; Danared, H.; Mannervik, S.; Mowat, J.R.; Larsson, M. Branching processes in the dissociative recombination of H3+. Phys. Rev. Lett. 1995, 74, 896–899. [Google Scholar] [CrossRef] [PubMed]
  21. Eerden, M.J.J.; van de Sanden, M.C.M.; Otorbaev, D.K.; Schram, D.C. Cross section for the mutual neutralization reaction H2++H, calculated in a multiple-crossing Landau-Zener approximation. Phys. Rev. A 1995, 51, 3362–3365. [Google Scholar] [CrossRef] [PubMed]
  22. Anderson, H.; Balance, C.P.; Badnell, N.R.; Summers, H.P. An R-matrix with pseudostates approach to the electron-impact excitation of HI for diagnostic applications in fusion plasmas. J. Phys. B 2000, 33, 1255–1262. [Google Scholar] [CrossRef]
  23. Speth, E.; Falter, H.D.; Franzen, P.; Fantz, U.; Bandyopadhyay, M.; Christ, S.; Encheva, A.; Fröschle, M.; Holtum, D.; Heinemann, B.; et al. Overview of the RF source development programme at IPP Garching. Nucl. Fusion 2006, 46, S220–S238. [Google Scholar] [CrossRef]
  24. Fantz, U.; Franzen, P.; Kraus, W.; Falter, H.D.; Berger, M.; Christ-Koch, S.; Fröschle, M.; Gutser, R.; Heinemann, B.; Martens, C.; et al. Low pressure and high power rf sources for negative hydrogen ions for fusion applications (ITER neutral beam injection) (invited). Rev. Sci. Instrum. 2008, 79, 02A511. [Google Scholar] [CrossRef] [PubMed]
  25. Fantz, U.; Wünderlich, D. A novel diagnostic technique for H(D) densities in negative hydrogen ion sources. New J. Phys. 2006, 8, 301. [Google Scholar] [CrossRef]
  26. Mazouffre, S.; Boogaarts, M.G.H.; Bakker, I.S.J.; Vankan, P.; Engeln, R.; Schram, D.C. Transport of ground-state hydrogen atoms in a plasma expansion. Phys. Rev. E 2001, 64, 16411. [Google Scholar] [CrossRef] [PubMed]
  27. Gabriel, O.; Schram, D.C.; Engeln, R. Formation and relaxation of rovibrationally excited H2 molecules due to plasma-surface interaction. Phys. Rev. E 2008, 78, 016407. [Google Scholar] [CrossRef] [PubMed]
  28. Van Harskamp, W.E.N.; Brouwer, C.M.; Schram, D.C.; van de Sanden, M.C.M.; Engeln, R. Detailed H(n = 2) density measurements in a magnetized hydrogen plasma jet. Plasma Sources Sci. Technol. 2012, 21, 024009. [Google Scholar] [CrossRef]
  29. Bendinelli, O.; Ciotti, L.; Parmeggiani, G. Series inversion of Abel equation for very peaked profiles: The R1/4-law. Astrom. Astrophys. 1993, 279, 668–673. [Google Scholar]
  30. Lavrov, B.P.; Melnikov, A.S.; Käning, M.; Röpcke, J. UV continuum emission and diagnostics of hydrogen-containing nonequilibrium plasmas. Phys. Rev. E 1999, 59, 3526–3543. [Google Scholar] [CrossRef]
  31. Vankan, P.; Schram, D.C.; Engeln, R. High rotational excitation of molecular hydrogen in plasmas. Chem. Phys. Lett. 2004, 400, 196–200. [Google Scholar] [CrossRef]
  32. Fantz, U.; Heger, B. Spectroscopic diagnostics of the vibrational population in the ground state H2 and D2 of molecules. Plasma Phys. Control. Fusion 1998, 40, 2023–2032. [Google Scholar] [CrossRef]
  33. Ajello, J.M.; Srivastava, S.K.; Yung, Y.L. Laboratory studies of UV emissions of H2 by electron impact. The Werner- and Lyman-band systems. Phys. Rev. A 1982, 25, 2485–2498. [Google Scholar] [CrossRef]
  34. Day, R.L.; Anderson, R.J.; Sharpton, F.A. Electron excitation of the singlet-g states of H2. J. Chem. Phys. 1979, 71, 3683–3688. [Google Scholar] [CrossRef]
  35. Fantz, U.; Schalk, B.; Behringer, K. Calculation and interpretation of the continuum radiation of hydrogen molecules. New J. Phys. 2000, 2, 7. [Google Scholar] [CrossRef]
  36. Wedding, A.B.; Phelps, A.V. Quenching and excitation transfer for the c3Πu and a3Σg+ states of H2 in collisions with H2. J. Chem. Phys. 1988, 89, 2965–2974. [Google Scholar] [CrossRef]
  37. Fantz, U.; Heger, B.; Wünderlich, D.; Pugno, R.; ASDEX Upgrade Team. Photon efficiency (S+D)/XB of hydrogen molecules at low electron temperatures. J. Nucl. Mater. 2003, 313, 743–747. [Google Scholar] [CrossRef]
  38. Miles, W.T.; Thompson, R.; Green, A.E.S. Electron-impact cross sections and energy deposition in molecular hydrogen. J. Appl. Phys. 1972, 43, 678–686. [Google Scholar] [CrossRef]
  39. Gryzinski, M. Classical theory of atomic collisions. I. Theory of inelastic collisions. Phys. Rev. 1965, 138, A336–A358. [Google Scholar] [CrossRef]
  40. Celiberto, R.; Janev, R.K.; Laricchiuta, A.; Capitelli, M.; Wadhera, J.M.; Atems, D.E. Cross section data for electron-impact inelastic processes of vibrationally excited molecules of hydrogen and its isotopes. At. Data Nucl. Data Tables 2001, 77, 161–213. [Google Scholar] [CrossRef]
  41. Celiberto, R.; (Bari, Italy). Private Communication, 2004.
  42. Fantz, U.; Wünderlich, D. Franck-Condon factors, transition probabilities, and radiative lifetimes for hydrogen molecules and their isotopomeres. At. Data Nucl. Data Tables 2006, 92, 853–973. [Google Scholar] [CrossRef]
  43. Franck, J. Elementary processes of photochemical reactions. Trans. Faraday Soc. 1926, 21, 536–542. [Google Scholar] [CrossRef]
  44. Condon, E. A Theory of intensity distribution in band systems. Phys. Rev. 1926, 28, 1182–1201. [Google Scholar] [CrossRef]
  45. Herbelin, J.M.; Emanuel, G. Einstein coefficients for diatomic molecules. J. Chem. Phys. 1974, 60, 689–696. [Google Scholar] [CrossRef]
  46. Herzberg, G. Molecular Spectra and Molecular Structure, I. Spectra of Diatomic Molecules; Van Nostrand: New York, NY, USA, 1950. [Google Scholar]
  47. Wünderlich, D.; Fantz, U. Franck-Condon factors for molecule-ion reactions of H2 and its isotopomers. At. Data Nucl. Data Tables. 2011, 97, 152–185. [Google Scholar] [CrossRef]
  48. Fantz, U.; Wünderlich, D. Franck-Condon Factors, Transition Probabilities and Radiative Lifetimes for Hydrogen Molecules and Their Isotopomeres. Available online: https://www-amdis.iaea.org/data/INDC-457/ (accessed on 20 September 2016).
  49. Wünderlich, D.; Fantz, U. Franck-Condon Factors for Molecule-Ion Reactions of H2 and Its Isotopomers. Available online: http://www.sciencedirect.com/science/article/pii/S0092640X10000926#m0005 (accessed on 23 September 2016).
  50. Khakoo, M.A.; Trajmar, S. Electron-impact excitation of the a3Σg+, B1Σu+, c3Πu, and C1Πu states of H2. Phys. Rev. A 1986, 34, 146–156. [Google Scholar] [CrossRef]
  51. Shemansky, D.E.; Ajello, J.M.; Hall, D.T. Electron impact excitation of H2: Rydberg band systems and the benchmark dissociative cross section for H Lyman-Alpha. Astrophys. J. 1985, 296, 765–773. [Google Scholar] [CrossRef]
  52. Arrighini, G.P.; Biondi, F.; Guidotti, C. A study of the inelastic scattering of fast electrons from molecular hydrogen. Mol. Phys. 1980, 41, 1501–1514. [Google Scholar] [CrossRef]
  53. Chung, S.; Lin, C.C.; Lee, E.T.P. Dissociation of the hydrogen molecule by electron impact. Phys. Rev. A 1975, 12, 1340–1349. [Google Scholar] [CrossRef]
  54. Chung, S.; Lin, C.C. Application of the close-coupling method to excitation of electronic states and dissociation of H2 by electron impact. Phys. Rev. A 1978, 17, 1874–1891. [Google Scholar] [CrossRef]
  55. Mu-Tao, L.; Lucchese, R.R.; McKoy, V. Electron-impact excitation and dissociation processes in H2. Phys. Rev. A 1982, 26, 3240–3248. [Google Scholar] [CrossRef]
  56. Lima, M.A.P.; Gibson, T.L.; McKoy, V. Cross sections for excitation of the b3Σu+, a3 Σg+, and c3 Πu states of H2 by low-energy electrons. Phys. Rev. A 1988, 38, 4527–4536. [Google Scholar] [CrossRef]
  57. Wünderlich, D. Vibrationally resolved ionization cross sections for the ground state and electronically excited states of the hydrogen molecule. Chem. Phys. 2011, 390, 75–82. [Google Scholar] [CrossRef]
  58. Rapp, D.; Englander-Golden, P. Total cross sections for ionization and attachment in gases by electron impact. I. Positive ionization. J. Chem. Phys. 1965, 43, 1464–1479. [Google Scholar] [CrossRef]
  59. Adamcyk, B.; Boerboom, A.J.H.; Schram, B.L.; Kistemaker, J. Partial ionization cross sections of He, Ne, H2, and CH4 for electrons from 20 to 500 eV. J. Chem. Phys. 1966, 44, 4640–4642. [Google Scholar] [CrossRef]
  60. Crowe, A.; McConkey, J.W. Dissociative ionization by electron impact. I. Protons from H2. J. Phys. B 1973, 6, 2088–2107. [Google Scholar] [CrossRef]
  61. Straub, H.C.; Renault, P.; Lindsay, B.G.; Smith, K.A. Absolute partial cross sections for electron-impact ionization of H2, N2, and O2 from threshold to 1000 eV. Phys. Rev. A 1996, 54, 2146–2153. [Google Scholar] [CrossRef] [PubMed]
  62. Celiberto, R.; Capitelli, M.; Cacciatore, M. Electron impact direct dissociative-ionization cross sections from vibrationally excited H2 molecules and translational energy distribution functions of protons. Chem. Phys. 1990, 140, 209–215. [Google Scholar] [CrossRef]
  63. Wünderlich, D. Vibrationally Resolved Ionization Cross Sections for the Ground State and Electronically Excited Etates of the Hydrogen Molecule. Available online: http://www.sciencedirect.com/science/article/pii/S0301010411004344#appd002 (accessed on 23 September 2016).
  64. Pospieszczyk, A.; Mertens, P.; Sergienko, G.; Huber, A.; Philipps, V.; Reiter, D.; Rusbüldt, D.; Schweer, B.; Vietzke, E.; Greenland, P.T. In situ measurement and modeling of hydrogen recycling and transport processes—The role of molecules. J. Nucl. Mater. 1999, 266, 138–145. [Google Scholar] [CrossRef]
  65. Xiao, B.; Kado, S.; Kajita, S.; Yamasaki, D. Rovibrational distribution determination of H2 in low temperature plasmas by Fulcher-a band spectroscopy. Plasma Phys. Control. Fusion 2004, 46, 653–668. [Google Scholar] [CrossRef]
  66. Mihaljcic, B.; Browning, P.K.; Gibson, K.J. Spatially resolved spectroscopy of detached recombining plasmas in the University of Manchester Linear System divertor simulator. Phys. Plasmas 2007, 14, 013501. [Google Scholar] [CrossRef]
  67. Fantz, U. Basics of plasma spectroscopy. Plasma Sources Sci. Technol. 2006, 15, S137–S147. [Google Scholar] [CrossRef]
Figure 1. Energy-level diagram of the helium atom.
Atoms 04 00026 g001
Figure 2. Line-of-sight averaged population densities np for electronically excited states of He measured by optical absorption (p = 2) and emission (p = 3) spectroscopy and results of calculations using the Yacora collisional radiative (CR) model for He. The population densities are divided by the statistical weight of the states and normalized to the ground state density n0 of He.
Atoms 04 00026 g002
Figure 3. Excitation channels for atomic hydrogen included to the Yacora CR model for atomic hydrogen: (a) all channels; (b) channels relevant in ionizing plasmas; (c) channels relevant in recombining plasmas.
Atoms 04 00026 g003
Figure 4. Comparison of Yacora CR model results with the Balmer line emission and the emission of the molecular band d3→a3 measured in an ionizing plasma: (a) 2D matrix illustrating a parameter space in Te and ne the best possible agreement between measurement and model; (b) comparison of the measured emission vs model results for Te = 12.1 eV and ne = 1.25 × 10¹⁸ m−3 (depicted by the orange ellipse in Figure 4a). Additionally, shown are the calculated fractions of emission that can be attributed to direct excitation of H and from dissociative excitation of H2.
Atoms 04 00026 g004
Figure 5. Comparison of population densities in the hydrogen atom (divided by the statistical weight) calculated by the CR model and measured in the plasma of a magnetized plasma expansion: (a) partially recombining red part of the plasma; (b) fully recombining blue part of the plasma.
Atoms 04 00026 g005
Figure 6. Energy-level diagram of the hydrogen molecule.
Atoms 04 00026 g006
Figure 7. (a) Franck–Condon factors (FCF) for excitation from the ground state X1 to the excited state d3 in the triplet system; (b) Aik for spontaneous emission from d3 to a3.
Atoms 04 00026 g007
Figure 8. Electron collision excitation cross-sections from the literature for molecular hydrogen: (a) excitation from the ground state X1 to the excited state C1 in the singlet system; (b) excitation from the ground state X1 to the excited state c3 in the triplet system.
Atoms 04 00026 g008
Figure 9. Non-dissociative and dissociative ionization cross-sections for the vibrational level v = 0 in the electronic ground state X1 of the hydrogen molecule.
Atoms 04 00026 g009
Figure 10. Comparison of population densities (normalized to the molecular ground state density) calculated by the Yacora corona model for H2 with measurements taken in an ionizing plasma: (a) excited state I1; (b) excited state d3.
Atoms 04 00026 g010
Figure 11. Spectra of the emission band d3→a3 calculated by the Yacora corona model for molecular hydrogen and measured in an ionizing plasma: (a) hydrogen; (b) deuterium.
Atoms 04 00026 g011
Figure 12. VUV/UV spectra for molecular hydrogen: (a) calculated by the corona model; (b) measured in an inductively coupled plasma (ICP) discharge.
Atoms 04 00026 g012

