
Line Shape Modeling for the Diagnostic of the Electron Density in a Corona Discharge


1
Laboratoire PIIM, Aix-Marseille Université and CNRS, 13397 Marseille CEDEX 20, France
2
Laboratoire G2Elab, CNRS and Grenoble University, 25 rue des Martyrs, 38042 Grenoble, France
3
Guizhou Institute of Technology, Caiguan Road 1, Guiyang 550003, China
*
Author to whom correspondence should be addressed.
Atoms 2017, 5(4), 35; https://doi.org/10.3390/atoms5040035
Submission received: 31 August 2017
/
Revised: 23 September 2017
/
Accepted: 24 September 2017
/
Published: 28 September 2017
(This article belongs to the Special Issue Spectral Line Shapes in Astrophysics and Related Topics)
Abstract
:We present an analysis of spectra observed in a corona discharge designed for the study of dielectrics in electrical engineering. The medium is a gas of helium and the discharge was performed at the vicinity of a tip electrode under high voltage. The shape of helium lines is dominated by the Stark broadening due to the plasma microfield. Using a computer simulation method, we examine the sensitivity of the He 492 nm line shape to the electron density. Our results indicate the possibility of a density diagnostic based on passive spectroscopy. The influence of collisional broadening due to interactions between the emitters and neutrals is discussed.
1. Introduction
Corona discharges of helium were performed in an experiment devoted to the investigation of the dielectric properties of insulators in the context of electrical engineering. This setup consisted of a point-plane electrode system placed inside a helium cryostat; a high voltage was applied to the system and a streamer of either positively or negatively charged particles, ions or electrons, was generated and formed a plasma locally. Here, we report the analysis of the helium 492 nm line (singlet state, 1s4d–1s2p transition) observed in discharges at room temperature. This line is strongly sensitive to the electron density due to the Stark broadening generated by the plasma microfield. We show that a diagnostic of the electron density can be performed from an analysis of the line width and its forbidden component induced by the electric field. This work completes previous research on the analysis of Hβ [1], and some preliminary results were discussed at the fourth Spectral Line Shape in Plasmas code comparison workshop (SLSP4, see http://plasma-gate.weizmann.ac.il/slsp/). It will be followed with subsequent analyses of spectra observed in helium corona discharges performed at low temperatures (a few K) with liquid helium.
2. Presentation of the Experiment
A point-plane electrode system was placed inside a helium cryostat. The point electrode was negatively polarized by a stabilized high voltage DC power supply (Spellman RHSR/20PN60) and the current-voltage characteristics were measured using a Tektronix TDS540 oscilloscope and a Keithley 610C ammeter. The corona discharge in this geometry is axially symmetric and appears as a luminous spherical region (ionization region) localized near the point electrode against the dark background. More details on the experimental setup can be found elsewhere, e.g., [2]. The measured intensity of the radiation was averaged over the exposure time. A liquid N2 cooled 2D-CCDTKB-UV/AR detector was located directly in the exit plane of the spectrograph. The noise level of the CCD detector was determined only by the read-out noise, as the dark current of the camera was less than 1 e/pixel/h at 153 K. The wavelength and intensity response of the detection system was calibrated by using low pressure helium and tungsten ribbon lamps. The line broadening due to the instrument response (1200 g/mm grating) was estimated from the helium lines of a helium lamp as Δλins < 0.10 nm.
3. An Analysis of the Helium 492 nm Line Observed at 300 K
In concert with previous research [1], we here report an analysis of the helium 492 nm line (singlet state, 1s4d–1s2p transition) which has been observed on spectra. Discharges were carried out at pressures from 1 to 12 bar, with a current of 100 μA. In order to simplify the interpretation of the spectra, we focus on the lowest pressure values (namely, between 1 and 2 bar) because the line overlaps with nearby molecular bands at higher pressures.
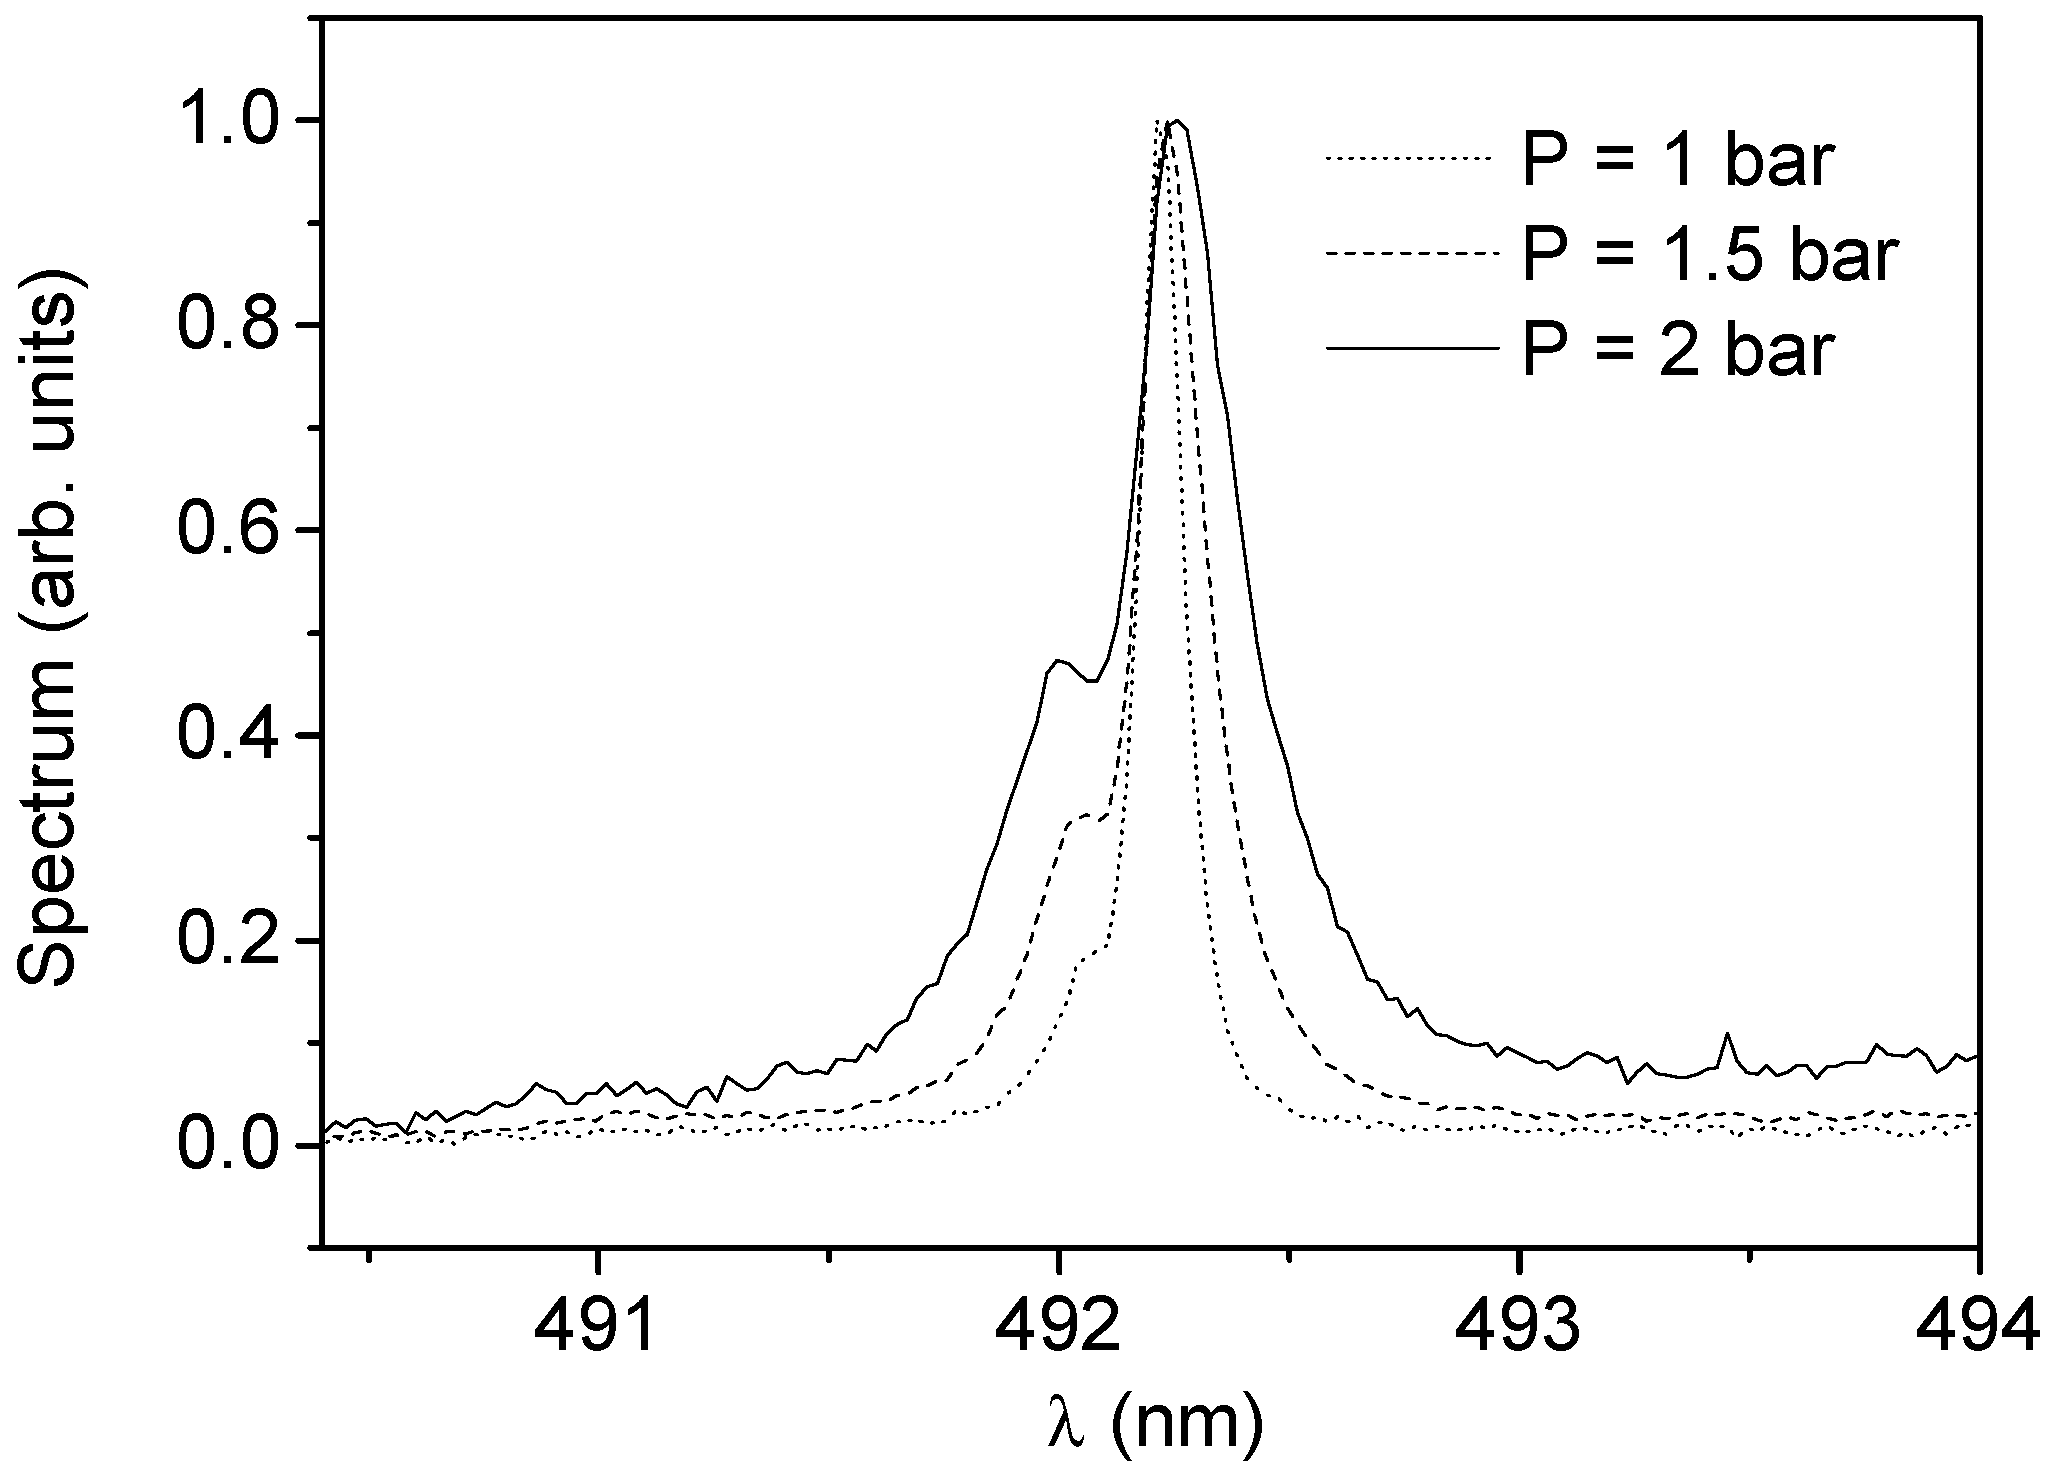
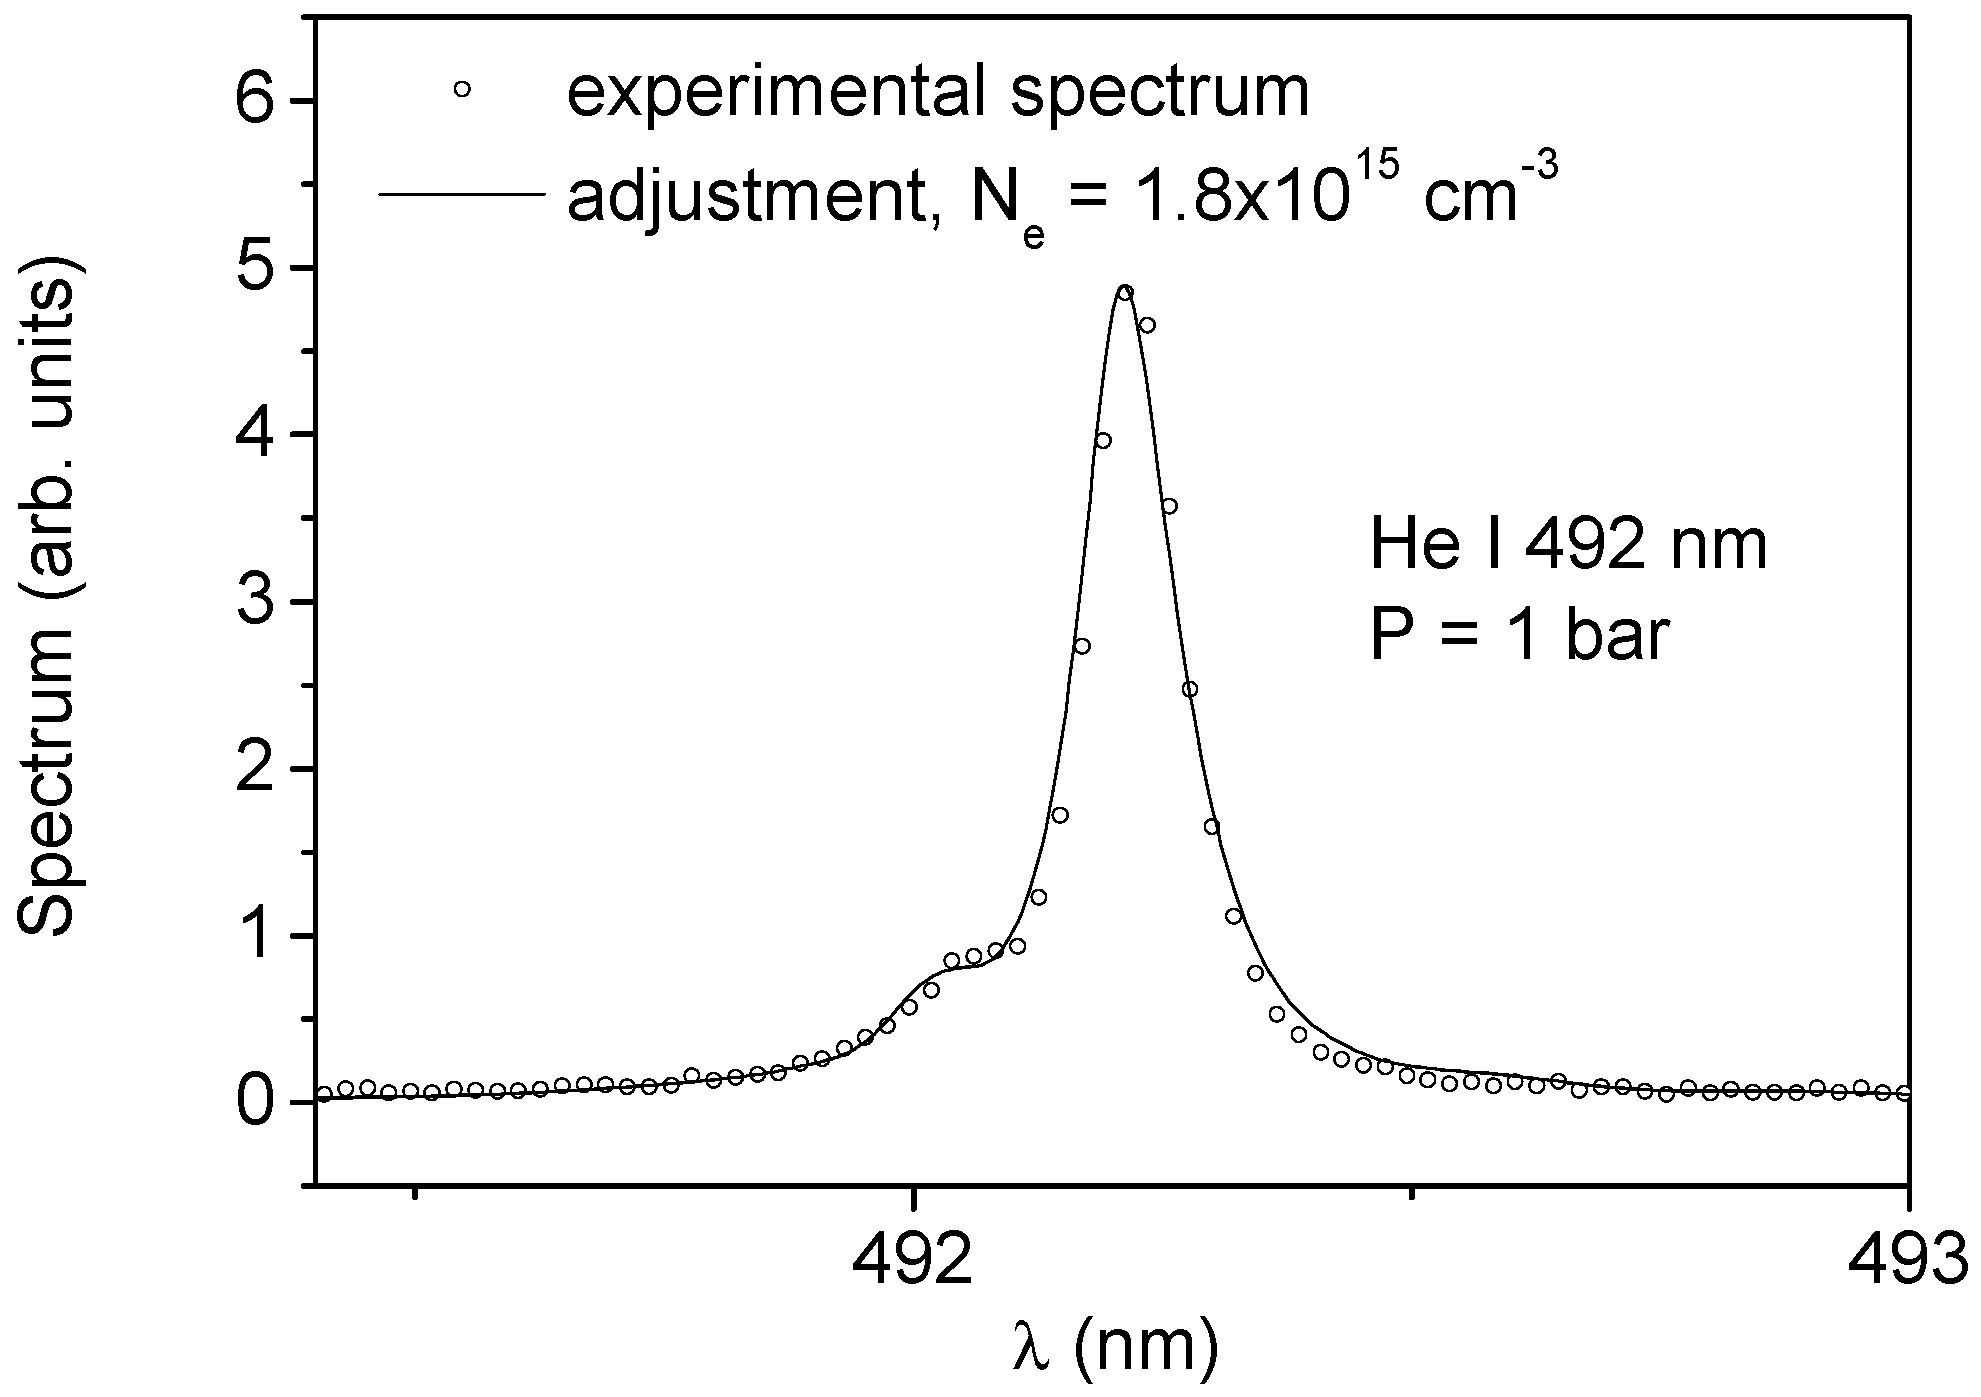
Figure 1 shows a plot of the helium 492 nm line observed at 1, 1.5, and 2 bar. The line width increases with the pressure. The bump on the blue wing denotes a forbidden transition (1s4f–1s2p) induced by the microfield. An analysis of the resonance broadening resulting from atom-atom collisions using a collision operator model [3] indicates that this effect is not the dominant line broadening one. The instrumental broadening is also not dominant. We examined the role of the Stark effect related to the plasma microfield. A computer simulation method [4] was applied to the He 492 nm line at the same pressure values as above. The He+ ion microfield evolution was simulated from a quasiparticle model and the line broadening was calculated from a numerical integration of the time-dependent Schrödinger equation. The contribution of the electrons was evaluated using a collision operator. In our calculations, we used the Griem-Baranger-Kolb-Oertel model [5], assuming an electron temperature of 104 K and leaving the electron density as an adjustable parameter. The ion temperature was assumed to be equal to the atomic (300 K) temperature. Our calculations indicate that the Stark broadening was mainly due to the ions. Figure 2 shows an example of the adjustment performed using the simulation method at p = 1 bar. A value of 1.8 × 1015 cm−3 was obtained for the electron density. Our calculations at p = 1.5 bar and 2 bar yielded higher values for the electron density, which indicates an increase trend in terms of the pressure. This result is preliminary and will be completed with further analyses.
4. Conclusions
We have analyzed spectral profiles of the helium 492 nm line in helium corona discharges by means of a computer simulation method. An application to 1, 1.5, and 2 bar gas pressures indicates that the plasma microfield yields an obvious Stark broadening, which can serve as a probe for the electron density. This result is a preliminary step in ongoing investigations of liquid corona discharges. New experiments, with liquid helium, are planned and will be analyzed using spectroscopic techniques.
Author Contributions
All authors contributed equally to this work.
Conflicts of Interest
The authors declare no conflict of interest.
References
- Rosato, J.; Bonifaci, N.; Li, Z.; Stamm, R. A spectroscopic diagnostic of the electron density in a corona discharge. J. Phys. Conf. Ser. 2017, 810, 012057. [Google Scholar] [CrossRef]
- Li, Z.-L.; Bonifaci, N.; Aitken, F.; Denat, A.; von Haeften, K.; Atrazhev, V.M.; Shakhatov, V.A. Spectroscopic investigation of liquid helium excited by a corona discharge: Evidence for bubbles and “red satellites”. Eur. Phys. J. Appl. Phys. 2009, 47, 2821. [Google Scholar] [CrossRef]
- Ali, A.W.; Griem, H.R. Theory of Resonance Broadening of Spectral Lines by Atom-Atom Impacts. Phys. Rev. 1965, 140, A1044–A1049, reprinted in Phys. Rev. 1966, 144, 366. [Google Scholar] [CrossRef]
- Rosato, J.; Marandet, Y.; Capes, H.; Ferri, S.; Mossé, C.; Godbert-Mouret, L.; Koubiti, M.; Stamm, R. Stark broadening of hydrogen lines in low-density magnetized plasmas. Phys. Rev. E 2009, 79, 046408. [Google Scholar] [CrossRef] [PubMed]
- Griem, H.R.; Baranger, M.; Kolb, A.C.; Oertel, G. Stark Broadening of Neutral Helium Lines in a Plasma. Phys. Rev. 1962, 125, 177–195. [Google Scholar] [CrossRef]
Figure 1.
Plot of the helium 492 nm line observed in a helium corona discharge at room temperature, for different pressure values. The line width increases with the pressure. This trend is also observed on other lines. The bump on the blue wing denotes a forbidden transition induced by the microfield.

Figure 2.
The plasma microfield yields an additional broadening, which can serve as a probe of the density. Here, the Stark broadening was evaluated using a computer simulation method [4].
Figure 2.
The plasma microfield yields an additional broadening, which can serve as a probe of the density. Here, the Stark broadening was evaluated using a computer simulation method [4].
© 2017 by the authors. Licensee MDPI, Basel, Switzerland. This article is an open access article distributed under the terms and conditions of the Creative Commons Attribution (CC BY) license (http://creativecommons.org/licenses/by/4.0/).
Share and Cite
MDPI and ACS Style
Rosato, J.; Bonifaci, N.; Li, Z.; Stamm, R. Line Shape Modeling for the Diagnostic of the Electron Density in a Corona Discharge. Atoms 2017, 5, 35. https://doi.org/10.3390/atoms5040035
AMA Style
Rosato J, Bonifaci N, Li Z, Stamm R. Line Shape Modeling for the Diagnostic of the Electron Density in a Corona Discharge. Atoms. 2017; 5(4):35. https://doi.org/10.3390/atoms5040035
Chicago/Turabian StyleRosato, Joël, Nelly Bonifaci, Zhiling Li, and Roland Stamm. 2017. "Line Shape Modeling for the Diagnostic of the Electron Density in a Corona Discharge" Atoms 5, no. 4: 35. https://doi.org/10.3390/atoms5040035
Note that from the first issue of 2016, this journal uses article numbers instead of page numbers. See further details here.