Article

Models of Emission-Line Profiles and Spectral Energy Distributions to Characterize the Multi-Frequency Properties of Active Galactic Nuclei

1
Department of Physics and Astronomy, University of Padua, Vicolo dell’Osservatorio 3, 35122 Padova, Italy
2
Astronomical Observatory of Brera, National Institute of Astrophysics (INAF), Via Bianchi 46, 23807 Merate, Italy
*
Author to whom correspondence should be addressed.
Current address: Vicolo dell’Osservatorio 3, 35122 Padova, Italy.
These authors contributed equally to this work.
Atoms 2017, 5(4), 43; https://doi.org/10.3390/atoms5040043
Submission received: 10 September 2017 / Revised: 22 October 2017 / Accepted: 23 October 2017 / Published: 6 November 2017
(This article belongs to the Special Issue Spectral Line Shapes in Astrophysics and Related Topics)

Abstract

:
The spectra of active galactic nuclei (AGNs) are often characterized by a wealth of emission lines with different profiles and intensity ratios that lead to a complicated classification. Their electromagnetic radiation spans more than 10 orders of magnitude in frequency. In spite of the differences between various classes, the origin of their activity is attributed to a combination of emitting components, surrounding an accreting supermassive black hole (SMBH), in the unified model. Currently, the execution of sky surveys, with instruments operating at various frequencies, provides the possibility to detect and to investigate the properties of AGNs on very large statistical samples. As a result of the spectroscopic surveys that allow the investigation of many objects, we have the opportunity to place new constraints on the nature and evolution of AGNs. In this contribution, we present the results obtained by working on multi-frequency data, and we discuss their relations with the available optical spectra. We compare our findings with the AGN unified model predictions, and we present a revised technique to select AGNs of different types from other line-emitting objects. We discuss the multi-frequency properties in terms of the innermost structures of the sources.

1. Introduction

When discussing active galactic nuclei (AGNs), we generally refer to the nuclei of galaxies for which a supermassive black hole (SMBH), with a mass ranging between 10 6 and 10 10 M , is fed by a continuous flow of matter from the surrounding environment. This process, denoted as accretion, leads to the conversion of the gravitational binding energy of the accreted material into heat and radiative energy, through the effects of the viscous interactions that arise in the accreted matter as it is accelerated up to several thousand kilometers per second by the strong gravitational pull of the black hole [1]. In spite of this common interpretation, AGNs present a wide range of striking observational differences in their spectra, in their total power and in the frequency range for which most of their energy is radiated away. While the first to be clearly identified were located in galaxies with exceptionally bright optical nuclei [2], nearly 10% of the total population were subsequently found to radiate large fractions of their power in the radio and the high-energy domains [3]. Their total luminosities can change over a wide range and are typically considered to lie between 10 40 erg s 1 , in the case of low-luminosity sources, and some 10 46 erg s 1 for the most powerful sources. They are distributed from the local universe, where the low-luminosity objects are more common, all the way up to very high redshifts ( z 7 ), where powerful activity becomes more frequent.
In terms of the characteristics of the optical-UV spectra, AGNs are generally characterized by the presence of a non-thermal continuum, often well represented by a power-law shaped spectrum of the form L ν ν α and sometimes accompanied by prominent emission lines with different profiles. In some cases, we additionally observe a hot thermal excess, with a peak that likely falls in the far UV, or different contributions from the host-galaxy stellar populations. Following a scheme that was first outlined by [4], we generally classify Type 1 AGNs as those objects whose spectra show broad recombination lines, with profiles corresponding to velocity fields exceeding 1000 km s 1 in full width at half maximum (FWHM), from H, He, or from other permitted lines of heavy ions such as Fe II, C IV and Si IV, together with narrow forbidden lines (FWHM ≈ 300–500  km s 1 ) from, for example, [Ne V], [Ne III], [O III], [O II], [O I], [N II] and [S II]. We classify Type 2 AGNs as those for which both permitted and forbidden lines only have narrow profiles. In general, it is observed that Type 1 sources are brighter and commonly show a thermal UV excess, while Type 2 objects are dimmer and more severely contaminated by the host-galaxy spectral contributions.
The most widely accepted way to explain the observations is to assume that the central accreting SMBH is surrounded by a hot accretion disk, radiating in the optical, UV and X-ray frequencies, and a compact region (less than 0.1 pc in size) of dense ionized gas ( N e 10 9 cm 3 ), which produces Doppler-broadened recombination lines due to the large gravitational acceleration, and is therefore called the broad-line region (BLR). The gas that is located at larger distances ( 1 pc r 1 kpc ); although still being ionized and producing emission lines, it has a considerably smaller velocity field and electron densities closer to typical nebular environments ( 10 3 cm 3 N e 10 6 cm 3 ). It, therefore, radiates both permitted and forbidden lines with narrow Doppler profiles, giving rise to what we call the narrow-line region (NLR). If the central structure is partially obscured by an optically thick distribution of matter, as is supported by some observational evidence [5], the difference between Type 1 and Type 2 objects is consistently explained by the fact that our line of sight, respectively, may or may not reach the central regions, without being intercepted by the surrounding material, in what is called the AGN unified model [6]. When the accretion flow becomes coupled with the magnetic fields that develop close to the SMBH in such a way that a relativistically beamed jet of plasma is accelerated away from the nucleus, AGNs become powerful sources of radio and high-energy emission, eventually developing extended radio morphologies [7].
In spite of the fairly comprehensive interpretation, AGNs still pose many fundamental questions, because most of the relevant physical processes involved in the accretion and in the acceleration of jets are confined close to the SMBH, in a region that lies still beyond the resolution capabilities of present-day instruments. For this reason, a large part of our current knowledge concerning AGNs is based on the analysis of their spectra and on monitoring the correlations existing among their numerous spectral components. However, not all sources are equally good for such investigations, as Type 1 objects tend to be dominated by the emission of the AGN, while Type 2 sources are strongly affected by obscuration and stellar light contributions from the host galaxy. The main details to understand the physics of AGNs, therefore, can only be constrained by careful inspection of spectral properties that should be possibly extended over large statistical samples, in order to compare the predictions of different models with the available observations. In recent times, several campaigns have been carried out to monitor the sky at different frequencies and to obtain spectroscopic observations. In this contribution, we describe a revised scheme to select AGNs on the basis of the properties of their emission lines and colors, we illustrate the potential of multi-frequency models to relate the observed spectral energy distributions (SEDs) with optical spectra, and we discuss the information that we are able to extract on their central structures from the combined analysis of line profiles and multi-frequency data.

2. Results

The most common property shared by different types of AGNs is the emission of an intense continuum of non-thermal radiation that can possibly ionize diffuse gas and, thus, give rise to emission lines in the spectra. Because lines excited by non-thermal ionizing continua differ in intensity and distribution from lines excited by the continuum of hot thermal sources [8,9], we can apply a set of diagnostic diagrams, based on the intensity ratios of specific lines, in order to recognize the footprint of ionization from thermal and non-thermal sources in external galaxies. When the amount of spectroscopic data was dramatically increased, as a result of the execution of large spectroscopic surveys such as the Sloan Digital Sky Survey (SDSS) [10,11], this method was further refined, demonstrating its ability to recognize the presence of obscured AGN activity [12]. This kind of information is fundamental to assess the statistical relations existing between obscured and unobscured sources, which constrain the structure of the central source and its possible dependence on luminosity or age. In order to perform such a study, however, we need an instrument that is in principle able to detect different types of AGN activity, with the smallest possible influence of selection effects. We obtained such a tool by combining spectroscopic and photometric parameters, on the basis of an investigation of how different spectral classes are related with multi-frequency emission.

2.1. AGN Selection from Spectroscopic Surveys

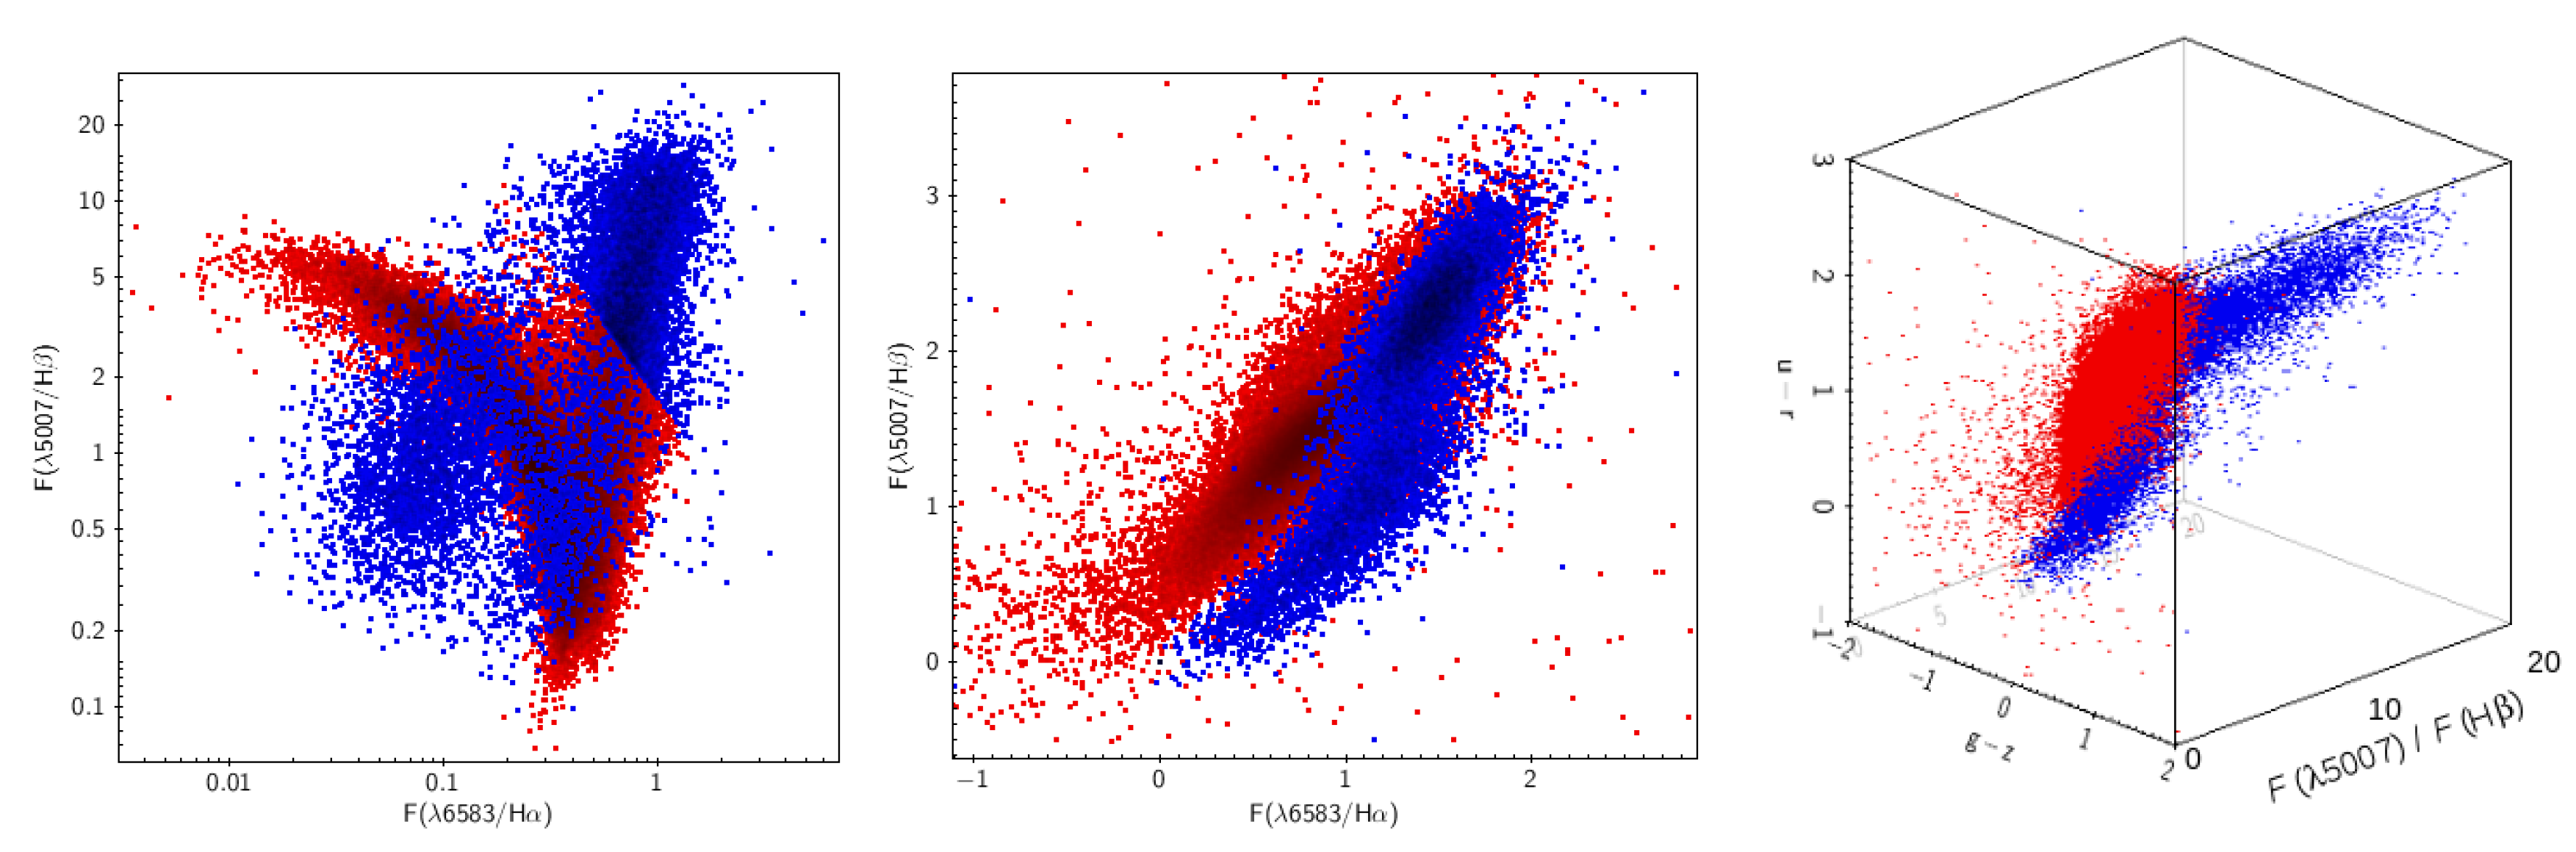
The investigation of AGN statistical properties requires the revising of the selection techniques, which have been classically designed to detect specific types of sources on the basis of their characteristic properties. While Type 1 AGNs are generally well identified by the presence of prominent broad emission lines in the spectra, which are commonly accompanied by a hot thermal continuum excess sometimes referred to as the big blue bump, Type 2 AGNs are only characterized by narrow emission lines, which can also be present in the spectra of galaxies with strong star formation activity. In the case of narrow line-emitting sources, the methods based on diagnostic diagrams are fairly well suited to distinguish between AGN and stellar activity, but if performed on a selection of spectra simply based on the presence of emission lines, to collect different types of sources, the emission-line diagnostics alone are not straightforwardly applicable. An example of this effect is shown in Figure 1, where we compare different methods to distinguish AGNs from thermally excited spectral line emitters. The reason that the classic diagnostic ratios cannot be used on a sample of objects including Type 1 sources is attributed to the use of the recombination lines, which are needed to normalize the strength of the forbidden lines that probe the temperature and the ionization structure of the gas. The presence of a strong contribution in the broad component of the recombination lines in Type 1 objects, which is not balanced in the forbidden lines, forces Type 1 sources to populate the non-AGN region of the plots. This is apparent, because this type of diagnostic diagram is designed to work on the emission of the NLR alone and cannot account for the BLR component. It has been proposed that a different choice of the emission-line diagnostic ratios, involving only forbidden lines, might in principle solve the problem [13], but the available choices either involve the use of weak lines, or they are strongly subject to the effects of interstellar extinction.
If the direct sight of the central regions in Type 1 AGNs can give rise to problems in recognizing their spectral signature, on the other hand, we have the opportunity to take advantage of the strong blue and UV continuum, which is produced by the central source and is not obscured along the line of sight. It has been shown that Type 1 AGNs can effectively be selected by means of photometric criteria that compare their colors with those of non-active objects, to the extent that the SDSS uses a photometric pipeline to select QUASAR candidates for follow-up spectroscopy [14,15]. This method has some limitations when comparing objects at very different redshifts; however, in the low-redshift domain in which the diagnostic lines are still available in the optical frequency window ( z 0.5 ), it defines a well-established parameter space in which Type 1 AGNs can be effectively distinguished from other line-emitting sources. A projection of this parameter space on the u r versus g z color–color diagram is also illustrated in Figure 1. The choice of these extended color bands, which was based on the extinction-corrected magnitude measurements of all SDSS objects with emission lines of H α , H β , [O III] λ 5007 and [N II] λ 6583 detected at more than the 5 σ level, maximizes the effect of the blue continuum of Type 1 sources over the stellar continuum of other sources. As a consequence, we recover the possibility of detecting different types of nuclear activity by combining classic spectroscopic diagnostics and photometric colors into a multi-dimensional parameter space, in which AGNs populate a separate sequence with respect to other non-AGN powered sources.

2.2. Emission Lines and Models of AGN Spectral Energy Distributions

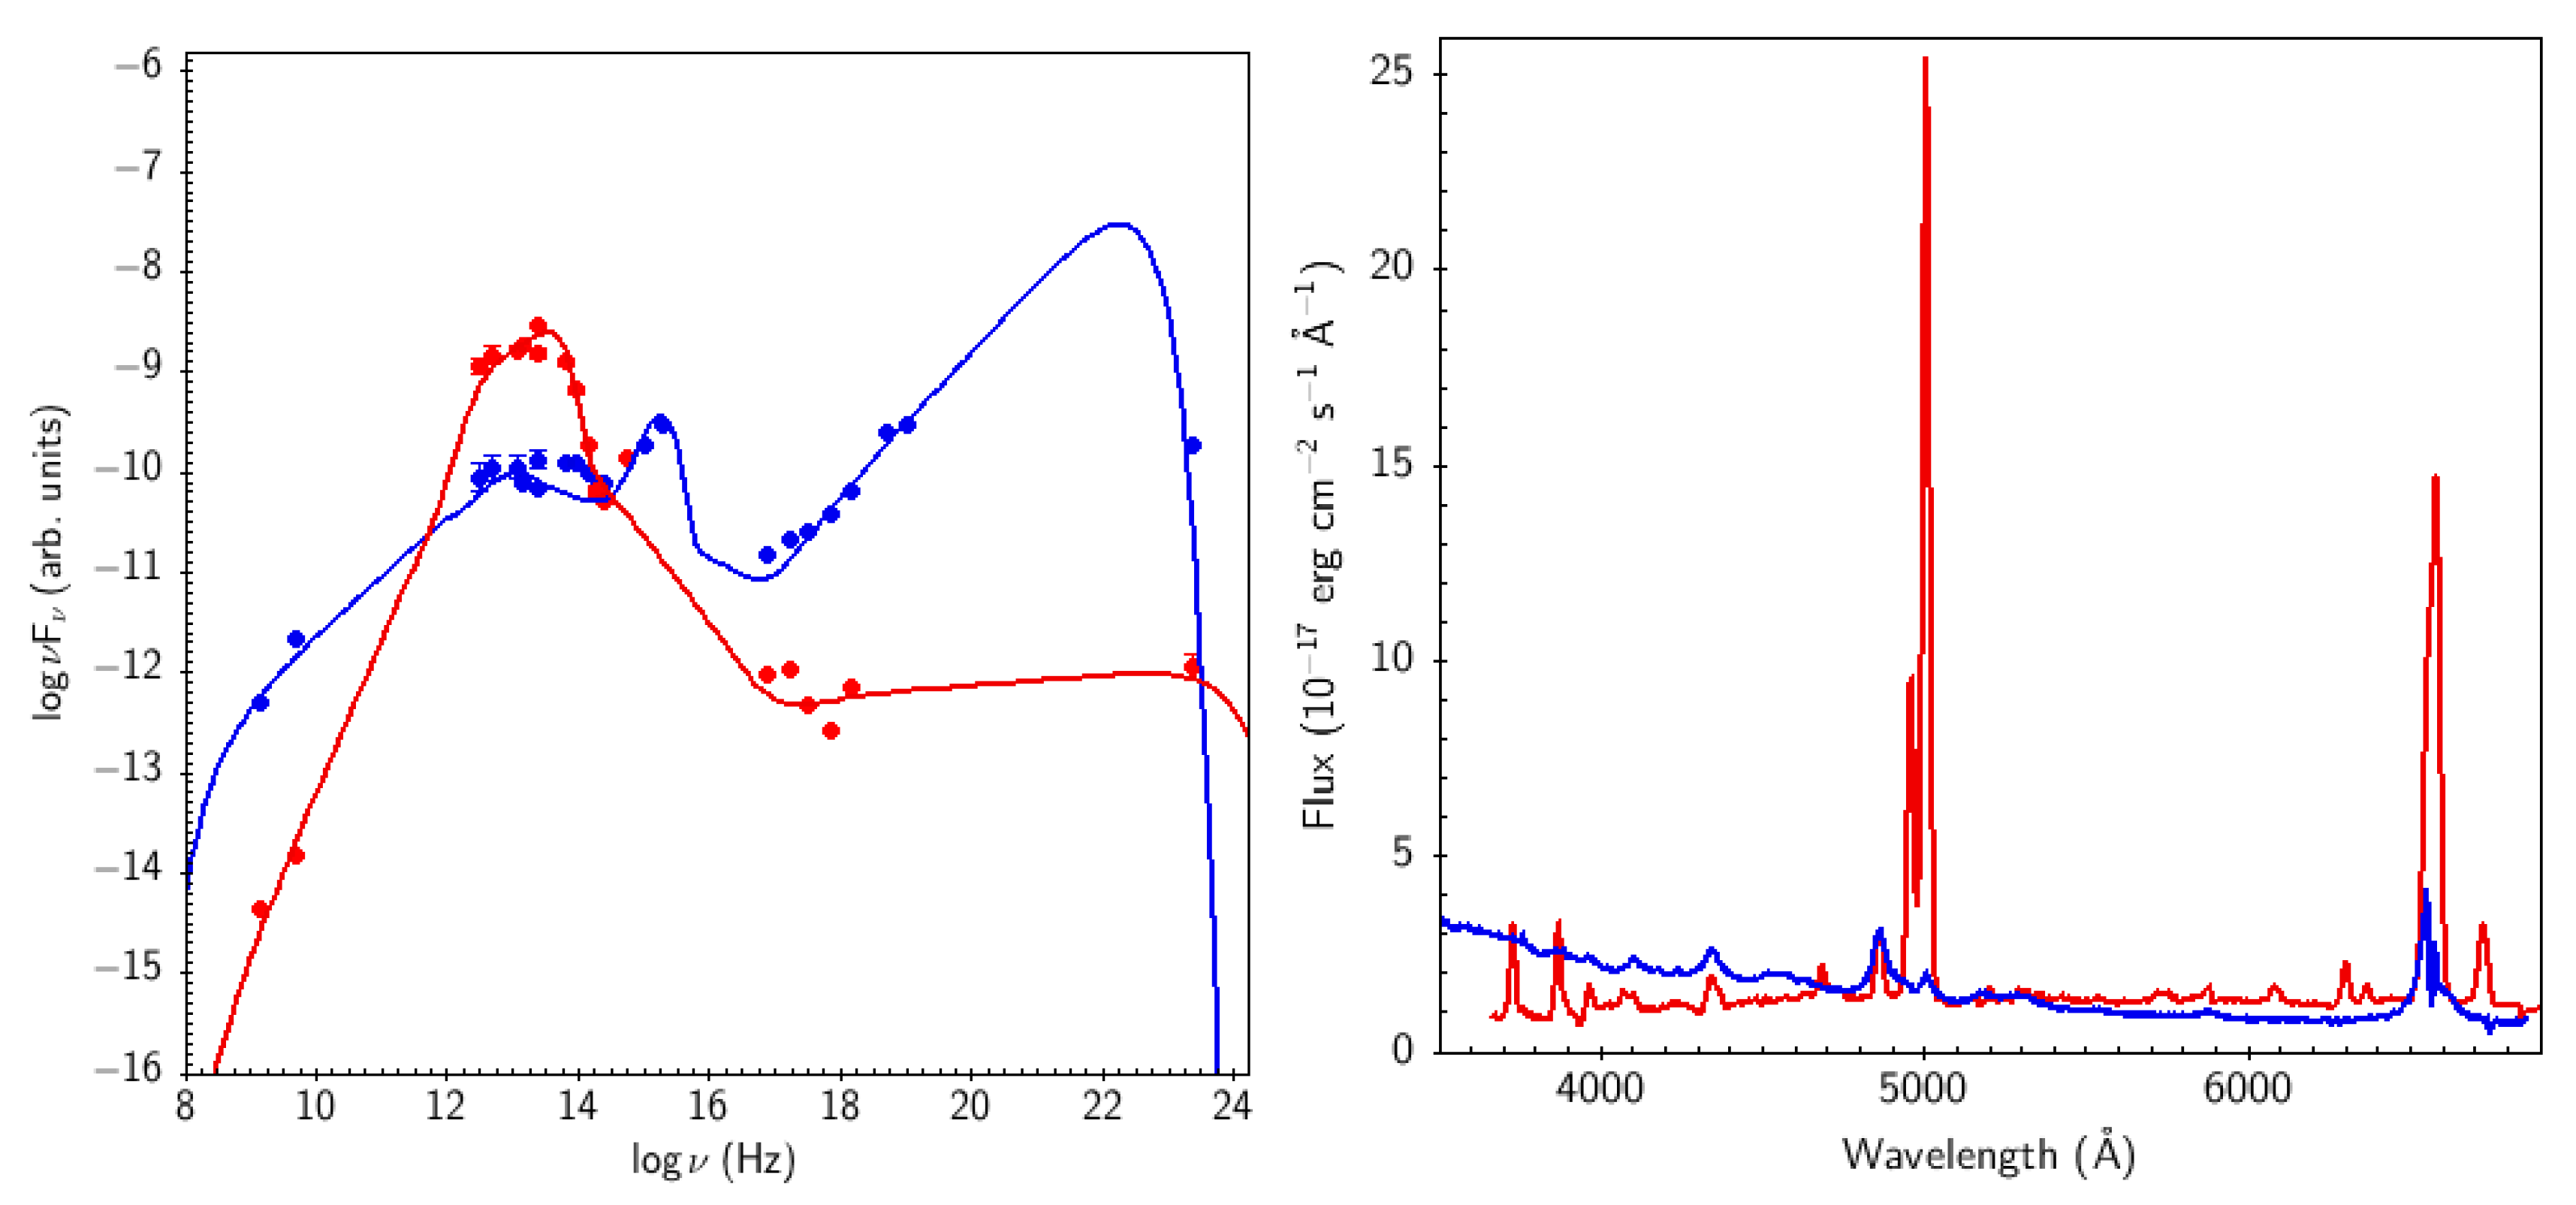
The selection of general samples of AGNs belonging to different spectral classes allows us to search for observations of the corresponding sources in multiple frequencies. By combining the available data, it is possible to reconstruct the AGN SEDs and to compare these with the associated optical spectra, as is illustrated for example in Figure 2. The plots show the different SEDs of two prototypical AGNs (3C 273 for Type 1 and NGC 1068 for Type 2) modeled through a combination of thermal and non-thermal radiation components, together with their characteristic spectra. We can immediately appreciate how the occurrence of a Type 1 spectrum, with broad lines and a blue continuum, is well associated with a strong dominance of the non-thermal contribution and a direct sight towards the hottest central regions, resulting in an excess of ionizing radiation, in agreement with the unified model predictions. Conversely, the Type 2 SED is totally consistent with an obscured central source, whose low-energy ionizing radiation is severely absorbed and reprocessed by a distribution of material that subsequently re-emits photons in the infrared (IR) domain. Only the more penetrating high-energy photons and the long-wavelength radio emission, which is practically unaffected by obscuration, can propagate directly from the central source, therefore resulting in an optical spectrum that is dominated by the host galaxy and the emission lines originating from the unobscured NLR.
In addition to providing observational evidence in support of the unified model, and possibly to associate different degrees of absorption and light reprocessing to various AGN classes, the combination of SED models and spectroscopic observations is a promising instrument to improve our knowledge of AGN distribution. As a result of the numerous efforts that have been devoted to surveying the whole sky at various frequencies, it is now possible to recognize AGN candidates from their SED, even in sky areas that have not yet been covered by detailed and publicly available spectroscopic programs. The further possibility that models of the observed SED may lead to a prediction of the expected AGN class, in addition to optimizing the execution of follow-up campaigns, provides statistical constraints to infer structural and evolutionary details in large samples of AGNs.

2.3. Multi-Frequency Analysis of the Central Engine

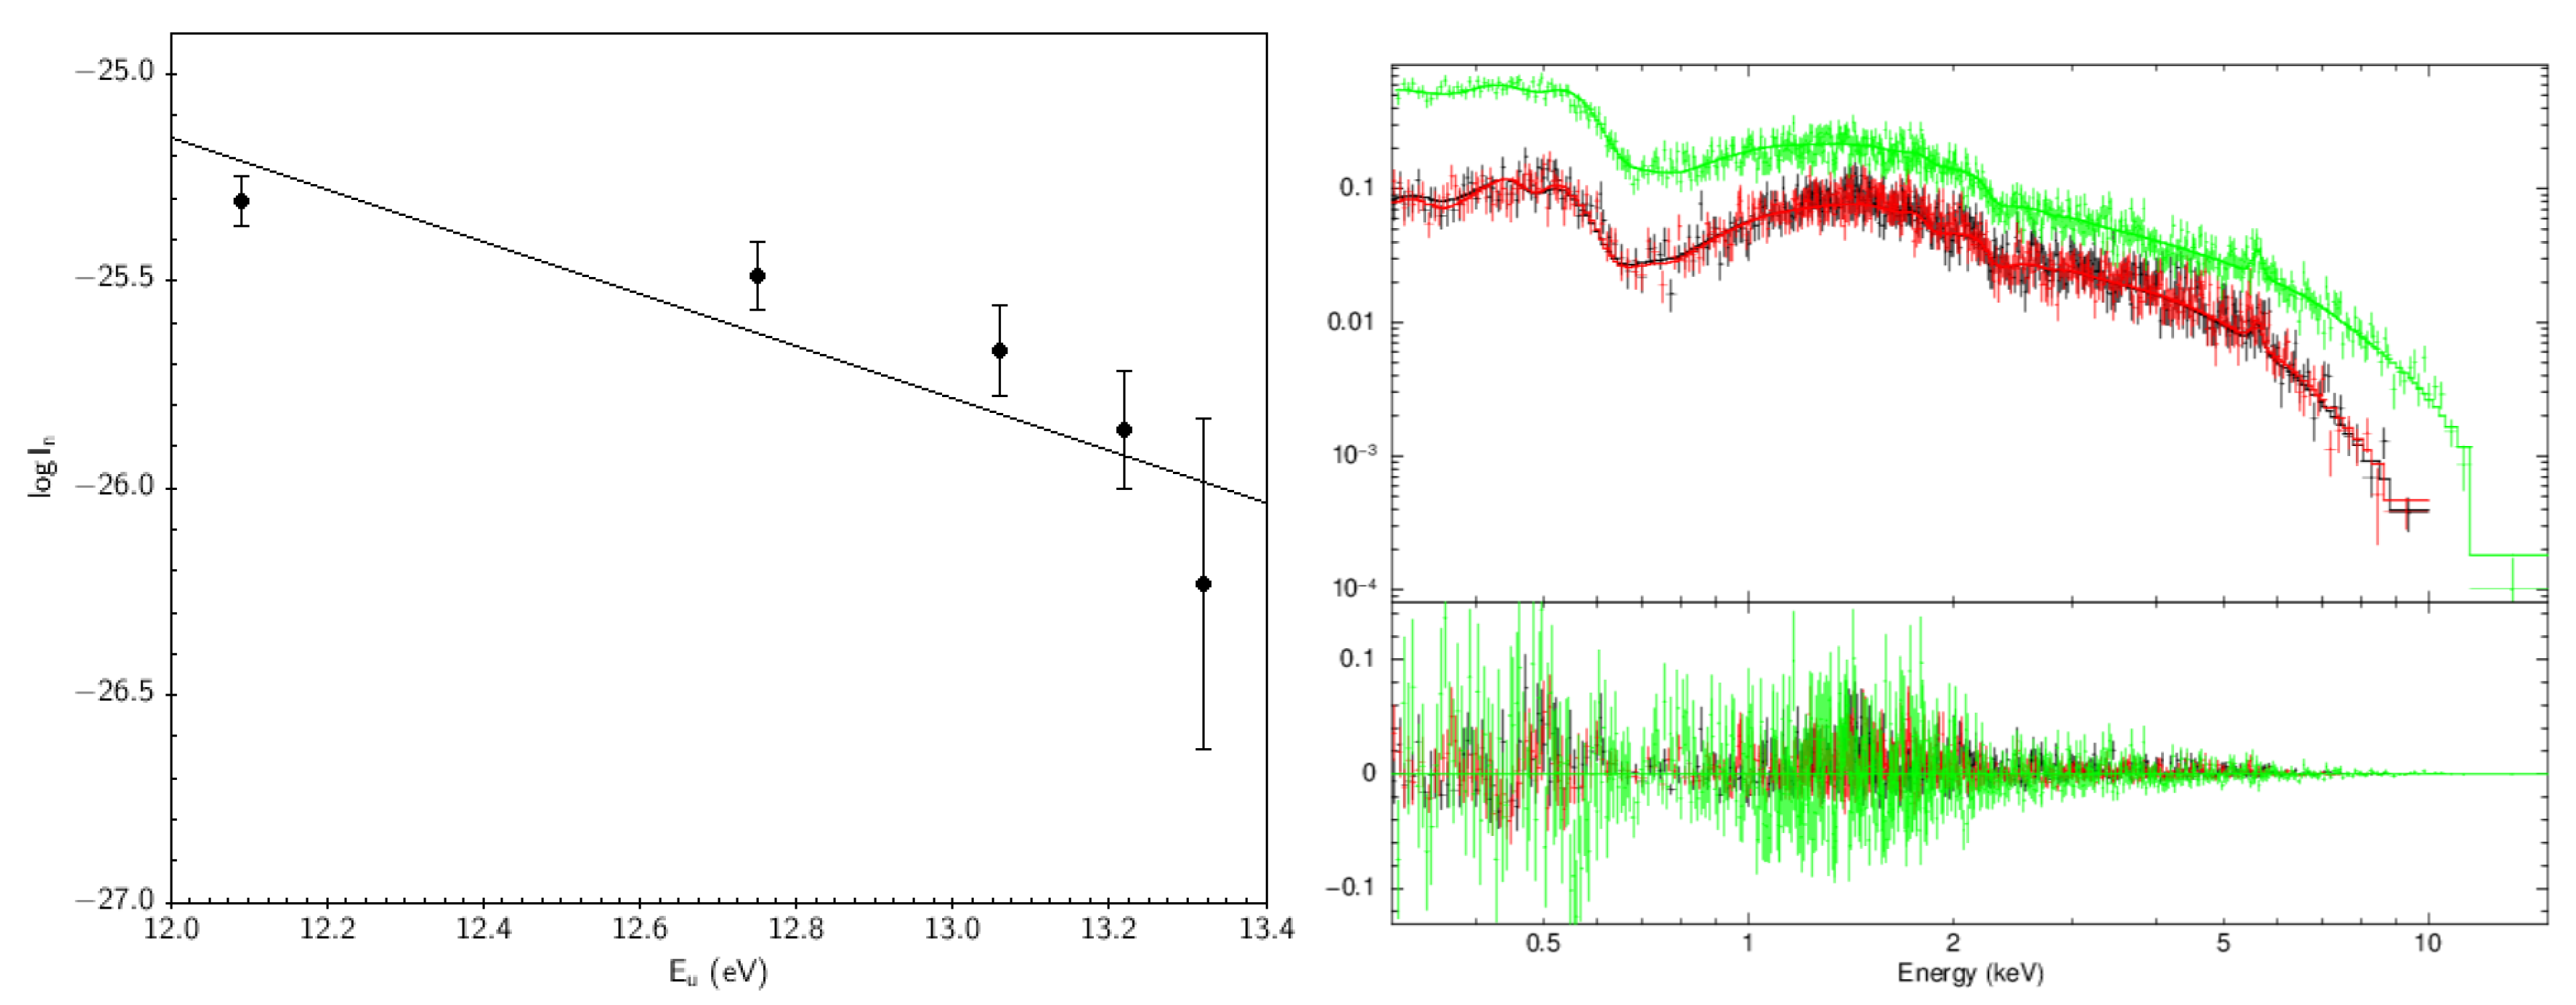
Because of the extremely compact size of the regions in which the continuum and the bulk of the emission lines are produced in AGNs, we do not yet have a fully developed interpretation of their innermost structures. Most of our current understanding is derived from the analysis of spectra and from models that carry out the inferred physical conditions. Therefore, the extension of spectroscopic analysis to different frequencies improves our ability to explore unresolved structures. Such an example is illustrated in Figure 3 for the case of the QSO PG 1114 + 445, for which we compare the XMM Newton X-ray spectrum with measurements of the normalized intensities of the broad components of the Balmer lines of hydrogen. This quantity is defined as
I n = λ u l I u l g u A u l
where λ u l is the wavelength corresponding to the transition from an upper level u to a lower level l (with l = 2 for H Balmer lines), I u l is the measured intensity, g u is the statistical weight of the upper level, and A u l is the spontaneous transition probability. In the case of an optically thin line, we can use the general expression:
I u l = 1 4 π h c λ u l A u l 0 s N u d s
where h and c are the Planck constant and the vacuum speed of light, while N u is the concentration of atoms in the upper level, and the integration is executed throughout the extension of the source to obtain
I n = 1 4 π h c g u 0 s N u d s
If we now assume that the distribution of emitting atoms is spatially constant within the source and that it can be represented by a Boltzmann formula at least in the high-excitation stages (a condition known as partial local thermodynamic equilibrium—PLTE), we obtain
I n = 1 4 π h c g 1 N 1 s exp Δ E u k B T e
where Δ E u is the upper-level excitation energy. It is therefore clear that, under the assumed conditions, we expect the following:
log I n = log 1 4 π h c g 1 N 1 s log e k B T e Δ E u
which is a linear function of the upper-level excitation energy [17].
The deviation from the expected linear behavior observed in Figure 3 is an indication that the flux of high-order Balmer-line photons is lower than the prediction, which can happen in the presence of a dense layer of recombining plasma. In this case, indeed, Equation (2) would be modified in as
I u l = 1 4 π h c λ u l A u l 0 s N u e k l u s d s
where
k l u = N l σ l u
is the line absorption coefficient, controlled by the density of ions in the lower level N l and the line photon absorption cross-section σ l u . Under typical nebular conditions, this would be k l u < < 1 for any l > 1 ; however, in the presence of a thick layer of ionized plasma, such as that responsible for the observed absorption in the soft X-ray spectrum, which has an estimated column density of N C = 4.896 × 10 21 cm 2 , this could no longer be negligible. Under such circumstances, indeed, we expect the lower level of the Balmer series to be overpopulated by recombination processes and by Ly α photon trapping. If, therefore, this X-ray absorber is located outside the BLR, it could very likely also be responsible for the absorption of Balmer photons.
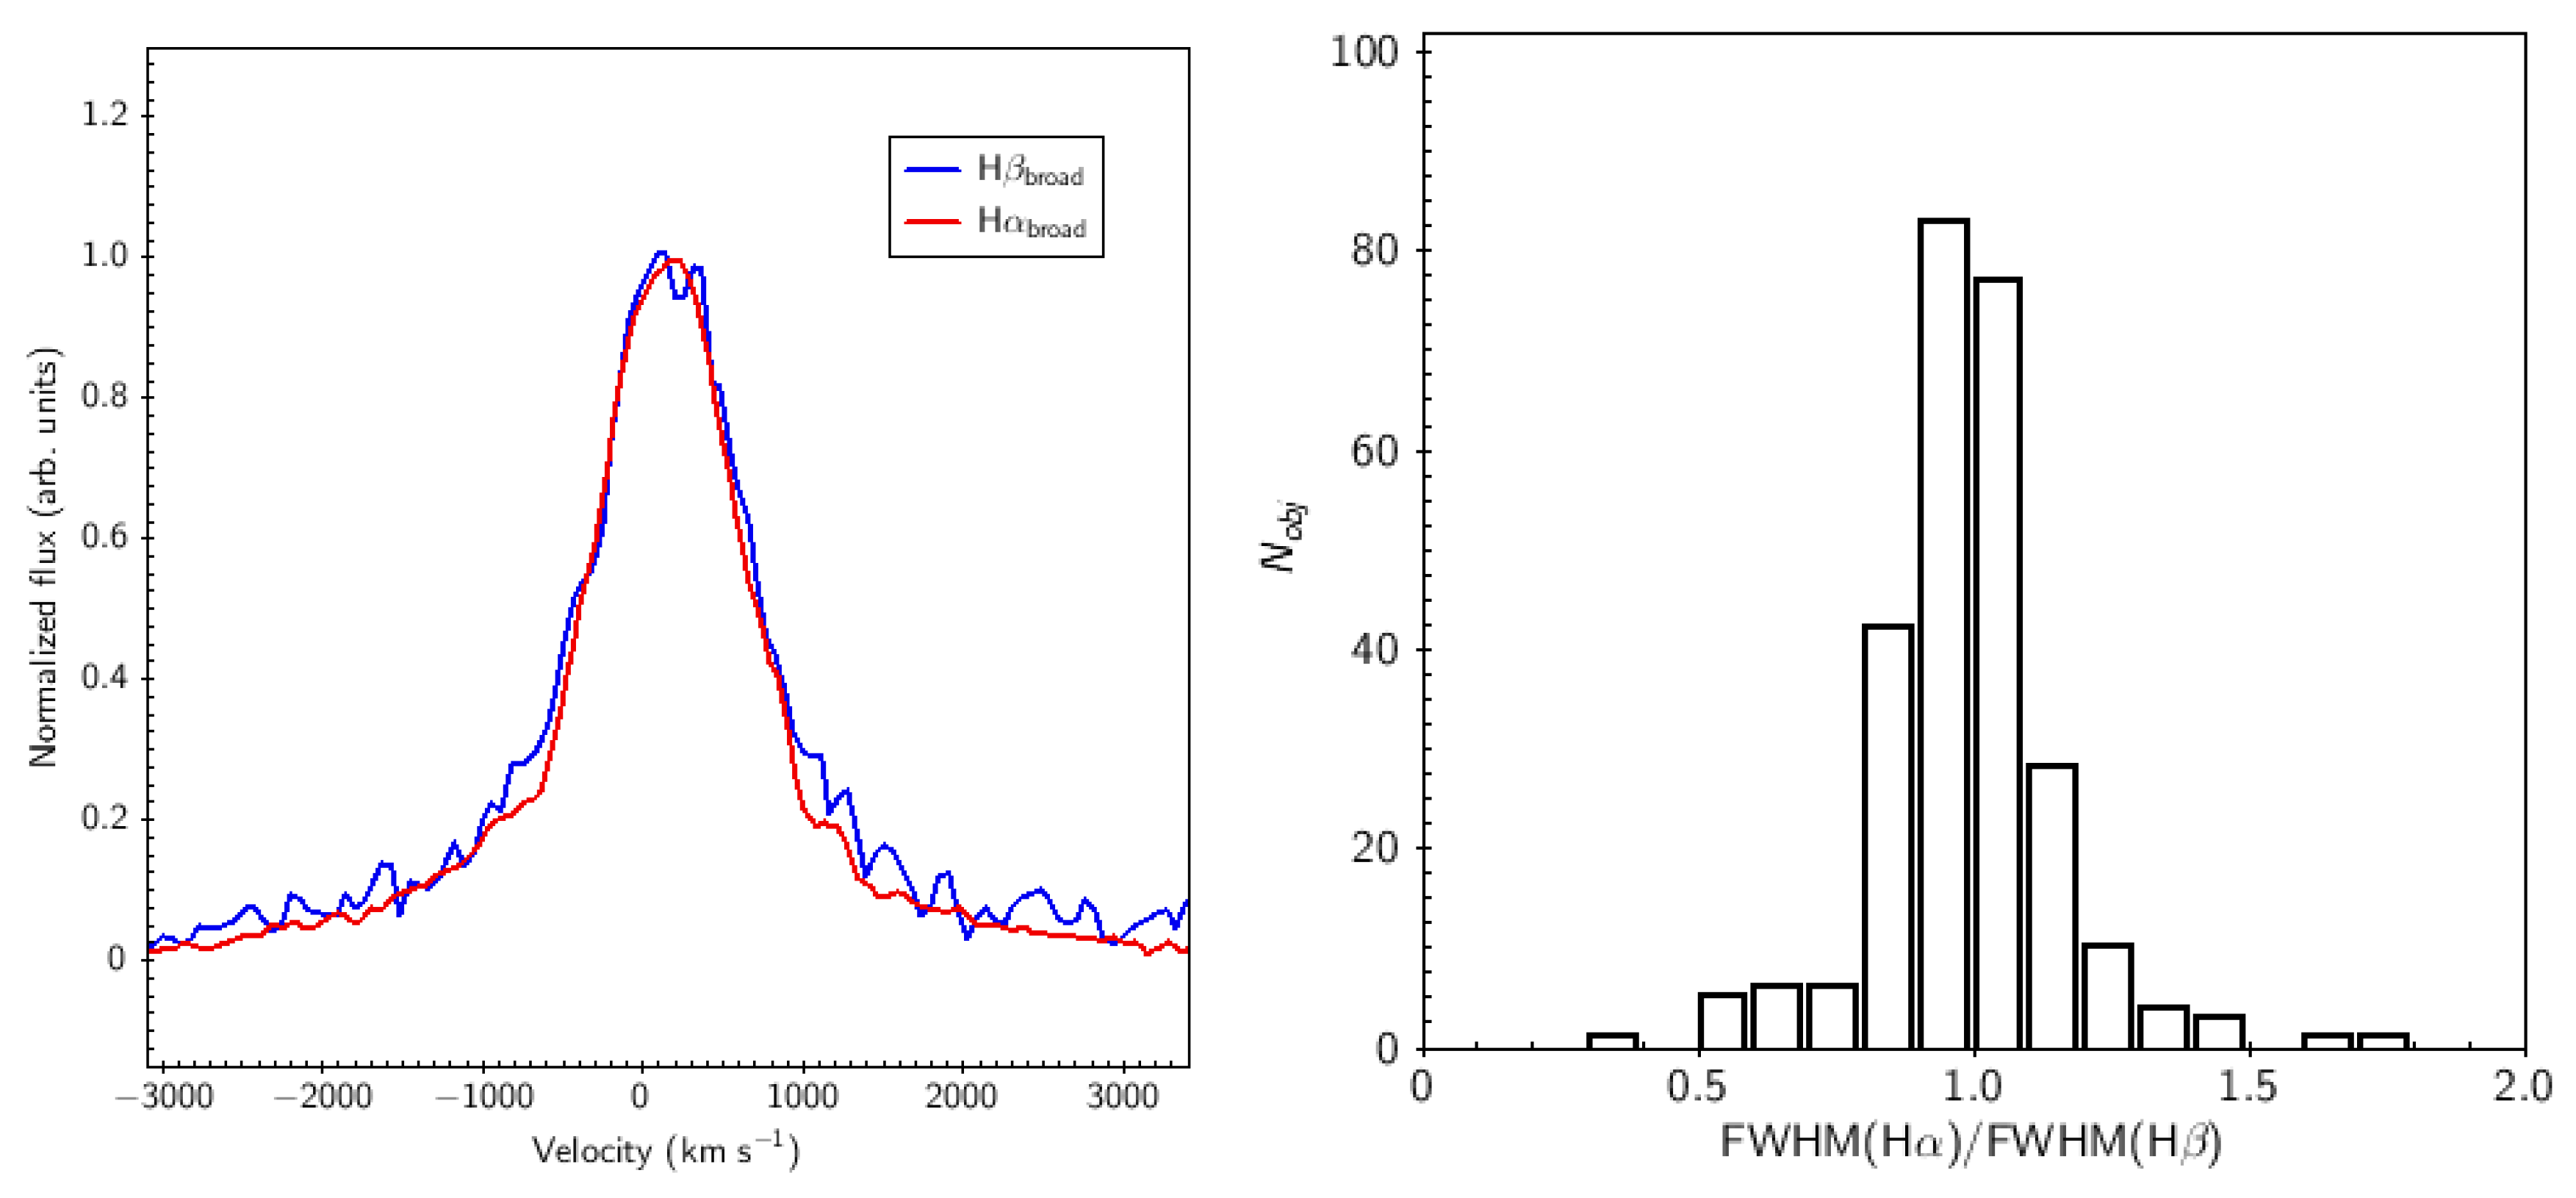
To further explore the possibility that the presence of ionized gas layers could affect the broad emission lines, we began an investigation into the Balmer-line profiles in the broad component of the spectra of a sample of narrow-line Seyfert 1 galaxies (NLS1s), selected from the SDSS Data Release 7 [18]. Because of the relatively small width of their broad-line components (FWHM H β < 2000 km s 1 [19]), the profiles of these lines are largely unaffected by blends with other broad lines, although the narrow components are still to be accounted for. These, however, are much simpler to model, taking the narrow forbidden lines of [O III] as templates to constrain their widths and to be subtracted from the global profiles. By taking the broad-line components in a velocity scale, we are able to compare the resulting profiles, as illustrated in Figure 4. Using a narrow emission-line width fixed at 0.75 times the width of [O III]  λ 5007 , in order to account for the larger velocity dispersion of the high-ionization gas [20], we modeled the narrow components of H β , H α and the [N II]  λ λ 6548 , 6583 doublet, attempting to isolate the broad emission-line profiles. Regarding the resulting FWHM of H α and H β , we find that most of the line profiles are very similar, favoring the interpretation of an optically thin gas, although we still observe deviations from this behaviour. It has already been noted that the profiles of these lines can be different in some objects and that they may even exhibit different reverberation lags [21,22]. This could point towards a displacement of their emission sites or to a relevant role of dust absorption in the central regions of the source [23,24], as there is convincing evidence that a substantial amount of dust can exist in the central regions of AGNs, at smaller scales than the NLR [25].

3. Discussion

The processes that occur in the unresolved central regions of AGNs leave characteristic signatures in the emission and absorption components of the observed radiation, and they also control which parts of the source are visible. Although a preliminary analysis of the relationships existing between multi-frequency data and optical spectra argue in favor of the unified model, a systematic study that collects the huge amount of available observational material still has to be carried out. This type of investigation is highly desirable because of the invaluable constraints that it could place on the nature and evolution of the innermost structures of AGNs, but it presents obvious difficulties related to the amount of data that should be considered. With our work, we present a technique to select different types of AGNs, with available spectro-photometric measurements, and we provide some examples of how the comparison of their spectra with the overall SED lead to supporting the unified picture, as well as to the intriguing possibility that SEDs built on the basis of public data could be used to select targets for follow-up spectroscopy or even to attempt preliminary classifications.
A particularly interesting result is that based on the combination of optical and X-ray spectroscopic observations. In the presence of a significant layer of ionized plasma, such as that observed in the X-ray spectrum of PG 1114 + 445, optical depth effects become important for determining the relative strengths of the recombination lines. In particular, these could explain the various emission-line intensity ratios that are known to deviate significantly from the standard recombination predictions in Type 1 sources. A substantial increase in optical depth gives rise to two important effects. On the one hand, the H α photon has a larger absorption cross-section with respect to higher-order Balmer photons. On the other hand, it corresponds to a transition between two adjacent levels and, therefore, has a smaller probability to decay through other spontaneous transition channels, with respect to higher-order Balmer photons. Therefore, an increase in the line optical depth might lead to a reduction of the high-order Balmer line intensities with respect to H α , but H α could averagely emerge from an outer layer of the line-emitting region. In a dynamical configuration dominated by Keplerian motions, this would imply a narrower line profile. On the other hand, the role played by dust in the emission-line regions would possibly lead to the opposite result, suppressing the short-wavelength, high-order emission lines more severely than H α , therefore favoring an enhancement of this line from deeper regions. Comparing the measurements of the width of the broad emission-line profiles, as illustrated in Figure 4, shows that neither effect is likely to severely affect the emission in the vast majority of sources, although some exceptions may still exist. This result favors the possibility that the optically thin interpretation can be reasonably applied to the broad Balmer lines, suggesting that only a small amount of material should lie along the path of the photons. We can therefore conclude that a thorough investigation of the line intensity ratios along the profiles, which requires data with very high signal-to-noise ratios, will certainly provide further insight into the as yet not completely understood problem of the BLR structure.

4. Materials and Methods

The data and results presented in this paper are based on publicly available services and databases, such as the VizieR catalogue service1 and the SDSS SkyServer2. The plots have been produced with TOPCAT3 [26] and XSPEC4 software. Most of the illustrated measurements, involving line intensities and photometric colors, were directly extracted from public databases using their standard Web interfaces. Exceptions to the illustrated picture are the following:
  • Measurements of emission-line normalized intensities were obtained from public SDSS spectra after extracting the BLR contribution by means of multi-Gaussian fits of the observed line profiles performed with IRAF5.
  • Measurements of the ionized-plasma column density, obtained through XSPEC models combining a power-law emission, a soft X-ray thermal excess, an absorption contribution from neutral gas constrained by the H I column density within the Milky Way and an ionized absorber, applied to a 40 ks observation carried out by XMM Newton and reduced with the Science Analysis Software (SAS), version 10.
  • The models of SED in multi-frequency AGN data, obtained by applying Levemberg–Marquardt non-linear χ 2 minimization to combinations of cut-off power laws and black-body contributions.
Table 1 contains a summary of the data sources from which we obtained the SED points, while Table 2 reports a summary of the parameters used in the spectral energy distribution (SED) fitting models.

Acknowledgments

Funding for this research program has been provided by the Department of Physics and Astronomy of the University of Padua and by the European Space Agency (ESA), under Express Procurement Contract No. 4000111138/14/NL/CB/gp. Additional support from ASTROMUNDUS mobility grants iss also gratefully acknowledged. Funding for the Sloan Digital Sky Survey IV has been provided by the Alfred P. Sloan Foundation, the U.S. Department of Energy Office of Science, and the Participating Institutions. SDSS-IV acknowledges support and resources from the Center for High-Performance Computing at the University of Utah. The SDSS Web site is www.sdss.org; SDSS-IV is managed by the Astrophysical Research Consortium for the Participating Institutions of the SDSS Collaboration including the Brazilian Participation Group, the Carnegie Institution for Science, Carnegie Mellon University, the Chilean Participation Group, the French Participation Group, Harvard-Smithsonian Center for Astrophysics, Instituto de Astrofísica de Canarias, the Johns Hopkins University, the Kavli Institute for the Physics and Mathematics of the Universe (IPMU)/University of Tokyo, Lawrence Berkeley National Laboratory, Leibniz Institut für Astrophysik Potsdam (AIP), Max-Planck-Institut für Astronomie (MPIA Heidelberg), Max-Planck-Institut für Astrophysik (MPA Garching), Max-Planck-Institut für Extraterrestrische Physik (MPE), National Astronomical Observatories of China, New Mexico State University, New York University, the University of Notre Dame, Observatário Nacional / MCTI, the Ohio State University, Pennsylvania State University, Shanghai Astronomical Observatory, United Kingdom Participation Group, Universidad Nacional Autónoma de México, the University of Arizona, the University of Colorado Boulder, the University of Oxford, the University of Portsmouth, the University of Utah, the University of Virginia, the University of Washington, the University of Wisconsin, Vanderbilt University, and Yale University. This research has made use of the VizieR catalogue access tool, CDS, Strasbourg, France. The original description of the VizieR service was published in A&AS 143, 23; This work is based on observations collected with the 1.22 m Galileo telescope of the Asiago Astrophysical Observatory, operated by the Department of Physics and Astronomy “G. Galilei” of the University of Padova. We thank the reviewers for useful suggestions leading to the improvement of this work.

Author Contributions

G.L.M. is the contribution speaker, the main author of the text and the investigator of AGN multi-frequency properties; M.B. adapted the multi-frequency archive with timing capabilities; S.C. works on samples of NLS1 galaxies; A.C. contributed to the selection of all emission-line spectra with diagnostic lines from SDSS Data Release 14; S.C. supervised spectroscopic data reduction procedures; E.C. investigated advanced models of NLR emission lines; V.C. selected and analyzed the SDSS DR7 sample of NLS1; M.F. developed models of NLR structure; S.M. worked on multiple Gaussian fits and intensity ratios of optical lines; P.R. conceived the multi-frequency AGN archive and supervised the physical interpretation of optical spectra.

Conflicts of Interest

The authors declare no conflict of interest.

Abbreviations

The following abbreviations are used in this manuscript:
AGNActive galactic nucleus
BLRBroad-line region
FWHMFull width at half maximum
NGCNew General Catalogue
NLRNarrow-line region
PLTEPartial local thermodynamic equilibrium
SEDSpectral energy distribution

References

  1. Blandford, R.D. Black hole models of quasars. In Quasars; Swarup, G., Kapahi, V.K., Eds.; D. Reidel Publishing Co.: Dordrecht, The Netherlands, 1986; pp. 359–369. [Google Scholar]
  2. Seyfert, C.K. Nuclear Emission in Spiral Nebulae. Astrophys. J. 1943, 97, 28–40. [Google Scholar] [CrossRef]
  3. Elvis, M.; Wilkes, B.J.; McDowell, J.C.; Green, R.F.; Bechtold, J.; Willner, S.P.; Oey, M.S.; Polomski, E.; Cutri, R. Atlas of quasar energy distributions. Astrophys. J. Suppl. 1994, 95, 1–68. [Google Scholar] [CrossRef]
  4. Khachikian, E.Y.; Weedman, D.W. An atlas of Seyfert galaxies. Astrophys. J. 1974, 192, 581–589. [Google Scholar] [CrossRef]
  5. Antonucci, R.R.J.; Miller, J.S. Spectropolarimetry and the nature of NGC 1068. Astrophys. J. 1985, 297, 621–632. [Google Scholar] [CrossRef]
  6. Antonucci, R. Unified models for active galactic nuclei and quasars. Ann. Rev. Astron. Astrophys. 1993, 31, 473–521. [Google Scholar] [CrossRef]
  7. Urry, C.M.; Padovani, P. Unified Schemes for Radio-Loud Active Galactic Nuclei. Publ. Astron. Soc. Pac. 1995, 107, 803–845. [Google Scholar] [CrossRef]
  8. Baldwin, J.A.; Phillips, M.M.; Terlevich, R. Classification parameters for the emission-line spectra of extragalactic objects. Publ. Astron. Soc. Pac. 1981, 93, 15–19. [Google Scholar] [CrossRef]
  9. Veilleux, S.; Osterbrock, D.E. Spectral classification of emission-line galaxies. Astrophys. J. Suppl. 1987, 63, 295–310. [Google Scholar] [CrossRef]
  10. York, D.G.; Adelman, J.; Anderson, J.E., Jr.; Anderson, S.F.; Annis, J.; Bahcall, N.A.; Bakken, J.A.; Barkhouser, R.; Bastian, S.; Berman, E.; et al. The Sloan Digital Sky Survey: Technical Summary. Anim. Jam 2000, 120, 1579–1587. [Google Scholar] [CrossRef]
  11. Blanton, M.R.; Bershady, M.A.; Abolfathi, B.; Albareti, F.D.; Allende Prieto, C.; Almeida, A.; Alonso-García, J.; Anders, F.; Anderson, S.F.; Andrews, B.; et al. Sloan Digital Sky Survey IV: Mapping the Milky Way, Nearby Galaxies, and the Distant Universe. Anim. Jam 2017, 154, 28–62. [Google Scholar] [CrossRef]
  12. Kewley, L.J.; Groves, B.; Kauffmann, G.; Heckman, T. The host galaxies and classification of active galactic nuclei. Mon. Not. R. Astron. Soc. 2006, 372, 961–976. [Google Scholar] [CrossRef]
  13. Vaona, L.; Ciroi, S.; Di Mille, F.; Cracco, V.; La Mura, G.; Rafanelli, P. Spectral properties of the narrow-line region in Seyfert galaxies selected from the SDSS-DR7. Mon. Not. R. Astron. Soc. 2012, 427, 1266–1283. [Google Scholar] [CrossRef]
  14. Richards, G.T.; Fan, X.; Newberg, H.J.; Strauss, M.A.; Vanden Berk, D.E.; Schneider, D.P.; Yanny, B.; Boucher, A.; Burles, S.; Frieman, J.A.; et al. Spectroscopic Target Selection in the Sloan Digital Sky Survey: The Quasar Sample. Anim. Jam 2002, 123, 2945–2975. [Google Scholar] [CrossRef]
  15. Schneider, D.P.; Richards, G.T.; Hall, P.B.; Strauss, M.A.; Anderson, S.F.; Boroson, T.A.; Ross, N.P.; Shen, Y.; Brandt, W.N.; Fan, X.; et al. The Sloan Digital Sky Survey Quasar Catalogue. V. Seventh Data Release. Anim. Jam 2010, 139, 2360–2373. [Google Scholar]
  16. Moustakas, J.; Kennicutt, R.C., Jr. An Integrated Spectrophotometric Survey of Nearby Star-forming Galaxies. Astrophys. J. Suppl. 2006, 164, 81–98. [Google Scholar] [CrossRef]
  17. Popović, L.Č. Balmer Lines as Diagnostics of Physical Conditions in Active Galactic Nuclei Broad Emission Line Regions. Astrophys. J. 2003, 599, 140–146. [Google Scholar] [CrossRef]
  18. Cracco, V.; Ciroi, S.; Berton, M.; Di Mille, F.; Foschini, L.; La Mura, G.; Rafanelli, P. A spectroscopic analysis of a sample of narrow-line Seyfert 1 galaxies selected from the Sloan Digital Sky Survey. Mon. Not. R. Astron. Soc. 2016, 462, 1256–1280. [Google Scholar] [CrossRef]
  19. Osterbrock, D.E.; Pogge, R.W. The spectra of narrow-line Seyfert 1 galaxies. Astrophys. J. 1985, 297, 166–176. [Google Scholar] [CrossRef]
  20. Berton, M.; Foschini, L.; Ciroi, S.; Cracco, V.; La Mura, G.; Lister, M.L.; Mathur, S.; Peterson, B.M.; Richards, J.L.; Rafanelli, P. Parent population of flat-spectrum radio-loud narrow-line Seyfert 1 galaxies. Automob. Assoc. 2015, 578, A28. [Google Scholar] [CrossRef]
  21. Shapovalova, A.I.; Popović, L.Č.; Burenkov, A.N.; Chavushyan, V.H.; Ilić, D.; Kollatschny, W.; Kovačević, A.; Bochkarev, N.G.; Carrasco, L.; León-Tavares, J.; et al. Spectral optical monitoring of 3C 390.3 in 1995–2007. I. Light curves and flux variation in the continuum and broad lines. Automob. Assoc. 2010, 517, A42. [Google Scholar]
  22. Shapovalova, A.I.; Popović, L.Č.; Burenkov, A.N.; Chavushyan, V.H.; Ilić, D.; Kovačević, A.; Bochkarev, N.G.; León-Tavares, J. Long-term variability of the optical spectra of NGC 4151. II. Evolution of the broad Hα and Hβ emission-line profiles. Automob. Assoc. 2010, 509, A106. [Google Scholar]
  23. Gaskell, C.M. The case for cases B and C: Intrinsic hydrogen line ratios of the broad-line region of active galactic nuclei, reddenings, and accretion disc sizes. Mon. Not. R. Astron. Soc. 2017, 467, 226–238. [Google Scholar]
  24. Dong, X.; Wang, T.; Wang, J.; Yuan, W.; Zhou, H.; Dai, H.; Zhang, K. Broad-line Balmer decrements in blue active galactic nuclei. Mon. Not. R. Astron. Soc. 2008, 383, 581–592. [Google Scholar] [CrossRef]
  25. Heard, C.Z.P.; Gaskell, C.M. The location of the dust causing internal reddening of active galactic nuclei. Mon. Not. R. Astron. Soc. 2016, 461, 4227–4232. [Google Scholar] [CrossRef]
  26. Taylor, M.B. TOPCAT & STIL: Starlink Table/VOTable Processing Software. In Astronomical Data Analysis Software and Systems XIV; Shopbell, P., Britton, M., Ebert, R., Eds.; Astronomical Society of the Pacific Conference Series: San Francisco, CA, USA, 2003; pp. 29–33. [Google Scholar]
  27. Condon, J.J.; Cotton, W.D.; Greisen, E.W.; Yin, Q.F.; Perley, R.A.; Taylor, G.B.; Broderick, J.J. The NRAO VLA Sky Survey. Anim. Jam 1998, 115, 1693–1716. [Google Scholar] [CrossRef]
  28. Helou, G.; Walker, W. (Eds.) Infrared Astronomical Satellite (IRAS) Catalogs and Atlases. Volume 7: The Small Scale Structure Catalog; NASA Scientific and Technical Information Division: Washington, DC, USA, 1988.
  29. Cutri, R.M.; Wright, E.L.; Conrow, T.; Bauer, J.; Benford, D.; Brandenburg, H.; Dailey, J.; Eisenhardt, P.R.M.; Evans, T.; Fajardo-Acosta, S.; et al. Explanatory Supplement to the WISE All-Sky Data Release Products. Available online: http://wise2.ipac.caltech.edu/docs/release/allsky/expsup/ (accessed on 12 March 2015).
  30. Skrutskie, M.F.; Cutri, R.M.; Stiening, R.; Weinberg, M.D.; Schneider, S.; Carpenter, J.M.; Beichman, C.; Capps, R.; Chester, T.; Elias, J.; et al. The Two Micron All Sky Survey (2MASS). Anim. Jam 2006, 131, 1163–1183. [Google Scholar] [CrossRef]
  31. Bianchi, L.; Herald, J.; Efremova, B.; Girardi, L.; Zabot, A.; Marigo, P.; Conti, A.; Shiao, B. GALEX catalogs of UV sources: Statistical properties and sample science applications: Hot white dwarfs in the Milky Way. Astrophys. Space Sci. 2011, 335, 161–169. [Google Scholar] [CrossRef]
  32. Rosen, S.R.; Webb, N.A.; Watson, M.G.; Ballet, J.; Barret, D.; Braito, V.; Carrera, F.J.; Ceballos, M.T.; Coriat, M.; Della Ceca, R.; et al. The XMM-Newton serendipitous survey. VII. The third XMM-Newton serendipitous source catalogue. Automob. Assoc. 2016, 590, A1. [Google Scholar]
  33. Bird, A.J.; Bazzano, A.; Bassani, L.; Capitanio, F.; Fiocchi, M.; Hill, A.B.; Malizia, A.; McBride, V.A.; Scaringi, S.; Sguera, V.; et al. The Fourth IBIS/ISGRI Soft Gamma-ray Survey Catalog. Astrophys. J. Suppl. 2010, 186, 1–9. [Google Scholar] [CrossRef]
  34. Acero, F.; Ackermann, M.; Ajello, M.; Albert, A.; Atwood, W.B.; Axelsson, M.; Baldini, L.; Ballet, J.; Barbiellini, G.; Bastieri, D.; et al. Fermi Large Area Telescope Third Source Catalog. Astrophys. J. Suppl. 2015, 218, 23. [Google Scholar] [CrossRef]
1.
2.
3.
4.
5.
Figure 1. Distribution of active galactic nuclei (AGNs; blue points) and star formation (red points) powered objects with emission-line spectra on the [O III] λ 5007 /H β vs. [N II] λ 6583 /H α diagnostic diagram (left panel), on the u r vs g z color–color diagram (middle panel) and on the three-dimensional parameter space combining the two-color photometry with the [O III] λ 5007 /H β diagnostic ratio. The distribution in the three-dimensional parameter space illustrates how Type 1 AGNs are best identified among line-emitting sources by means of photometric criteria, while Type 2 sources can be distinguished on the basis of their spectral properties.
Atoms 05 00043 g001
Figure 2. Examples of spectral energy distribution (SED) models (left panel) and optical spectra (right panel) for the prototypical Type 1 active galactic nucleus (AGN) 3C 273 (blue line and points) and the prototypical Type 2 AGN NGC 1068 (red line and points). The SEDs have been normalized to the same optical V-band magnitude and the models are based on the combination of two cut-off power laws and one black-body contribution. The spectrum of 3C 273 was observed at the Asiago Astrophysical Observatory, while the spectrum of NGC 1068 is taken from literature [16]. Both spectra were taken to rest-frame wavelength scale.
Atoms 05 00043 g002
Figure 3. Suppression of high-order Balmer lines, observed through the normalized intensities of the broad components in the optical spectrum of PG 1114 + 445 (left panel), compared with the soft X-ray spectrum (right panel) obtained from the XMM Newton EPIC instrument (green points) and from the twin MOS cameras (red and black points). The X-ray spectrum is modeled with a power-law spectrum, a soft X-ray thermal excess and an ionized absorber. Absorption from the neutral medium within the Milky Way is also taken into account.
Atoms 05 00043 g003
Figure 4. (Left panel) comparison of the H β (blue) and H α (red) broad line components, after subtraction of the narrow emission lines, plotted in velocity scale and normalized to the same peak intensity in the spectrum of 1RXS J113247.0 + 062626. (Right panel) distribution of the ratio FWHM(H α )/FWHM(H β ) in the broad components of the emission lines from the spectra NLS1 galaxies investigated in [18]. While the distribution is strongly peaked around 1, favoring the interpretation of an optically thin gas, some differences in the line profiles can arise as a consequence of dust absorption or emission-line radiation transfer effects.
Atoms 05 00043 g004
Table 1. Data sources for the selection of multiple-wavelength spectral energy distribution (SED) points.
Instr. / Catalogue log ν (Hz)BandReference
NVSS9.15Radio[27]
IRAS12.48–13.40FIR[28]
WISE13.13–13.94FIR[29]
2MASS14.14–14.38NIR[30]
GALEX15.00–15.30UV[31]
XMM16.86–17.68X-ray[32]
INTEGRAL18.70–19.00Soft γ ray[33]
Fermi/LAT23.00–26.00 γ ray[34]
Table 2. Spectral energy distribution (SED) fitting models.
ObjectFunction log ν min ( a ) log ν max ( a ) Norm.Index ( b ) Temp. χ red 2
3C 273Power law 8.6 13.1 2.30 × 10 18 0.60
Power law 13.1 17.6 1.31 × 10 6 0.31
Power law 17.1 22.6 1.26 × 10 23 0.70
Black body 1.03 × 10 12 25 , 800 K 1.11
NGC 1068Power law 8.5 13.0 2.49 × 10 28 1.52
Power law 12.8 17.5 7.068 × 10 2 0.85
Power law 17.0 24.0 4.82 × 10 13 0.05
Black body 1.04 × 10 4 540 K 1.17
( a ) Logarithm of exponential cut-off frequency given in Hz; ( b ) The power-law index is given according to the notation ν F ν ν α .

