New Los Alamos Opacity Calculations


Los Alamos National Laboratory, Los Alamos, NM 87545, USA
*
Author to whom correspondence should be addressed.
Atoms 2018, 6(2), 32; https://doi.org/10.3390/atoms6020032
Submission received: 5 April 2018
/
Revised: 2 May 2018
/
Accepted: 3 May 2018
/
Published: 4 June 2018
(This article belongs to the Special Issue Atomic and Molecular Opacity Data for Astrophysics)
Abstract
:In 2015 Los Alamos National Laboratory (LANL) released a new set of OPLIB opacity tables for the elements hydrogen through zinc. The new LANL opacities are publicly available via our website and are already in use by the astrophysics community. In this contribution, we discuss the extension of our opacity calculations to elements beyond zinc. Such calculations are motivated by potential industrial applications (for elements such as Sn) as well as available experimental data with which to compare our calculations (for Ge and Br). After a short outline of our method for computing opacities for these elements, we make comparisons to available experimental data and find good agreement. Future plans are briefly discussed.
Keywords:
opacity1. Introduction
The importance of accurate and comprehensive sets of opacities to astrophysics can hardly be overstated. The opacity of a material determines the transfer of radiation through the material and as such has a large influence on stellar structure. Los Alamos opacities have been used for many years in stellar modeling [1,2,3] and the recent release of new OPLIB tables [4] provides the latest comprehensive set of tables for hydrogen through zinc. These new opacity tables were used in astrophysical modeling of our Sun and other stars [4,5,6,7,8] as well as in even more recent studies [9]. Several short summaries of our new opacity tables for hydrogen through zinc have recently been published in various proceedings [10,11], and instead of repeating such summaries, we aim instead in this contribution to provide a short description of some recent work by us that attempts to calculate opacities for elements beyond zinc. Such extensions are motivated by the continuing importance of accurate opacities and radiation transport models to other plasma studies found in inertial confinement fusion (ICF) research (e.g., [12,13,14]), industrial plasmas [15], and in the field of magnetic confinement fusion. Some of these fields require models for elements that are not normally important in astrophysics research (such as Sn or W), and it is important to be able to provide accurate opacities for such systems. In this contribution we provide a brief description of our work to calculate opacities for elements beyond Zn.
2. Results
After completion of the opacity tables for H through Zn, we considered the feasibility of extending our tables beyond zinc. This was motivated by recent ICF measurements that use Kr (Z = 36) as a dopant in implosion measurements at the National Ignition Facility (NIF) [12]. A potential Kr opacity table may be useful in helping interpret some of the findings from such measurements. Further motivation was provided by older opacity measurements of Ge and Br, which would allow an important check of our new calculations. We therefore decided to attempt the computation of new opacity tables for the elements Ga through Kr. Although such tables are not yet finalized, below we show various calculations and comparisons to experimental data, where available. We also note that we have embarked on some preliminary studies of the opacity of Sn at temperatures relevant to lithography applications [16], where the importance of accurate atomic structure to the resulting opacity is crucial.
The opacity calculations that we have recently performed for Ga through Kr were made in a very similar manner to the calculations for the transition metals that were discussed in detail previously [4]. We use the Los Alamos suite of atomic physics codes (for an overview, see [17]) to generate atomic data, and the ATOMIC code [17,18,19] to perform the opacity calculations.
All atomic structure calculations were performed using the Los Alamos CATS code [20], a modern version of Cowan’s codes [21]. The calculations were carried out using the semi-relativistic Hartree-Fock, or HFR, option. For the Li-like, He-like and H-like ions of all elements discussed here, we use atomic data generated at a fine-structure level of detail including full configuration-interaction between all configurations. For all other ion stages, we used a mixed-UTA (MUTA) approach [22] for all ions from Be-like through the neutral stage. The MUTA method retains all of the strongest fine-structure lines in a given transition array, which allows an accurate spectral description to be generated from a set of configuration-average populations. This approach allows single-configuration fine-structure detail to be included in a relatively inexpensive computational manner. The generation of atomic data for a full level-resolved calculation is too computationally intensive at present. In the calculations presented here, we retained all fine-structure lines for transition arrays that contained less than lines within the array. We have found that, for almost all conditions of interest, this parameter choice allows essentially all lines of importance to be explicitly included in the bound-bound opacity contribution. A histogram approach that was introduced by [23] to speed up computation of bound-bound contributions to spectra was also modified to work with the MUTA approach and was found to significantly speed up large-scale calculations with essentially no loss in accuracy. The bound-free contribution to the opacities presented here are computed using configuration-average distorted-wave photoionization cross sections calculated using the GIPPER ionization code [24]. We include photoionization contributions between all possible configurations in neighboring ion stages. Free-free opacity contributions and scattering were also included in the same manner as used in our previous opacity calculations [4].
3. Comparison with Experiment
In this section we turn to comparisons of our ATOMIC calculations with a series of opacity measurements. We note that ATOMIC has already been extensively compared to a number of older opacity measurements of Al and Fe [4,25]. Also, while successful comparisons have been made with the first wave of Fe opacity measurements made using the Sandia Z platform [26], comparisons of Fe opacity measurements made using Z at somewhat higher densities and temperatures [27] show large and disturbing differences. While the origin of these differences between theory and experiment remain under intense debate, we hope that ongoing NIF measurements [28] will help shed light on this enduring mystery.
Before continuing, we note that the experimental data presented in this paper were obtained using data extraction techniques from the published papers, since it unfortunately proved impossible to obtain electronic versions of the measured data. This technique may lead to some slight imperfections in the rendering of the published data.
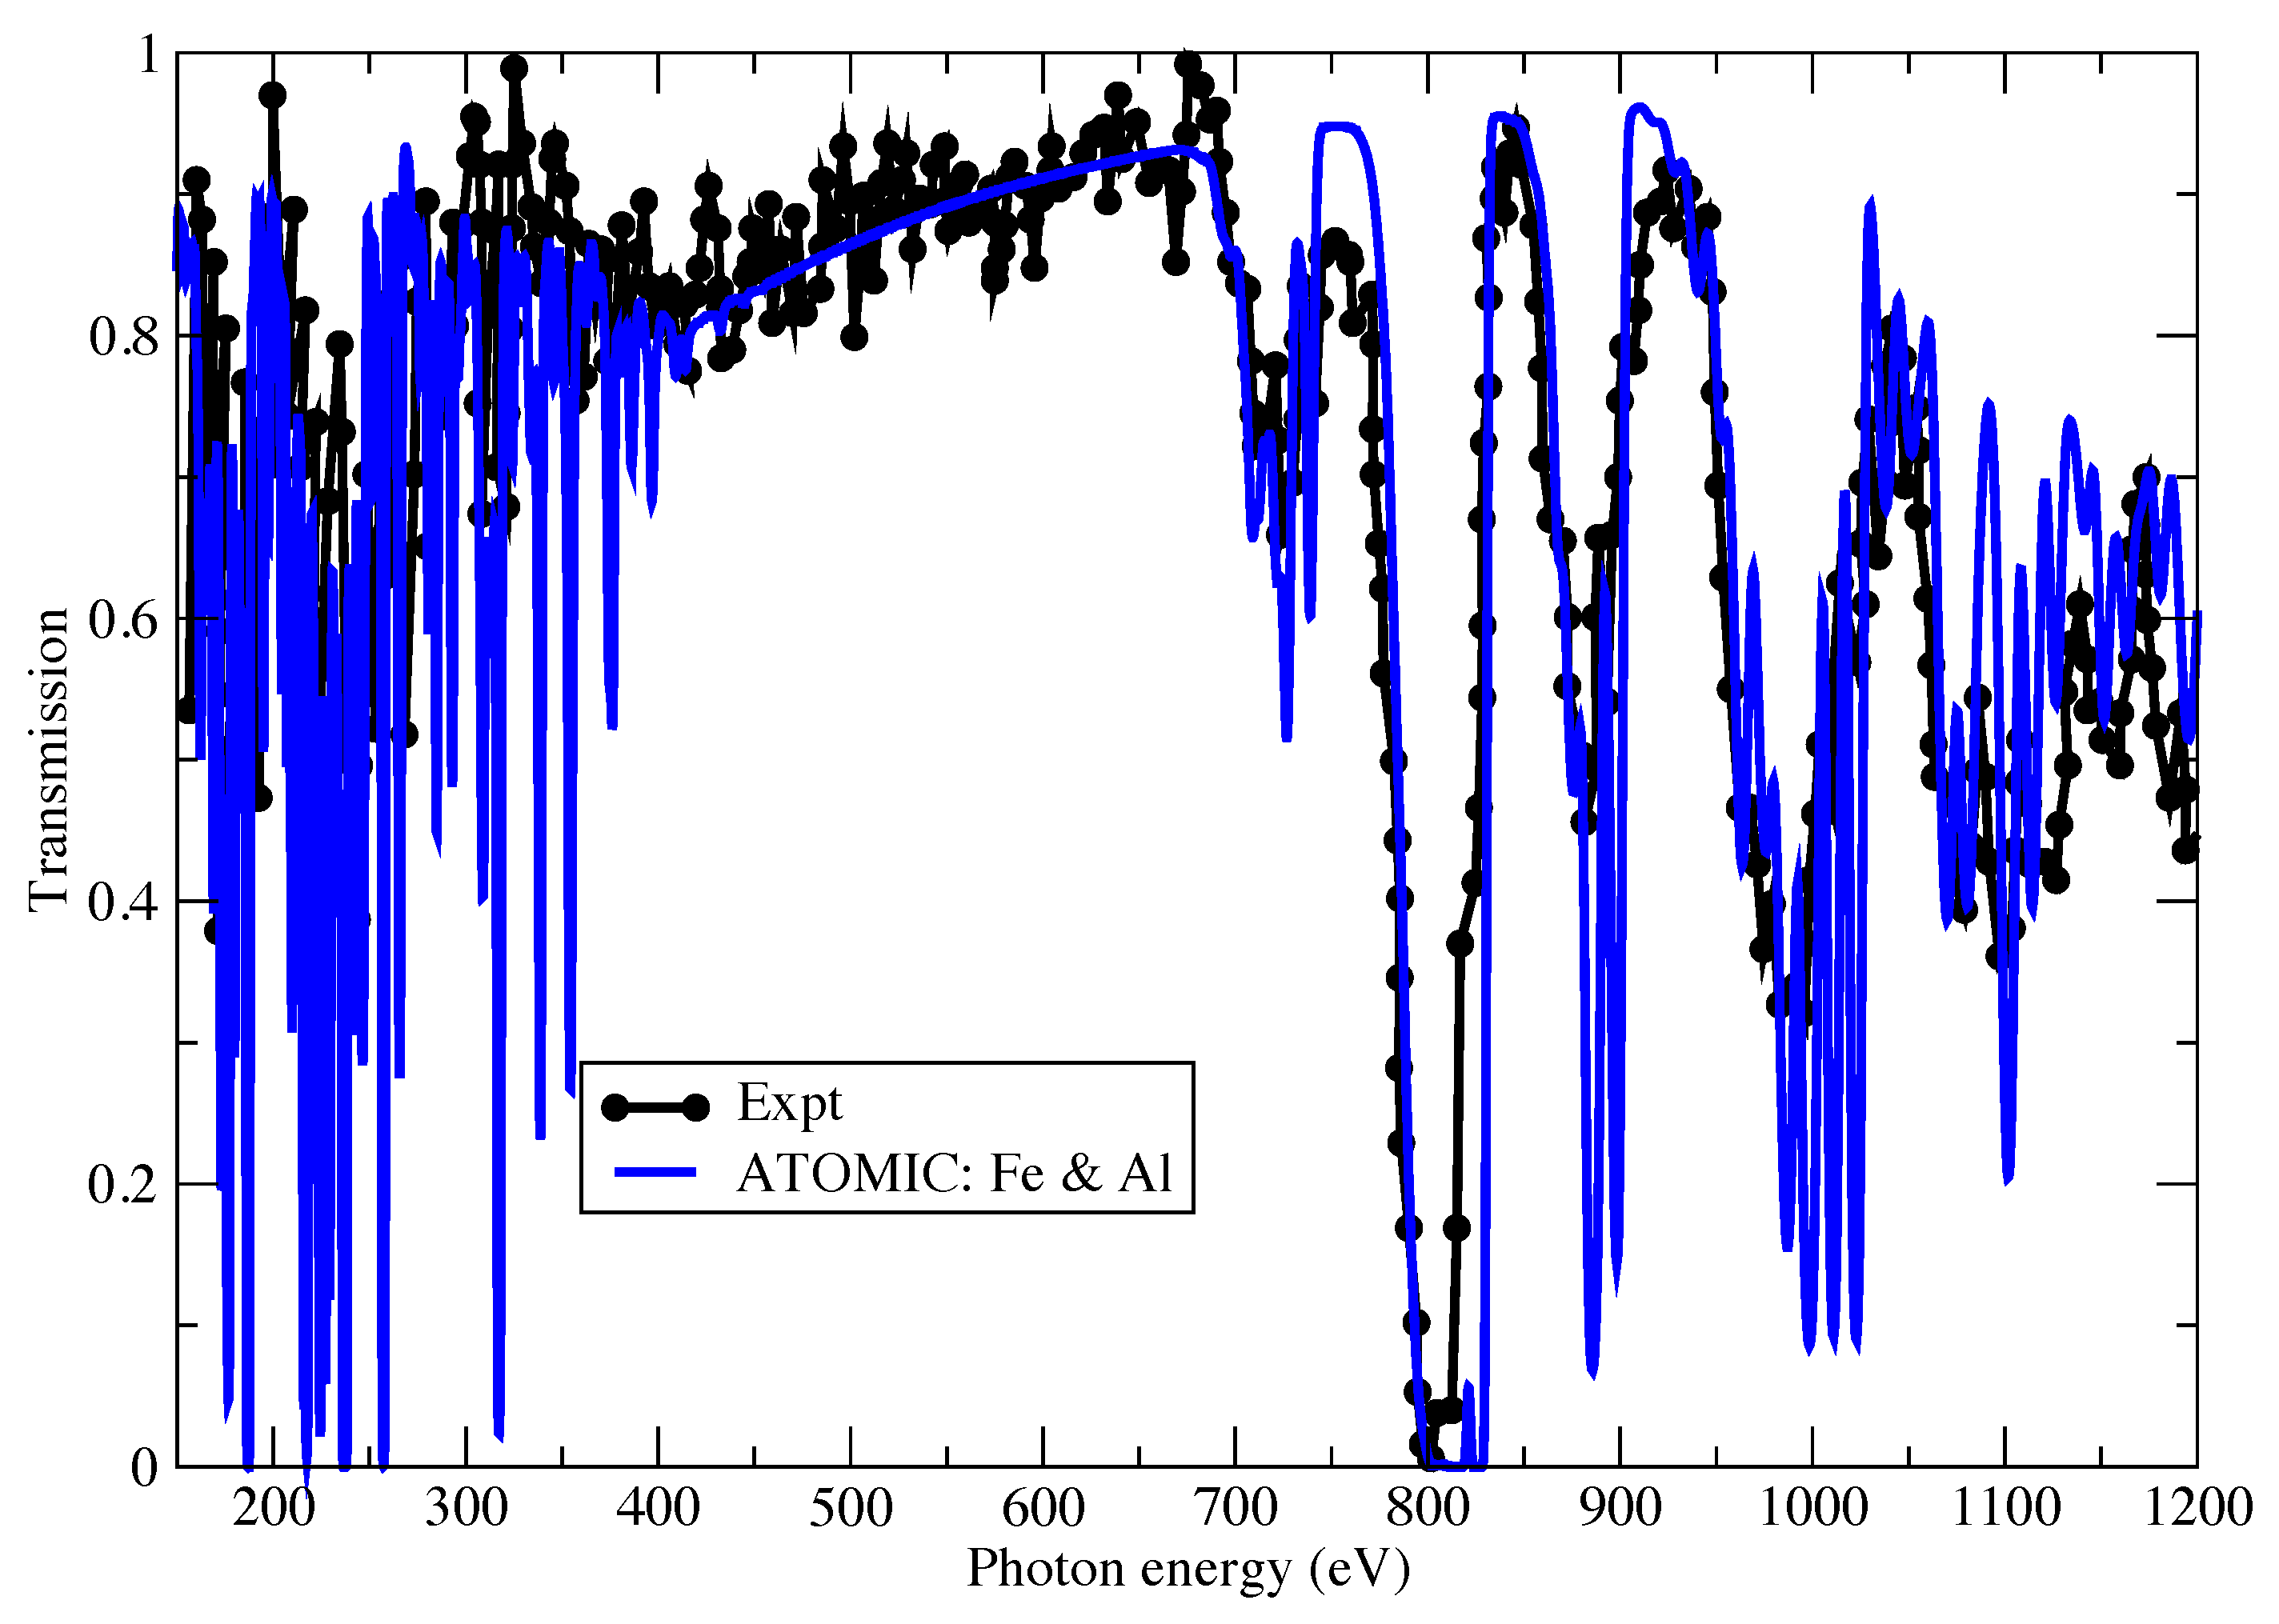
In Figure 1 we compare a Fe opacity measurement made using the SG-II laser facility in China, as published recently [29]. The measurement was actually performed on a Fe and Al layered sample, and the accompanying radiative hydrodynamic simulations that accompanied the experiment indicate a plasma temperature of eV. Figure 1 shows a comparison of the transmission of the Al and Fe computed using ATOMIC compared to the measurement. We note again that the measurement was obtained from the electronic version of the paper using data extraction methods, which results in an imperfect rendering of the published data. However, the agreement between an ATOMIC calculation at 72 eV and mass density of 6 mg/cm and the measured data is very good, with the calculations reproducing all the major features in the measured transmission. The ATOMIC calculation is simply the product of the transmission from the Al and Fe at the conditions indicated. The published experimental data is notable for the wide spectral range that was able to be measured. While bound-bound transitions in Al make some contributions at low photon energies around 250–350 eV, we find that above this energy, the Al contribution to the transmission is only through a featureless bound-free background. The major spectral features at 800 eV and above arise from 2p-3d transitions in mid-ionized Fe (centered around Ne-like and Na-like Fe). We find that the ATOMIC prediction of the position and depth of these features is in good agreement with the measurements.
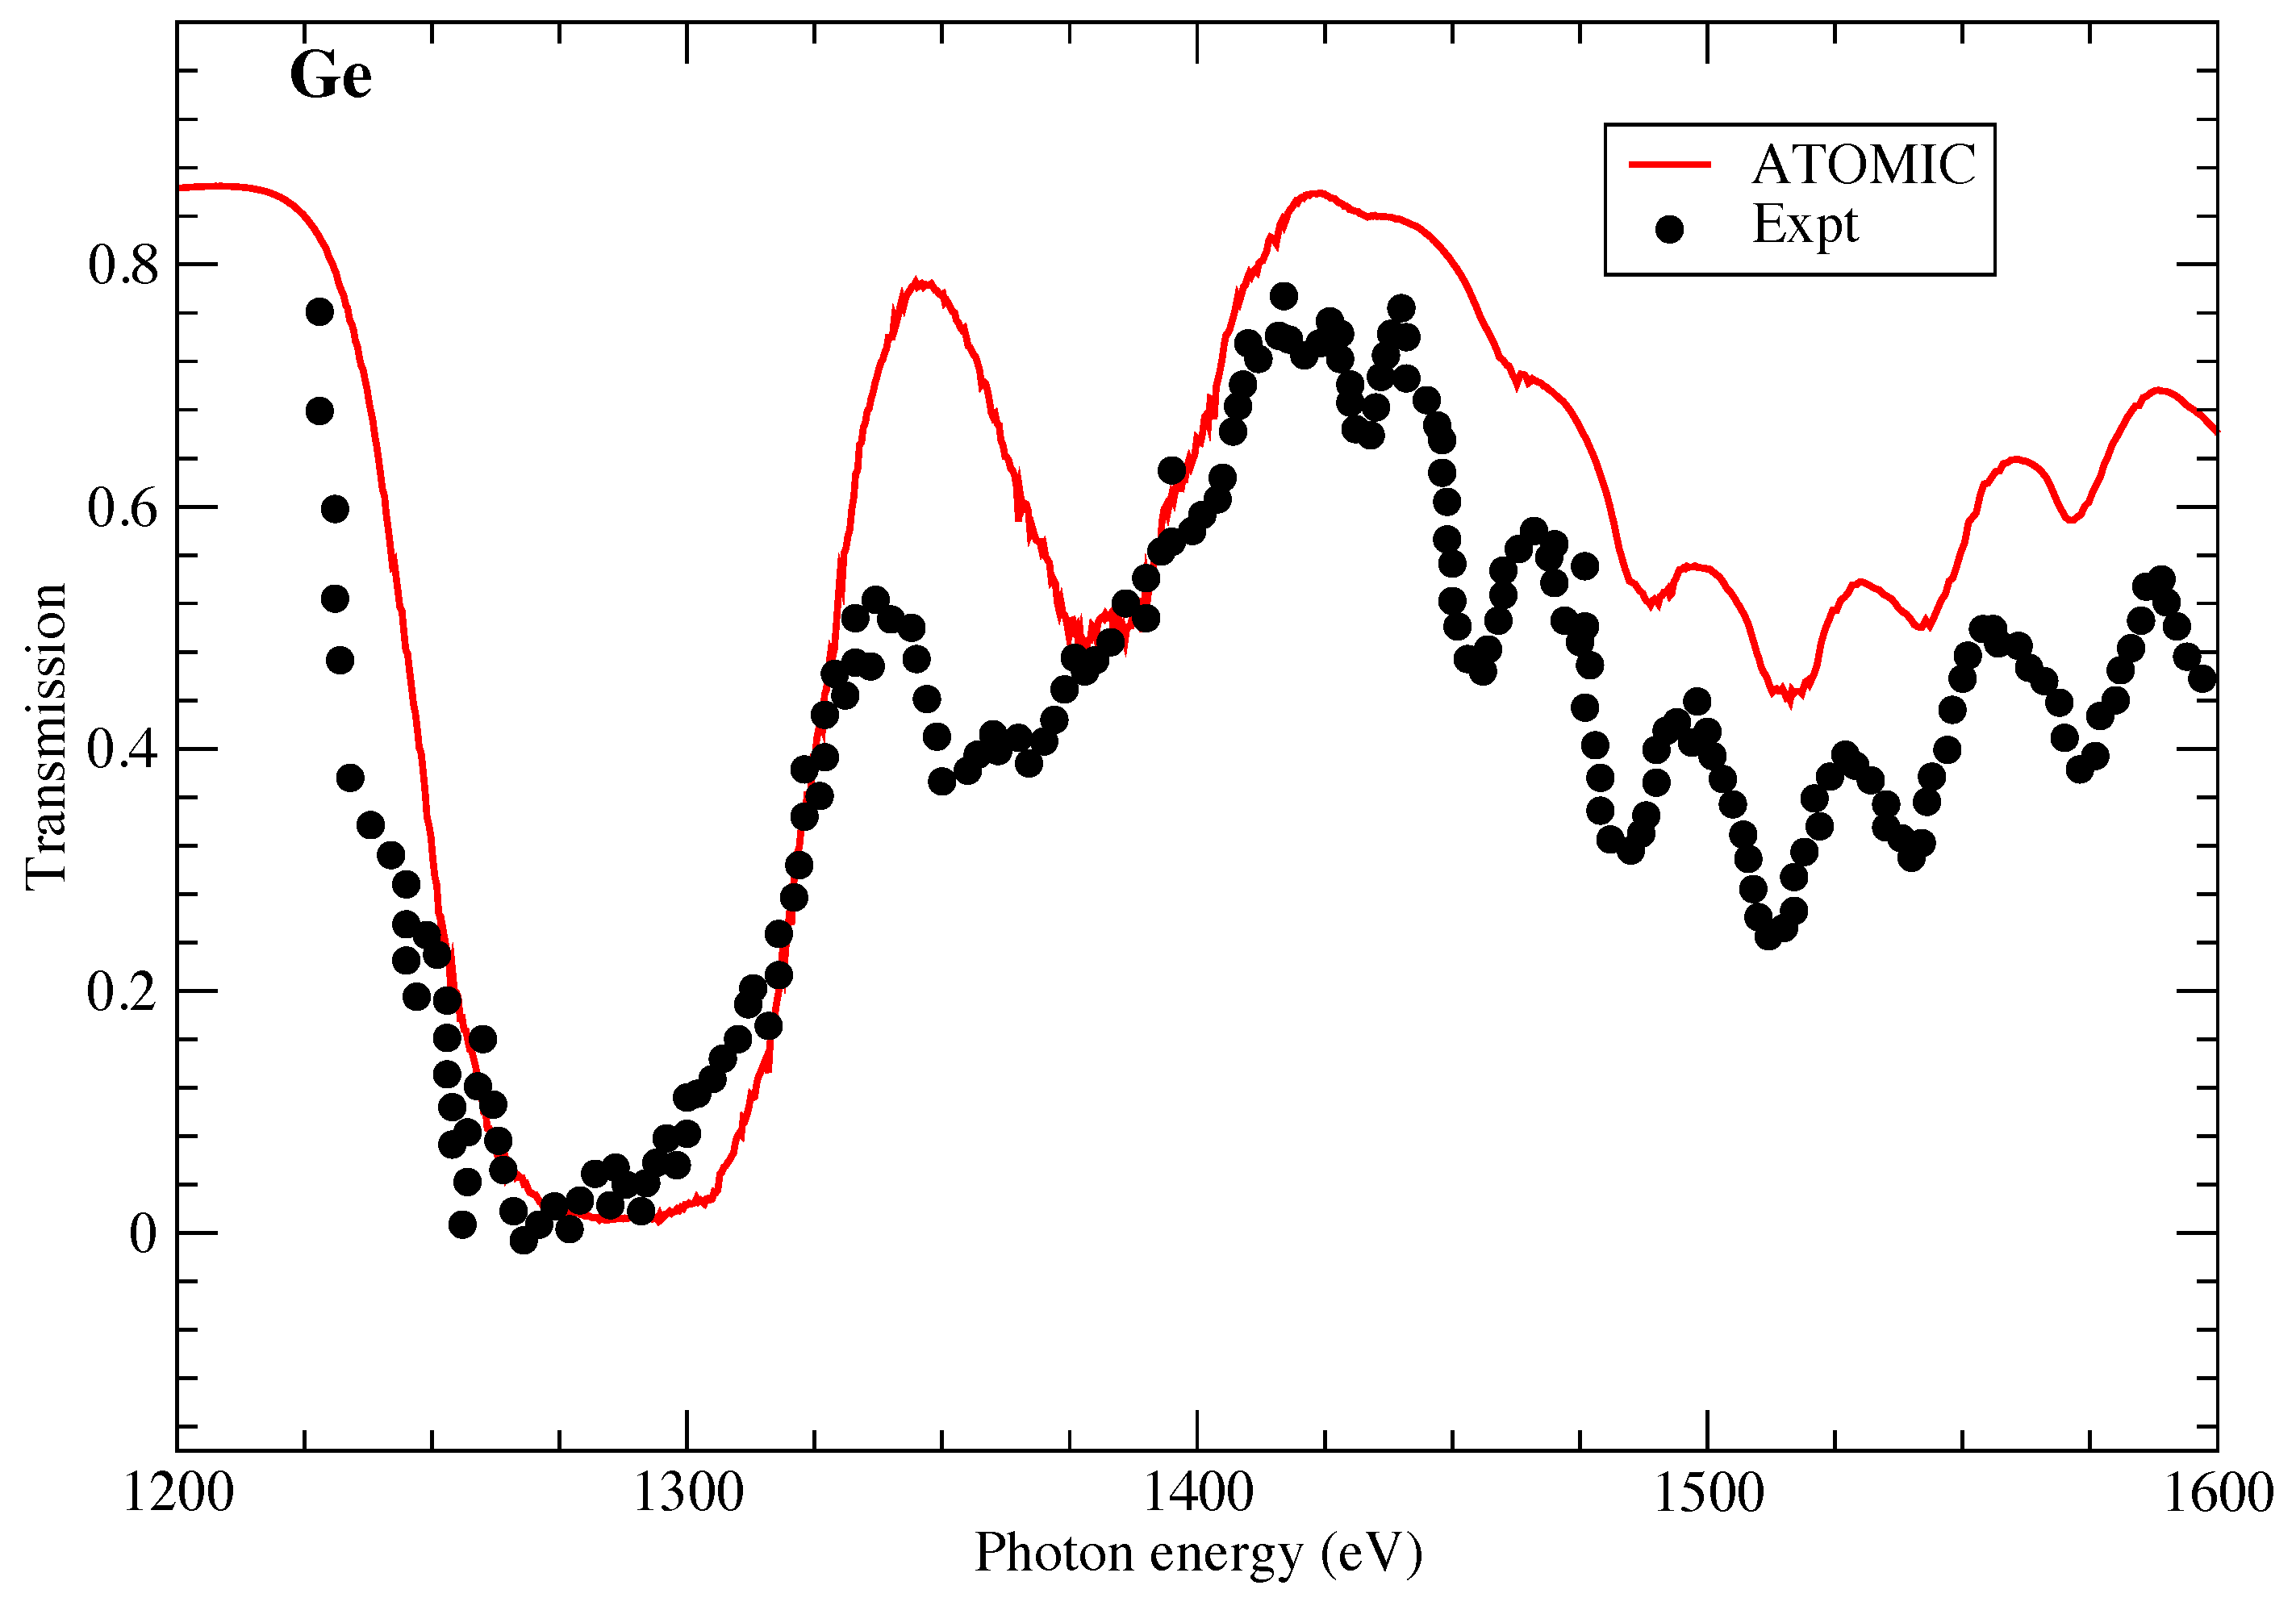
We now turn to comparisons of ATOMIC calculations of the opacity of germanium with experiments performed in the 1990s. The AWE HELEN laser was used to measure Ge opacity in the 1.2 to 1.6 keV photon energy range [30]. The plasma was determined to be at a temperature of 76 eV and mass density of 0.05 g/cm using the NYM hydrocode. Figure 2 presents the comparisons between the ATOMIC calculations and the measured data; we find that ATOMIC reproduces all the main features of the measurement only moderately well. While the ATOMIC calculations accurately reproduce the large transmission dip found around 1.25 keV, the bump in transmission at 1.35 keV is overestimated in the ATOMIC calculations. Also, at higher photon energies, ATOMIC predicts a higher transmission (lower opacity) than found experimentally, although the experimental features are all reproduced by the calculation. ATOMIC calculations at lower temperatures (not shown) find somewhat better agreement for the dip in transmission at 1.35 keV, but poorer agreement in other photon energy ranges.
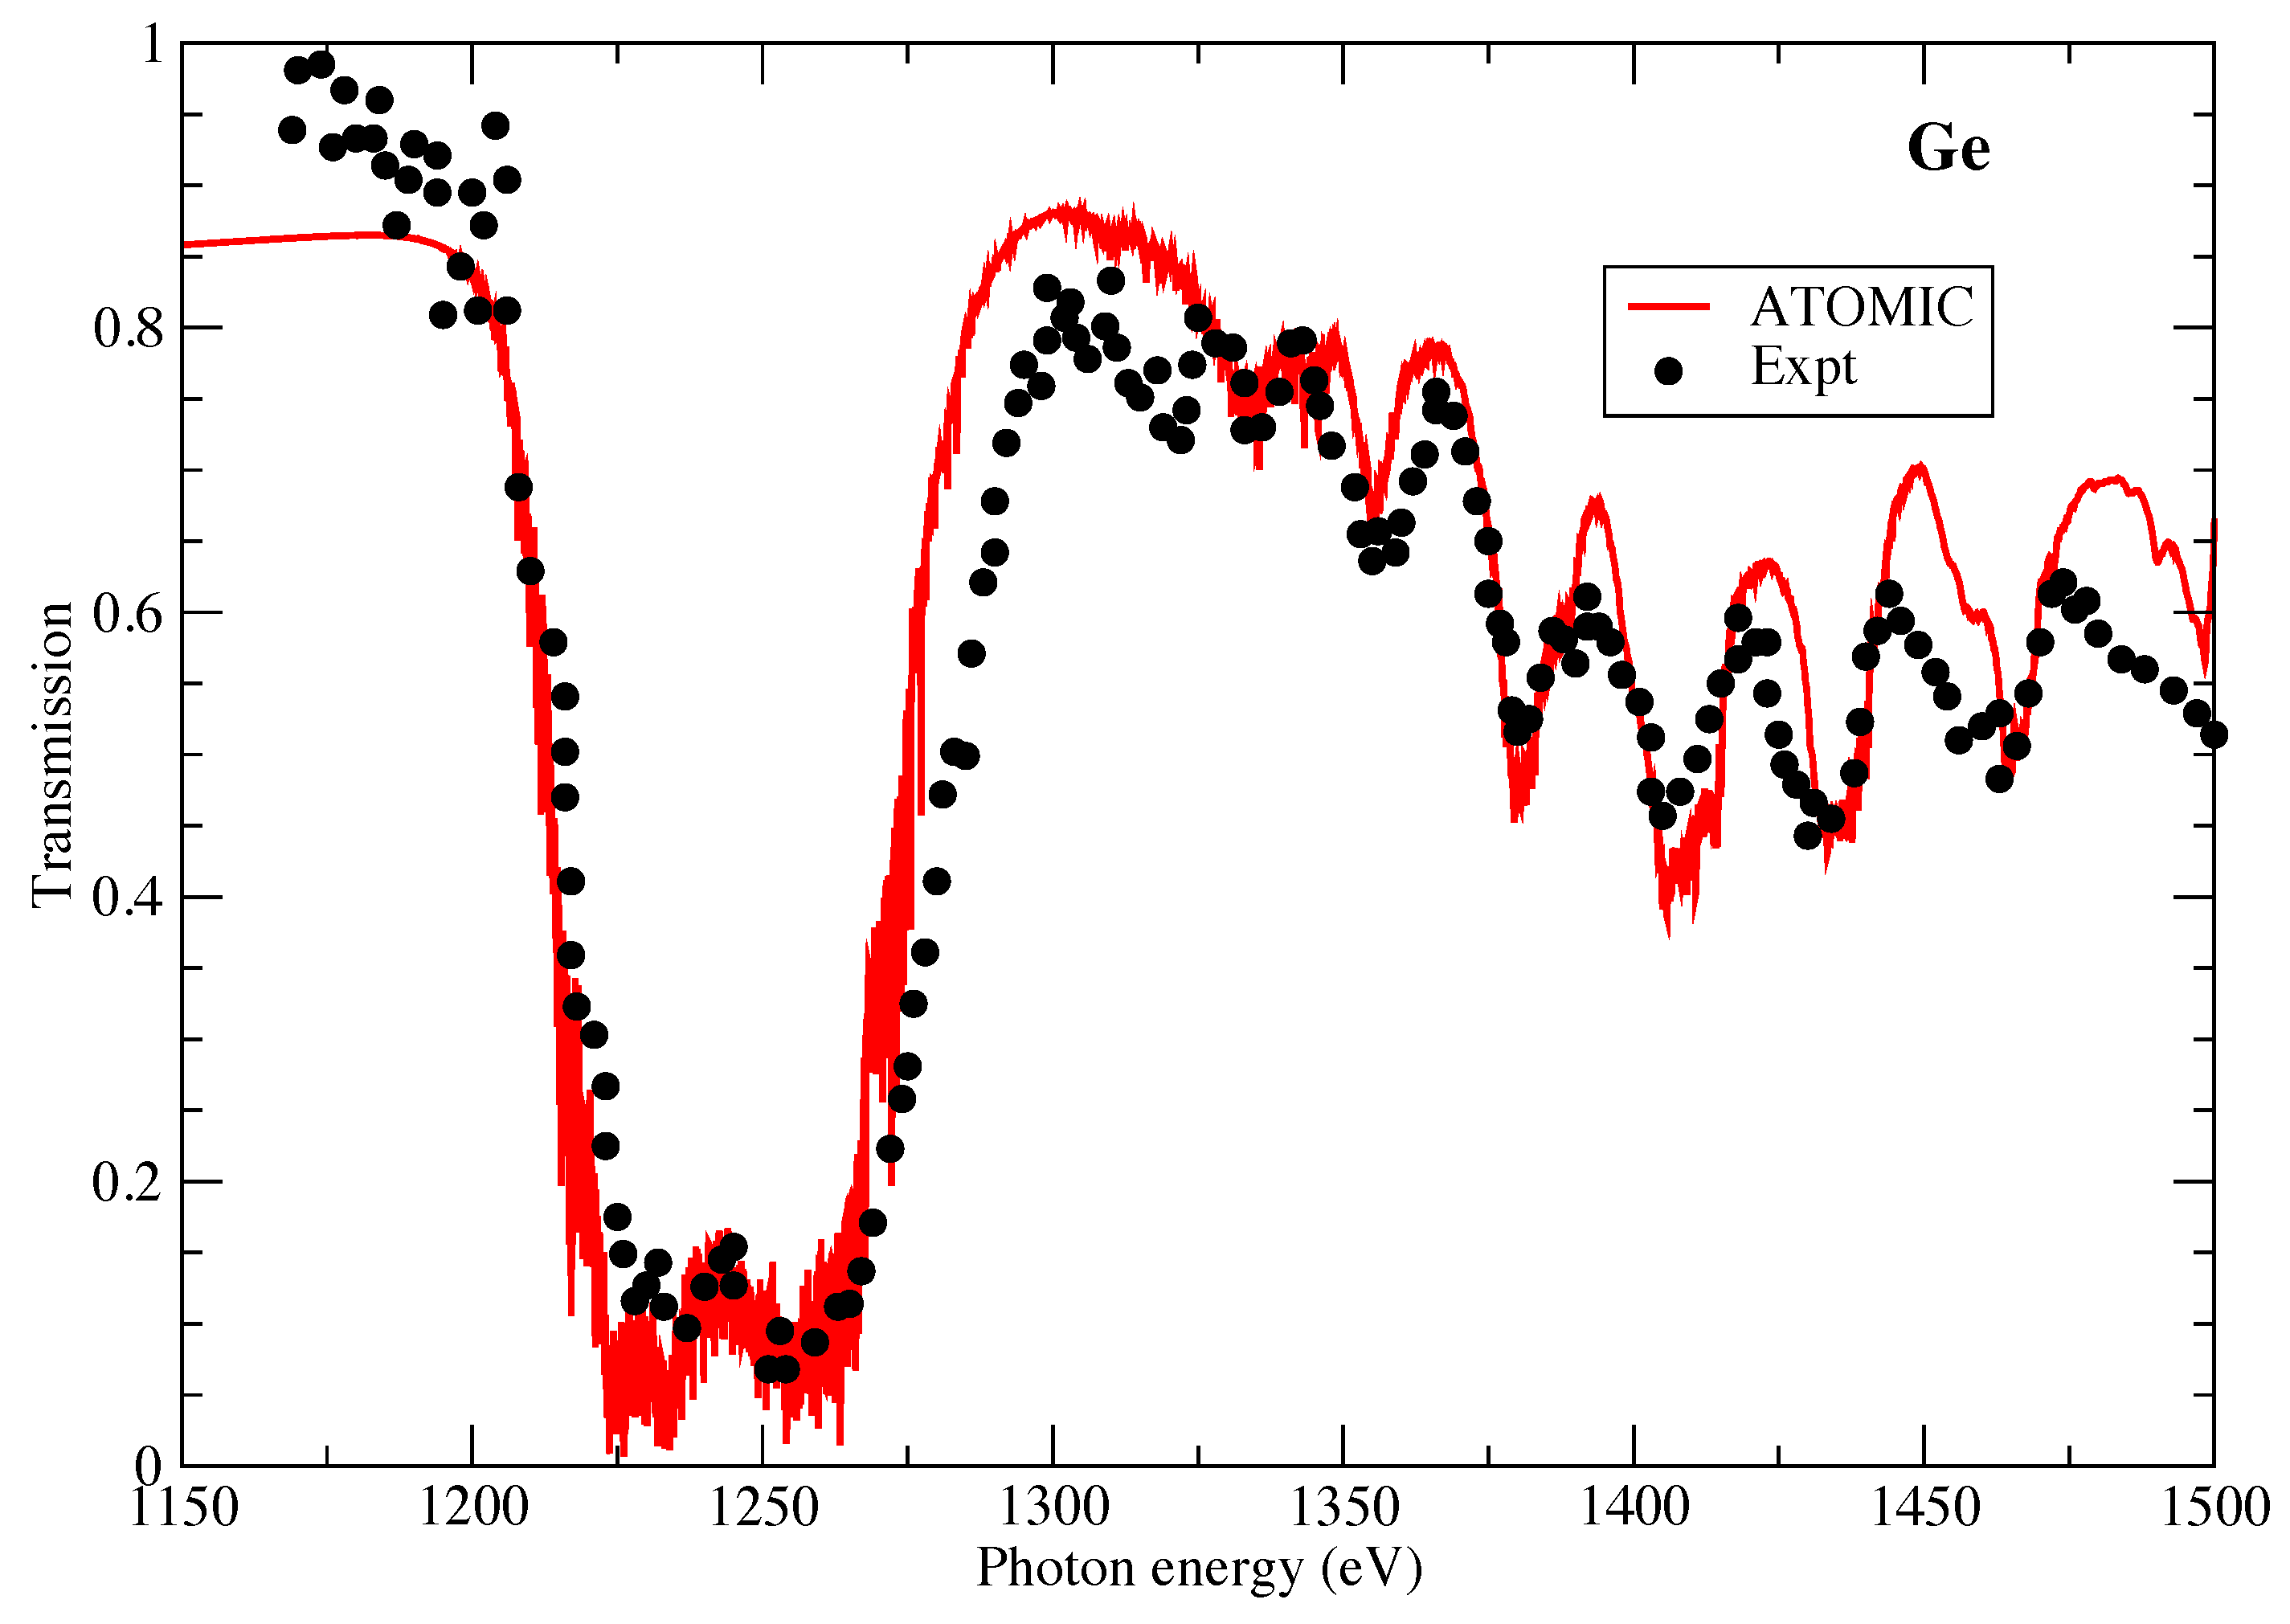
In Figure 3 we also present the opacity of Ge, this time in comparison to a measurement performed using the NOVA laser at LLNL [31]. The temperature and density of the Ge target was inferred through use of an aluminum tracer, which led to the prediction of a temperature of 38 eV and mass density of 0.012 g/cm. The agreement between the ATOMIC calculation and NOVA measurement is very good and is much better than found in comparison with the earlier AWE measurement. The very deep transmission feature around 1.25 keV arises from inner-shell 2p-3d transitions in mid-ionized Ge. The ATOMIC calculation captures the position, width and depth of this feature very well. The smaller transmission features at higher photon energies arise from 2p-4d transitions from similar ion stages. We note that significant spin-orbit splitting is present in these features. ATOMIC also reproduces the positions of these features well, although there are some disagreements in the height of the transmission features (corresponding to valleys in an opacity spectrum) at the highest photon energies.
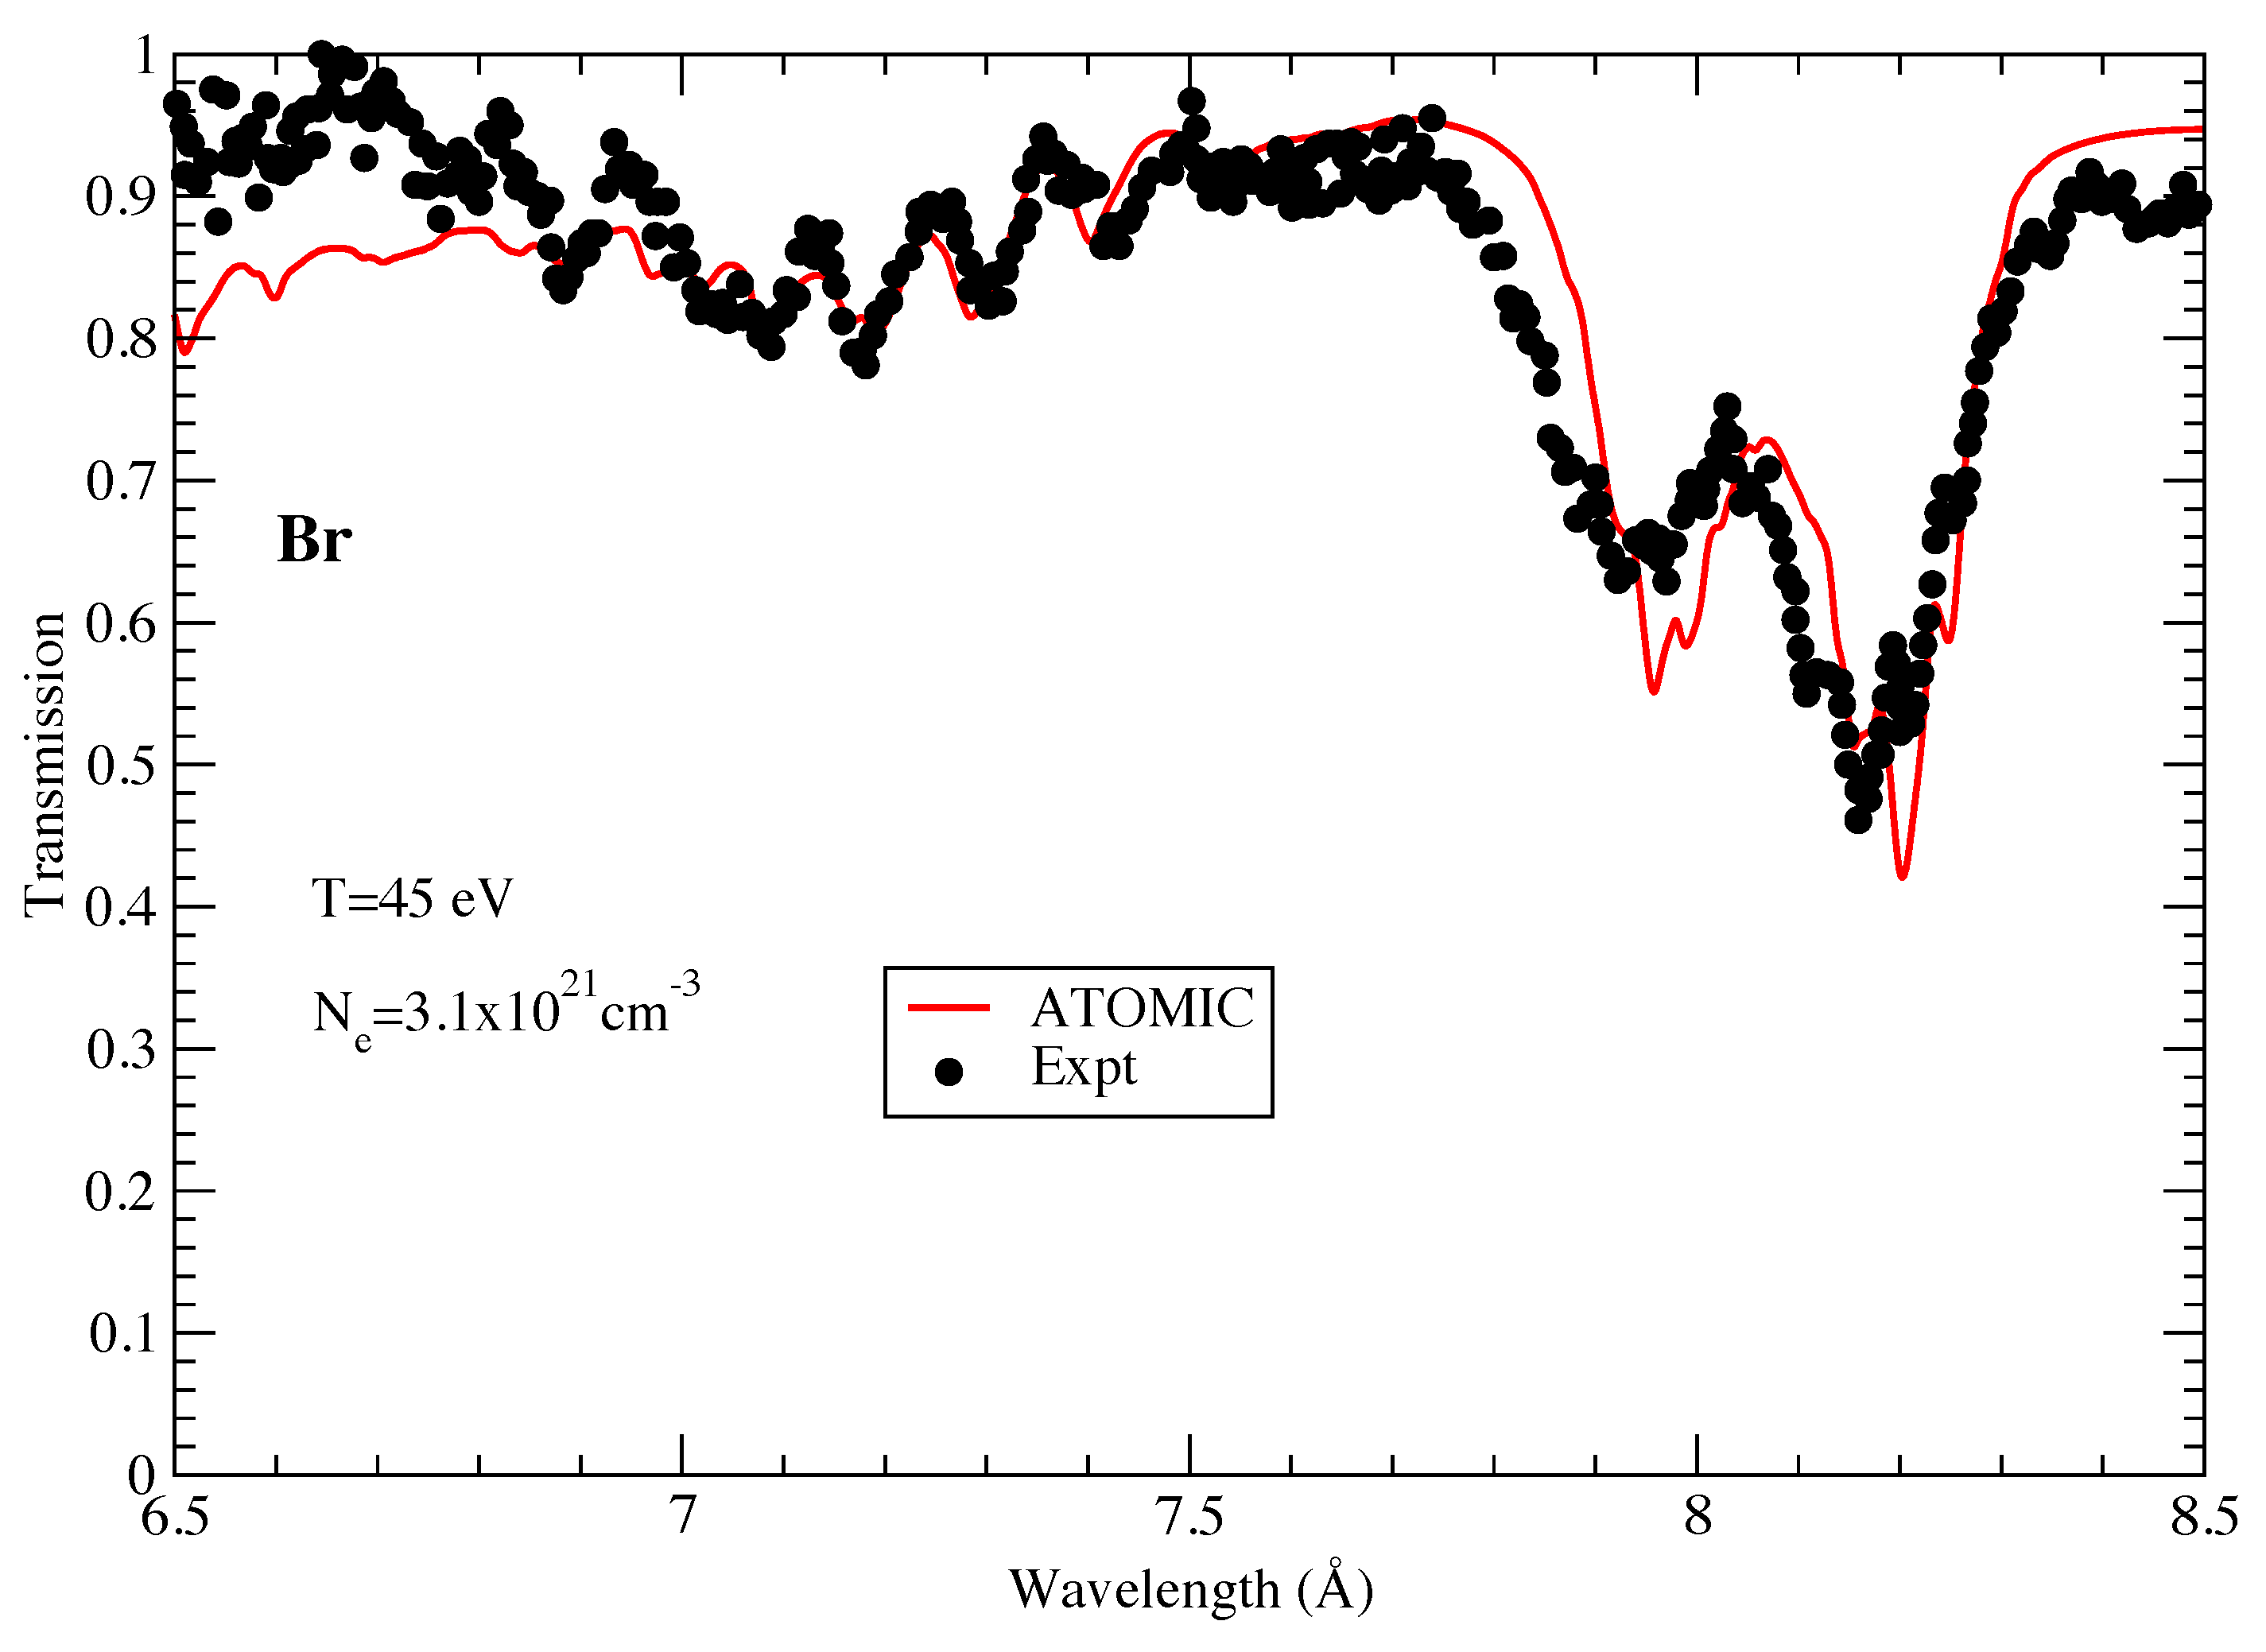
In Figure 4 we examine the opacity of Br. The transmission from this element was examined in early experiments using the Sandia Z facility, in which a CH-tamped NaBr foil was the target [32]. Figure 4 shows a part of the measured transmission spectrum in which only the Br opacity makes a significant contribution. The plasma was inferred to be at a temperature of around 45 eV and an electron density of cm through comparisons with the Na spectra at higher wavelengths. In [32], comparisons with the SCO superconfiguration code showed reasonable agreement, although much of the fine detail observed in the measurement was not found in the more averaged SCO calculations. The ATOMIC calculations at the same conditions of 45 eV and an electron density of cm are shown in Figure 4. We find quite good agreement with the measured spectrum, especially for the two prominent transmission features around 8.0 Å. ATOMIC matches the experimental position and depth of these features well. These features correspond to strong spin-orbit splitting of 2p-3d transitions in mid-ionized Br (ion stages centered around Br). We also find good agreement for the smaller transmission dips at lower wavelengths between 7 and 7.5 Å, although the agreement quickly degrades below 7.0 Å.
4. Kr Opacity
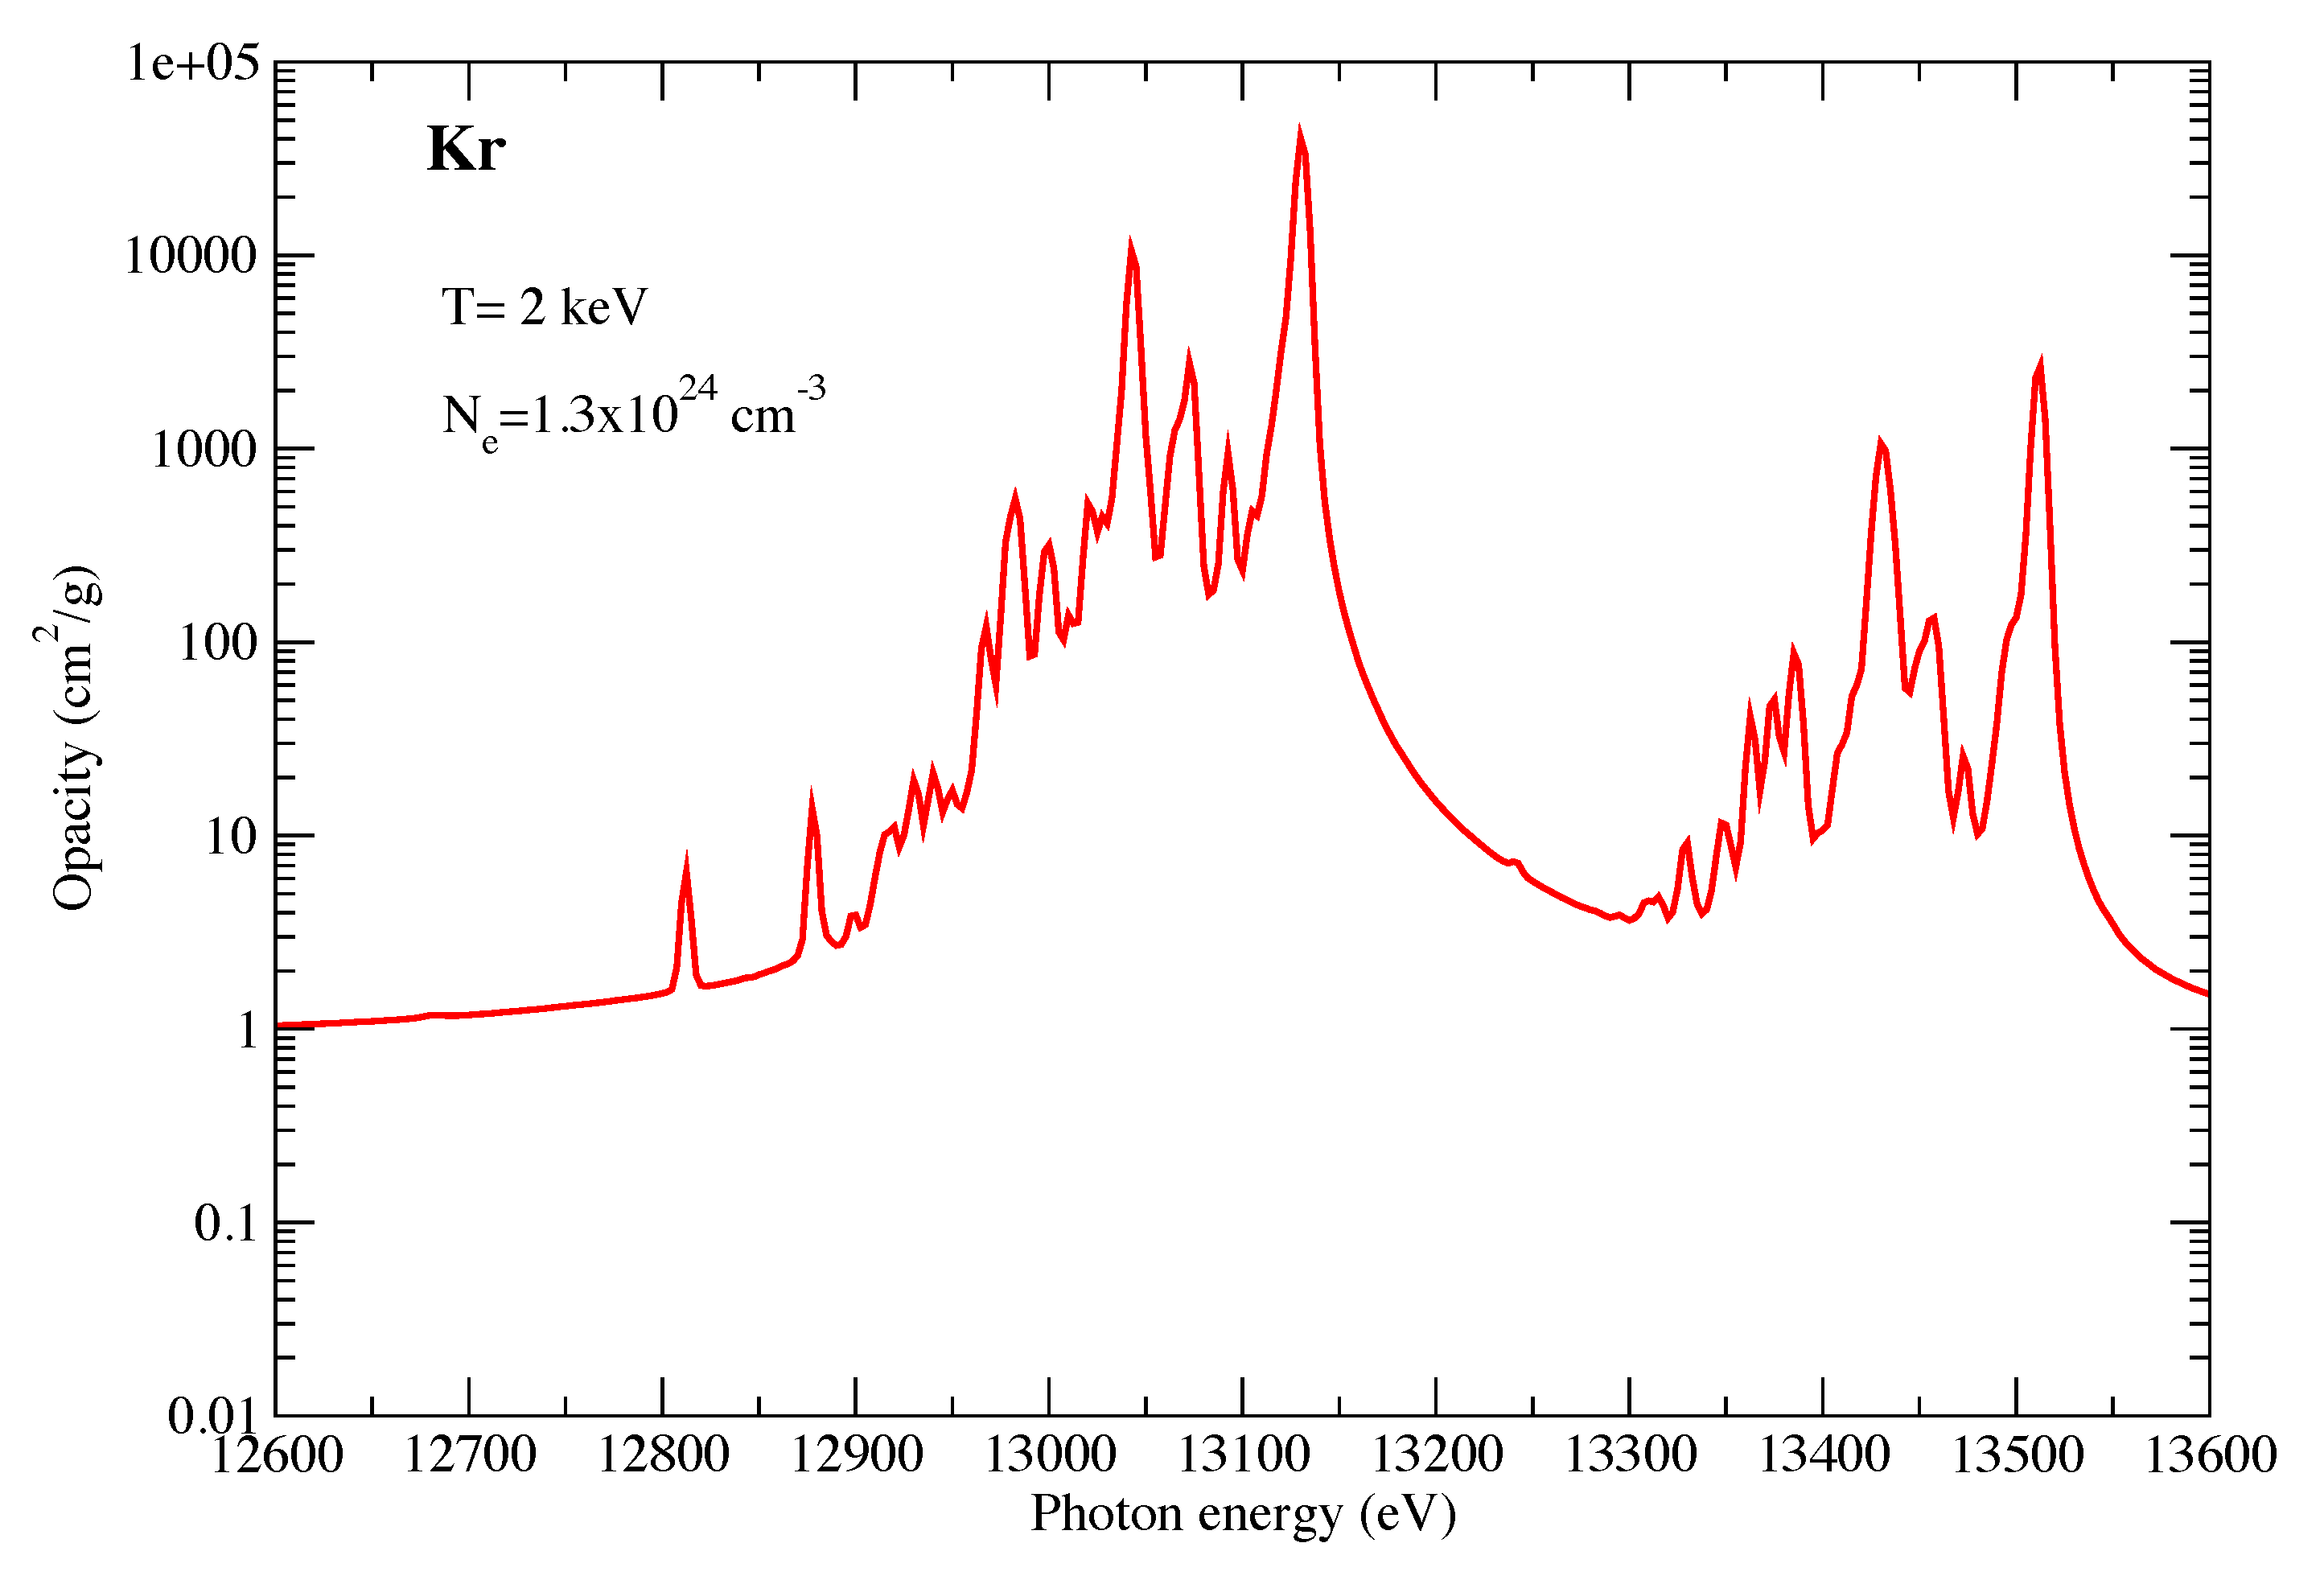
To finalize our discussion of new opacity calculations, we present in Figure 5 the opacity of Kr at a temperature of 2 keV and an electron density of cm. At these conditions, Kr is close to fully ionized, with most of the ionic population residing in the He-like and Li-like ion stages (H-like also retains some population). These conditions were chosen to showcase the strong He and Ly lines that are prominent in this photon energy range. These lines have recently been used as diagnostics in Kr-doped capsule implosion experiments at NIF [12]. Although direct comparisons of our LTE opacity calculations with the NIF measurements are not appropriate, we do find that our calculated line positions appear to be consistent with the measurements presented in [12] as well as the associated modeling presented in that work. ATOMIC has been used in non-LTE mode (including consideration of spatial gradients and radiation transport) to successfully compare with earlier NIF measurements [13] and Omega measurements [14]. We finally note that the positions of the Li-like, He-like, and H-like Kr line features shown in Figure 5 appear to be in excellent agreement with the NIST recommended data for these lines [33].
5. Conclusions
In this progress report we have briefly described some recent opacity calculations performed at Los Alamos using the ATOMIC code. We have made comparisons with some older measurements on Ge [30,31] and Br [32], as well as a more recent measurement on Fe [29]. Generally, we find good agreement with these measurements, which gives us some confidence that ATOMIC calculations for such elements are feasible. We have also presented a preliminary opacity calculation for Kr, and hope in the future to provide opacity data that is of use to ICF research. Future progress will be reported in due course.
Author Contributions
All authors contributed equally to this work.
Acknowledgments
The Los Alamos National Laboratory is operated by Los Alamos National Security, LLC for the NNSA of the U.S. DOE under Contract No. DE-AC5206NA25396.
Conflicts of Interest
The authors declare no conflict of interest.
References
- Huebner, W.F.; Barfield, W.D. Opacity; Springer: New York, NY, USA, 2014. [Google Scholar]
- Magee, N.H.; Abdallah, J., Jr.; Clark, R.E.H.; Cohen, J.S.; Collins, L.A.; Csanak, G.; Fontes, C.J.; Gauger, A.; Keady, J.J.; Kilcrease, D.P.; et al. Atomic Structure Calculations and New Los Alamos Astrophysical Opacities. Astron. Soc. Pac. Conf. Ser. 1995, 78, 51. [Google Scholar]
- Neuforge-Verheecke, C.; Guzik, J.A.; Keady, J.J.; Magee, N.H.; Bradley, P.A.; Noels, A. Helioseismic Tests of the New Los Alamos LEDCOP Opacities. Astrophys. J. 2001, 561, 450–454. [Google Scholar] [CrossRef] [Green Version]
- Colgan, J.; Kilcrease, D.P.; Magee, N.H., Jr.; Sherrill, M.E.; Abdallah, J., Jr.; Hakel, P.; Fontes, C.J.; Guzik, J.A.; Mussack, K.A. A new generation of Los Alamos opacity tables. Astrophys. J. 2016, 817, 116. [Google Scholar] [CrossRef]
- Walczak, P.; Fontes, C.J.; Colgan, J.; Kilcrease, D.P.; Guzik, J.A. Wider pulsation instability regions for β Cephei and SPB stars calculated using new Los Alamos opacities. Astron. Astrophys. 2015, 580, L9. [Google Scholar] [CrossRef]
- Daszyńska-Daszkiewicz, J.; Pamyatnykh, A.A.; Walczak, P.; Colgan, J.; Fontes, C.J.; Kilcrease, D.P. Interpretation of the BRITE oscillation data of the hybrid pulsator ν Eridani: A call for the modification of stellar opacities. Mon. Not. R. Astron. Soc. 2016, 466, 2284. [Google Scholar] [CrossRef]
- Buldgen, G.; Salmon, S.J.A.J.; Godart, M.; Noels, A.; Scuflaire, R.; Dupret, M.A.; Reese, D.R.; Colgan, J.; Fontes, C.J.; Eggenberger, P.; et al. Inversions of the Ledoux discriminant: A closer look at the tachocline. Mon. Not. Roy. Astron. Soc. 2017, 472, L70. [Google Scholar] [CrossRef]
- Buldgen, G.; Salmon, S.J.A.J.; Noels, A.; Scuflaire, R.; Dupret, M.A.; Colgan, J.; Fontes, C.J.; Eggenberger, P.; Hakel, P.; Kilcrease, D.P.; et al. Seismic inversion of the solar entropy: A case for improving the Standard Solar Model. Astron. Astrophys. 2017, 607, A58. [Google Scholar] [CrossRef]
- Basu, S. Helioseismic tests of stellar equations of state and opacities. Astron. Soc. Pac. Conf. Ser. 2018, in press. [Google Scholar]
- Colgan, J.; Kilcrease, D.P.; Magee, N.H.; Abdallah, J.; Sherrill, M.E.; Fontes, C.J.; Hakel, P.; Guzik, J.A.; Mussack, K.A.; Walczak, P. A new generation of Los Alamos opacity tables. AIP Conf. Proc. 2017, 1811, 160002. [Google Scholar] [Green Version]
- Colgan, J.; Kilcrease, D.P.; Magee, N.H.; Sherrill, M.E.; Fontes, C.J.; Hakel, P. New Los Alamos Opacities. Astron. Soc. Pac. Conf. Ser. 2018, in press. [Google Scholar]
- Chen, H.; Ma, T.; Nora, R.; Barrios, M.A.; Scott, H.A.; Schneider, M.B.; Berzak Hopkins, L.; Casy, D.T.; Hammel, B.A.; Jarrott, L.C.; et al. On krypton-doped capsule implosion experiments at the National Ignition Facility. Phys. Plasmas 2017, 24, 072715. [Google Scholar] [CrossRef]
- Hakel, P.; Kyrala, G.A.; Bradley, P.A.; Krasheninnikova, N.S.; Murphy, T.J.; Schmitt, M.J.; Tregillis, I.L.; Kanzleieter, R.J.; Batha, S.H.; Fontes, C.J.; et al. X-ray spectroscopic diagnostics and modeling of polar-drive implosion experiments on the National Ignition Facility. Phys. Plasmas 2014, 21, 063306. [Google Scholar] [CrossRef]
- Baumgaertel, J.A.; Bradley, P.A.; Hsu, S.C.; Cobble, J.A.; Hakel, P.; Tregillis, I.L.; Krasheninnikova, N.S.; Murphy, T.J.; Schmitt, M.J.; Shah, R.C.; et al. Observation of early shell-dopant mix in OMEGA direct-drive implosions and comparisons with radiation-hydrodynamic simulations. Phys. Plasmas 2014, 21, 052706. [Google Scholar] [CrossRef]
- Sasaki, A.; Sunahara, A.; Furukawa, H.; Nishihara, K.; Fujioka, S.; Nishikawa, T.; Koike, F.; Ohashi, H.; Tanuma, H. Modeling of radiative properties of Sn plasmas for extreme-ultraviolet source. J. Appl. Phys. 2010, 107, 113303. [Google Scholar]
- Colgan, J.; Kilcrease, D.P.; Abdallah, J., Jr.; Sherrill, M.E.; Fontes, C.J.; Hakel, P.; Armstrong, G.S.J. Atomic structure considerations for the low-temperature opacity of Sn. High Energy Density Phys. 2017, 23, 133. [Google Scholar] [CrossRef]
- Fontes, C.J.; Zhang, H.L.; Abdallah, J., Jr.; Clark, R.E.H.; Kilcrease, D.P.; Colgan, J.; Cunningham, R.T.; Hakel, P.; Magee, N.H.; Sherrill, M.E. The Los Alamos suite of relativistic atomic physics codes. J. Phys. B 2015, 48, 144014. [Google Scholar] [CrossRef]
- Magee, N.H.; Abdallah, J.; Colgan, J.; Hakel, P.; Kilcrease, D.P.; Mazevet, S.; Sherrill, M.; Fontes, C.J.; Zhang, H.L. Los Alamos Opacities: Transition from LEDCOP to ATOMIC. AIP Conf. Proc. 2004, 730, 168–179. [Google Scholar]
- Hakel, P.; Sherrill, M.E.; Mazevet, S.; Abdallah, J., Jr.; Colgan, J.; Kilcrease, D.P.; Magee, N.H.; Fontes, C.J.; Zhang, H.L. The new Los Alamos Opacity Code ATOMIC. J. Quant. Spectrosc. Rad. Transf. 2006, 99, 265. [Google Scholar] [CrossRef]
- Abdallah, J.; Clark, R.E.H.; Peek, J.M.; Fontes, C.J. Kinetics calculations for near Ne-like ions. J. Quant. Spectrosc. Rad. Transf. 1994, 51, 1–8. [Google Scholar] [CrossRef]
- Cowan, R.D. The Theory of Atomic Structure and Spectra; University of California Press: Berkeley, CA, USA, 1981. [Google Scholar]
- Mazevet, S.; Abdallah, J., Jr. Mixed UTA and detailed line treatment for mid-Z opacity and spectral calculations. J. Phys. B 2006, 39, 3419. [Google Scholar] [CrossRef]
- Abdallah, J., Jr.; Kilcrease, D.P.; Magee, N.H.; Mazevet, S.; Hakel, P.; Sherrill, M.E. Spectral line strength binning method for opacity calculations. High Energy Dens. Phys. 2007, 3, 309. [Google Scholar] [CrossRef]
- Clark, R.E.H.; Abdallah, J., Jr.; Mann, J.B. Integral and differential cross sections for electron impact ionization. Astrophys. J. 1991, 381, 597. [Google Scholar] [CrossRef]
- Colgan, J.; Kilcrease, D.P.; Magee, N.H., Jr.; Abdallah, J., Jr.; Sherrill, M.E.; Fontes, C.J.; Zhang, H.L.; Hakel, P. Light element opacities of astrophysical interest from ATOMIC. High Energy Dens. Phys. 2015, 14, 33–37. [Google Scholar] [CrossRef] [Green Version]
- Bailey, J.E.; Rochau, G.A.; Iglesias, C.A.; Abdallah, J., Jr.; MacFarlane, J.J.; Golovkin, I.; Wang, P.; Mancini, R.C.; Lake, P.W.; Moore, T.C.; et al. Iron-Plasma Transmission Measurements at Temperatures Above 150 eV. Phys. Rev. Lett. 2007, 99, 265002. [Google Scholar] [CrossRef] [PubMed]
- Bailey, J.E.; Nagayama, T.; Loisel, G.P.; Rochau, G.A.; Blancard, C.; Colgan, J.; Cosse, Ph.; Faussurier, G.; Fontes, C.J.; Gilleron, F.; et al. A higher-than-predicted measurement of iron opacity at solar interior temperatures. Nature 2015, 517, 56–59. [Google Scholar] [CrossRef] [PubMed]
- Heeter, R.F.; Bailey, J.E.; Craxton, R.S.; Devolder, B.G.; Dodd, E.S.; Garcia, E.M.; Huffman, E.J.; Iglesias, C.A.; King, J.A.; Kline, J.L.; et al. Conceptual design of initial opacity experiments on the national ignition facility. J. Plasma Phys. 2017, 83, 595830103. [Google Scholar] [CrossRef]
- Zhang, J.; Li, H.; Zhao, Y.; Xiong, G.; Yuan, Z.; Zhang, H.; Yang, G.; Yang, J.; Liu, S.; Jiang, S.; et al. L- and M-shell absorption measurements of radiatively heated Fe plasma. Phys. Plasmas 2012, 19, 113302. [Google Scholar] [CrossRef]
- Foster, J.M.; Hoarty, D.J.; Smith, C.C.; Rosen, P.A.; Davidson, S.J.; Rose, S.J.; Perry, T.S.; Serduke, F.J.D. L-shell absorption spectrum of an open M-shell germanium plasma: Comparison of experimental data with a detailed configuration-accounting calculation. Phys. Rev. Lett. 1991, 67, 3255. [Google Scholar] [CrossRef] [PubMed]
- Perry, T.S.; Budil, K.S.; Cauble, R.; Ward, R.A.; Bach, D.R.; Iglesias, C.A.; Wilson, B.G.; Nash, J.K.; Smith, C.C.; Foster, J.M.; et al. Quantitative measurement of mid-Z opacities. J. Quant. Spectrosc. Rad. Transf. 1995, 54, 317. [Google Scholar] [CrossRef]
- Bailey, J.E.; Arnault, P.; Blenski, R.; Dejonghe, G.; Peyrusse, O.; MacFarlane, J.J.; Mancini, R.C.; Cuneo, M.E.; Nielsen, D.S.; Rochau, G.A. Opacity measurement of tamped NaBr samples heated by z-pinch X-rays. J. Quant. Spectrosc. Rad. Transf. 2003, 81, 31. [Google Scholar] [CrossRef]
- Kramida, A.; Ralchenko, Y.; Reader, J.; NIST ASD Team. NIST Atomic Spectra Database (ver. 5.5.2). 2018. Available online: http://physics.nist.gov/asd (accessed on 6 March 2018).
Figure 1.
The transmission of Fe and Al as measured by Zhang et al. [29]. We compare the experimental data to ATOMIC calculations at a temperature of 72 eV and a mass density of 6 mg/cm.
Figure 1.
The transmission of Fe and Al as measured by Zhang et al. [29]. We compare the experimental data to ATOMIC calculations at a temperature of 72 eV and a mass density of 6 mg/cm.

Figure 2.
The transmission of Ge as measured by [30]. The experimental data are compared with ATOMIC calculations at a temperature of 76 eV and a mass density of 0.05 g/cm.
Figure 2.
The transmission of Ge as measured by [30]. The experimental data are compared with ATOMIC calculations at a temperature of 76 eV and a mass density of 0.05 g/cm.

Figure 3.
The transmission of Ge as measured by [31]. The experimental data are compared with ATOMIC calculations at a temperature of 38 eV and a mass density of 0.012 g/cm.
Figure 3.
The transmission of Ge as measured by [31]. The experimental data are compared with ATOMIC calculations at a temperature of 38 eV and a mass density of 0.012 g/cm.

Figure 4.
The transmission of Br as measured by [32]. The experimental data are compared with ATOMIC calculations at a temperature of 45 eV and an electron density of cm.
Figure 4.
The transmission of Br as measured by [32]. The experimental data are compared with ATOMIC calculations at a temperature of 45 eV and an electron density of cm.

Figure 5.
The opacity of Kr at a temperature of 2 keV and an electron density of cm.

© 2018 by the authors. Licensee MDPI, Basel, Switzerland. This article is an open access article distributed under the terms and conditions of the Creative Commons Attribution (CC BY) license (http://creativecommons.org/licenses/by/4.0/).
Share and Cite
MDPI and ACS Style
Colgan, J.; Kilcrease, D.P.; Magee, N.H.; Sherrill, M.E.; Fontes, C.J.; Hakel, P. New Los Alamos Opacity Calculations. Atoms 2018, 6, 32. https://doi.org/10.3390/atoms6020032
AMA Style
Colgan J, Kilcrease DP, Magee NH, Sherrill ME, Fontes CJ, Hakel P. New Los Alamos Opacity Calculations. Atoms. 2018; 6(2):32. https://doi.org/10.3390/atoms6020032
Chicago/Turabian StyleColgan, J., D. P. Kilcrease, N. H. Magee, M. E. Sherrill, C. J. Fontes, and P. Hakel. 2018. "New Los Alamos Opacity Calculations" Atoms 6, no. 2: 32. https://doi.org/10.3390/atoms6020032
Note that from the first issue of 2016, this journal uses article numbers instead of page numbers. See further details here.