Spatially-Resolved Electron Density Measurement in Hydrogen Pellet Ablation Cloud

1
Department of Fusion Science, Sokendai, Toki 509-5292, Japan
2
National Institute for Fusion Science, Toki 509-5292, Japan
*
Author to whom correspondence should be addressed.
Atoms 2018, 6(2), 34; https://doi.org/10.3390/atoms6020034
Submission received: 17 April 2018
/
Revised: 11 May 2018
/
Accepted: 4 June 2018
/
Published: 11 June 2018
(This article belongs to the Section Atomic, Molecular and Nuclear Spectroscopy and Collisions)
Abstract
:A spectroscopic method for spatial resolution measurement in fuel pellet ablation clouds is being developed in the Large Helical Device (LHD). Spatial resolution is obtained thanks to optics that have a narrow, band-shaped field-of-view. The Stark-broadened emission line of a deuterium pellet ablation cloud is isolated and analyzed with a spectral lineshape code. The electron density profile of the ablation cloud along its direction of elongation is derived through least squares fitting. The obtained profile is peaked and has a dip at its center which confirms what can be found in simulations. Moreover, the order of magnitudes for the derived electron densities are in agreement with what has already been found in the LHD.
1. Introduction
Most fusion reactor designs rely on pellet injection, requiring the need to understand the ablation process perfectly. A way to proceed is to study the ablation cloud that forms around a pellet when it interacts with the background plasma. This study can be done through imaging or spectroscopic means and can be temporally and/or spatially resolved.
In a recent paper, radiation intensity profiles of ablation clouds have been analyzed and empirically classified by shapes [1]. The authors also attempted to derive the plasma parameters inside an ablation cloud with a dented intensity profile by using a simulation model. Results derived from the model suggested the presence of a dip at the center of the electron density profile. However, significant discrepancies between the experimentally obtained intensity profile and the synthetically reconstructed one were reported. These discrepancies have raised the need for a way to directly measure the plasma parameters distribution inside ablation clouds.
Efforts to do so have already been attempted with an approach based on spatio-temporal imaging diagnosis spectroscopy [2,3]. This approach consists of using fiberscopes equipped with band-pass filters to collect the light emitted from ablation clouds under different wavelength configurations. Dented radiation intensity profiles similar to Reference [1] have then been analyzed using a spectroscopic method. Low resolution two-dimensional distributions profiles of the electron density were derived from these analyses. While a dented distribution profile has actually already been observed in Reference [2], such a result could not be clearly replicated in Reference [3]. Therefore, due to their low resolution, results obtained in Reference [2,3] neither corroborate nor contradict what is suggested in Reference [1].
In this paper, a high resolution one-dimensional profile derivation is performed on a deuterium ablation cloud using a spectroscopic method which relies on passive plasma spectroscopy. Imaging diagnostic is also used as a visual support.
2. Experimental Setup
The Large Helical Device (LHD) is a superconducting magnetic confinement fusion experimental device of heliotron type. It is equipped with a twenty barrel in situ pipe gun [4] capable of injecting pellets into the plasma of the LHD with velocities close to 1 km/s. Pellets are cylindrical shaped blocks of around that can contain approximately hydrogen or deuterium atoms each.
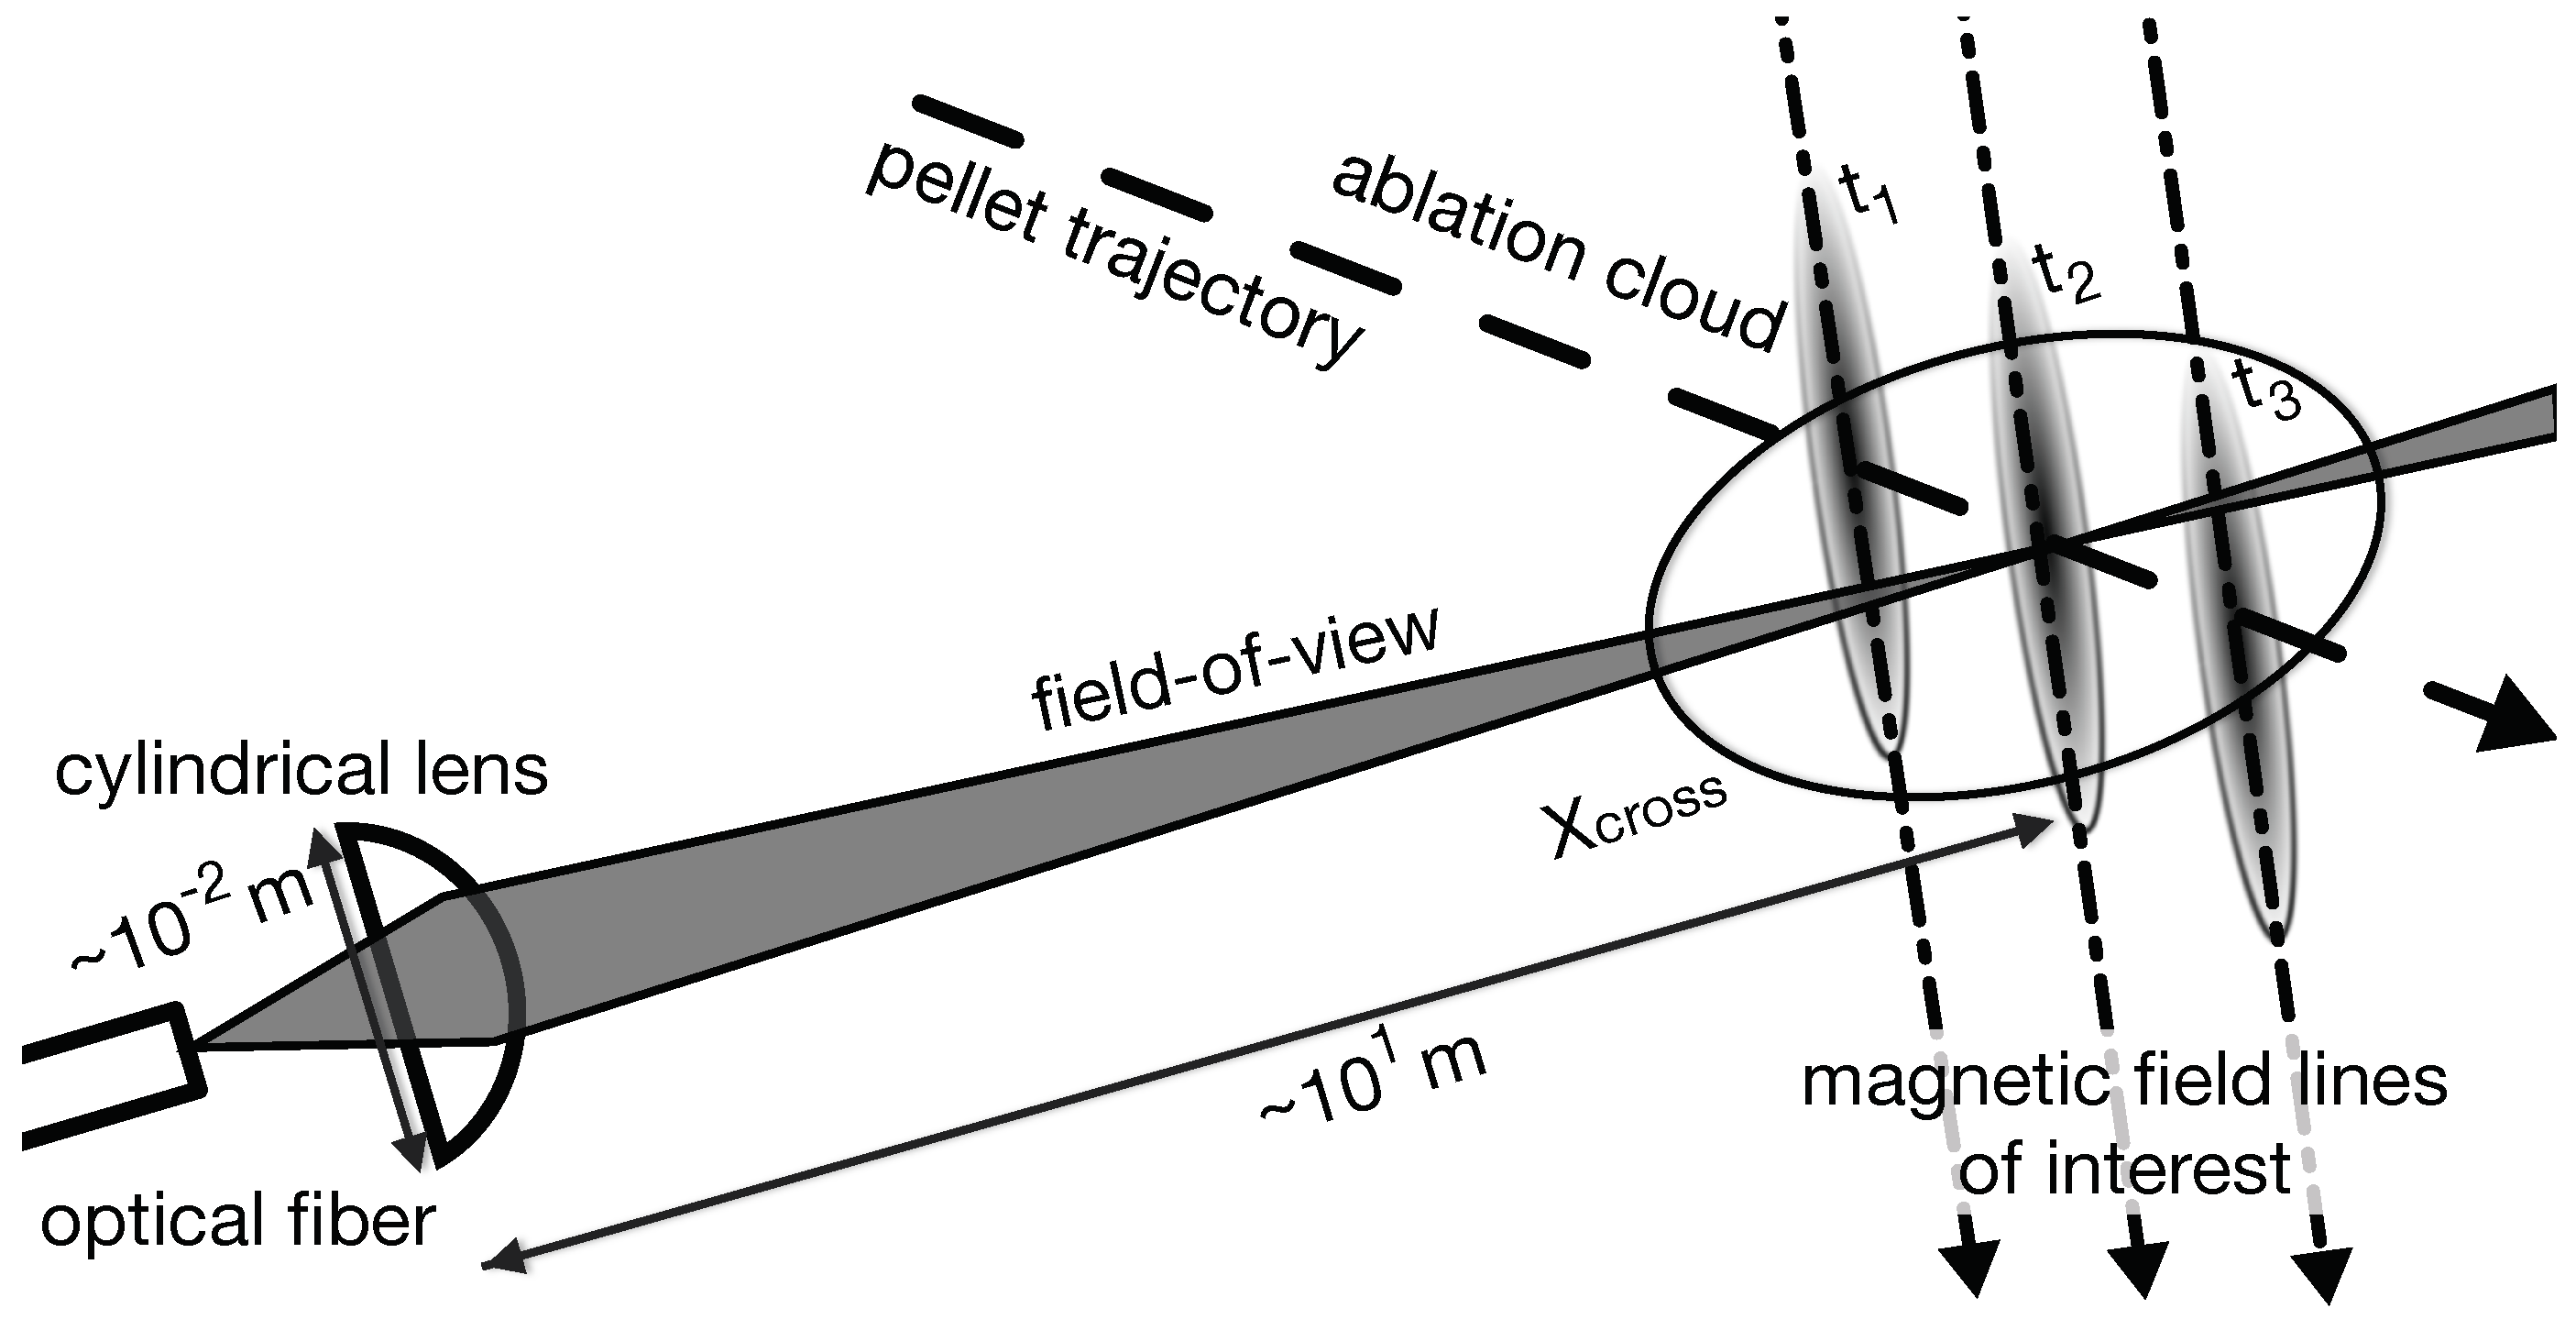
Figure 1 shows that an angle of about is present between the radial direction of the torus and the pellet trajectory which is represented by the dashed line.
The magnetic field lines of interest marked by the dash-dotted line are located near the major radius of interest ∼ 3.6 m. The line-of-sight of the observation device shown by the solid line and the trajectory of the ablating pellet meet at , where corresponds to a location where the line-of-sight and the magnetic field lines of interest are almost perpendicular. It is necessary to target this location because the ablation clouds are roughly elongated following the direction of the magnetic field lines they are on. This perpendicularity improves the resolution power of the observation system as the angle at which the observation is done determines how long ablation clouds will take to cross the line-of-sight. Ablating pellets are also expected to emit enough photons for measurement purposes when they reach .
As illustrated in Figure 2, the observation system is designed to collect photons emitted from a vertical narrow area.
The width of the observation window is expected to be much smaller than the longitudinally elongated ablation clouds that pass through. When a cloud goes through the observation window, and the acquisition time is high enough, each frame can be interpreted as a different slice of ablation cloud. After the cloud has disappeared from the field-of-view of the device, a spatially-resolved observation of ablation cloud is considered realized. The vertical, band-shaped field-of-view is obtained by combining a plano-convex cylindrical lens with an optical fiber. Optics are arranged so that the focal point is located on the pellet trajectory at as seen in Figure 2.
With a 100 m optical fiber and a cylindrical lens (THORLABS LA4148-ML), the width of the field-of-view at the focal point measures about 14 mm. It has been empirically confirmed that the variation of the width of the field-of-view can be neglected near the focal distance. The magnetic field lines of interest near the focal distance are also supposed to be parallel so that no rotation of ablation cloud is involved in the measurement. During its short transit through the field-of-view, the ablation cloud is considered to be in a steady state so that all of the recorded slices can be reunited to produce a one-dimensional profile.
Photons collected by the optical fiber are sent to a spectrometer which is installed in a remote location. The spectrometer consists of a slit-less entrance port, a grating and a detector. The grating used is a flat-field toroidal mirror type (Shimadzu P0550-01TR). The light flux emitted from the optical fiber end is simultaneously diffracted and focused on the detector by the grating. The relative diffraction efficiency of the grating is, at least, 50% at the blaze wavelength of 340 nm. A line scan camera (NEOPT NCAM2-BLD-04K070CL) is used as the detector. This camera is actually a two lines charge-coupled device (CCD) camera, each line having 4096 pixels, each pixel size being . However, the camera is used in the so-called binning mode where the four adjacent pixels are regarded as a bigger pseudo-pixel. This is equivalent to using a one line CCD camera, each line having 2048 pixels, each pixel being . It operates with a sampling rate of ∼71.4 kHz, or with a sampling time of 14 s, where the exposure time is 11 s. Each pixel data is digitized and stored with a 12 bits resolution.
The absolute sensitivity of the system has been calibrated with a standard lamp (Labsphere USS-600C), and its wavelength distribution has been calibrated using in situ recordings of recombining plasma events that can occur when plasma discharges end.
Ablation clouds are also observed with an imaging diagnostics located on the same observation port as the spectroscopic diagnostics. This system consists of a 600 m imaging fiber bundle (Fujikura II-03D9057A) and a fast camera (Phantom V7). The fast camera is operated with a sampling rate of 50 kHz, or 20 s, and has an effective exposure time of 1 s.
3. Experimental Results and Discussions
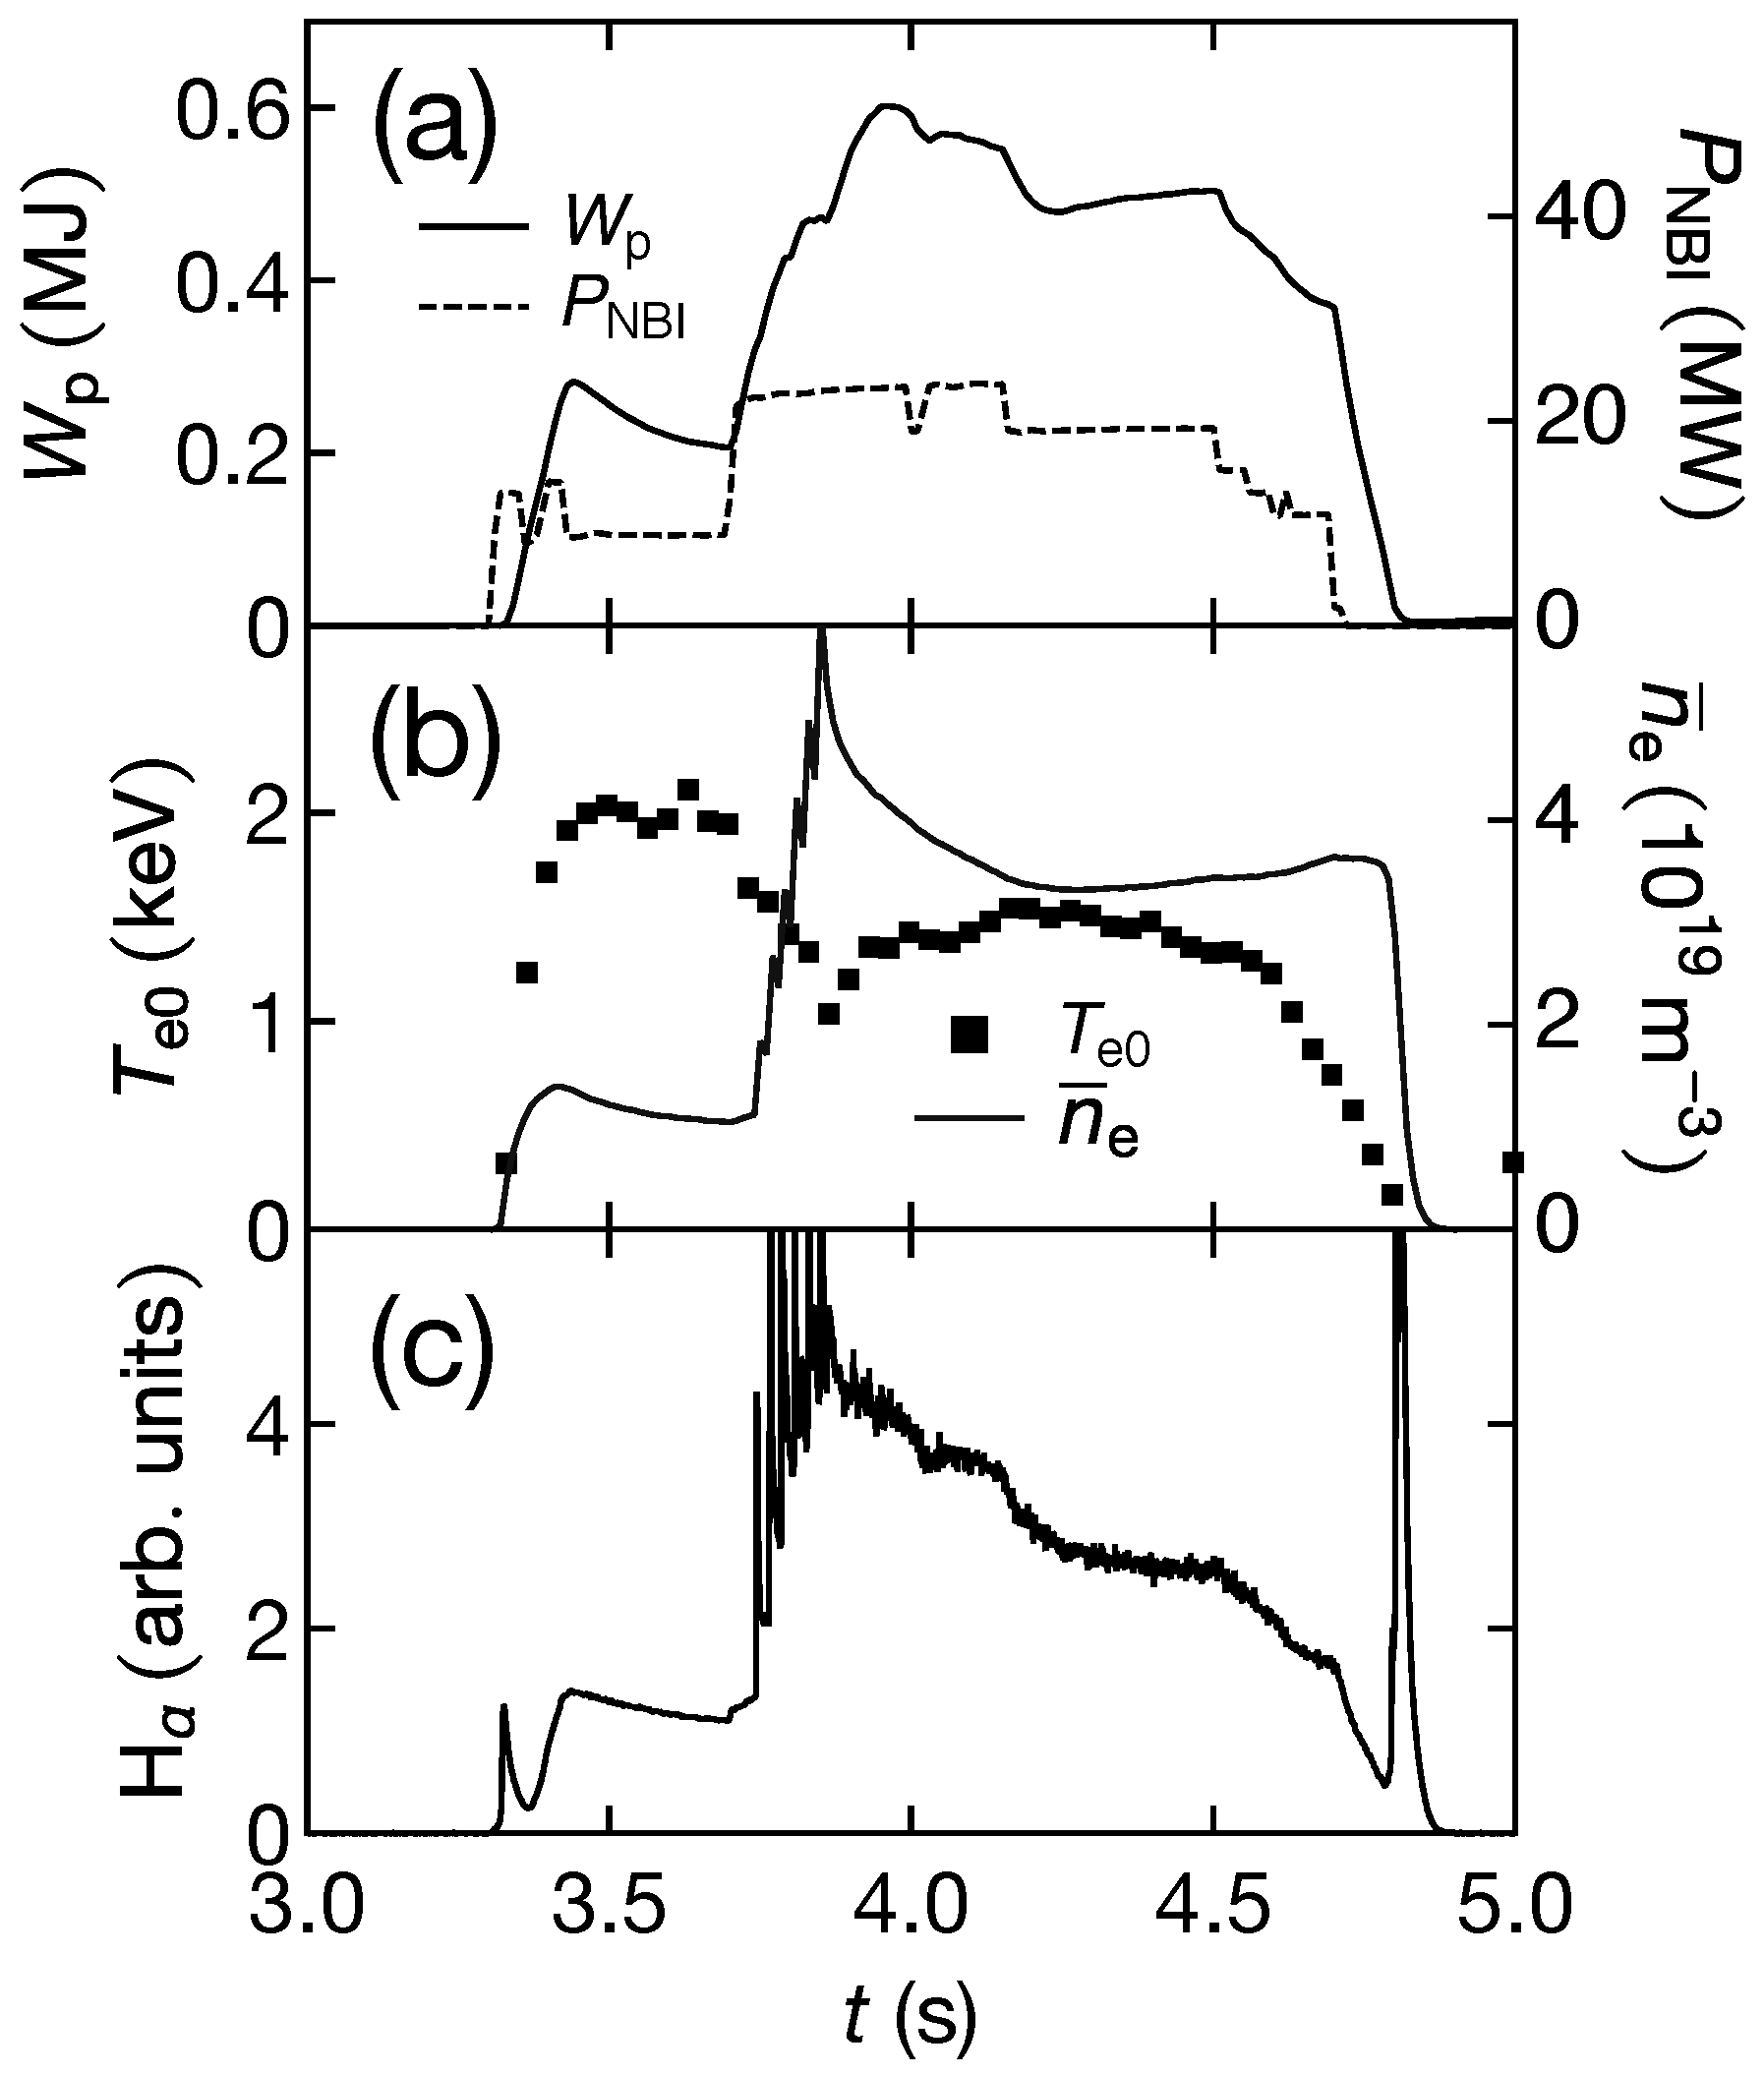
A measurement is made on a discharge (#135454) in which a series of six deuterium pellets have been successively injected into the plasma of LHD. The magnetic axis was set at = 3.6 m and the magnetic field strength at was set to = 1.5 T. The temporal development of several relevant parameters of the background plasma are shown in Figure 3.
The plasma was initiated and sustained through a so-called balanced neutral beam injection (NBI) pattern where neutral beams were equally injected from opposite directions. Such an injection pattern has been shown to not modify the pellets trajectory significantly [5]. It means that when under balanced NBI heating, it seems reasonable to assume that the ablation clouds passed through .
Figure 3a shows that, while the injections occurred, a balanced NBI heating was ongoing. Figure 3b shows that the line-averaged electron density increased whereas the central electron temperature decreased. Moreover, Figure 3c indicates six consecutive sharp intensity peaks between s and s when the pellets have been injected. These are signs that pellet injections happened as expected. In this study, focus is placed on the sixth pellet because its intense radiation intensity profile and long lifetime make it an appropriate choice for quantitative analysis.
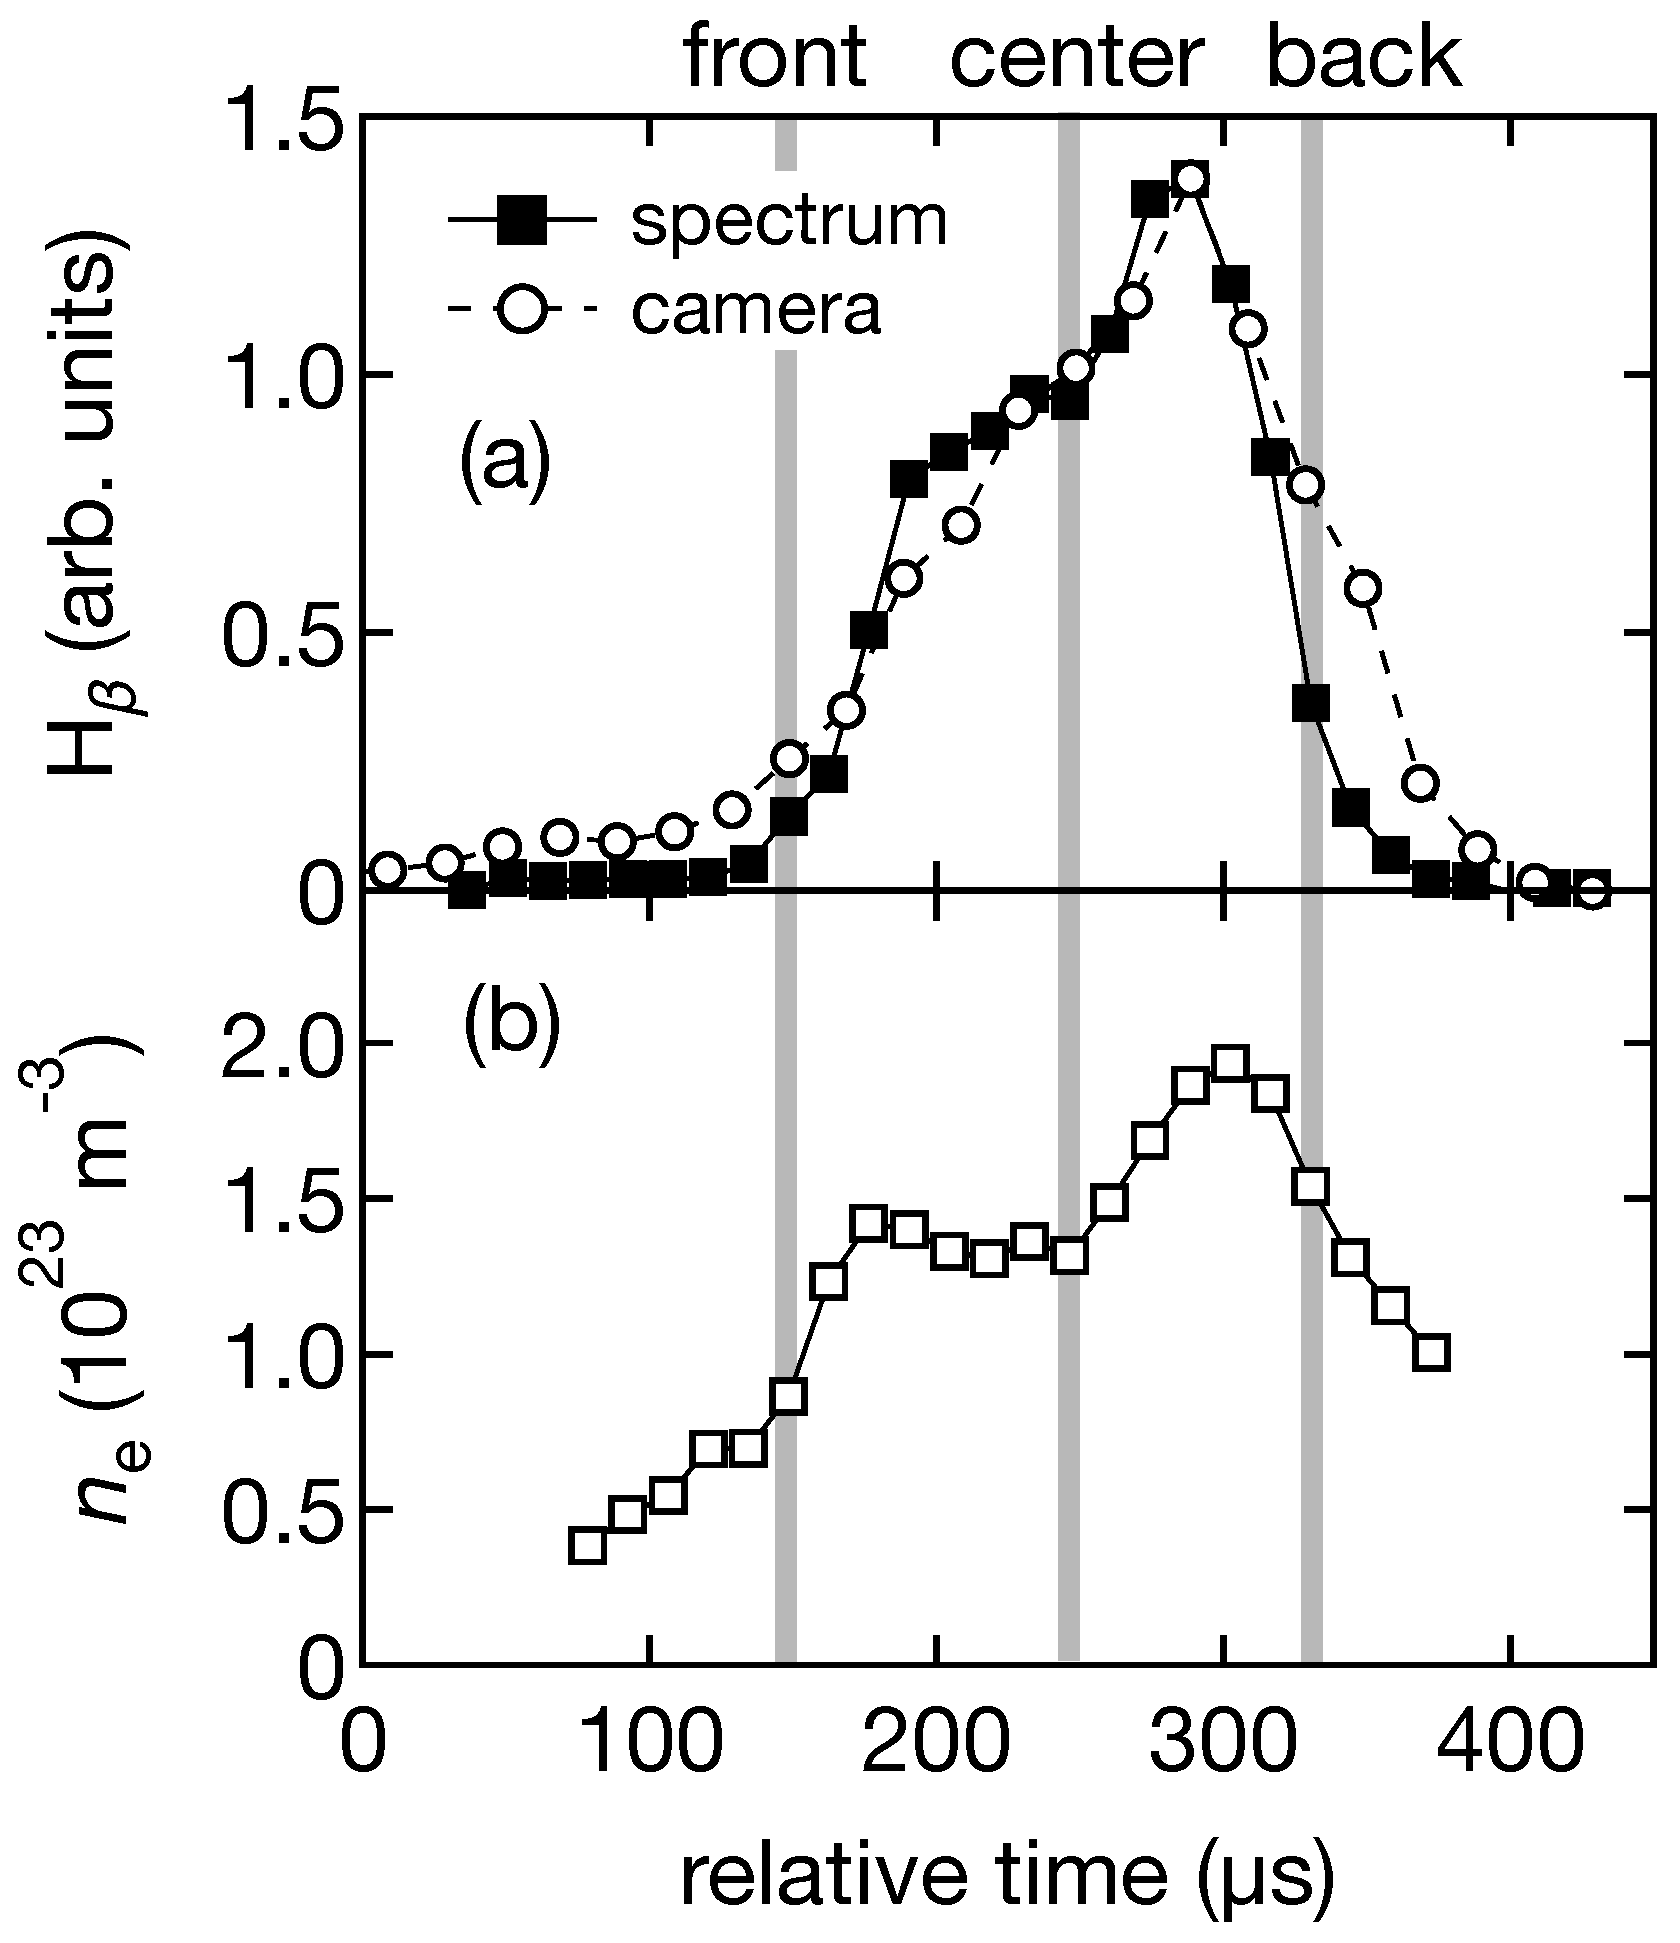
Results in Figure 4 are plotted as a function of relative time, where the notion of time is to be interpreted as the one-dimensional spatial profile of the longitudinally elongated ablation cloud.
The temporal development of the integrated radiation intensity for the sixth pellet in the wavelength range near the peak is shown by the line with solid squares in Figure 4a. The size of the ablation cloud can be estimated from this data. Indeed, the ablation cloud passes through the band-shaped field-of-view in approximately 300 s. With a fixed pellet velocity of about 1000 m/s, the ablation cloud size can be roughly estimated to be 0.3 m. Figure 4a can also provide information about the internal structure of the ablation cloud. The intensity profile is peaked in the second half of the ablation cloud. This means that the solid pellet core, which does not emit much light, must be located at the center or toward the first half of the ablation cloud.
Additional information may be obtained from analyses of the spectra directly. Figure 5a shows spectra observed at three different timings as indicated by the “front,” “center,” and “back” labeled vertical gray lines in Figure 4.
Differences in the shape and intensity among the spectra indicate that the plasma condition is different at these respective locations. It is visually possible to quantify an evolution trend for from the shape of the Stark broadened emission lines. The larger widths of the lines at the center and the back regions compared to the ones at the front region suggests that is lower at the front of the ablation cloud.
Lineshapes can also be fitted to obtain quantitative results. The line is inappropriate for lineshape analysis because it is often saturated. It has also been found that the self-reabsorption effect on can not be neglected [6]. Instead, the line is used where no saturation is constated and the self-reabsorption effect has been confirmed to be negligible [6]. Least squares fitting is conducted on each spectrum of the line profile. For that purpose, Stark broadened lineshapes have been modeled using a set of theoretical data [7]. It is necessary to note that the model used here was built for hydrogen spectra analyses although a deuterium plasma is actually studied. However, considering the similarities that have been observed between spectra of hydrogen and deuterium pellet ablation clouds, it would be appropriate to proceed in this manner.
Throughout the fitting, the input parameter is fixed to 1 eV. This is a reasonable assumption because previous studies found that is close to 1 eV irrespective of [3,6]. Moreover, in the temperature range considered here, dependence on the Stark broadening is too small to be detected with the present wavelength resolution. The continuum component is approximated and subtracted from the spectrum via a linear function to extract the lineshapes from the spectra. The instrumental width (∼1 nm) is taken into account in the spectral model. The Doppler broadening (∼10 nm at 1 eV and 486 nm), and the Zeeman splittings (∼10 nm for at 1.5 T) are ignored as they are negligibly small compared with the observed line broadening minimal width (∼6 nm).
For the calculation of the Doppler broadening, it is supposed that the atom temperature is in equilibrium with because the plasma in the ablation cloud is close to the complete LTE [6]. It means that the atoms and the ions undergo ionization and recombination processes frequently enough so that their temperatures are in equilibrium. Moreover, the ion temperature and should also be in equilibrium because the energy exchange time between the electrons and the ions is evaluated to be in the order of s under the present plasma conditions [8]. is therefore expected to be equal to .
Figure 5b shows the fitting results for the lines obtained at the three timings indicated by the gray lines in Figure 5a. At locations where the recorded signal is low, the fitting becomes less reliable, implying that the system needs to be improved in order to extract more reliable data about the edges of ablation clouds.
Figure 4b shows values obtained as a result of fitting every spectra. The uncertainty of the fitting for the derived is evaluated to be in the order of . The hollow profile in the central region is similar to the Type II shape in Reference [1] where the hole can be interpreted as the presence of a solid core. It should be noted here that even in a narrow slice of an ablation cloud, may have an axisymmetric structure with respect to the central magnetic field line. However, with the present measurement method, it is not possible to derive the detailed structure of inside the field-of-view itself. Nevertheless, the observed radiation comes from the regions where atomic processes take place the most and still give important information for understanding how the ablation mechanism works.
The analysis so far gives no information on where in the ablation cloud these three spectra actually correspond to. The ablation cloud is simultaneously recorded with a fast camera to answer that question. Data obtained with the fast camera are processed by simulating a band-shaped field-of-view that has the same width as the observation system. For each camera image of the time series, all of the pixel-counts located within the virtual field-of-view are added. The temporal development of that integrated signal is plotted by the line with open squares in Figure 4a. From comparing both measurements, the locations of observation of the spectral measurement inside the ablation cloud image are inferred.
Figure 6 shows the ablation cloud images at the timings when the three spectra in Figure 5a are obtained. The virtual field-of-view is shown by vertical lines and it is confirmed that the three spectra actually correspond to the front edge, center, and the back edge positions in the ablation cloud.
It is necessary to note that both measurements were conducted asynchronously and that their sampling rate did not match; the timestamps of the signals have been re-adjusted so that the two data sets have the same “center-of-mass”. The magnitude of the imaging measurement data has been normalized so that the maximum is equal to that of the spectral measurement.
Analyses of ablation clouds with another spectral model where one or more plasma parameters can be derived have been conducted. A study of the effects of the plasma background and of the magnetic field configuration on the plasma parameters in ablation clouds is also ongoing.
4. Conclusions
We have demonstrated the feasibility of obtaining a spatially-resolved measurement in fuel pellet ablation clouds based on a specific spectroscopic method. In addition, it appears that the hollow profile along the axis of the ablation cloud elongation suggested by theoretical simulation is confirmed by this measurement.
Author Contributions
G.S., M.G. and Y.N. conceived and designed the experiments; G.S. and G.M. performed the experiments; G.S. and M.G. analyzed the data; G.S. wrote the paper.
Acknowledgments
The authors would like to thank Keisuke Fujii and the students of his 2015–2016 seminar class of Kyoto University for their assistance in building the spectrometer. The authors would also like to thank all of the members of the LHD Experiment Group for their support in the measurement. This research was supported in part by the LHD project (NIFS17ULHH028) and by Grants-in-Aid for Scientific Research (26287148).
Conflicts of Interest
The authors declare no conflict of interest.
References
- Cseh, G.; Kocsis, G.; Lang, P.T.; Plöckl, B.; Szepesi, T.; Veres, G. The ASDEX Upgrade Team Pellet cloud characterisation, scaling and estimation of the material-and temperature distribution inside the cloud. Nucl. Fusion 2017, 57, 016022. [Google Scholar] [CrossRef]
- Motojima, G.; Sakamoto, R.; Goto, M.; Yamada, H. The LHD experiment group Spectroscopic Diagnostics for Spatial Density Distribution of Plasmoid by Pellet Injection in the Large Helical Device. Plasma Fusion Res. 2010, 5, S1033. [Google Scholar] [CrossRef]
- Motojima, G.; Sakamoto, R.; Goto, M.; Matsuyama, A.; Mishra, J.S.; Yamada, H. Imaging spectroscopy diagnosis of internal electron temperature and density distributions of plasma cloud surrounding hydrogen pellet in the Large Helical Device. Rev. Sci. Instrum. 2012, 83, 093506. [Google Scholar] [CrossRef] [PubMed] [Green Version]
- Sakamoto, R.; Motojima, G.; Hayashi, H.; Inoue, T.; Ito, Y.; Ogawa, H.; Takami, S.; Yokota, M.; Yamada, H. Twenty barrel in situ pipe gun type solid hydrogen pellet injector for the Large Helical Device. Rev. Sci. Instrum. 2013, 84, 083504. [Google Scholar] [CrossRef] [PubMed]
- Sakamoto, R.; Yamada, H.; Tanaka, K.; Tokuzawa, T.; Murakami, S.; Goto, M.; Morita, S.; Ohyabu, N.; Kawahata, K.; Motojima, O. Observation of pellet ablation behaviour on the Large Helical Device. Nucl. Fusion 2004, 44, 624. [Google Scholar] [CrossRef]
- Goto, M.; Sakamoto, R.; Morita, S. Experimental verification of complete LTE plasma formation in hydrogen pellet cloud. Plasma Phys. Control. Fusion 2007, 49, 1163. [Google Scholar] [CrossRef]
- Stehlé, C.; Hutcheon, R. Extensive tabulations of Stark broadened hydrogen line profiles. Astron. Astrophys. Suppl. Ser. 1999, 140, 93–97. [Google Scholar] [CrossRef] [Green Version]
- Wesson, J.; Campbell, D.J. Tokamaks, 2nd ed.; Oxford University Press: Oxford, UK, 1997; pp. 662–664. [Google Scholar]
Figure 1.
Toroidal section schematic where fuel pellet injection experiment is conducted in LHD.

Figure 2.
Unscaled representation of the optical concept of the observation system.

Figure 3.
Temporal development of the discharge: (a) neutral beam injection power and stored energy , (b) line-averaged electron density and central electron temperature (obtained from a far-infrared laser interferometer and Thomson scattering data, respectively), and (c) intensity measured with a system based on an interference filter and a photomultiplier.

Figure 4.
Spatial profile of the ablation cloud: (a) integrated intensities of with the spectral measurement (solid squares) and of the camera image with a virtual band-shaped line-of-sight images (open circles) (b) derived from the analysis of the profile in the spectral measurement.
Figure 4.
Spatial profile of the ablation cloud: (a) integrated intensities of with the spectral measurement (solid squares) and of the camera image with a virtual band-shaped line-of-sight images (open circles) (b) derived from the analysis of the profile in the spectral measurement.

Figure 5.
Spectroscopic data of the ablation cloud: (a) Full spectra obtained at the three timings indicated in Figure 4 (b) Stark-broadening least squares fitting results (solid lines) for the line.
Figure 5.
Spectroscopic data of the ablation cloud: (a) Full spectra obtained at the three timings indicated in Figure 4 (b) Stark-broadening least squares fitting results (solid lines) for the line.


© 2018 by the authors. Licensee MDPI, Basel, Switzerland. This article is an open access article distributed under the terms and conditions of the Creative Commons Attribution (CC BY) license (http://creativecommons.org/licenses/by/4.0/).
Share and Cite
MDPI and ACS Style
Seguineaud, G.; Motojima, G.; Narushima, Y.; Goto, M. Spatially-Resolved Electron Density Measurement in Hydrogen Pellet Ablation Cloud. Atoms 2018, 6, 34. https://doi.org/10.3390/atoms6020034
AMA Style
Seguineaud G, Motojima G, Narushima Y, Goto M. Spatially-Resolved Electron Density Measurement in Hydrogen Pellet Ablation Cloud. Atoms. 2018; 6(2):34. https://doi.org/10.3390/atoms6020034
Chicago/Turabian StyleSeguineaud, Guillaume, Gen Motojima, Yoshiro Narushima, and Motoshi Goto. 2018. "Spatially-Resolved Electron Density Measurement in Hydrogen Pellet Ablation Cloud" Atoms 6, no. 2: 34. https://doi.org/10.3390/atoms6020034
Note that from the first issue of 2016, this journal uses article numbers instead of page numbers. See further details here.