Comparative Studies of Vertebrate Beta Integrin Genes and Proteins: Ancient Genes in Vertebrate Evolution

Abstract
: Intregins are heterodimeric α- and β-subunit containing membrane receptor proteins which serve various cell adhesion roles in tissue repair, hemostasis, immune response, embryogenesis and metastasis. At least 18 α- (ITA or ITGA) and 8 β-integrin subunits (ITB or ITGB) are encoded on mammalian genomes. Comparative ITB amino acid sequences and protein structures and ITB gene locations were examined using data from several vertebrate genome projects. Vertebrate ITB genes usually contained 13–16 coding exons and encoded protein subunits with ∼800 amino acids, whereas vertebrate ITB4 genes contained 36-39 coding exons and encoded larger proteins with ∼1800 amino acids. The ITB sequences exhibited several conserved domains including signal peptide, extracellular β-integrin, β-tail domain and integrin β-cytoplasmic domains. Sequence alignments of the integrin β-cytoplasmic domains revealed highly conserved regions possibly for performing essential functions and its maintenance during vertebrate evolution. With the exception of the human ITB8 sequence, the other ITB sequences shared a predicted 19 residue α-helix for this region. Potential sites for regulating human ITB gene expression were identified which included CpG islands, transcription factor binding sites and microRNA binding sites within the 3′-UTR of human ITB genes. Phylogenetic analyses examined the relationships of vertebrate beta-integrin genes which were consistent with four major groups: 1: ITB1, ITB2, ITB7; 2: ITB3, ITB5, ITB6; 3: ITB4; and 4: ITB8 and a common evolutionary origin from an ancestral gene, prior to the appearance of fish during vertebrate evolution. The phylogenetic analyses revealed that ITB4 is the most likely primordial form of the vertebrate β integrin subunit encoding genes, that is the only β subunit expressed as a constituent of the sole integrin receptor ‘α6β4’ in the hemidesmosomes of unicellular organisms.1. Introduction
Cell surface integrin receptors regulate cell-cell and cell-extra cellular matrix (ECM) interactions and are involved in mediating all known basic cellular processes (proliferation, migration, differentiation and death) in the body. Precise regulations of these cellular processes by a wide range of integrin receptors are witnessed in cells during development and later in life [1,2,3,4,5,6,7]. Disturbance of integrin function/s lead to suboptimal organogenesis in rodent animal models [5,6,7,8] and disease states in human populations [9,10].
An integrin receptor is a heterodimer consisting of an α and a β subunit, each containing extracellular, transmembrane and cytosolic domains. The extracellular domains of receptor subunits bind with the ECM proteins (such as fibronectin, laminin and collagen) and the cytosolic domains of β subunits interact with kinases (focal adhesion kinase and Src kinase), adaptor molecules (such as talin and kindlin) and the cytoskeleton (actin and microtubules) [5,11,12]. These interactions facilitate the ‘outside-in’ and the ‘inside-out’ signaling across the cell membrane by the integrin heterodimers [12,13,14].
While the evolutionary path of integrins in development and maintenance of cellular process are intensive areas of investigation [15,16,17], the evolution of different integrin subunits encoded within the vertebrate genomes remains to be fully elucidated. This knowledge is necessary for understanding the integrin receptors and the evolution of cellular functions that are coordinated by these versatile receptors. Evolution of integrin genes dates back to the time of transition of unicellular life forms into multicellular organisms [18,19]. It is known that the integrin-mediated adhesion system existed in the single celled Amastigomonas (Phylum Apusozoa), possibly for the purpose of attachment with the basal lamina, a transition towards sedentary life and multicellularity [19]. In vertebrates, a phylum that includes ∼53,000 species, the genes coding integrins are identified as early as in fishes (Actinopterygians) that evolved about 450 millions of years ago (Mya) [20]. Here we report the gene structures and amino acid sequences for vertebrate β-integrin encoding genes (ITB) and proteins (ITB), respectively, as well as their phylogenetic and evolutionary relationships. Potential regulatory sites for several human ITB genes, predicted secondary structures of signal peptides and cytoplasmic domains and tissue specific expression for mammalian ITB genes are also discussed in terms of their homology and evolution.
2. Results and Discussion
2.1. Vertebrate ITB Gene Locations and Exonic Structures
Table 1 summarizes the locations and predicted structures for vertebrate ITB genes based upon BLAT interrogations of several vertebrate genomes using the reported sequences for human ITB1 [21,22,23,24], ITB2 [25,26,27]; ITB3 [28,29,30,31]; ITB4 [32,33,34]; ITB5 [35,36,37]; ITB6 [38,39,40]; ITB7 [41,42]; and ITB8 [43,44] and the University of California Santa Cruz (UCSC) Genome Browser [45]. The predicted vertebrate ITB genes predominantly contained 13–16 coding exons, with the exception of vertebrate ITB4 genes which exhibited 36 (opossum ITB8) to 39 coding exons and encoded larger ITB protein subunits (∼1,800 amino acids) as compared with other ITB subunits which contained ∼800 amino acids in sequence (Table 1). ITB genes were separately located on vertebrate chromosomes for each of the genomes examined in comparison with other gene families which may be clustered on a single chromosome (e.g., the alcohol dehydrogenase (ADH) gene family) [46] or a small number of chromosomes such as the lactate dehydrogenase (LDH) gene family [47].
2.2. Vertebrate ITB Signal Peptides and Domain Structures
Application of the SignalP 3.0 server predicted a standard length of signal peptides for ITB1 (20 aa), ITB2 (22 aa), ITB3 (26 aa), ITB4 (27 aa), ITB5 (24 aa), ITB6 (21 aa) and ITB7 (19 aa) subunits except for a long signal sequence (42 aa) for the smallest size integrin isoform ITB8. Although, the server provided a distinct cleavage site for signal peptides in all human ITB forms, a recent study has shown that the signal peptide of the β2 integrin subunit in ruminants containing cleavage inhibition glutamine (Q) was not processed [48]. Not much is known about the signal peptide processing of integrins; however, human ITB1 and ITB2 integrin subunits contain cleavage inhibiting ‘Q’ at the predicted cleavage sites (data not shown). Domain annotation of signal sequences of ITB genes predicted a central helical domain with an anterior and a posterior coiled motifs in ITB1, ITB2, ITB3, ITB5, ITB6 and ITB7 subunits. The signal peptide for ITB8, however, consisted of two central helical motifs separated by a coiled motif and two additional coiled motifs at the N and C terminal ends of the signal peptide. The predicted signal peptide sequences from different ITB subunits showed little evidence of sequence similarity (data not shown) that is not uncommon for signal peptides [49]. The lack of identity amongst the primary structures of signal sequences of different ITB subunits and the similarity amongst the secondary structures (a central hydrophobic core with coiled motifs at the ends) implies that these secondary structures of signal sequences are indispensible conformations for the insertion of the N-terminal ends of beta-subunits into the cell membrane. The reason for the very long signal sequence and two hydrophobic motifs in the ITB8 structure is unclear although it is possible that an additional hydrophobic motif may enhance the processing and translocation of ITB8 into the lipid bilayer [50,51].
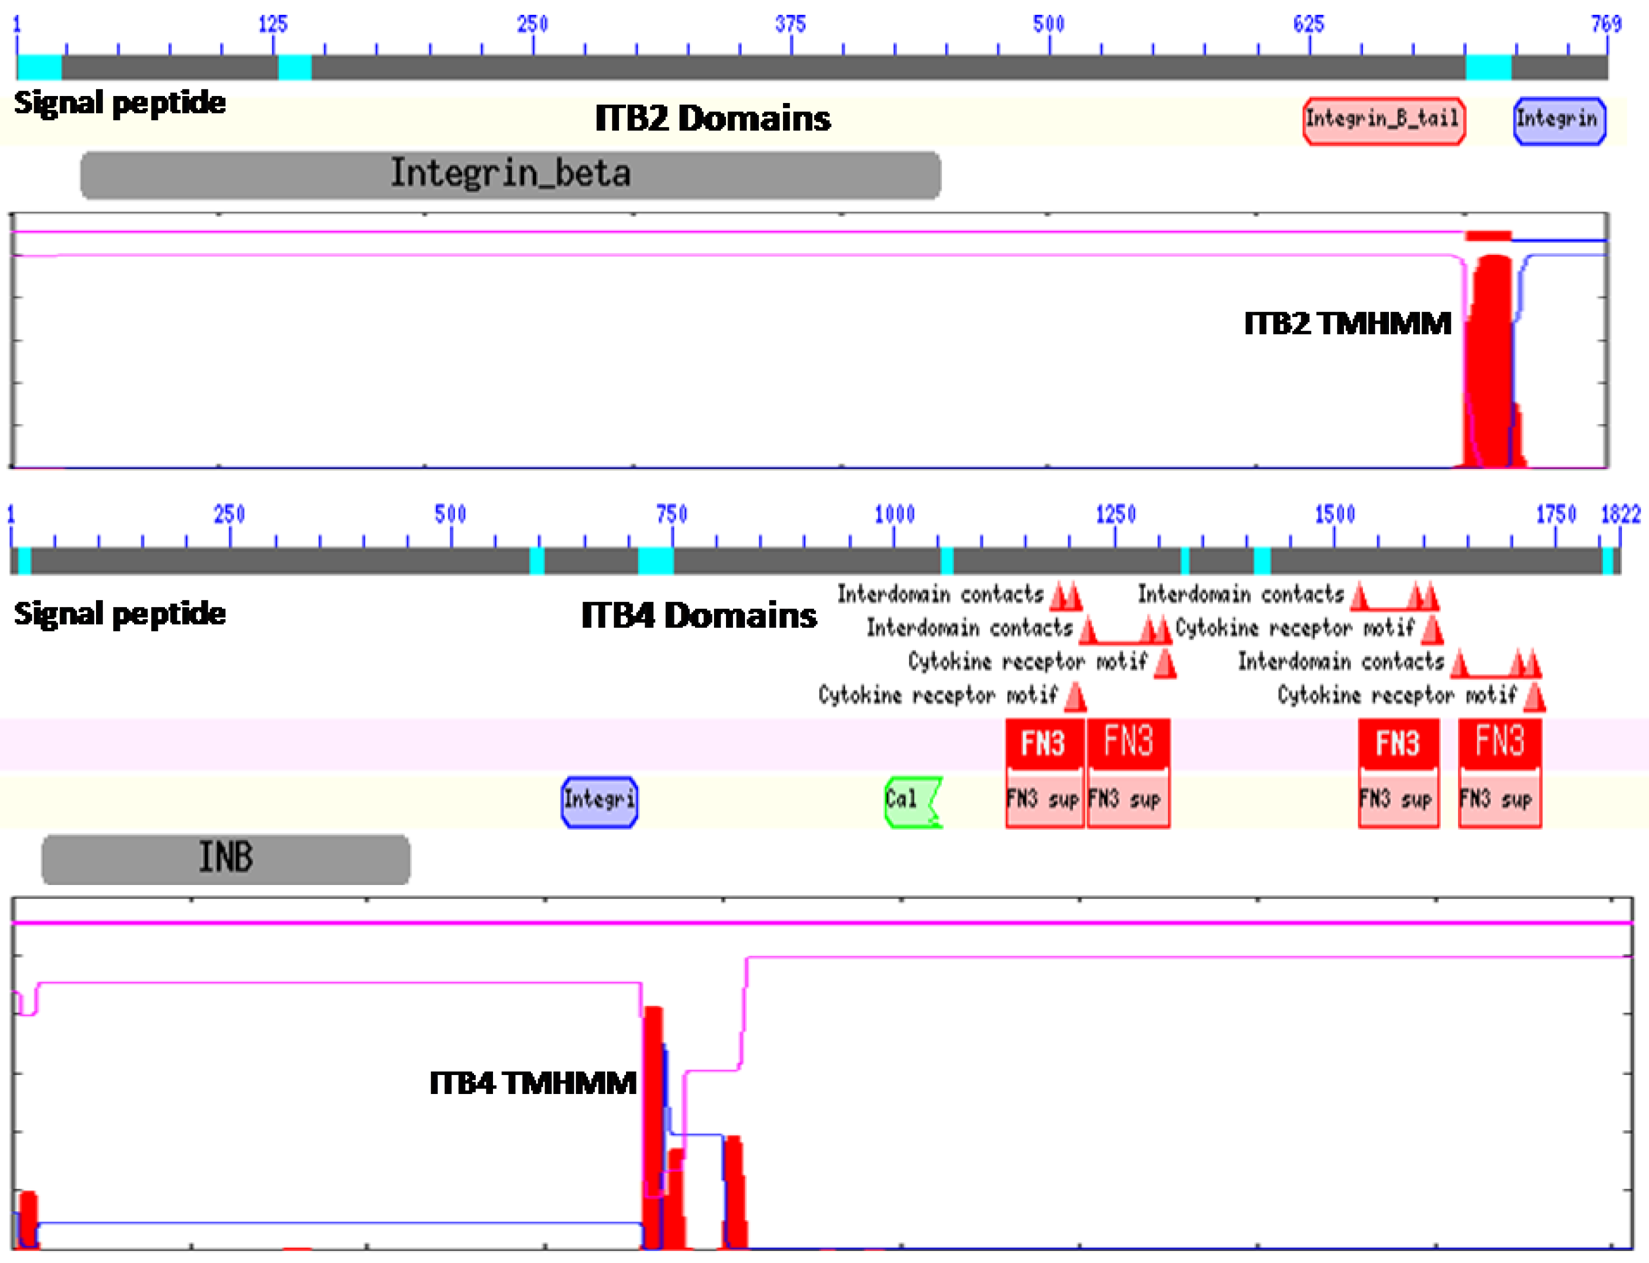
Figure 1 illustrates the predicted domain structures for ITB2 and ITB4, with the former representing the domain structures for ITB1, ITB3, ITB5, ITB6, ITB7 and ITB8 [52] including the N-signal peptide previously described (residues 1–22 for ITB2); an extracellular integrin beta region (pfam00362) (residues 32–447) including a potential cell attachment site (residues 397–399) and a region of cysteine-rich tandem repeats (residues 414–617); an integrin beta tail domain (pfam07965) (residues 622–700); a transmembrane helical region (residues 701–723) (see Figure 1 for ITB2 TMHMM region), which anchors ITB2 to the cell membrane; and an ITB2 cytoplasmic region (residues 724–768).

| Animal | Species | Integrin Beta Gene (subunit) | Other Gene Name | Chromosome Coordinates | Gene Size (kbps) | Coding Exons (Strand) | Subunit MW | Amino Acids | NCBI1,2 ID | UNIPROT2 ID |
|---|---|---|---|---|---|---|---|---|---|---|
| Human | Homo sapiens | ITB1 (β1) | ITGB1 | 10:33,190,501-33,224,486 | 35.2 | 16 (−) | 88,415 | 798 | NM_002211 | P05556 |
| Mouse | Mus musculus | Itb1 (β1) | Itgb1 | 8:131,209,552-131,257,438 | 47.9 | 15 (+) | 88,231 | 798 | NM_010578 | P09055 |
| Horse | Equus caballus | ITB1 (β1) | ITGB1 | 29:5,050,336-5,076,608 | 26.3 | 15 (+) | 88,202 | 798 | XP_0014927152 | na |
| Opossum | Monodelphis domestica | ITB1 (β1) | ITGB1 | 8:240,074,436-240,104,533 | 30.1 | 15 (+) | 88,329 | 799 | XP_0013665672 | na |
| Chicken | Gallus gallus | ITB1 (β1) | ITGB1 | 2:13,977,440-14,000,322 | 22.9 | 15 (+) | 88,554 | 803 | NP_001034343 | P07228 |
| Frog | Xenopus tropicalis | ITB1 (β1) | ITGB1 | 5035:452,582-465,188 | 12.6 | 15 (+) | 88,083 | 798 | NP_989160 | Q6P4X1 |
| Zebrafish | Danio rerio | ITB1A (β1A) | ITGB1A | 24:1,010,009-1,028,526 | 18.5 | 15 (−) | 88,592 | 798 | NP_001030143 | Q3YAA1 |
| Zebrafish | Danio rerio | ITB1B (β1B) | ITGB1B | 2:42,692,236-42,708,345 | 16.1 | 15 (+) | 86,570 | 787 | NP_001030151 | Q3YA99 |
| Human | Homo sapiens | ITB2 (β2) | ITGB2 | 21:46,306,286-46,330,697 | 40.0 | 15 (−) | 84,782 | 769 | NM_001127491 | P05107 |
| Mouse | Mus musculus | Itb2 (β2) | Itgb2 | 10:76,993,093-77,028,419 | 35.3 | 15 (+) | 85,026 | 771 | NM_008404 | P11835 |
| Mouse | Mus musculus | Itb2l (β2l) | Itgb2l | 16:96,643,905-96,665,221 | 21.3 | 15 (−) | 81,547 | 738 | NM_008405 | Q3UV74 |
| Horse | Equus caballus | ITB2A (β2A) | ITGB2A | 26:39,992,918-40,009,865 | 16.9 | 15 (−) | 85,290 | 770 | XP_0014900522 | na |
| Horse | Equus caballus | ITB2B (β2B) | ITGB2B | 26:40,054,164-40,069,857 | 15.7 | 14 (−) | 79,824 | 726 | chr26.199.13 | na |
| Opossum | Monodelphis domestica | ITB2 (β2) | ITGB2 | 2:539,079,162-539,090,540 | 11.4 | 13 (−) | 83,015 | 761 | chr2.11.580.a3 | na |
| Chicken | Gallus gallus | ITB2 (β2) | ITGB2 | 7:7,143,899-7,150,094 | 6.2 | 15 (−) | 85,409 | 772 | NP_990582 | na |
| Frog | Xenopus tropicalis | ITB2 (β2) | ITGB2 | 2185:1,356,257-1,405,734 | 49.5 | 16 (−) | 86,980 | 782 | XP_0029365702 | na |
| Zebrafish | Danio rerio | ITB2 (β2) | ITGB2 | 9:47,603,423-47,619,406 | 16.0 | 15 (+) | 84519 | 768 | XP_6860122 | na |
| Human | Homo sapiens | ITB3 (β3) | ITGB3 | 17:45,331,228-45,387,567 | 37.4 | 9 (+) | 87,058 | 788 | NM_000212 | P05106 |
| Mouse | Mus musculus | Itb3 (β3) | Itgb3 | 11:104,469,370-104,528,689 | 59.3 | 15 (+) | 86,694 | 787 | NM_016780 | O54890 |
| Horse | Equus caballus | ITB3 (β3) | ITGB3 | 11:17,206,504-17,237,153 | 30.7 | 15 (−) | 86,360 | 784 | NM_001081802 | na |
| Opossum | Monodelphis domestica | ITB3 (β3) | ITGB3 | 2:208,102,619-208,154,477 | 51.9 | 14 (+) | 84,497 | 764 | chr2.5.154.a3 | na |
| Chicken | Gallus gallus | ITB3 (β3) | ITGB3 | 27:2,207,723-2,223,943 | 16.2 | 15 (+) | 86,088 | 781 | NP_989646 | na |
| Frog | Xenopus tropicalis | ITB3 (β3) | ITGB3 | 9735:169,881-200,256 | 30.4 | 15 (−) | 88,235 | 792 | XP_0029424013 | na |
| Zebrafish | Danio rerio | ITB3A (β3A) | ITGB3A | 3:16,152,931-16,181,252 | 28.3 | 15 (+) | 85,693 | 785 | NP_001032312 | Q3LTM4 |
| Zebrafish | Danio rerio | ITB3B (β3B) | ITGB3B | 12:21,495,417-21,520,656 | 25.2 | 15 (−) | 87,700 | 790 | NP_001076417 | B3DIP9 |
| Human | Homo sapiens | ITB4 (β4) | ITGB4 | 17:73,720,784-73,753,633 | 36.4 | 39 (+) | 202,167 | 1,822 | NM_000213 | P16144 |
| Mouse | Mus musculus | Itb4 (β4) | Itgb4 | 11:115,836,039-115,869,725 | 33.7 | 39 (+) | 201,650 | 1,818 | NM_133663 | A2A863 |
| Horse | Equus caballus | ITB4 (β4) | ITGB4 | 11:6,286,192-6,312,590 | 26.4 | 39 (−) | 194,864 | 1,752 | XP_0019159152 | na |
| Opossum | Monodelphis domestica | ITB4 (β4) | ITGB4 | 2:213,276,209-213,319,767 | 43.6 | 36 (−) | 198,824 | 1,778 | XP_0013776062 | na |
| Chicken | Gallus gallus | ITB4 (β4) | ITGB4 | 18:4,713,504-4,732,758 | 19.3 | 39 (−) | 203,330 | 1,818 | E1C9G74 | E1C9G7 |
| Frog | Xenopus tropicalis | ITB4 (β4) | ITGB4 | 5455:495,511-545,134 | 49.6 | 38 (+) | 204,208 | 1,835 | XP_0029400202 | na |
| Zebrafish | Danio rerio | ITB4 (β4) | ITGB4 | 8:13,034,599-13,080,896 | 46.3 | 39 (+) | 210,736 | 1,893 | NP_001019557 | Q4U0S1 |
| Human | Homo sapiens | ITB5 (β5) | ITGB5 | 3:124,482,473-124,605,847 | 139.5 | 15 (−) | 88,054 | 799 | BC0065416 | P18084 |
| Mouse | Mus musculus | Itb5 (β5) | Itgb5 | 3:126,102,954-125,963,482 | 139.5 | 15 (+) | 87,909 | 798 | NM_010580 | O70309 |
| Horse | Equus caballus | ITB5 (β5) | ITGB5 | 19:34,769,099-34,876,312 | 107.2 | 15 (+) | 87,985 | 803 | XP_0015000772 | na |
| Opossum | Monodelphis domestica | ITB5 (β5) | ITGB5 | 4:90,575,064-90,751,974 | 17.7 | 14 (−) | 86,072 | 779 | XP_0013727112 | na |
| Chicken | Gallus gallus | ITB5 (β5) | ITGB5 | 7:29,463,064-29,500,494 | 37.4 | 15 (−) | 88,475 | 812 | NP_989814 | na |
| Frog | Xenopus tropicalis | ITB5 (β5) | ITGB5 | 6 | 6 | 6 | 87,561 | 807 | NP_001135704 | B5DEV6 |
| Zebrafish | Danio rerio | ITB5 (β5) | ITGB5 | 9:22,031,538-22,101,156 | 69.6 | 16 (+) | 88,956 | 802 | NP_001076305 | A5D6V1 |
| Human | Homo sapiens | ITB6 (β6) | ITGB6 | 2:160,958,250-161,056,574 | 172.2 | 15 (−) | 85,936 | 788 | NM_000888 | P18564 |
| Mouse | Mus musculus | Itb6 (β6) | Itgb6 | 2:160,836,644-160,664,416 | 172.2 | 15 (+) | 86,042 | 787 | NM_021359 | Q9Z0T9 |
| Horse | Equus caballus | ITB6 (β6) | ITGB6 | 18:40,790,052-40,860,613 | 70.6 | 15 (−) | 85,817 | 788 | XP_0014929142 | na |
| Opossum | Monodelphis domestica | ITB6 (β6) | ITGB6 | 4:165,626,656-165,720,419 | 93.8 | 15 (−) | 86,274 | 787 | ENSMODT65823 | na |
| Chicken | Gallus gallus | ITB6 (β6) | ITGB6 | 7:23,382,214-23,409,883 | 27.7 | 15 (+) | 86,530 | 789 | XP_4220372 | E1C6K8 |
| Frog | Xenopus tropicalis | ITB6 (β6) | ITGB6 | 515:1,605,719-1,638,193 | 32.5 | 13 (+) | 76,152 | 696 | NP_001090775 | A4IGI8 |
| Human | Homo sapiens | ITB7 (β7) | ITGB7 | 12:53,585,343-53,594,227 | 16.3 | 15 (−) | 86,903 | 798 | NM_000889 | P26010 |
| Mouse | Mus musculus | Itb7 (β7) | Itgb7 | 15:102,046,428-102,062,317 | 15.9 | 15 (−) | 87,411 | 806 | NM_013566 | P26011 |
| Horse | Equus caballus | ITB7 (β7) | ITGB7 | 6:70,193,060-70,201,400 | 8.3 | 14 (−) | 86,666 | 797 | XP_0014949172 | na |
| Frog | Xenopus tropicalis | ITB7 (β7) | ITGB7 | 226:1,387,775-1,412,224 | 24.5 | 15 (+) | 84,461 | 766 | XP_0029366862 | na |
| Zebrafish | Danio rerio | ITB7 (β7) | ITGB7 | 6:43,251,691-43,271,173 | 19.5 | 15 (−) | 74,006 | 661 | XP_0013379492 | na |
| Human | Homo sapiens | ITB8 (β8) | ITGB8 | 7:20,371,430-20,449,617 | 85.1 | 14 (+) | 85,632 | 769 | NM_002214 | P26012 |
| Mouse | Mus musculus | Itb8 (β8) | Itgb8 | 12:120,477,276-120,396,490 | 80.8 | 14 (−) | 84,519 | 767 | NM_177290 | Q0VDB0 |
| Horse | Equus caballus | ITB8 (β8) | ITGB8 | 4:52,216,892-52,290,256 | 73.4 | 14 (+) | 85,361 | 767 | XP_0014972712 | na |
| Opossum | Monodelphis domestica | ITB8 (β8) | ITGB8 | 8:302,826,175-302,899,169 | 73.0 | 14 (−) | 83,721 | 757 | XP_0013718342 | na |
| Chicken | Gallus gallus | ITB8 (β8) | ITGB8 | 2:30,002,182-30,052,908 | 49.3 | 15 (+) | 86,990 | 786 | XP_4187062 | na |
| Frog | Xenopus tropicalis | ITB8 (β8) | ITGB8 | 525:945,865-97,887 | 33.0 | 14 (−) | 81,104 | 728 | XP_0029333442 | na |
| Zebrafish | Danio rerio | ITB8 (β8) | ITGB8 | 19:2,377,677-2,441,753 | 64.1 | 14 (−) | 74,877 | 669 | XP_0019196262 | A3RI57 |
| Nematode | Caenorhabditis elegans | PAT3 | pat3 | III:3,909,309-3,914,106 | 4.8 | 8 (−) | 90,138 | 809 | NP_497787 | Q27874 |

In contrast, ITB4 is a much larger protein compared with the other beta-integrins (1822 residues compared with 769–798 residues) and contains several beta-integrin-like domains in the N-terminal half of the protein [12,53,54] including the N-signal peptide (residues 1–27); an N-terminal extracellular beta-integrin domain (residues 37–453); a cysteine-rich tandem-repeat region (residues 456–619); an integrin beta-tail region (residues 626–711); and an ITB4 transmembrane-helix anchor region (residues 711–733) (Figure 1). The cytoplasmic region of ITB4 contains four fibronectin type III (FN3) domains (residues 1128–1215; 1220–1313; 1528–1628; and 1641–1734) and a Calx-beta motif (residues 991–1054) which are responsible for most of the intracellular interactions of the integrin [53,54,55,56]. Other key cytoplasmic ITB4 domains include several interdomain contact sites (residues 1641, 1708 and 1723) and cytokine-receptor motifs (1608–1609 and 1611–1612).
2.3. Alignments of Vertebrate ITB Cytosolic Isoform Sequences
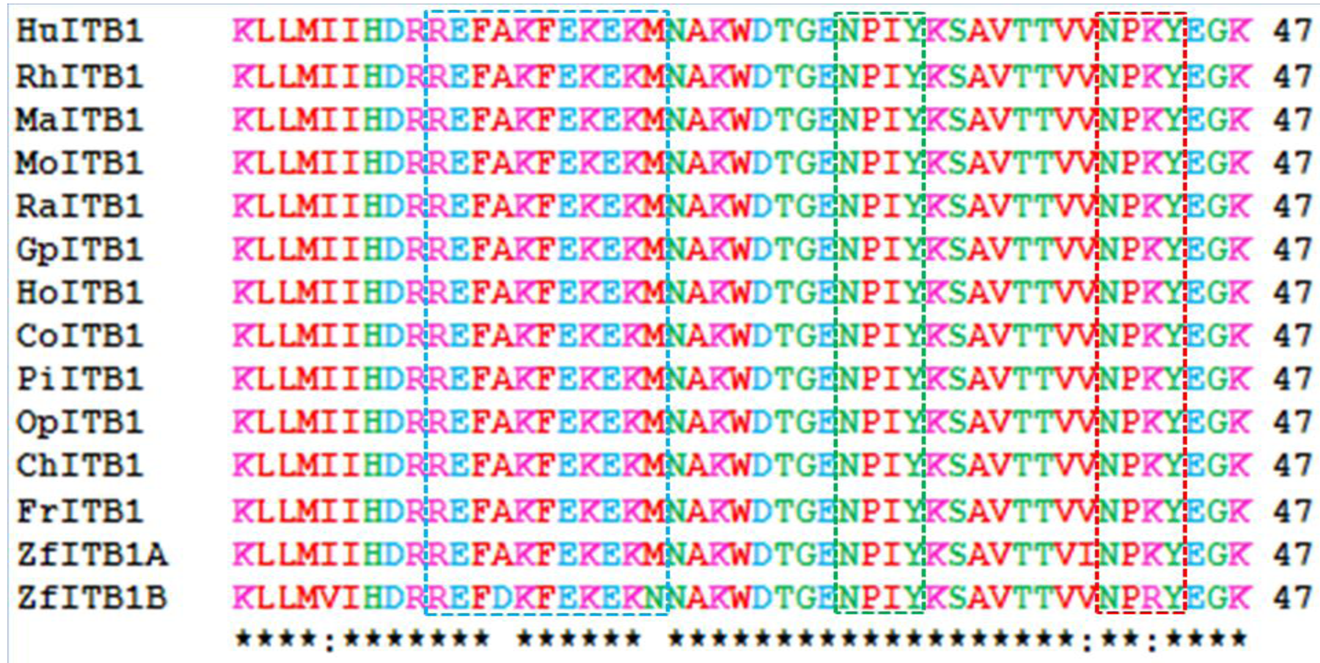
The cytoplasmic domains of β subunits interact with several intracellular proteins. Many of these interactions are known to cause conformational change in the extracellular domain changing the affinity of the receptor with the ECM. The interactions of extracellular domains with the ECM may also cause change in the conformation of the cytosolic domain allowing its interaction with the non-receptor tyrosine kinases and the actin cytoskeleton. Therefore, the cytoplasmic domain of integrin β subunits plays crucial roles in both ‘outside-in’ and ‘inside-out’signaling [12,13,14]. Figure 2 examines alignments of vertebrate ITB1 cytosolic domain sequences which are color coded for amino acid residue properties. With the exception of a second duplicated ITB1.1 (designated as ITB1B) gene product observed in zebrafish (Danio rerio), identical sequences were observed for the ITB1 cytosolic domain for all vertebrates examined, which indicates that this is a highly conserved region of ITB1 which undertakes essential functions and is subject to selection and maintenance of this sequence. Comparisons of the cytosolic domain sequences for the other ITB proteins (alignments not shown) revealed lower levels of amino acid sequence identities as compared with the highly conserved ITB1 cytosolic domain sequence: ITB2 (37% identities); ITB3 (77% excluding the gene duplicate product ITB3B from zebrafish); ITB5 (50%); ITB6 (74%); ITB7 (35%); and ITB8 (45%).

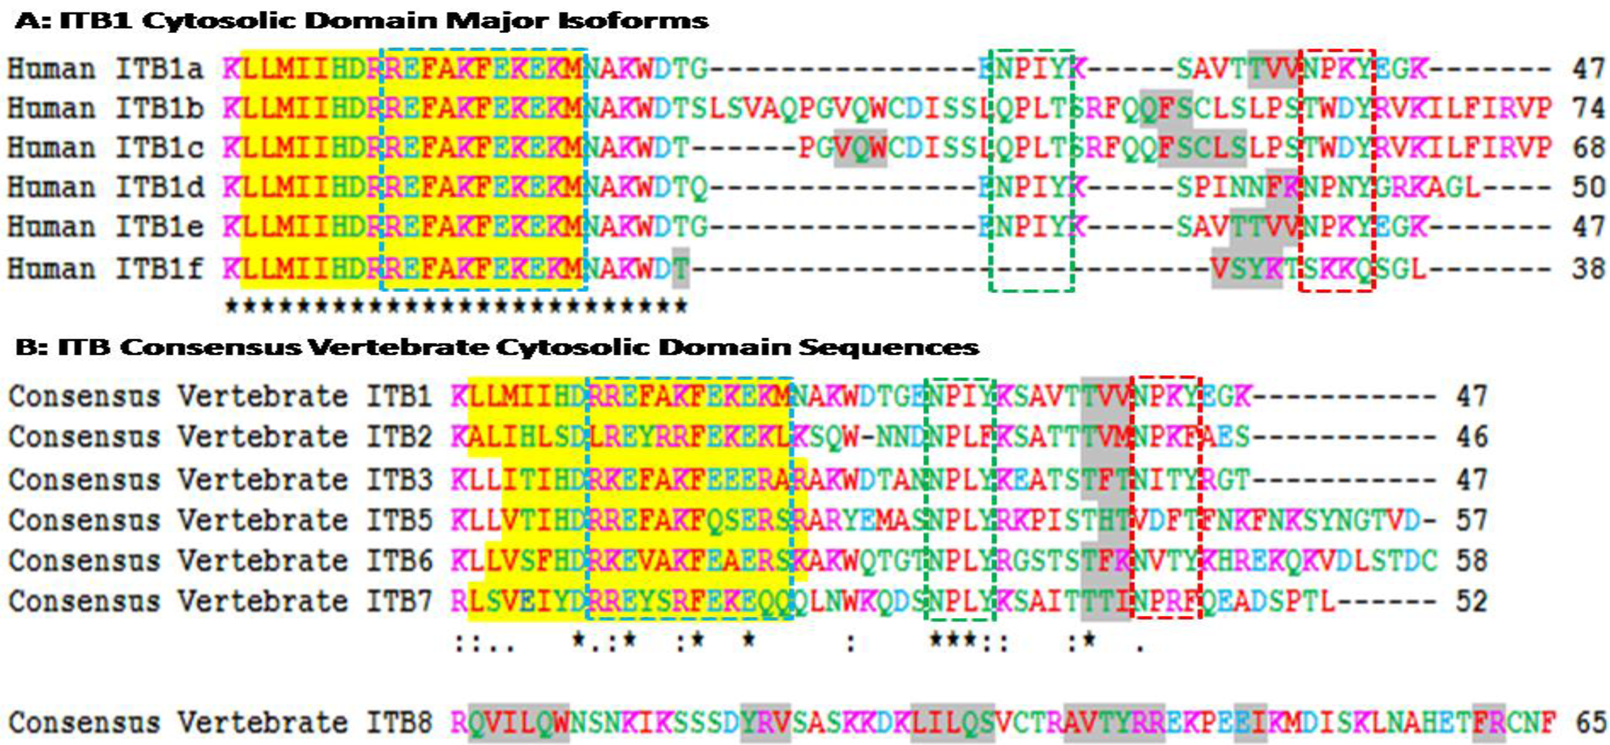
Figure 3A shows amino acid sequence alignments for the six major human ITB1 isoforms designated as ITB1a-ITB1f [57]. Residues 1–26 were identical for each of the isoforms which contained the 19 residue α-helix region, whereas the C-terminal differed in length and sequence and exhibited 1–2 predicted β-sheet regions. Recent studies [58] have shown that ITB1a is expressed in fetal muscles but is substituted by ITB1d during postnatal development. The C-terminal region is exposed at the cytoplasmic face of the plasma membrane where it is bound to the actin filaments. ITB1d is expressed only in striated muscle tissues and binds to both cytoskeletal and extracellular matrix proteins with an affinity higher than ITB1a which provides a stronger link between the cytoskeleton and extracellular matrix to support mechanical tension during muscle contraction. ITA1a and ITA1b have been shown to be similar as far as the alpha/beta association and fibronectin binding are concerned but differ, however, in their subcellular localization. ITB1a has been localized in focal adhesions whereas ITBb does not and exhibits distinct properties [22]. Human ITB1 isoforms are differentially expressed in tissues and exhibit distinct binding properties. HumanITB1a is widely expressed and usually coexpressed with other isoforms with a more restricted distribution. ITB1b is expressed in skin, liver, skeletal muscle, cardiac muscle, placenta, umbilical vein endothelial cells, neuroblastoma cells, lymphoma cells, hepatoma cells and astrocytoma cells. ITB1c is expressed in muscle, kidney, liver, placenta, cervical epithelium, umbilical vein endothelial cells, fibroblast cells, embryonic kidney cells, platelets and several blood cell lines, whereas ITB1d is expressed specifically in striated muscle (skeletal and cardiac muscle).

Amino acid sequence alignments for vertebrate consensus sequences ITB cytosolic domains are shown in Figure 3B. Human ITB sequences were based on previous reports for ITB1 [21,22,23,24]; ITB2 [25,26,27]; ITB3 [28,29,30,31]; ITB5 [35,36,37]; ITB6 [38,40]; ITB7 [39,41,42]; and ITB8 [43,44]. With the exception of the human ITB8 sequence, the other ITB sequences were of similar length (46-58 amino acids) and shared a predicted 19 residue α-helix region (residues 2–20 for human ITB1) whereas the human ITB8 sequence contained 65 amino acids with 6 predicted β-sheets.
The cytoplasmic tail of the ITB4 subunit is exceptionally long (1072 residues) compared to other ITB subunits [33] that are much shorter (Figure 3). Point mutation analysis of the cytoplasmic sequences of these β integrin subunits reveal three clusters of amino acids in the β cytoplasmic tail that regulate the interaction of integrins with the cytoskeleton, localization of receptors at the adhesion complex and inside-out signaling [12,13,59,60,61,62]. These three clusters of amino acids (Signalins) are commonly known as cyto 1, cyto-2 and cyto-3: cyto-1 is present in the vicinity of transmembrane domain, whereas cyto-2 (NPXY motif) and cyto-3 (NXXY motif) are located in the proximal and distal regions respectively of a tail (Figure 2) [63]. Alignment results of ITB1 subunits of different species (Figure 2) and spliced versions of ITB1 subunits (Figure 3A) show that the cyto-1 residues remain highly conserved indicating their conservation during vertebrate evolution for their specificity in function. Recent studies have shown that the interaction between the conserved arginine residue in the α-tail and aspartate residue in the β-tail, and by the hydrophobic residues immediately N-terminal to the arginine and aspartate residues play important role in ‘inside-out’ signalling by forming a ‘clasp’ between the α and β subunits [64,65].
The cyto-3 sequence in contrary varied amongst the spliced versions of ITB1 and the different ITB subunits (Figure 3). Therefore, the variability in the functions of different spliced versions of ITB1 (Figure 3A) and amongst different ITB isoforms (Figure 3B) may be derived from the differences in the cyto 2 and cyto 3 sequences. Moreover, each β subunit conceals distinct differences in its affinity towards intracellular proteins that is shown to be dictated by the ‘X’ and the neighboring amino acids of these motifs [66]. For instance, the binding of ICAP-1α, a 200amino acid protein, with the cyto-3 is influenced by the proximal Val787 and Val 790 [66,67,68]. The NPXY and NXXY motifs, with the propensity to form β turns, act as canonical recognition sequences of intracellular proteins with phosphotyrosine-binding domains (PTB) [66]. These include the interaction of β1A tail with the PTB domain of talin, EPS8 and Dab1; β2 tail with Dok-1 and talin; β3 tail with Numb, Dab1, EPS8, Tensin, Dok-1 and talin; β5 tail with Numb, Dab1, Dab2, EPS8, Tensin, Dok-1 and talin and the β7 tail with tensin, Dok-1 and Talin [67].
Recent studies have reported that cytosolic proteins kindlin-1, 2 and 3 are essential for integrin activation [68,69]. Immuno-precipitation assays with β integrin tails show that isoforms of kindlins bind with membrane proximal NPXY and membrane distal NXXY motifs as well as neighboring residues (NPXY linker region) of the β integrin subunit [69]. Several other cytosolic proteins (including filamin, melusin and myosin) also bind both conserved and non-conserved domains of β cytoplasmic tails [70]. Therefore, differences in the residues within and around these motifs in vertebrate β integrin subunits may change the affinities of these cytosolic proteins with the β integrin tail. Phosphorylation of the tyrosine residue in the distal NXXY motif of the β3 subunit disrupts the recognition by kindlin-2 and co-activation of aIIb.b3 integrin by talin [71,72]. The phosphoryalated or unphosphorylated state of tyrosines may also determine the affinities of proteins with the cytosolic tail. The unphosphorylated state of Y747 in the of β3 integrin tail has a 3 fold preference for the talin over the PTB domain of Dok1, whereas with the phosphorylated state of Y747, this affinity is increased 400 fold for Dok1 and decreased 2 fold for talin [73]. A recent study shows that phosphorylation of tyrosine 759 inhibits binding of kindling-2 with the C-terminal β3 chain [71]. Thus the expression patterns of different β subunits (Figure 5) and interacting proteins in the cytosol as well the phosphorylation state of ‘Y’ may determine the functional output of the integrin receptors.
2.4. Human ITB genes: Introns, Isoforms and Predicted Regulatory Regions
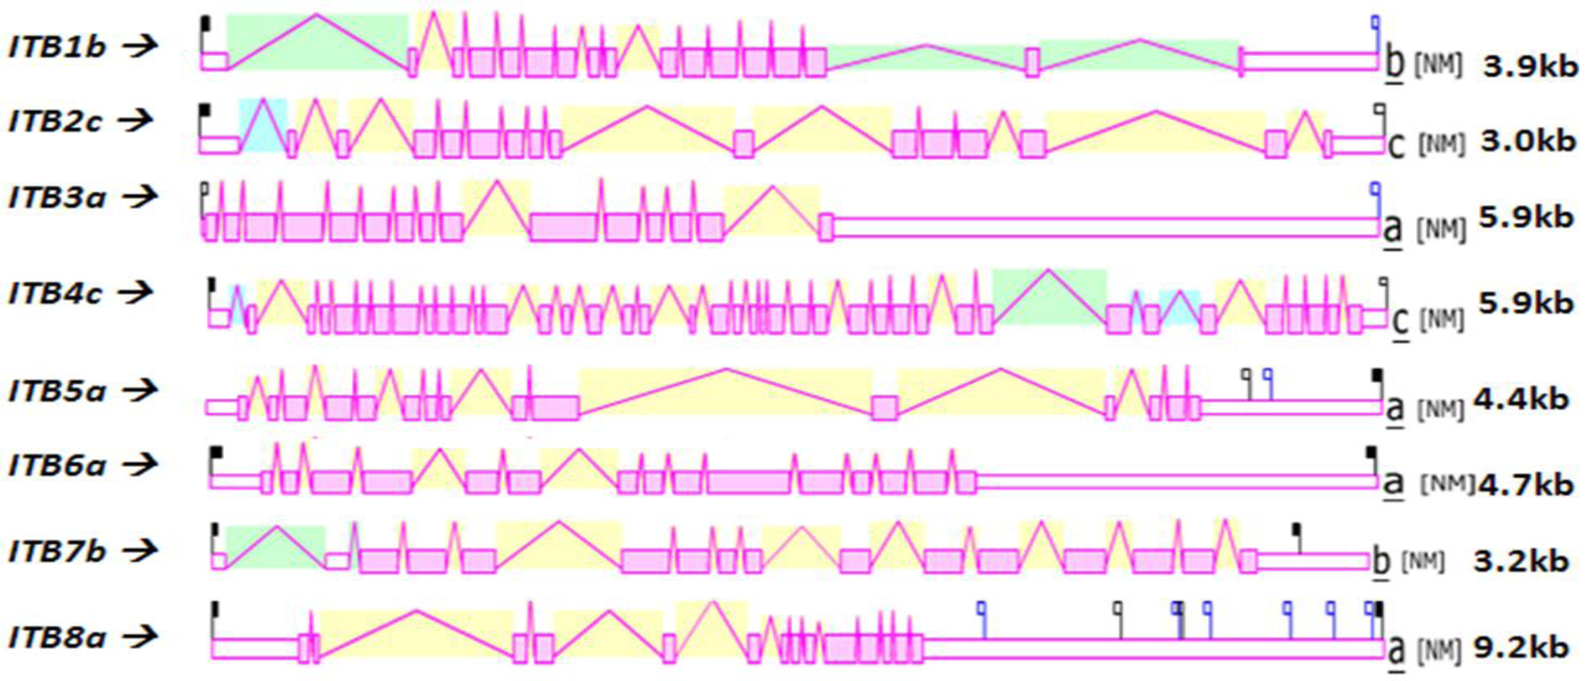
Figure 4 shows the predicted structures of mRNAs for human ITB transcripts for the major isoform in each case [57]. The transcripts were 3.0–9.2 kbs in length and exhibited distinct exonic structures in each case, including extended 3′-untranslated regions (UTR), especially for ITB3a, ITB6a and ITB8a transcripts. The number of ITB introns varied widely among the vertebrate genes examined: the ITB4 gene contained the largest number of introns (39) followed by ITB1 (16), ITB2 and ITB7 (15), ITB3, ITB5 and ITB6 (14) and ITB8 (13).
The human ITB genome sequences contained several predicted transcription factor binding sites (TFBS), microRNA sites located in the 3′-untranslated region and CpG islands, which included CpG158, CpG92, CpG91, CpG152 and CpG133 located in the 5′-untranslated region of human ITB1, ITB3, ITB4, ITB5 and ITB8, respectively (see Table 2). These CpG islands within the ITB gene promoters may play major contributing roles in maintaining high levels of gene expression (1.4–6.1 times the average for human genes) [57] which are similar to CpG islands within housekeeping gene promoters expressed in most tissues [74]. Large numbers of TFBS sites were observed for most of the human ITB genes examined, including 51, 56 and 105 such sites for ITB4, ITB6 and ITB8, respectively. Of particular significance for the human ITB1 and ITB3 gene promoters is the transcription factor, HoxD3, that binds directly to these promoters and assists in regulating the expression of integrins α5β1 and αVβ3 during angiogenesis [75]; the PPARα (peroxisome proliferator-activated receptor-α) that regulates gene expression in vascular cells and inhibits TGF (transforming growth factor)- β-induced ITB5 transcription [76] and Hox A10, that directs the regulation of the ITB3 gene in human endometrial cells and regulates transcription of ITB3 during myeloid differentiation [77,78]. Moreover, the genes encoding the integrin subunits β7, β3, β6 and β8 map to 12q13.13, 17q21.32, 2q23-q31 and 7p15-p21 positions respectively which are close to HOXC, HOXB, HOXD and HOXA genes suggesting a common divergence of these genes during vertebrate evolution [79].
| Animal | Species | Integrin Beta Gene | Other Gene Name | CpG Islands | TFBS | MiR-Sites 3′ region | Expression Level (x average) | Major Tissue Expression |
|---|---|---|---|---|---|---|---|---|
| Human | Homo sapiens | ITB1 | ITGB1 | CpG:158 | 39 | 8 | 6.1 | wide expression |
| ITB2 | ITGB2 | CpG18,21,22 | 7 | 0 | 3.8 | thymus, spleen, bone | ||
| ITB3 | ITGB3 | CpG92 | 10 | 5 | 1.4 | placenta, kidney, skin | ||
| ITB4 | ITGB4 | CpG19,22,62,91 | 51 | 2 | 4.6 | colon, ovary, pancreas | ||
| ITB5 | ITGB5 | CpG152 | 47 | 0 | 4.5 | lung, ovary, kidney | ||
| ITB6 | ITGB6 | 0 | 56 | 0 | 1.3 | pancreas, lung, kidney | ||
| ITB7 | ITGB7 | CpG48 | 20 | 0 | 0.8 | leukocytes, spleen | ||
| ITB8 | ITGB8 | CpG133 | 105 | 35 | 2.2 | wide expression | ||
| Mouse | Mus musculus | Itb1 | Itgb1 | CpG120 | na | 3 | 2.0 | wide expression |
| Itb2 | Itgb2 | 0 | na | 0 | 1.6 | thymus, spleen, bone | ||
| Itb2l | Itgb2l | 0 | na | 0 | 0.3 | bone marrow | ||
| Itb3 | Itgb3 | CpG522 | na | 3 | 0.5 | spleen, placenta | ||
| Itb4 | Itgb4 | CpG38,59 | na | 1 | 1.8 | mammary, brain | ||
| Itb5 | Itgb5 | CpG87 | na | - | 3.7 | mammary, lung | ||
| Itb6 | Itgb6 | 0 | na | 1 | 0.4 | kidney, bladder, heart | ||
| Itb7 | Itgb7 | CpG26 | na | 0 | 1.1 | spleen, mammary | ||
| Itb8 | Itgb8 | CpG316 | na | 2 | 1.2 | mammary, kidney | ||
Several microRNA (miRNA) binding sites within the 3′-untranslated region (3′-UTR) of human ITB mRNA were also identified (Table 2). These microRNA species are phylogenetically conserved and regulate mRNA and protein expression during embryonic development [80,81]. MiRNA 183, for example, inhibits tumor invasiveness and participates in the development and function of neurosensory organs by targeting the ITB1 (mRNA) gene [82] whereas ITB3 gene expression is apparently regulated by miRNA let-7a in malignant melanoma [83]. Over-expression of mir-124 attenuates endogenous ITB1 expression in oral squamous cell carcinomas [84] while microRNA miR-93 promotes tumor growth and angiogenesis by decreasing ITB8 transcripts [85]. The number of microRNAs that target the 3′ UTR of human ITB transcripts (4 for ITB1, 44 for ITB2, 5 for ITB3, 1 for ITB4, 53 for ITB5, 11 for ITB6, 30 for ITB7 and 2 for ITB8) varies widely among the human ITB genes examined. The absence of redundancy among this wide range of microRNA species regulating the levels of human integrin subunits suggests that the evolution of the C-terminal non-coding regions of these subunits followed a divergent path for the purpose of regulating the levels of expressions of each ITB subunits in different cells. The regulation of ITB4 by a single microRNA further suggests that the expression of this subunit is not intensely regulated at the post-transcriptional stage in comparison with the other human ITB genes.
Brendle and coworkers [86] have also examined single nucleotide polymorphisms (SNPs) in predicted miRNA sites for several ITA and ITB genes and the potential association of these SNPs with breast cancer risk (BCR) and reported a potential BCR marker for one of the ITB4 miRNA binding sites. A likely mechanism for mi-RNA translational regulation has been recently reported [87]. MicroRNAs have been shown to be transcribed as long primary-miRNAs (pri-miRNAs) in the nucleus and processed in the cytoplasm into 19-22 bp mature mi-RNAs which anneal to the 3′-UTR of target mRNAs to promote degradation or translational repression [88]. Moreover, considerable flexibility has been reported for mi-RNAs which are capable of targeting hundreds of genes while individual 3′-UTR mi-RNA regions may be a target for several distinct mi-RNAs [89,90]. The miRNA sequences within the 3′-UTR of human ITB genes are therefore likely to play a major role in regulating the translation of these genes within vertebrate tissues.
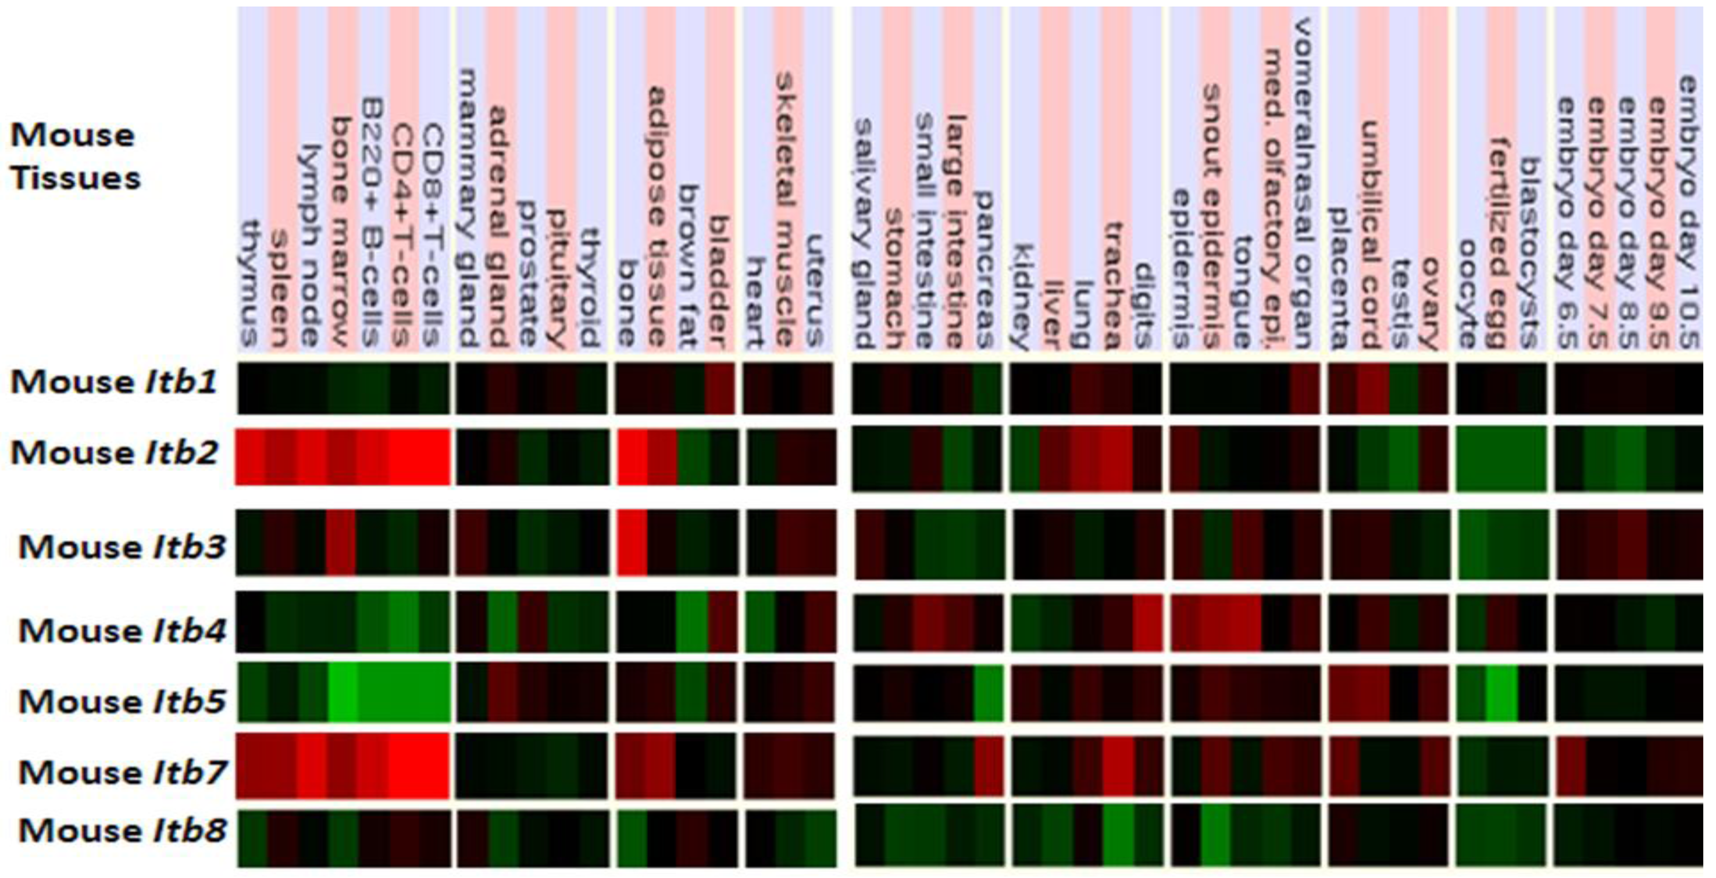
2.5. Comparative Human and Mouse ITB Tissue Expression
Figure 5 presents ‘heat maps’ showing comparative Itb gene expression for various mouse tissues obtained from GNF Expression Atlas Data using GNF1M chips ( http://genome.ucsc.edu; http://biogps.gnf.org) [91]. These data supported a broad and high level tissue expression for mouse Itb7, including during early embryonic development. A very high level of expression for Itb2 and Itb7 in bone marrow, spleen and lymphocytes are consistent with their involvement in forming the integrin receptors in blood cells [92]. The Itb4 expression was highest in epidermal tissues and is consistent with its presence in the hemidesmosomes of these epithelial cells [93,94]. It may be noted that ITB4 pairs only with the α6 subunit forming a laminin-binding receptor providing stable adhesion of epithelial cells with the basement membrane [95,96]. Other comparisons of mouse Itb tissue expression indicated significant differences, including higher levels of Itb3 expression in bone but with lower expression levels for Itb8 in most tissues examined. Overall, mouse Itb tissue expressions levels were up to 3.7 times the average level of gene expression [57] which supported key roles played by these membrane receptor proteins which serve various cell adhesion roles in tissue repair, hemostasis, immune response, embryogenesis and metastasis [92]. Similar tissue distribution profiles for ITB gene expression were observed for human tissues, including an overall high level gene expression ranging from 0.8–6.1 times the average level of human gene expression (Table 2).

2.6. Evolution of Vertebrate ITB Genes and Proteins
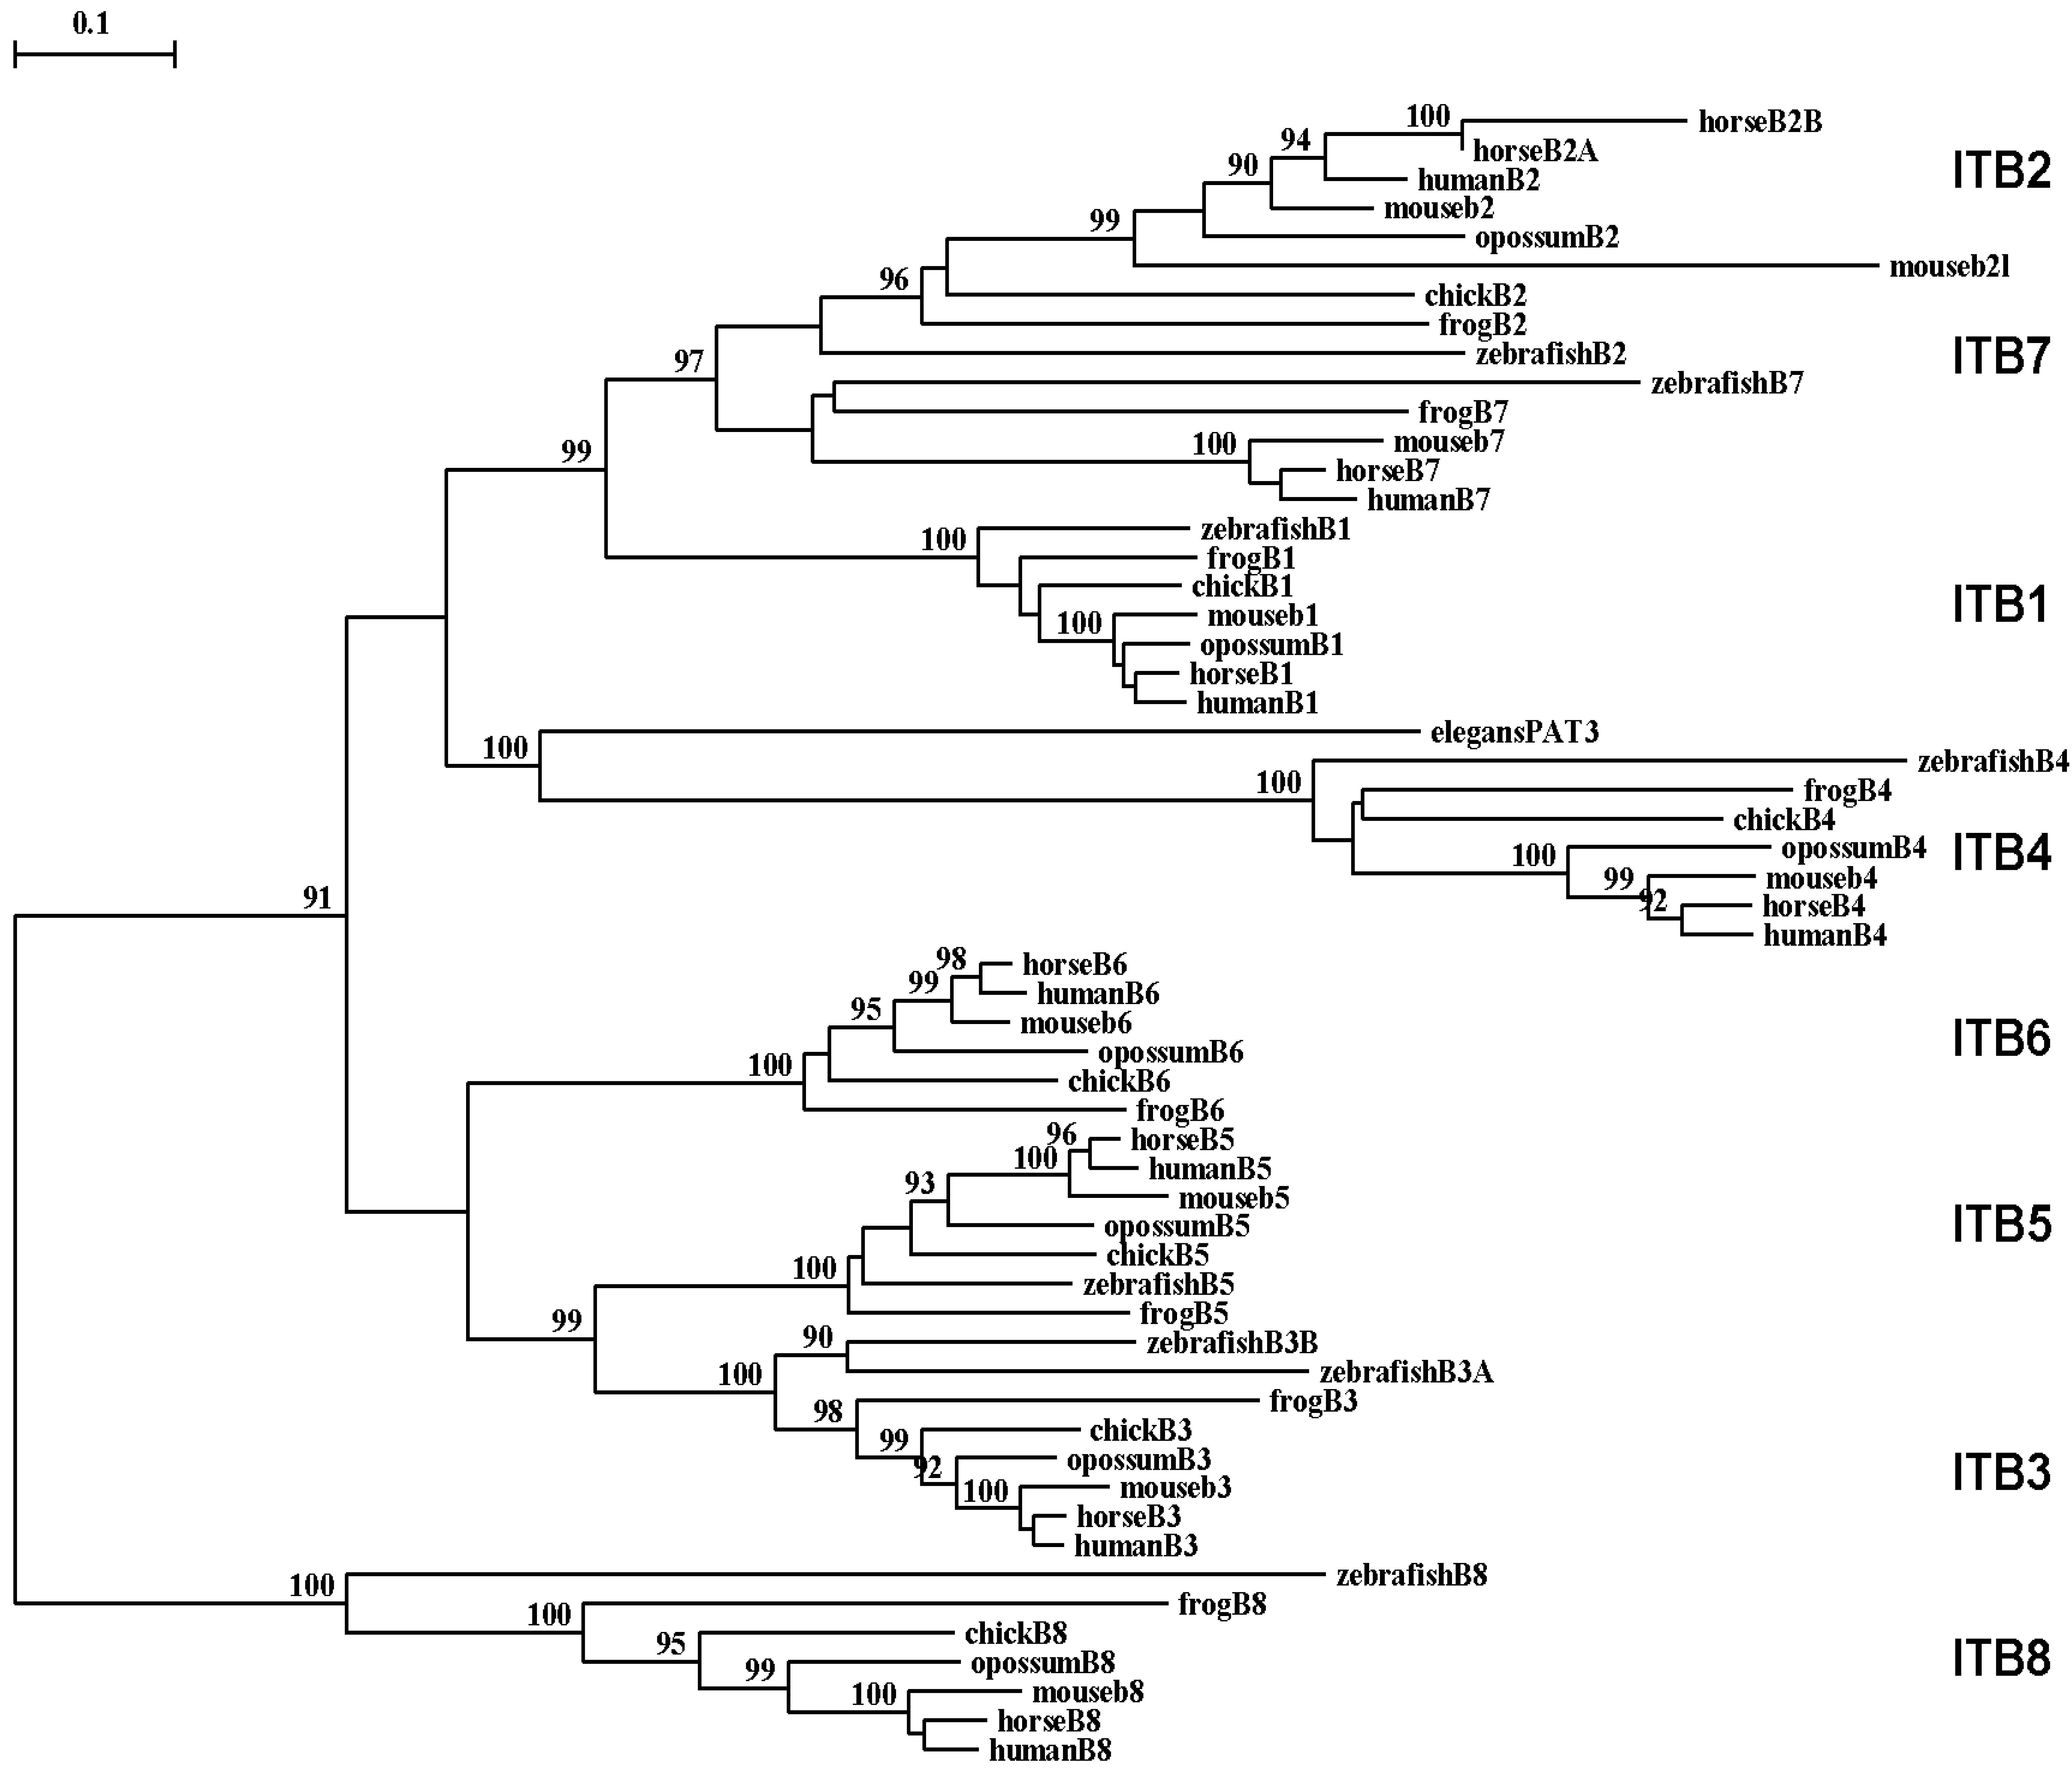
A phylogenetic tree (Figure 6) was calculated by the progressive alignment of 61 vertebrate ITB amino acid sequences with vertebrate ITB1-8 sequences which was rooted with the Caenorhabitis elegans (nematode) ITB-like sequence (see Table 1). The phylogram showed clustering of the ITB sequences into groups which were consistent with their evolutionary relatedness, as well as groups for each of vertebrate ITB1–ITB8 which were distinct from the nematode ITB-like sequence. These groups were significantly different from each other (with bootstrap values of >90) and showed closer relatedness for the following ITB gene groupings: group 1: ITB1-ITB2-ITB7; group 2: vertebrate ITB4 with the elegans ITB-like sequence (PAT3); group 3: ITB3-ITB5-ITB6; and group 4: ITB8, which is the most distinct group in terms of its relatedness to other ITB gene families. It is apparent from this study of vertebrate ITB genes and proteins that these are ancient proteins for which a proposed common ancestor for the ITB genes may have predated the appearance of fish >500 millions of years ago [96].
Among the ITB integrin genes examined, the ITB4 integrin subunit gene related most closely with the C. elegans (nematode) PAT3 sequence indicating that it may represent the primordial vertebrate beta integrin gene and the first to appear in the vertebrate ancestor. The ITB4 differs from other ITB subunits. It is unusually longer (1778 residues) compared with other integrin β subunits and contains a long amino-terminal (683 aa) and cytosolic (1072 aa) domains [33]. The extracellular domains of β4 subunit showed low identity (∼35%) with other β integrin subunits. Moreover, the transmembrane domain of the ITB4 subunit is poorly conserved and is exceptionally long [92,97,98].
2.7. Vertebrate ITB Integrins: Functional and Comparative Aspects
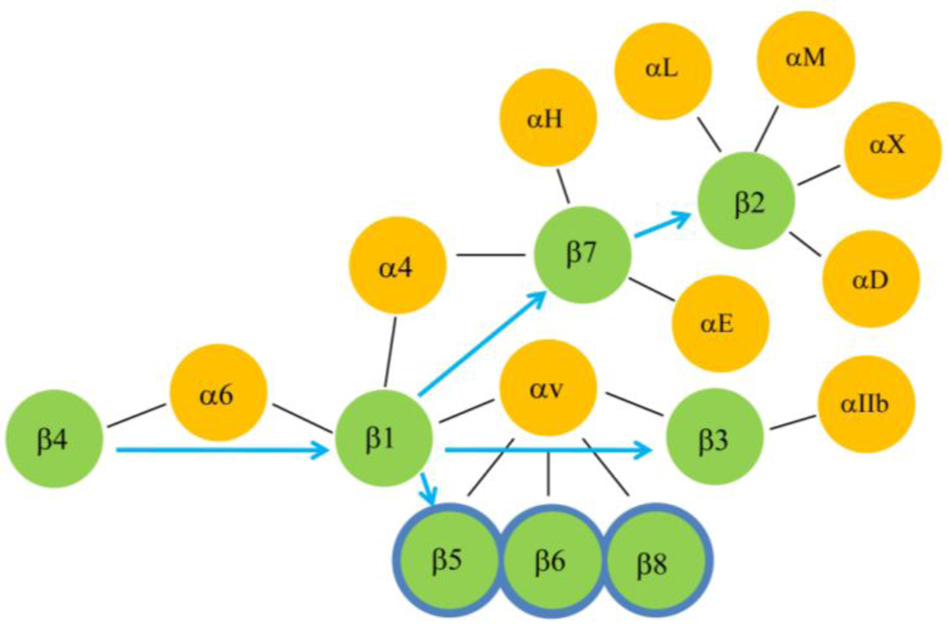
Different integrin beta receptor proteins are known to interact with at least 22 different ligands and matrix proteins [14,92, 99,100,101,102] that are summarized in Table 3. Of these, ITB1 pairs with the largest number of ligands (12 ligands) followed by ITB2 and ITB3 (7 ligands each), ITB5, ITB6 and ITB7 (3 ligands each), ITB8 (2 ligands) and ITB4 (1 ligand). Moreover, ITB1 pairs with the largest number of α subunits (fourteen) followed by ITB2 (four), ITB3 and ITB7 (two), and ITB4, ITB5, ITB6 and ITB8 (single α subunit). The ITB4 subunit pairs only with the ITA6 subunit forming α6β4 as the sole integrin receptor of the hemidesmosomes, a structural component, that is required for the attachment of cells with the basal lamina [103,104,105]. The genes and proteins of hemidesmosomes [107] date back to metazoans/holozoans, suggesting that the attachment of unicellular life forms on the basal lamina via the hemidesmosomes possibly initiated the formation of multicellular organisms with the evolution of other cell-cell junction components (tight, adherent, desmosmal and gap junctions). The tissue specific expression of integrin ITB subunits (Figure 6) showed that mammalian Type I hemidesmosomes are found in the epithelial cells of skin, mouth and esophagus whereas Type II hemidesmosomes are found in the intestinal epithelial cells [93]. This is consistent with the high expression of ITB4 in epithelial cells. While the ITB4 subunit in the α6β4 integrin receptor primarily plays a role in the formation of stable adhesions of epithelial cells with laminin-332, recent studies have suggested an additional role in the migration of keratinocytes and cancer cells [106,108]. Prior to migration, keratinocytes lose their stable adhesion mediated by hemidesmosomes and migrate over collagen and then secrete a provisional matrix of laminin-332 for its motility [109]. The cancer cells also require laminin-332 to migrate [110]. It is now known that the proteolytic cleavage of laminin-332 triggers cell motility of cells via the α6β4 receptor [111]. Other evidence suggests that the migration on laminin-332 is indeed mediated by the α3β1 integrin rather than the α6β4 integrin which actually has transdominating inhibiting effects on migration mediated by the α3β1 integrin [112]. Overall these reports indicate that the ancestral role of integrin in forming stable adhesions of epithelial cells via hemidesmosome might have evolved to support migratory roles of cells by the introduction of additional integrin receptors to perform specialized functions. In this regard, the evolution of the ITB1 subunit from the primordial ITB4 may have played a significant role in influencing cell migration. The transmigration of blood cells across the endothelial layers, a highly specialized function mediated by the integrins, may be associated with the evolution of receptors αvβ3 and those formed by the association of the ITB2 subunit with αL, αM, αX or αD subunits [113,114,115,116,117,118,119].
The extracellular domains of both α and β subunits of a receptor interact with wide spectrum of ECM molecules (Table 3) to perform various cellular functions. This suggests that these receptors may have evolved along with the evolution of ECM molecules for performing diverse functions in the context of presence or absence of specific ligands. Consequently, the ITB1 subunit may be the most promiscuous of all of the vertebrate β subunits as it pairs with the largest number of α subunits, and these alpha/beta1 heterodimers also interact with a large number of ligands. This is consistent with the observation that ITB1 like subunits had already diverged in the earlier stages of metazoans (corals and sponges) [120]. Therefore, the clues to the evolution of different vertebrate integrin receptors may lie in their evolution to interact with different ECM molecules. However, in the absence of comprehensive information on the different domains/motifs of the ECM molecules that interact with the specific domains of different integrin receptor, further conclusions may not be derived. Nevertheless, the clues to the evolutionary proximity amongst different β subunits might be found in their ability to pair with common α subunit/s, since these β subunits are likely to preserve domain/s that determine their ability to associate with similar α subunit/s or vice versa [121]. With this notion and based on the overlapping subunit compositions of functional integrin receptors (Figure 7), it is predicted that ITB1 that shares the sole alpha subunit (α6) with ITB4, is the closest to the ancestor ITB4. The ITB1 evolved to pair with the largest number of alpha subunits (Table 3) including α4 that is shared with ITB7, and the αv subunit that is shared with ITB3, ITB5, ITB6 and ITB8. Therefore, the cluster containing ITB3, ITB5, ITB6 and ITB8, and the cluster consisting of ITB7 and ITB2 may have been derived directly from ITB1. The origin of ITB5, ITB6 and ITB8 from ITB3 (rather from the versatile ITB1) is less likely because ITB3 is the most specialized of this cluster and is expressed in both blood cells (platelets) and other cell types such as placental trophoblast and cancer cells [122,123,124]. In contrast, ITB5, ITB6 and ITB8 including ITB1 are not expressed in blood cells. The ITB2 and ITB7 subunits, that constitute solely the integrins of hematopoietic and immune system [125], and specifically ITB2 that does not share an α subunit with other ITB subunits, are likely to be the most specialized ITB subunits. The αLβ2 mediates migration of T-Cells across the endothelium (invasion or transmigration) and the α4β7expressed on memory T cells directs their trafficking to the sites of inflammation.
| ECM or Ligand | β Integrin subunit | Integrin Receptor/s |
|---|---|---|
| Collagens | β1 | α1β1, α2β1, α10β1, α11β1 |
| E-Cadherin | β1, β7 | αEβ7, α2β1 |
| Endorepellin | β1 | α2β1 |
| Endostatin | β1 | α5β1 |
| Factor X | β2 | αMβ 2 |
| Fibronectin | β1, β2, β3, β6 and β7 | α4β1, α5β1, α8β1, αvβ1, αIIbβ3, αvβ3, αvβ6, α4β7, αMβ2 |
| Fibrinogen | β2, β3 and β5 | αMβ2, αXβ2, αIIbβ3, αvβ3, αvβ5 |
| ICAM-1, -2, -3, -5 | β2 | αLβ2 |
| ICAM-3 | β2 | αDβ2 |
| iC3b | β2 | αMβ2, αXβ2 |
| Laminins | β1 and β4 | α1β1, α2β1, α3β1, α6β1, α6β4, α7β1, |
| MadCAM-1 | β7 | α4β7 |
| Nephronectin (RGD) | β1 | α8β1 |
| Osteopontin | β1, β3 and β5 | αvβ1, αvβ3, αvβ5 |
| Semaphorin 7A | β1 | α1β1 |
| Tenascin-C | β1, β3 and β6 | α1β1, α8β1, α9β1, αvβ3 and αvβ6 |
| TGF-β-LAP (RGD) | β6 and β8 | αvβ6, αvβ8 |
| Tumastatin | β3 | αvβ3 |
| VCAM-1 | β2 and β7 | αDβ2, α4β7, αHβ7 |
| VEGF-C, VEGF-D | β1 | α9β1 |
| Vitronectin | β1, β3, β5 and β8 | αvβ1, α8β1, αvβ3, αvβ5, αvβ8, , |
| Von Willebrandt Factor | β3 | αIIbβ3, αvβ3, |
An analysis of α subunit sharing by different ITB subunits suggests that evolution of the ITB1 subunit led to the emergence of two groups of ITB subunits, one consisting of ITB3, ITB5, ITB6 and ITB8 subunits and the other consisting of ITB7 and ITB2. This conclusion from the subunit sharing concept (Figure 7) is very similar to our phylogenetic analysis data that suggests that ITB1-ITB7-ITB2 belong to one cluster and the ITB3-ITB5-ITB6 as another cluster. A previous phylogenetic study on ITBs [16] supported ITB1-ITB7-ITB2 as one cluster and the ITB3- ITB5-ITB8 as another cluster. Therefore, two phylogenetic analyses differed by one subunit (ITB6/ITB8) in their second cluster but both found ITB4 either an outlier or an ancestral integrin subunit. The ITB8 is found to be a distinct member of ITBs in our study whereas in the previous study it was found to diverge from the ITB6 earlier in evolution. The subunit pairing concept (Figure 7), however, groups the ITB8 subunit belonging to cluster 2 of both studies together (ITB3-ITB5-ITB6-ITB8) which is consistent with a previous report [15].
3. Methods
3.1. Vertebrate ITB Gene and Protein Identification
BLAST (Basic Local Alignment Search Tool) studies were undertaken using web tools from the National Center for Biotechnology Information (NCBI) ( http://blast.ncbi.nlm.nih.gov/Blast.cgi) [127]. Protein BLAST analyses used human and mouse ITB amino acid sequences previously described (Table 1). Non-redundant protein sequence databases for several vertebrate genomes were examined using the blastp algorithm, including human (Homo sapiens) [128]; horse (Equus caballus) [129]; mouse (Mus musculus) [130]; opossum (Monodelphis domestica) [131]; chicken (Gallus gallus) [132]; frog (Xenopus tropicalis) ( http://genome.jgi-psf.org/Xentr3/Xentr3.home.html); zebrafish (Danio rerio) ( http://www.sanger.ac.uk/Projects/D_rerio/); and nematode (Caenorhabditis elegans) ( http://genome.ucsc.edu/). This procedure produced multiple BLAST ‘hits’ for each of the protein databases which were individually examined and retained in FASTA format, and a record kept of the sequences for predicted mRNAs and encoded ITB-like proteins. These records were derived from annotated genomic sequences using the gene prediction method: GNOMON and predicted sequences with high similarity scores for human ITB. Predicted ITB-like protein sequences were obtained in each case and subjected to analyses of predicted protein and gene structures.
BLAT analyses were subsequently undertaken for each of the predicted ITB amino acid sequences using the UCSC Genome Browser ( http://genome.ucsc.edu/cgi-bin/hgBlat) [45] with the default settings to obtain the predicted locations for each of the mammalian ITB genes, including predicted exon boundary locations and gene sizes. Structures for human and mouse isoforms (splicing variants) were obtained using the AceView website to examine predicted gene and protein structures ( http://www.ncbi.nlm.nih.gov/IEB/Research/Acembly/index.html?human) [57].
3.2. Prediction of Signal Peptide Sequence and the Secondary Structure of Human Vertebrate ITB Proteins
FASTA sequence of different human β integrin amino acid sequences were subjected to SignalP 3.0 Server ( http://www.cbs.dtu.dk/services/SignalP) [133] to determine the number of amino-acids and the predicted secondary structures in the N-terminal end of the ITGB isoform involved in the formation of the signal peptide. The secondary structures of each signal peptide were determined using a SWISS-MODEL workspace ( http://swissmodel.expasy.org) [134].
3.3. Predicted Structures and Properties of the Cytoplasmic Domains of Vertebrate Beta Integrins
Predicted secondary and tertiary structures for the predicted cytoplasmic domains of vertebrate ITB-like proteins were obtained using the SWISS MODEL web tools [134]. The tertiary structures of the cytoplasmic tails for human ITB1 [residues 1–36], ITB2 [residues 1–47] and ITB7 [residues 1–38] were predicted using a model (PDB: 3g9wC) for human ITB1 [135]; while the reported structure for human ITB3 [136] (PDB:1m8oB) served as the reference for human ITB3 (residues 1–47), ITB5 (residues 1–40) and ITB6 (residues 1–45) tertiary structures, and the human ITB4 structure (PDB: 2yrzA) [137] for human ITB4 (residues 906–1007). Theoretical isoelectric points and molecular weights for vertebrate ITB-like proteins were obtained using Expasy web tools ( http://au.expasy.org/tools/pi_tool.html).
3.4. Comparative Human Beta Integrin (ITB) Expression
The UCSC Genome Browser ( http://genome.ucsc.edu) [45] was used to examine GNF Expression Atlas 2 data using various expression chips for human ITB genes ( http://biogps.gnf.org) [91]. Gene array expression ‘heat maps’ were examined for comparative gene expression levels among human and mouse tissues showing high (red); intermediate (black); and low (green) expression levels.
3.5. Comparative CpG Islands, Transcription Factor Binding Sites (TFBS) and microRNA Sequences of Human Beta Integrin Genes (ITB)
The UCSC Human Genome Browser ( http://genome.ucsc.edu) [45] was used to examine the comparative location, number and sequences for human CpG islands, transcription factor binding sites (TFBS) and microRNA sites located in the 3′-untranslated region (UTR) of human ITB genes in association with the TargetScan website ( http://www.targetscan.org).
3.6. Phylogeny Studies and Sequence Divergence
Alignments of vertebrate ITB-like and nematode (Caenorhabditis elegans) PAT3 protein sequences were assembled using BioEdit v.5.0.1 and the default settings [137]. Alignment ambiguous regions were excluded prior to phylogenetic analysis yielding alignments of 370 residues for comparisons of vertebrate ITB sequences with the nematode PAT3 (beta-integrin homolog) sequence (Table 1). Evolutionary distances were calculated using the Kimura option [138] in TREECON [139]. Phylogenetic trees were constructed from evolutionary distances using the neighbor-joining method [140] and rooted with the nematode PAT3 sequence. Tree topology was reexamined by the boot-strap method (100 bootstraps were applied) of resampling and only values that were highly significant (≥90) are shown [141].
4. Conclusions
Bioinformatic analyses of the integrin genes and proteins in vertebrates revealed a high degree of diversity in terms of their chromosome locations, alternate splicing, transcriptional and post-transcriptional regulations, and tissue specific expressions. Results suggested that the evolution of integrins within vertebrates followed a divergent path for these genes and protein structures but with common functions specializing towards adhesion, migration and transmigration of cells in succession. Our phylogenetic analysis revealed for the first time that ITB4 (encoding the β4 integrin) is the most likely ancestral form of integrin β-like genes. This subunit has inherited the ancestral role for β-integrins in forming simple adhesions (hemidesmosomes) in vertebrate cells similar to unicellular organism and is also involved in the migration of transformed (cancer) cells [7]. The subunit sharing analysis of ITB subunits reveals that β2 and β7 subunits that are expressed only in the cells of hematopoietic and immune system are possibly the most specialized forms of integrins.
Acknowledgments
This project was supported by a research grant (RR017701) from the Center for Psychiatric Neuroscience, UMMC to UKR. We also acknowledge the expert assistance of Bharet Patel of Griffith University with the phylogeny studies.
References
- Schmid, R.S.; Anton, E.S. Role of integrins in the development of the cerebral cortex. Cereb. Cortex 2003, 13, 219–224. [Google Scholar]
- Linask, K.K.; Manisastry, S.; Han, M. Cross talk between cell-cell and cell-matrix adhesion signalling pathways during heart organogenesis: Implications for cardiac birth defects. Microsc. Microanal. 2005, 11, 200–208. [Google Scholar]
- Denda, S.; Reinhardt, L.F. Studies on integrins in the nervous system. Meth. Enzymol. 2007, 426, 203–221. [Google Scholar]
- Manso, A.M.; Kang, S.M.; Ross, R.S. Integrins, focal adhesions and cardiac fibroblasts. J. Investig. Med. 2009, 57, 856–860. [Google Scholar]
- Kim, C.; Ye, F.; Ginsberg, M.H. Regulation of Integrin Activation. Annu. Rev. Cell Dev. Biol. 2011, 27, 1–7. [Google Scholar]
- Pulina, M.V.; Hou, S.Y.; Mittal, A.; Julich, D.; Whittaker, C.A.; Holley, S.A.; Hynes, R.O.; Astrof, S. Essential roles of fibronectin in the development of the left-right embryonic body plan. Dev. Biol. 2011, 354, 208–220. [Google Scholar]
- Wickstrom, S.A.; Radovanac, K.; Fassler, R. Genetic analyses of integrin signaling. Cold Spring Harbor Persp. Biol. 2011. [Google Scholar] [CrossRef]
- Chen, C.; Sheppard, D. Identification and molecular characterization of multiple phenotypes in integrin knockout mice. Meth. Enzymol. 2007, 426, 291–305. [Google Scholar]
- Weiss, L.A.; Kosova, G.; Delahunty, R.J.; Jiang, L.; Cook, E.H.; Ober, C.; Sutcliffe, J.S. Variation in ITGB3 is associated with whole-blood serotonin level and autism susceptibility. Eur. J. Hum. Genet. 2006, 14, 923–931. [Google Scholar]
- Pillitteri, D.; Pilgrimm, A.K.; Kirchmaier, C.M. Novel mutations in the GPIIb and GPIIa genes in Glanzmann Thrombobastenia. Transfusion Med. Hemotherapeutics 2010, 37, 268–277. [Google Scholar]
- Wang, W.; Luo, B.H. Structural basis of integrin transmembrane activation. J. Cell Biochem. 2010, 109, 447–452. [Google Scholar]
- Anthis, N.J.; Campbell, I.D. The tail of integrin activation. Trends Biochem. Sci. 2011, 36, 191–198. [Google Scholar]
- Qin, J.; Vinogradova, O.; Plow, E.F. Integrin bidirectional signaling: a molecular view. PLoS Biol. 2004, 2, e169. [Google Scholar]
- Hynes, R.O. Integrins: Bidirectional, allosteric signaling machines. Cell 2002, 110, 673–687. [Google Scholar]
- Burke, R.D. Invertebrate integrins: Structure, function, and evolution. Int. Rev. Cytol. 1999, 191, 257–284. [Google Scholar]
- Hughes, A.L. Evolution of the integrin alpha and beta protein families. J. Mol. Evol. 2001, 52, 63–72. [Google Scholar]
- Ewan, R.; Huxley-Jones, J.; Mould, A.P.; Humphries, M.J.; Robertson, D.L.; Boot-Handford, R.P. The integrins of the urochordate Ciona intestinalis provide novel insights into the molecular evolution of the vertebrate integrin family. BMC Evol. Biol. 2005, 5, 31. [Google Scholar]
- Sebe-Pedros, A.; Roger, A.J.; Lang, F.B.; King, N.; Ruiz-Trillo, I. Ancient origin of the integrin-mediated adhesion and signaling machinery. Proc.Natl. Acad. Sci. USA 2010, 107, 10142–10147. [Google Scholar]
- Sebe-Pedros, A.; Ruiz-Trillo, I. Integrin-mediated adhesion complex: Cooption of signaling systems at the dawn of Metazoa. Commun. Integrin Biol. 2010, 3, 475–477. [Google Scholar]
- Hedges, S.B. The origin and evolution of model organisms. Nature 2002, 3, 838–849. [Google Scholar]
- Argraves, W.S.; Suzuki, S.; Arai, H.; Thompson, K.; Pierschbacher, M.D.; Ruoslahti, E. Amino acid sequence of the human fibronectin receptor. J. Cell Biol. 1987, 105, 1183–1190. [Google Scholar]
- Balzac, F.; Belkin, A.M.; Koteliansky, V.E.; Balabanov, Y.V.; Altruda, F.; Silengo, L.; Tarone, G. Expression and functional analysis of a cytoplasmic domain variant of the beta 1 integrin subunit. J. Cell Biol. 1993, 121, 171–178. [Google Scholar]
- Altruda, F.; Cervella, P.; Tarone, G.; Botta, C.; Balzac, F.; Stefanuto, G.; Silengo, L. A human integrin beta 1 subunit with a unique cytoplasmic domain generated by alternative mRNA processing. Gene 1990, 95, 261–266. [Google Scholar]
- Zhidkova, N.I.; Belkin, A.M.; Mayne, R. Novel isoform of beta 1 integrin expressed in skeletal and cardiac muscle. Biochem. Biophys. Res. Comm. 1995, 214, 279–285. [Google Scholar]
- Kishimoto, T.K.; O'Connor, K.; Lee, A.; Roberts, T.M.; Springer, T.A. Cloning of the beta subunit of the leukocyte adhesion proteins: homology to an extracellular matrix receptor defines a novel supergene family. Cell 1987, 48, 681–690. [Google Scholar]
- Weitzman, J.B.; Wells, C.E.; Wright, A.H.; Clark, P.A.; Law, S.K.A. The gene organisation of the human beta 2 integrin subunit (CD18). FEBS Lett. 1991, 294, 97–103. [Google Scholar]
- Konstandin, M.H.; Aksoy, H.; Wabnitz, G.H.; Volz, C.; Erbel, C.; Kirchgessner, H.; Giannitsis, E.; Katus, H.A.; Samstag, Y.; Dengler, T.J. Beta2-integrin activation on T cell subsets is an independent prognostic factor in unstable angina pectoris. Basic. Res. Cardiol. 2009, 104, 341–351. [Google Scholar]
- Fitzgerald, L.A.; Steiner, B.; Rall, S.C., Jr.; Lo, S.; Phillips, D.R. Protein sequence of endothelial glycoprotein IIIa derived from a cDNA clone. Identity with platelet glycoprotein IIIa and similarity to ‘integrin’. J. Biol. Chem. 1987, 262, 3936–3939. [Google Scholar]
- Zimrin, A.B.; Eisman, R.; Vilaire, G.; Schwartz, E.; Bennett, J.S.; Poncz, M. Structure of platelet glycoprotein IIIa. A common subunit for two different membrane receptors. J. Clin. Investig. 1988, 81, 1470–1475. [Google Scholar]
- Rosa, J.P.; Bray, P.F.; Gayet, O.; Johnston, G.I.; Jackson, K.W.; Shuman, M.A.; McEver, R.P. Cloning of glycoprotein IIIa cDNA from human erythroleukemia cells and localization of the gene to chromosome 17. Blood 1988, 72, 593–600. [Google Scholar]
- Kumar, C.S.; James, I.E.; Wong, A.; Mwangi, V.; Field, J.A.; Nuthulaganti, P.; Connor, J.R.; Eichman, C.; Ali, F.; Hwang, S.M.; Rieman, D.J.; Drake, F.H.; Gowen, M. Cloning and characterization of a novel integrin beta3 subunit. J. Biol. Chem. 1997, 272, 16390–16397. [Google Scholar]
- Suzuki, S.; Naitoh, Y. Amino acid sequence of a novel integrin beta 4 subunit and primary expression of the mRNA in epithelial cells. EMBO J. 1990, 9, 757–763. [Google Scholar]
- Hogervorst, F.; Kuikman, I.; von Dem Borne, A.E.G.K.; Sonnenberg, A. Cloning and sequence analysis of beta-4 cDNA: An integrin subunit that contains a unique 118 kd cytoplasmic domain. EMBO J. 1990, 9, 765–770. [Google Scholar]
- Iacovacci, S.; Gagnoux-Palacios, L.; Zambruno, G.; Meneguzzi, G.; D'Alessio, M. Genomic organization of the human integrin beta 4 gene. Mamm. Genome 1997, 8, 448–450. [Google Scholar]
- Ramaswamy, H.; Hemler, M.E. Cloning, primary structure and properties of a novel human integrin beta subunit. EMBO J. 1990, 9, 1561–1568. [Google Scholar]
- Suzuki, S.; Huang, Z.S.; Tanihara, H. Cloning of an integrin beta subunit exhibiting high homology with integrin beta 3 subunit. Proc. Natl. Acad. Sci. USA 1990, 87, 5354–5358. [Google Scholar]
- McLean, J.W.; Vestal, D.J.; Cheresh, D.A.; Bodary, S.C. cDNA sequence of the human integrin beta 5 subunit. J. Biol. Chem. 1990, 265, 17126–17131. [Google Scholar]
- Sheppard, D.; Rozzo, C.; Starr, L.; Quaranta, V.; Erle, D.J.; Pytela, R. Complete amino acid sequence of a novel integrin beta subunit (beta 6) identified in epithelial cells using the polymerase chain reaction. J. Biol. Chem. 1990, 265, 11502–11507. [Google Scholar]
- The gene organization of the human beta 7 subunit, the common beta subunit of the leukocyte integrins HML-1 and LPAM-1. Int. Immunol. 1992, 4, 1031–1040.
- Fontana, L.; Chen, Y.; Prijatelj, P.; Sakai, T.; Fassler, R.; Sakai, L.Y.; Rifkin, D.B. Fibronectin is required for integrin alphavbeta6-mediated activation of latent TGF-beta complexes containing LTBP-1. FASEB J. 1990, 19, 1798–1808. [Google Scholar]
- Yuan, Q.; Jiang, W-M.; Krissansen, G.W.; Watson, J.D. Cloning and sequence analysis of a novel beta 2-related integrin transcript from T lymphocytes: homology of integrin cysteine-rich repeats to domain III of laminin B chains. Int. Immunol. 1990, 2, 1097–1108. [Google Scholar]
- Erle, D.J.; Rueegg, C.; Sheppard, D.; Pytela, R. Complete amino acid sequence of an integrin beta subunit (beta 7) identified in leukocytes. J. Biol. Chem. 1991, 266, 11009–11016. [Google Scholar]
- Moyle, M.; Napier, M.A.; McLean, J.W. Cloning and expression of a divergent integrin subunit beta 8. J. Biol. Chem. 1991, 266, 19650–19658. [Google Scholar]
- Hillier, L.W.; Fulton, R.S.; Fulton, L.A.; Graves, T.A.; Pepin, K.H.; Wagner-McPherson, C.; Layman, D.; Maas, J.; Jaeger, S.; Walker, R.; et al. The DNA sequence of human chromosome 7. Nature 2003, 424, 157–164. [Google Scholar]
- Kent, W.J.; Sugnet, C.W.; Furey, T.S. The human genome browser at UCSC. Genome Res. 2003, 12, 994–1006. [Google Scholar]
- Jornvall, H.; H(ő)(ő)g, J.-O.; Persson, B.; Parés, X. Pharmacogenetics of the alcohol dehydrogenase system. Pharmacology 2000, 61, 184–191. [Google Scholar]
- Holmes, R.S.; Goldberg, E. Computational analyses of mammalian lactate dehydrogenases: human, mouse, opossum and platypus LDHs. Comput. Biol. Chem. 2009, 33, 379–385. [Google Scholar]
- Shanthalingam, S.; Srikumaran, S. Intact signal peptide of CD18, the β-subunit of β2-integrins, renders ruminants susceptible to Mannheimia haemolytica leukotoxin. Proc. Natl. Acad. Sci. USA 2009, 106, 15448–15453. [Google Scholar]
- Williams, E.J.; Pal, C.; Hurst, L.D. The molecular evolution of signal peptides. Gene 2000, 253, 313–322. [Google Scholar]
- Goldstein, J.; Lehnhardt, S.; Inouye, M. Enhancement of protein translocation across the membrane by specific mutations in the hydrophobic region of the signal peptide. J. Bacteriol. 1990, 172, 1225–1231. [Google Scholar]
- Hatsuzawa, K.; Tagaya, M.; Mizushima, S. The hydrophobic region of signal peptides is a determinant for SRP recognition and protein translocation across the ER membrane. J. Biochem. 1997, 121, 270–277. [Google Scholar]
- Marchler-Bauer, A.; Lu, S.; Anderson, J.B.; Chitsaz, F.; Derbyshire, M.K.; DeWeese-Scott, C.; Fong, J.H.; Geer, L.Y.; Geer, R.C.; Gonzales, N.R.; et al. CDD: A Conserved Domain Database for the functional annotation of proteins. Nucleic Acids Res. 2011, 39(D), 225–229. [Google Scholar]
- Alonso-García, N.; Inglés-Prieto, A.; Sonnenberg, A.; de Pereda, J.M. (2009) Structure of the Calx-beta domain of the integrin beta4 subunit: Insights into function and cation-independent stability. Acta Crystallogr. D Biol. Cryst. 2009, 65, 858–871. [Google Scholar]
- Ali, O.; Guillou, H.; Destaing, O.; Albiges-Rizo, C.; Block, M.R.; Fourcade, B. Cooperativity between integrin activation and mechanical stress leads to integrin clustering. Biophys. J. 2011, 100, 2595–2604. [Google Scholar]
- Su, L.; Xin, L.; Miao, J.Y. Integrin β4 in neural cells. Neuromol. Med. 2008, 10, 316–321. [Google Scholar]
- Ali, O.; Guillou, H.; Destaing, O.; Albiges-Rizo, C.; Block, M.R.; Fourcade, B. Cooperativity between integrin activation and mechanical stress leads to integrin clustering. Biophys. J. 2011, 100, 2595–2604. [Google Scholar]
- Thierry-Mieg, D.; Thierry-Mieg, J. AceView: A comprehensive cDNA-supported gene and transcripts annotation. Genome Biol. 2006, 7, S12. [Google Scholar]
- Tarone, G.; Hirsch, E.; Brancaccio, M.; De Acetis, M.; Barberis, L.; Balzac, F.; Retta, S.F.; Botta, C.; Altruda, F.; Silengo, L. integrin function and regulation during development. Int. J. Dev. Biol. 2000, 44, 725–731. [Google Scholar]
- Marcantonio, E.E.; Guan, J.L.; Trevithick, J.E.; Hynes, R.O. Mapping of the functional determinants of the integrin beta 1 cytoplasmic domain by site-directed mutagenesis. Cell Regul. 1990, 1, 597–604. [Google Scholar]
- Chang, D.D.; Wong, C.; Smith, H.; Liu, J. ICAP-1, a novel beta1 integrin cytoplasmic domain-associated protein, binds to a conserved and functionally important NPXY sequence motif of beta1 integrin. J. Cell Biol. 1997, 138, 1149–1157. [Google Scholar]
- Tadokoro, S.; Shattil, S.J.; Eto, K.; Tai, V.; Liddington, R.C.; de Pereda, J.M.; Ginsberg, M.H.; Calderwood, D.A. Talin binding to integrin beta tails: a final common step in integrin activation. Science 2003, 302, 103–106. [Google Scholar]
- Vignoud, L.; Albiges-Rizo, C.; Frachet, P.; Block, M.R. NPXY motifs control the recruitment of the alpha5beta1 integrin in focal adhesions independently of the association of talin with the beta1 chain. J. Cell Sci. 1997, 110, 1421–1430. [Google Scholar]
- Reszka, A.A.; Hayashi, Y.; Horwitz, A.F. Identification of amino acid sequences in the integrin β1 cytoplasmic domain implicated in cytoskeletal association. J. Cell Biol. 1992, 117, 1132–1130. [Google Scholar]
- O'Toole, T.E.; Mandelman, D.; Forsyth, J.; Shattil, S.J.; Plow, E.F.; Ginsberg, M.H. Modulation of the affinity of integrin alpha IIb beta 3 (GPIIb-IIIa) by the cytoplasmic domain of alpha IIb. Science 1991, 254, 845–847. [Google Scholar]
- Regulation of integrin alphaIIbbeta3 activation by distinct regions of its cytoplasmic tails. Biochemistry 2006, 45, 6656–6662.
- Chang, D.D.; Hoang, B.Q.; Liu, J.; Springer, T.A. Molecular basis for interaction between Icap1 alpha PTB domain and beta 1 integrin. J. Biol. Chem. 2002, 277, 8140–8147. [Google Scholar]
- Calderwood, D.W.; Fujioka, Y.; de Pereda, J.M.; Garci-Alvarez, B.; Nakamoto, T.; Margolis, B.; McGlade, C.J.; Liddington, R.C.; Ginsberg, M.H. Integrin-cytoplasmic domain interactions with phosphotyrosine-binding domains: A structural prototype for diversity in integrin signaling. Proc. Natl. Acad. Sci. USA 2003, 100, 2272–2276. [Google Scholar]
- Meves, A.; Stremmel, C.; Gottschalk, K.; Fassler, R. The Kindlin protein family: new members to the club of focal adhesion proteins. Trends Cell Biol. 2009, 19, 504–513. [Google Scholar]
- Karakose, E.; Schiller, H.B.; Fassler, R. The kindlins at a glance. J. Cell Sci. 2010, 123, 2353–2356. [Google Scholar]
- Harburger, D.S.; Calderwood, D.A. Integrin signalling at a glance. J. Cell Sci. 2009, 122, 159–63. [Google Scholar]
- Bledzka, K.; Bialkowska, K.; Nie, H.; Qin, J.; Byzova, T.; Wu, C.; Plow, E.F.; Ma, Y.Q. Tyrosine phosphorylation of integrin beta3 regulates kindlin-2 binding and integrin activation. J. Biol. Chem. 2010, 285, 30370–30374. [Google Scholar]
- Ma, Y.Q.; Qin, J.; Wu, C.; Plow, E.F. Kindlin-2 (Mig-2): a co-activator of beta3 integrins. J. Cell Biol. 2008, 181, 439–46. [Google Scholar]
- Oxley, C.L.; Anthis, N.J.; Lowe, E.D.; Vakonakis, I.; Campbell, ID.; Wegener, K.L. An integrin phosphorylation switch: The effect of beta3 integrin tail phosphorylation on Dok1 and talin binding. J. Biol. Chem. 2008, 283, 5420–5426. [Google Scholar]
- Saxonov, S.; Berg, P.; Brutlag, D.L. A genome-wide analysis of CpG dinucleotides in the human genome distinguishes two distinct classes of promoters. Proc. Natl. Acad. Sci. USA 2006, 103, 1412–1417. [Google Scholar]
- Boudreau, N.J.; Varner, J.A. The homeobox transcription factor Hox D3 promotes integrin alpha5beta1 expression and function during angiogenesis. J. Biol. Chem. 2004, 279, 4862–4868. [Google Scholar]
- Kintscher, U.; Lyon, C.; Wakino, S.; Bruemmer, D.; Feng, X.; Goetze, S.; Graf, K.; Moustakas, A.; Staels, B.; Fleck, E.; Hsueh, W.A.; Law, R.E. PPARα inhibits TGF-β-induced β5 integrin transcription in vascular smooth muscle cells by interacting with Smad4. Circ. Res. 2002, 91, e35–e44. [Google Scholar]
- Bei, L.; Lu, Y.; Bellis, S.L.; Zhou, W.; Horvath, E.; Eklund, E.A. Identification of a HoxA10 activation domain necessary for transcription of the gene encoding beta3 integrin during myeloid differentiation. J. Biol. Chem. 2007, 282, 16846–16859. [Google Scholar]
- Daftary, G.S.; Troy, P.J.; Bagot, C.J.; Young, S.L.; Taylor, H.S. Direct Regulation of ß3-Integrin Subunit Gene Expression by HOXA10 in Endometrial Cells. Mol. Endocrinol. 2002, 16, 571–579. [Google Scholar]
- Wang, W.; Wu, W.; Desai, T.; Ward, D.C.; Kaufman, S.J. Localization of the alpha 7 integrin gene (ITGA7) on human chromosome 12q13: Clustering of integrin and Hox genes implies parallel evolution of these gene families. Genomics 1995, 26, 568–570. [Google Scholar]
- Cao, X.; Pfaff, S.L.; Gage, F.H. A functional study of miR-124 in the developing neural tube. Gene Dev. 2007, 21, 531–536. [Google Scholar]
- Small non-coding RNAs in animal development. Nat. Rev. Mol. Cell Biol. 2008, 9, 219–230.
- Targeting of integrin beta1 and kinesin 2alpha by microRNA 183. J. Biol. Chem. 2010, 285, 5461–5471.
- Mǔller, D.W.; Bosserhoff, A.K. Integrin beta 3 expression is regulated by let-7a miRNA in malignant melanoma. Oncogene 2008, 27, 6698–6706. [Google Scholar]
- Hunt, S.; Jones, A.V.; Hinsley, E.E.; Whawell, S.A.; Lambert, D.W. MicroRNA-124 suppresses oral squamous cell carcinoma motility by targeting ITGB1. FEBS Lett. 2011, 585, 187–192. [Google Scholar]
- Fang, L.; Deng, Z.; Shatseva, T.; Yang, J.; Peng, C.; Du, W.W.; Yee, A.J.; Ang, L.C.; He, C.; Shan, S.W.; Yang, B.B. MicroRNA miR-93 promotes tumor growth and angiogenesis by targeting integrin-beta8. Oncogene 2011, 30, 806–821. [Google Scholar]
- Brendle, A.; Lei, H.; Brandt, A.; Johansson, R.; Enquist, K.; Henriksson, R.; Hemmink, K.; Lenner, P.; Főrstl, A. Polymorphisms in predicted microRNA-binding sites in integin genes and breast cancer: ITGB4 as prognostic marker. Carcinogenesis 2008, 29, 1394–1399. [Google Scholar]
- Lewis, B.P.; Burge, C.B.; Bartel, D.P. Conserved seed pairing, often flanked by adenosines, indicates that thousands of human genes are microRNA targets. Cell 2005, 120, 15–20. [Google Scholar]
- Shalgi, R.; Lieber, D.; Oren, M.; Pilpel, Y. Global and local architecture of the mammalian microRNA-transcription factor regulatory network. PLoS Comput. Biol. 2007, 3, e131. [Google Scholar]
- Baek, D.; Villen, J.; Shin, C.; Camargo, F.D.; Gygi, S.P. The impact of microRNAs on protein output. Nature 2008, 455, 64–71. [Google Scholar]
- Selbach, M.; Schwanhausser, B.; Thierfelder, N.; Fang, Z.; Khanin, R. Widespread changes in protein synthesis induced by microRNAs. Nature 2008, 455, 58–63. [Google Scholar]
- Su, A.I.; Wiltshire, T.; Batalov, S.; Lapp, H.; Ching, K.R.; Block, D.; Zhang, J.; Soden, R.; Hayakawa, M.; Kreiman, G.; Cooke, M.P.; Walker, J.R.; Hogenesch, J.B. A gene atlas of the human and mouse protein encoding transcriptomes. Proc. Natl. Acad. Sci. USA 2004, 101, 6062–6067. [Google Scholar]
- Barczyk, M.; Carracedo, S.; Gullberg, D. Integrins. Cell Tissue Res. 2010, 339, 269–280. [Google Scholar]
- Zhang, H.; Labouesse, M. The making of hemidesmosome structures in vivo. Dev. Dynam. 2010, 239, 1465–1476. [Google Scholar]
- Quaranta, V. Epithelial integrins. Cell Differ. Dev. 1990, 32, 361–365. [Google Scholar]
- Tamura, R.N.; Rozzo, C.; Starr, L.; Chambers, J.; Reichardt, L.F.; Cooper, H.M.; Quaranta, V. Epithelial integrin alpha 6 beta 4: complete primary structure of alpha 6 and variant forms of beta 4. J. Cell Biol. 1990, 111, 1593–1604. [Google Scholar]
- Donoghue, P.C.J.; Benton, M.J. Rocks and clocks: calibrating the tree of life using fossils and molecules. Trends Genet. 2007, 22, 424–431. [Google Scholar]
- Strunck, E.; Vollmer, G. Variants of integrin beta 4 subunit in human endometrial adenocarcinoma cells: mediators of ECM-induced differentiation? Biochem. Cell Biol. 1996, 74, 867–873. [Google Scholar]
- Abe, M.; Sawamura, D.; Goto, M.; Nakamura, H.; Nagasaki, A.; Nomura, Y.; Kawasaki, H.; Isogai, R.; Shimizu, H. ITGB4 missense mutation in a transmembrane domain causes non-lethal variant of junctional epidermolysis bullosa with pyloric atresia. J. Dermatol. Sci. 2007, 47, 165–167. [Google Scholar]
- Hynes, R.O. Integrins: Versatility, modulation, and signaling in cell adhesion. Cell 1992, 69, 11–25. [Google Scholar]
- Johnson, M.S.; Lu, N.; Denessiouk, K.; Heino, J.; Gullberg, D. Integrins during evolution: evolutionary trees and model organisms. Biochim. Biophys. Acta 2009, 1788, 779–789. [Google Scholar]
- Reddy, K.V.; Mangale, S.S. Integrin receptors: the dynamic modulators of endometrial function. Tissue Cell 2003, 35, 260–273. [Google Scholar]
- Shapiro, L.; Love, J.; Colman, D.R. Adhesion molecules in the nervous system: structural insights into function and diversity. Annu. Rev. Neurosci. 2007, 30, 451–474. [Google Scholar]
- Sonnenberg, A.; Calafat, J.; Janssen, H.; Daams, H.; van der Raaij-Helmer, L.M.; Falcioni, R.; Kennel, S.J.; Aplin, J.D.; Baker, J.; Loizidou, M. Integrin alpha 6/beta 4 complex is located in hemidesmosomes, suggesting a major role in epidermal cell-basement membrane adhesion. J. Cell Biol. 1991, 113, 907–917. [Google Scholar]
- Spinardi, L.; Ren, Y.L.; Sanders, R.; Giancotti, F.G. The beta 4 subunit cytoplasmic domain mediates the interaction of alpha 6 beta 4 integrin with the cytoskeleton of hemidesmosomes. Mol. Biol. Cell 1993, 4, 871–884. [Google Scholar]
- Dowling, J.; Yu, Q.C.; Fuchs, E. Beta4 integrin is required for hemidesmosome formation, cell adhesion and cell survival. J. Cell Biol. 1996, 134, 559–572. [Google Scholar]
- Sehgal, B.U.; DeBiase, P.J.; Matzno, S.; Chew, T.L.; Claiborne, J.N.; Hopkinson, S.B.; Russell, A.; Marinkovich, M.P.; Jones, J.C. Integrin beta4 regulates migratory behavior of keratinocytes by determining laminin-332 organization. J. Biol. Chem. 2006, 281, 35487–35498. [Google Scholar]
- Abedin, M.; King, N. Diverse evolutionary paths to cell adhesion. Trends Cell Biol. 2010, 20, 734–742. [Google Scholar]
- Kim, T.H.; Kim, H.I.; Soung, Y.H.; Shaw, L.A.; Chung, J. Integrin (alpha6beta4) signals through Src to increase expression of S100A4, a metastasis-promoting factor: implications for cancer cell invasion. Mol. Canc. Res. 2009, 7, 1605–1612. [Google Scholar]
- Nguyen, B.P.; Gil, S.G.; Carter, W.G. Deposition of laminin 5 by keratinocytes regulates integrin adhesion and signaling. J. Biol. Chem. 2000, 275, 31896–31907. [Google Scholar]
- Miyazaki, K. Laminin-5 (laminin-332): Unique biological activity and role in tumor growth and invasion. Cancer Sci. 2006, 97, 91–98. [Google Scholar]
- Giannelli, G.; Falk-Marzillier, J.; Schiraldi, O.; Stetler-Stevenson, W.G.; Quaranta, V. Induction of cell migration by matrix metalloprotease-2 cleavage of laminin-5. Science 1997, 277, 225–228. [Google Scholar]
- Goldfinger, L.E.; Hopkinson, S.B.; deHart, G.W.; Collawn, S.; Couchman, J.R.; Jones, J.C. The alpha3 laminin subunit, alpha6beta4 and alpha3beta1 integrin coordinately regulate wound healing in cultured epithelial cells and in the skin. J. Cell Sci. 1999, 112, 2615–2629. [Google Scholar]
- Jorgensen, C.; Couret, I.; Hellier, I.; Bologna, C.; Canovas, F.; Brochier, J.; Reme, T.; Sany, J. In vivo migration of radiolabelled lymphocytes in rheumatoid synovial tissue engrafted in SCID mice: implication of beta 2 and beta 7-integrin. J. Rheumatol. 1996, 23, 32–35. [Google Scholar]
- Viney, J.L.; Fong, S. Beta 7 integrins and their ligands in lymphocyte migration to the gut. Chem. Immunol. 1998, 71, 64–76. [Google Scholar]
- Lefrancois, L.; Parker, C.M.; Olson, S.; Muller, W.; Wagner, N.; Schon, M.P.; Puddington, L. The role of beta7 integrins in CD8 T cell trafficking during an antiviral immune response. J. Exp. Med. 1999, 189, 1631–1638. [Google Scholar]
- Park, E.J.; Mora, J.R.; Carman, C.V.; Chen, J.; Sasaki, Y.; Cheng, G.; von Andrian, U.H.; Shimaoka, M. Aberrant activation of integrin alpha4beta7 suppresses lymphocyte migration to the gut. J. Clin. Investig. 2007, 117, 2526–2538. [Google Scholar]
- Yakubenko, V.P.; Belevych, N.; Mishchuk, D.; Schurin, A.; Lam, S.C.; Ugarova, T.P. The role of integrin alpha D beta2 (CD11d/CD18) in monocyte/macrophage migration. Exp. Cell Res. 2008, 314, 2569–2578. [Google Scholar]
- Zhu, X.; Boetticher, E.; Wang, L.; Duan, Y.; Learoyd, J.; Leff, A.R. Proline-rich tyrosine kinase 2 regulates spreading and migration of eosinophils after beta2-integrin adhesion. Am. J. Respir. Cell Mol. Biol. 2008, 39, 263–269. [Google Scholar]
- Kelly, K.A.; Wiley, D.; Wiesmeier, E.; Briskin, M.; Butch, A.; Darville, T. The combination of the gastrointestinal integrin (alpha4beta7) and selectin ligand enhances T-Cell migration to the reproductive tract during infection with Chlamydia trachomatis. Am. J. Reprod. Immunol. Microbiol. 2009, 61, 446–452. [Google Scholar]
- Brower, D.L.; Brower, S.M.; Hayward, D.C.; Ball, E.E. Molecular evolution of integrins: genes encoding integrin beta subunits from a coral and a sponge. Proc. Natl. Acad. Sci. USA 1997, 94, 9182–9187. [Google Scholar]
- Humphries, M.J. Integrin activation: The link between ligand binding and signal transduction. Curr. Opin. Cell Biol. 1996, 8, 632–640. [Google Scholar]
- Chen, Y.Q.; Trikha, M.; Gao, X.; Bazaz, R.; Porter, A.T.; Timar, J.; Honn, K.V. Ectopic expression of platelet integrin alphaIIb beta3 in tumor cells from various species and histological origin. Int. J. Cancer Res. 1997, 72, 642–648. [Google Scholar]
- Moroi, M.; Jung, S.M. Integrin-mediated platelet adhesion. Front. Biosci. 1998, 3, d719–728. [Google Scholar]
- Rout, U.K. Valproate, thalidomide and ethyl alcohol alter the migration of HTR-8/SVneo cells. Reprod. Biol. Endocrinol. 2006, 4, 44. [Google Scholar]
- Cambi, A.; van Helden, S.F.G.; Figdor, C.G. Roles for Integrins and Associated Proteins in the Haematopoietic System. In Integrins and Development; Cambi, A., Suzanne, F.G., van Helden, C.G., Eds.; Landes Bioscience: Austin, TX, USA, 2006. [Google Scholar]
- Burke, R.D. Invertebrate integrins: Structure, function, and evolution. Int. Rev. Cytol. 1999, 191, 257–284. [Google Scholar]
- Altschul, F.; Vyas, V.; Cornfield, A.; Goodin, S.; Ravikumar, T.S.; Rubin, E.H.; Gupta, E. Basic local alignment search tool. J. Mol. Biol. 1997, 215, 403–410. [Google Scholar]
- International Human Genome Sequencing Consortium. Initial sequencing and analysis of the human genome. Nature 2001, 409, 860–921.
- Horse Genome Project. Available online: http://www.uky.edu/Ag/Horsemap/ (accessed on 21 August 2011).
- Mouse Genome Sequencing Consortium. Initial sequencing and comparative analysis of the mouse genome. Nature 2002, 420, 520–562.
- Mikkelsen, T.S.; Wakefield, M.J.; Aken, B.; Amemiya, C.T.; Chang, J.L.; Duke, S.; Garber, M.; Gentles, A.J.; Goodstadt, L.; Heger, A.; et al. Genome of the marsupial Monodelphis domestica reveals innovation in noncoding sequences. Nature 2007, 447, 167–175. [Google Scholar]
- International Chicken Genome Consortium. Sequence and comparative analysis of the chicken genome provide unique perspectives on vertebrate evolution. Nature 2004, 432, 695–716.
- Emanuelsson, O.; Brunak, S.; von Heijne, G.; Nielsen, H. Locating proteins in the cell using TargetP, SignalP, and related tools. Nat. Protocol. 2007, 2, 953–971. [Google Scholar]
- Arnold, K.; Bordoli, L.; Kopp, J.; Schwede, T. The SWISS-MODEL Workspace: A web-based environment for protein structure homology modelling. Bioinformatics 2006, 22, 195–201. [Google Scholar]
- Vinogradova, O.; Velyvis, A.; Velyviene, A.; Hu, B.; Haas, T.; Plow, E.; Qin, J. A structural mechanism of integrin alpha(IIb)beta(3) “inside-out” activation as regulated by its cytoplasmic face. Cell 2002, 110, 587–597. [Google Scholar]
- Abe, H.; Sasagawa, A.; Tochio, N.; Koshiba, S.; Inoue, M.; Kigawa, T.; Yokoyama, S. Solution structure of the fibronectin type III domain of human Integrin beta-4. Protein Data Bank 2011. [Google Scholar] [CrossRef]
- Hall, T.A. BioEdit: A user-friendly biological sequence alignment editor and analysis program for Windows 95/98/NT. Nucleic Acids Symp. 1999, 41, 95–99. [Google Scholar]
- Kimura, M. The Neutral Theory of Molecular Evolution; Cambridge University Press: Cambridge, UK; p. 1983.
- Van De Peer, Y.; de Wachter, R. TreeCon for Windows: a software package for the construction and drawing of evolutionary trees for the Microsoft Windows environment. Comput. App. Sci. 1994, 10, 569–575. [Google Scholar]
- Saitou, N.; Nei, M. The neighbour-joining method: A new method for reconstructing phylogenetic trees. Mol. Biol. Evol. 1987, 4, 406–411. [Google Scholar]
- Felsenstein, J. Confidence limits on phylogenies: an approach using the bootstrap. Evolution 1985, 39, 783–789. [Google Scholar]
© 2011 by the authors; licensee MDPI, Basel, Switzerland. This article is an open access article distributed under the terms and conditions of the Creative Commons Attribution license (http://creativecommons.org/licenses/by/3.0/).
Share and Cite
Holmes, R.S.; Rout, U.K. Comparative Studies of Vertebrate Beta Integrin Genes and Proteins: Ancient Genes in Vertebrate Evolution. Biomolecules 2011, 1, 3-31. https://doi.org/10.3390/biom1010003
Holmes RS, Rout UK. Comparative Studies of Vertebrate Beta Integrin Genes and Proteins: Ancient Genes in Vertebrate Evolution. Biomolecules. 2011; 1(1):3-31. https://doi.org/10.3390/biom1010003
Chicago/Turabian StyleHolmes, Roger S., and Ujjwal K. Rout. 2011. "Comparative Studies of Vertebrate Beta Integrin Genes and Proteins: Ancient Genes in Vertebrate Evolution" Biomolecules 1, no. 1: 3-31. https://doi.org/10.3390/biom1010003