Article

Moderate (2%, v/v) Ethanol Feeding Alters Hepatic Wound Healing after Acute Carbon Tetrachloride Exposure in Mice

1
Department of Pharmacology, Toxicology and Therapeutics, University of Kansas Medical Center, 3901 Rainbow Blvd, Kansas City, KS 66160, USA
2
Department of Pathology, University of Kansas Medical Center, 3901 Rainbow Blvd, Kansas City, KS 66160, USA
3
Department of Gastroenterology and Hepatology, Case Western Reserve University, 10900 Euclid Ave., Cleveland, OH 44106, USA
*
Author to whom correspondence should be addressed.
Biomolecules 2016, 6(1), 5; https://doi.org/10.3390/biom6010005
Submission received: 4 September 2015 / Revised: 26 November 2015 / Accepted: 9 December 2015 / Published: 6 January 2016
(This article belongs to the Special Issue Multi-Organ Alcohol-Related Damage: Mechanisms and Treatment)

Abstract

:
Wound healing consists of three overlapping phases: inflammation, proliferation, and matrix synthesis and remodeling. Prolonged alcohol abuse can cause liver fibrosis due to deregulated matrix remodeling. Previous studies demonstrated that moderate ethanol feeding enhances liver fibrogenic markers and frank fibrosis independent of differences in CCl4-induced liver injury. Our objective was to determine whether or not other phases of the hepatic wound healing response were affected by moderate ethanol after CCl4 exposure. Mice were fed moderate ethanol (2% v/v) for two days and then were exposed to CCl4 and euthanized 24–96 h later. Liver injury was not different between pair- and ethanol-fed mice; however, removal of necrotic tissue was delayed after CCl4-induced liver injury in ethanol-fed mice. Inflammation, measured by TNFα mRNA and protein and hepatic Ly6c transcript accumulation, was reduced and associated with enhanced hepatocyte apoptosis after ethanol feeding. Hepatocytes entered the cell cycle equivalently in pair- and ethanol-fed mice after CCl4 exposure, but hepatocyte proliferation was prolonged in livers from ethanol-fed mice. CCl4-induced hepatic stellate cell activation was increased and matrix remodeling was prolonged in ethanol-fed mice compared to controls. Taken together, moderate ethanol affected each phase of the wound healing response to CCl4. These data highlight previously unknown effects of moderate ethanol exposure on hepatic wound healing after acute hepatotoxicant exposure.

1. Introduction

Ethanol consumption contributes to liver injury and subsequent alterations in hepatic structure and function. If prolonged, ethanol exposure can precipitate the progression of liver disease from simple steatosis to more severe liver disease states. Indeed, in a certain percentage of chronic alcohol abusers, an unrelenting liver wound healing response promotes the development of fibrosis, cirrhosis and even hepatocellular carcinoma [1,2,3]. While our understanding of how derangements in hepatic wound healing contribute to fibrosis have grown considerably over the past decades, these discoveries have not lead to improved therapies. Indeed, liver transplant remains the only way to cure advanced liver disease. Due to increasing demand for transplantable livers and a dwindling supply of suitable organs, additional studies are required to improve therapeutic options for advanced liver disease patients. Certainly, a more complete understanding of the specific contributions ethanol makes to liver injury and subsequent hepatic wound healing would be beneficial.
A cascade of sequential and overlapping steps are involved in wound healing whose outcome is to reinstate tissue integrity and function [4]. These steps are often categorized into three phases: the inflammatory, proliferative and remodeling phases. The inflammatory phase includes hemostasis, as well as activation of various humoral and cellular innate immune system components. Inflammation is responsible for debriding the wound of pathogens and cell debris, and for providing some of the signals required to induce the proliferative phase. The proliferative phase includes production of new epithelial and endothelial cells and tissue-resident fibroblasts. Activated fibroblasts contribute to the synthesis of a provisional ECM over which new epithelial and endothelial cells migrate to areas in need of repair. ECM remodeling is the last phase of wound healing. Early in this phase, additional ECM is synthesized in which type I collagen is a predominant component, while later in the process, ECM degradation occurs during which the once injured tissue is reorganized closely approximating its original structural and functional properties. Perturbations in this process result in wound healing abnormalities. For example, wounds in diabetic patients do not heal due to, in part, persistent inflammation leading to ulcers [5]. Likewise, overly robust wound healing can precipitate development of scars or solid organ fibrosis [4]. While best described for skin wounds, this sequence of steps occurs in other organs, including the liver, but the precise mechanisms responsible for solid organ wound repair are incompletely understood.
Several animal models are employed to mimic different drinking patterns, and resultant liver injury, in alcohol abusers [6]. While informative regarding ethanol’s role in development of steatosis and limited injury, inflammation, and liver regeneration, these models do not adequately represent long-term, iterative liver injury and incomplete hepatic wound healing, which drives fibrogenesis. Recently, two new animal models were developed which combine carbon tetrachloride (CCl4), a model hepatotoxicant, with ethanol exposure. In one of those models, mice are fed a high-dose ethanol-containing diet (5% v/v, 35% total caloric intake) [7] while in the other, mice are fed a moderate-dose ethanol-containing diet (2% v/v, 11% total caloric intake) [8,9]. In the former, cytochrome P450 2E1 (CYP2E1), an enzyme required for CCl4’s bioactivation and hepatotoxicity, is induced in response to chronic ethanol exposure, while in the latter, CYP2E1 is not induced. In both models, mice are exposed to CCl4, but the dose is reduced in mice fed 5% ethanol-containing diets to ensure equivalent liver injury between diet groups. After 2% ethanol feeding, liver injury is equivalent in pair- and ethanol-fed mice without a need to adjust the CCl4 dose.
Published studies utilizing these two animal models demonstrate that moderate ethanol accelerates fibrogenesis and fibrosis after acute and chronic CCl4 exposure, respectively. Natural killer cell inhibition [7], increased adenosine receptor signaling [8] and hepatocyte apoptosis [10] all contribute to enhanced hepatic stellate cell (HSC) activation and fibrosis in ethanol-fed mice. Aside from ethanol’s effects on HSC activation and fibrosis, other phases of the hepatic wound healing response which likely contribute to enhanced fibrosis after have not been explored in detail.
The objective of this study was to evaluate various aspects of the hepatic wound healing response after acute CCl4 in mice fed moderate ethanol-containing diets. Specifically, we wished to determine whether or not inflammation, proliferation and matrix remodeling were altered by moderate ethanol after CCl4 exposure. Due to the fact that inflammation contributes to hepatoprotection [11,12,13] and liver regeneration [14,15,16,17], we tested the hypothesis that moderate ethanol feeding reduced inflammation leading to increased hepatocyte apoptosis observed by others [10]. Moreover, we hypothesized that reduced inflammation would inhibit liver regeneration, further promoting the pro-fibrogenic milieu in the injured liver as shown previously [10]. When taken together, we predicted that moderate ethanol perturbed every phase of the hepatic wound healing response.

2. Results and Discussion

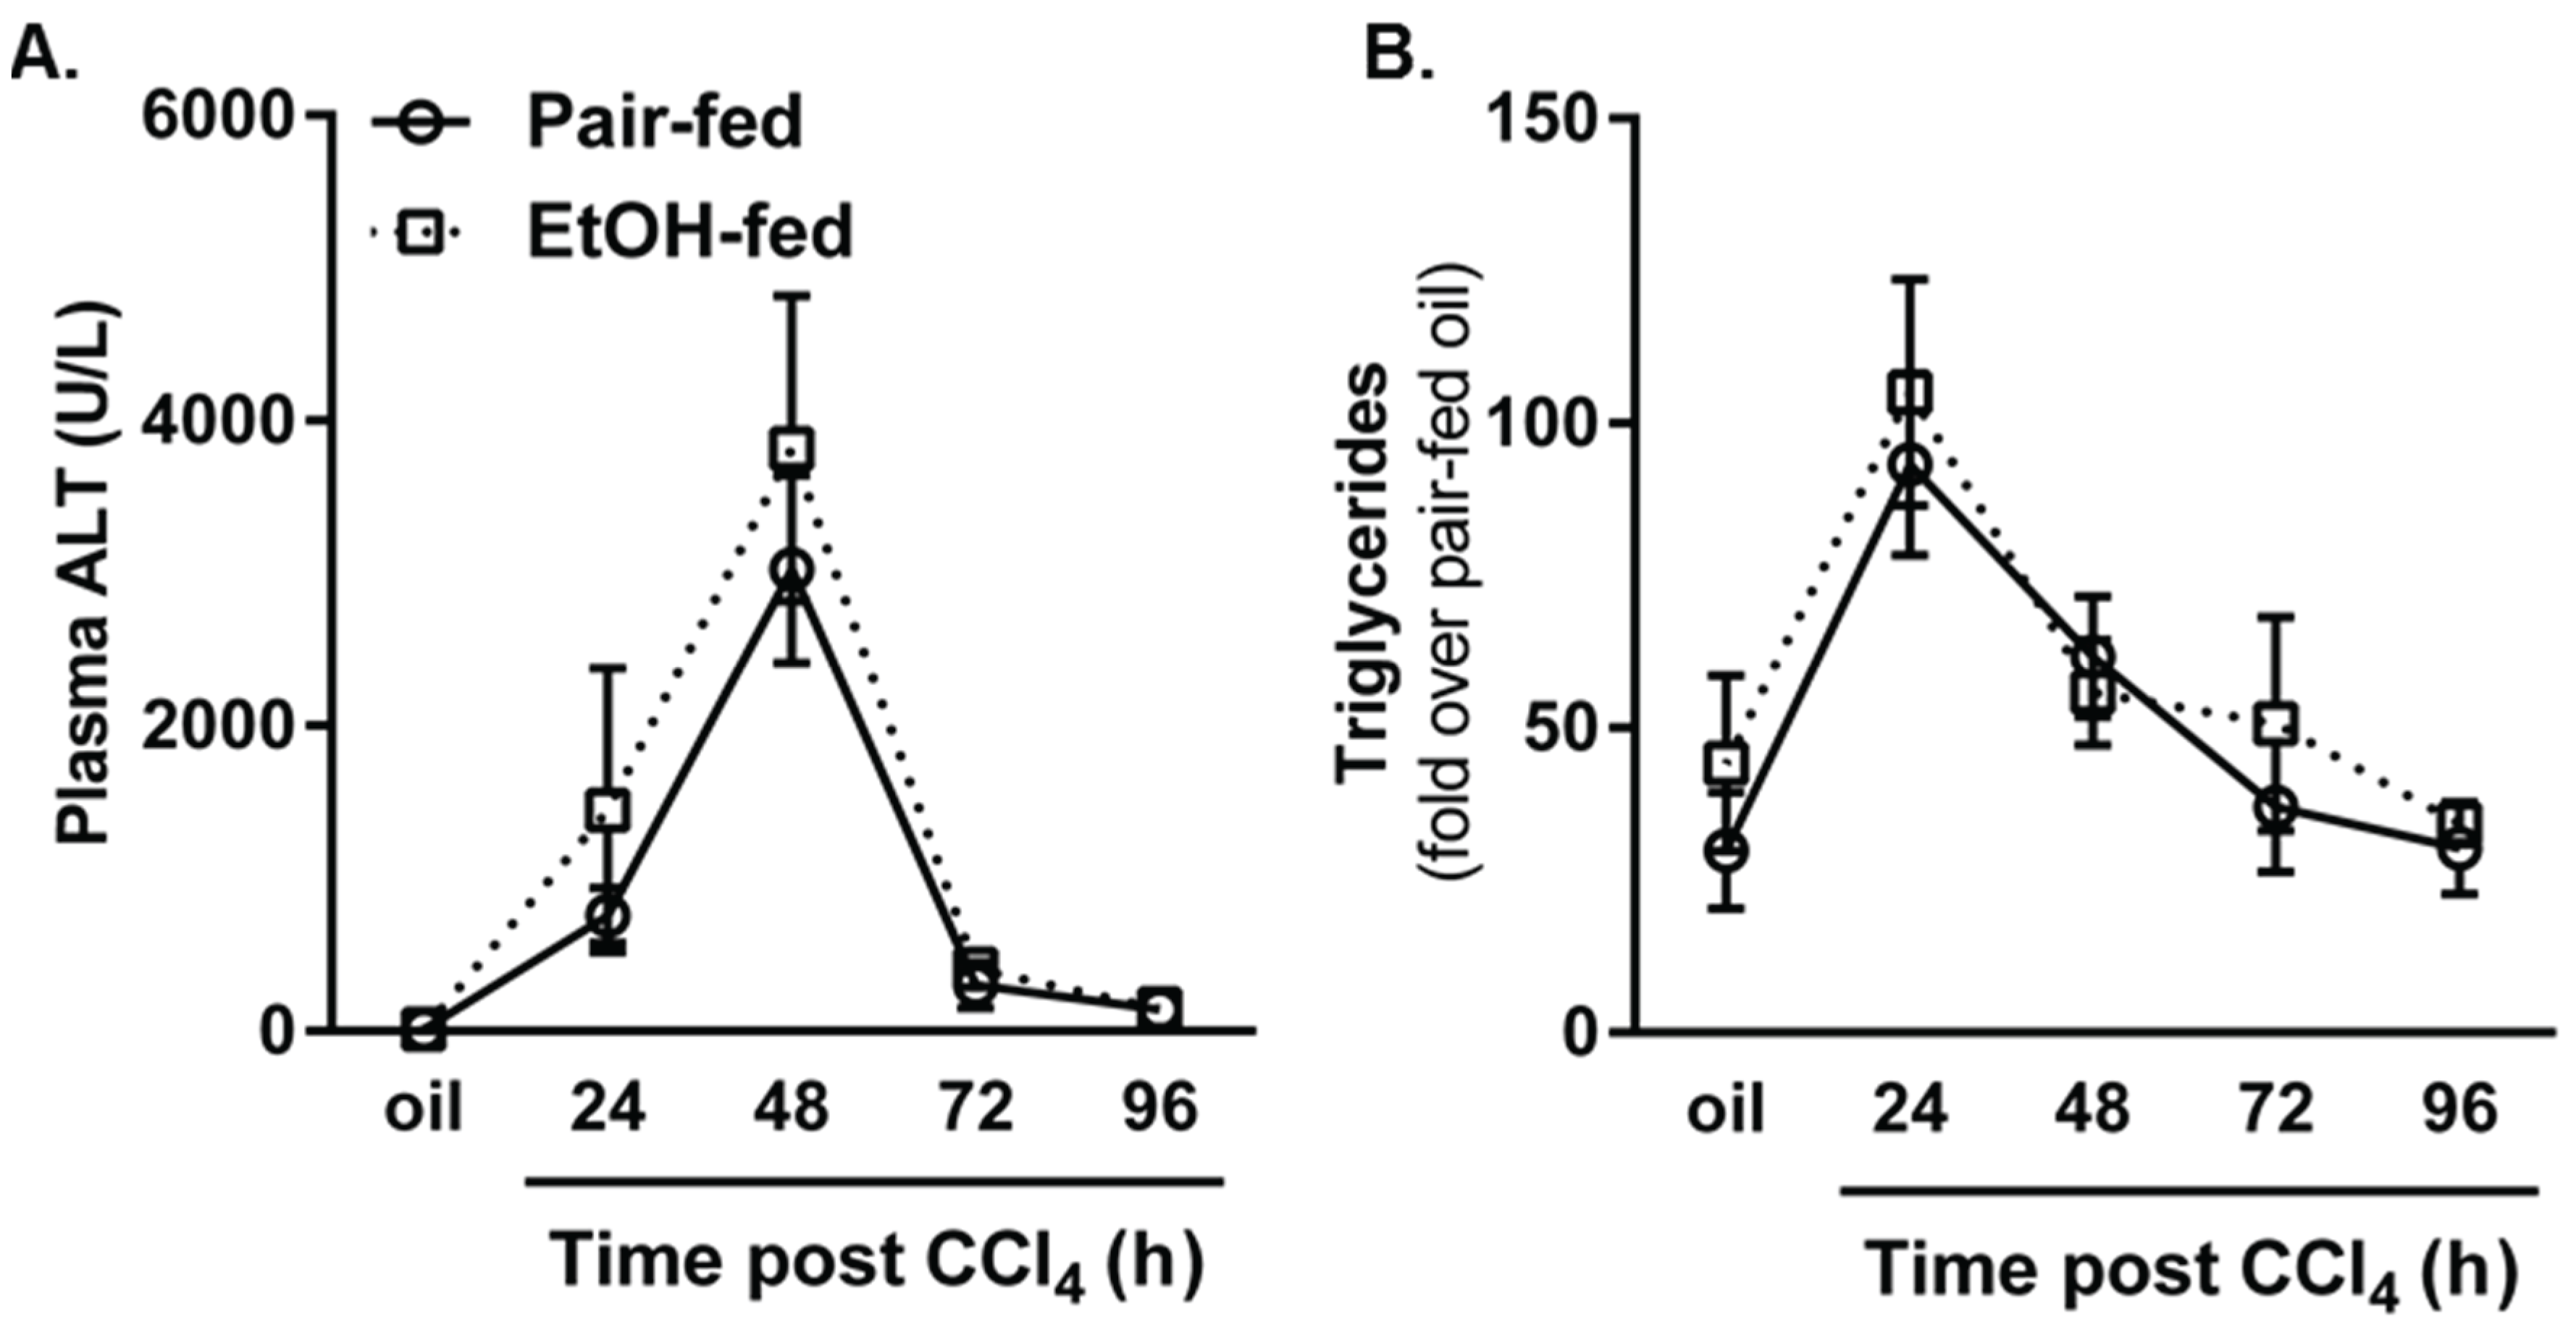
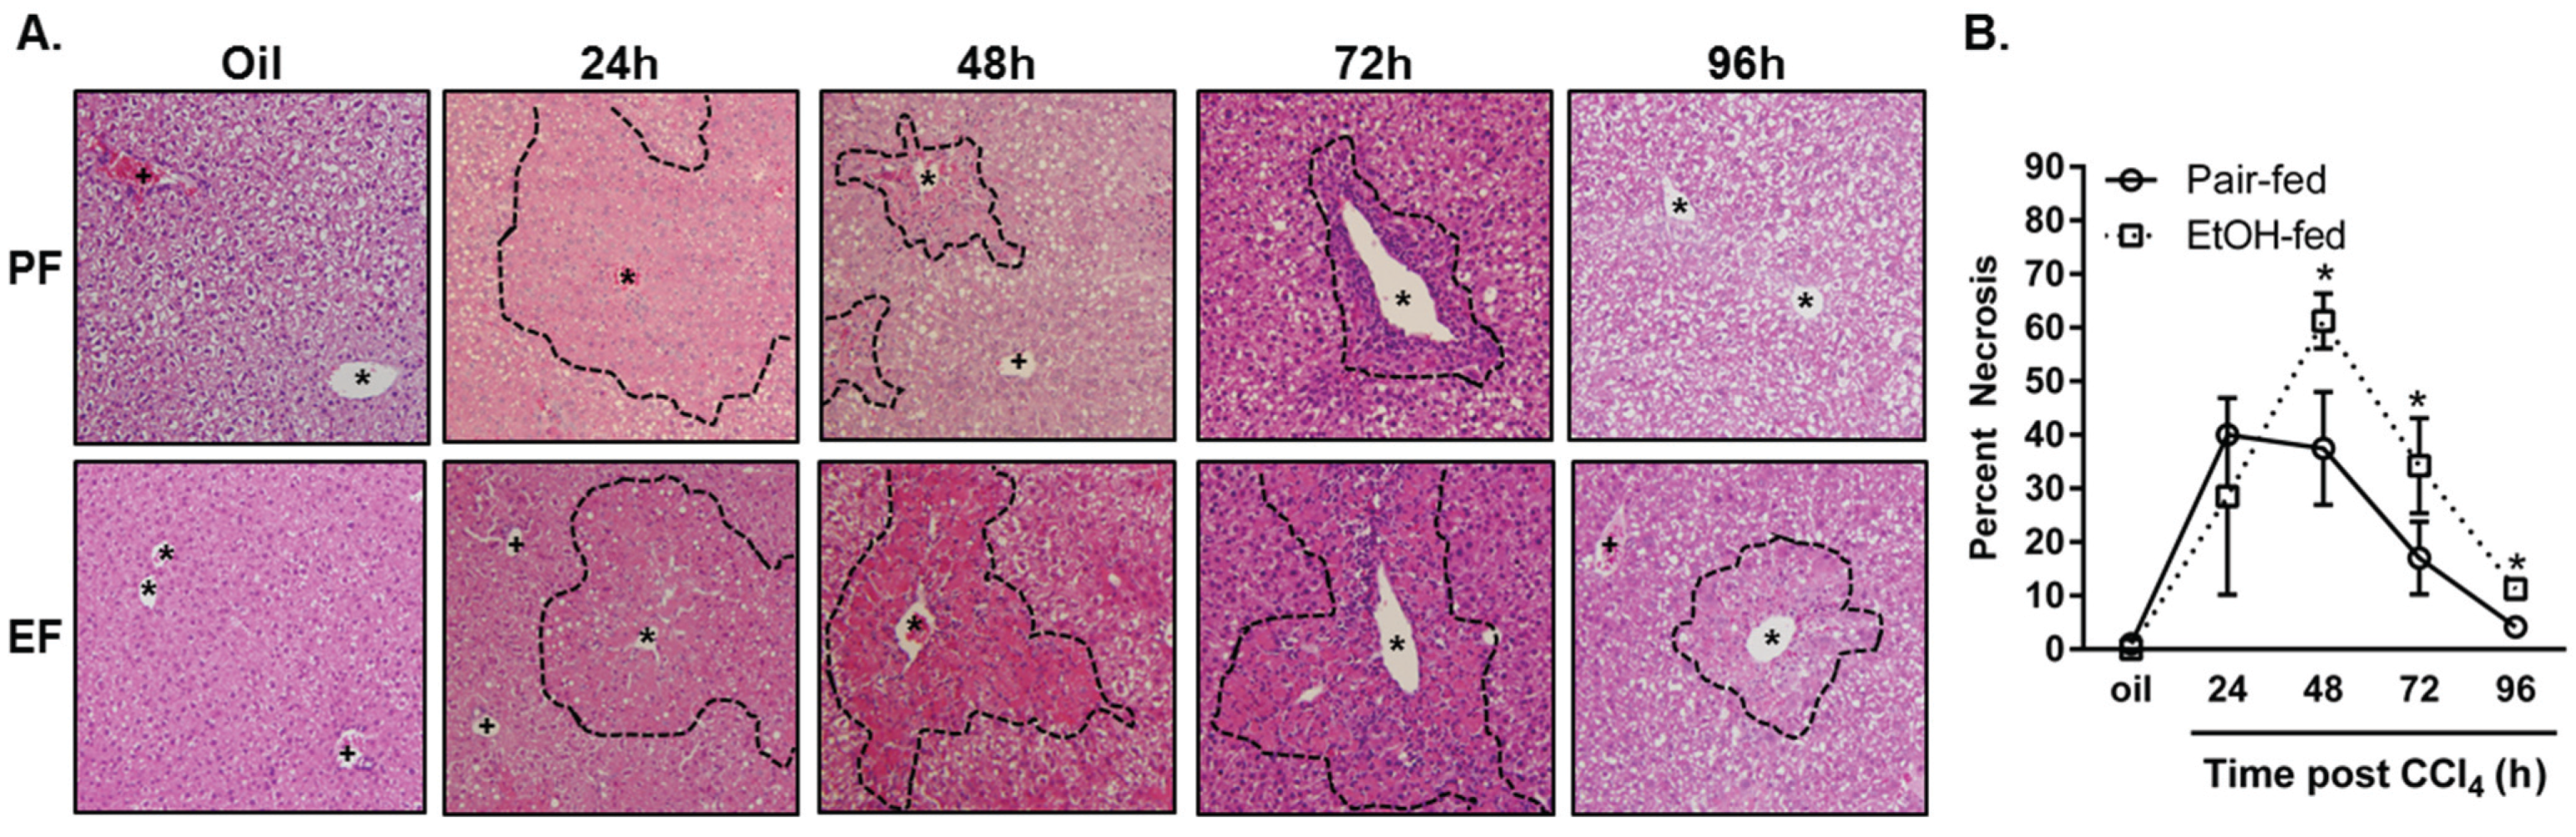
2.1. The Effects of Moderate (2% v/v) Ethanol on Hepatic Cytochrome P450 2E1 (CYP2E1), Hepatic Injury, Steatosis and Removal of Necrotic Tissue after Acute Carbon Tetrachloride (CCl4) Exposure

CCl4 is a hepatotoxicant widely used to model human acute and chronic liver injury in mice and rats. CCl4 requires metabolism (bioactivation), in vivo, by cytochrome P450 2E1 (CYP2E1) for its hepatotoxicity [18]. CYP2E1-induced bioactivation of CCl4 leads to the production of highly reactive metabolites including the trichloromethyl (CCl3*) and trichloromethylperoxy (CCl3OO*) radicals [19]. In the liver, the highest concentration of CYP2E1 is in the pericentral area (Zone 3) [20], which is where liver injury is localized after CCl4 exposure. After CYP2E1-mediated bioactivation, these reactive metabolites modify proteins, nucleic acids and lipids. In particular, hepatocyte membrane lipid peroxidation leads to necrotic cell death [19]. Liver injury can expand from the site of CCl4 bioactivation by a “bystander effect”, leading to additional necrotic and apoptotic cell death [21,22,23].
Ethanol is a known inducer of cytochrome P450 2E1 (CYP2E1) [24,25] and could increase CCl4’s hepatotoxicity in ethanol-fed mice. Therefore, we evaluated hepatic CYP2E1 content and activity. Two percent (2%, v/v) moderate ethanol exposure did not increase the hepatic content of CYP2E1 or CYP2E1 activity above that found in pair-fed mice (Figure 1).
Figure 1. Hepatic CYP2E1 content and activity did not differ between control (pair-fed) or ethanol-fed mice. Mice were allowed free-access to a 2% (v/v) ethanol-containing Lieber-DiCarli diet, or pair-fed a control diet, for 10 days. Livers were harvested, a portion of which was used for performing a CYP2E1 immunoblot (A,C) while a separate portion was used to perform a CYP2E1 activity assay (B). In (B), the positive (+ve) control was generated by using microsomes isolated from mice fed a 5% (v/v) ethanol-containing diet for four weeks. The negative (−ve) control was generated by using microsomes isolated from mice 24 h after a single CCl4 exposure (CCl4 consumptively depletes CYP2E1). N = 4–8 mice per group.
Biomolecules 06 00005 g001
CCl4 induced robust liver injury, as determined by measuring plasma alanine aminotransferase (ALT) activities, which was greatest 48 h after hepatotoxicant exposure and subsided thereafter; importantly, there was no difference in plasma ALT activities between groups (Figure 2A). These data parallel those found by others using the same ethanol-feeding paradigm [8,10]. Likewise, hepatic steatosis, as determined by a biochemical assay for triglyceride, increased 24 h after CCl4 and was reduced thereafter without a difference between pair- or ethanol-fed groups at any time point (Figure 2B). Taken together, these data suggest that moderate ethanol does not alter CCl4-induced liver injury or steatosis. Thus, this model provides a way to evaluate the impact of ethanol on hepatic wound healing independent of differences in the severity of CCl4-induced, necrotic liver injury.
ALT has a half-life of about 3 days [26]. Although ALT is an appropriate measure of hepatocyte injury and necrosis, it does not indicate whether or not differences exist in the removal of the necrotic tissue from which ALT was liberated after CCl4 exposure. To this end, histopathological analysis was employed to determine whether or not ethanol feeding affected the ability to remove necrotic tissue. This analysis revealed an increased percentage of necrotic tissue in livers from ethanol-fed mice 48, 72 and 96 h after CCl4 exposure relative to necrosis in pair-fed mice at the same time points (Figure 3). Liver to body weight ratios paralleled this increase in necrotic tissue area in ethanol-fed mice.
Figure 2. CCl4-induced liver injury and steatosis were not affected by ethanol feeding to mice. Mice were allowed free-access to a 2% (v/v) ethanol containing diet for two days and then were exposed to CCl4 and euthanized 24, 48, 72 or 96 h thereafter, while remaining on the ethanol diet. Control animals were pair-fed a diet that isocalorically substituted maltose dextrins for ethanol. (A) Plasma ALT was used to determine hepatic injury; (B) A biochemical assay was used to quantify hepatic triglyceride content. N = 4–8 mice per group.
Biomolecules 06 00005 g002
Figure 3. Moderate ethanol feeding delayed removal of nectrotic tissue after CCl4 exposure. Mice were allowed free-access to a 2% (v/v) ethanol containing diet for 2 days and then were exposed to CCl4 and euthanized 24, 48, 72 or 96 h thereafter while remaining on the ethanol diet. Control animals were pair-fed a diet that isocalorically substituted maltose dextrins for ethanol. (A) Representative micrographs taken of hematoxylin and eosin stained liver sections taken at the time points indicated. The dashed line demarks boundary of injured (24 h) or necrotic hepatocytes (48, 72, 96 h). PF = pair-fed, EF = ethanol-fed, asterisk = central vein, plus sign = portal vein; (B) Percent necrotic area graphed over time post CCl4 in pair- and ethanol-fed mice. N = 4–8 mice per group.
Biomolecules 06 00005 g003
Because liver injury was not different between diet groups, these data suggest that there is an impaired ability of the ethanol-exposed liver to remove necrotic tissue (Table 1).
Table 1. Initial and final body weights, liver weights and liver to body weight ratios.
PAIR-FEDEtOH-FED
Exp. GroupInitial BW (g)Final BW (g)Liver Weight (g)Liver to Body Weight Ratio (%)Initial BW (g)Final BW (g)Liver Weight (g)Liver to Body Weight Ratio (%)
Oil20.0 (0.9)21.2 (1.0)0.971 (0.052)4.6 (0.250)19.1 (0.4)20.9 (0.6)0.949 (0.066)4.5 (0.214)
24 h18.8 (0.5)21.1 (1.1)0.978 (0.056)4.6 (0.100)17.3 (0.7)18.9 (0.6)0.964 (0.054)5.1 (0.212) *
48 h17.7 (0.7)19.4 (0.8)0.936 (0.031)4.7 (0.048)18.8 (0.9)19.6 (1.0)0.988 (0.029)5.1 (0.175) *
72 h19.7 (0.6)20.7 (0.9)1.001 (0.068)4.8 (0.151)19.8 (0.5)20.7 (0.8)1.081 (0.028)5.3 (0.132) *
96 h21.4 (0.3)21.2 (0.7)1.295 (0.038)4.9 (0.155)21.0 (0.2)20.9 (0.2)1.115 (0.076)5.3 (0.312)
Standard error of the mean, in parentheses, is found below the mean value for each group. * p < 0.05 relative to pair-fed.

2.2. Markers of Inflammation and Hepatocyte Apoptosis after Acute CCl4 Exposure: Modulation by Moderate Ethanol

2.2.1. TNFα Production and Hepatic Macrophages

Inflammation is one of the first responses to tissue injury [27]. The innate immune system, including humoral (complement activation) and cellular (macrophages and neutrophils) components, induces a rapid inflammatory response to invading organisms and/or tissue debris. Tumor necrosis factor (TNF)α is a proinflammatory molecule predominantly produced by activated macrophages [28]. TNFα is also important for hepatoprotection [11,12,13,29] and liver regeneration [14,15,16,17]. As a surrogate marker for inflammation, we measured hepatic accumulation of TNFα mRNA as well as plasma TNFα protein levels in pair- and ethanol-fed mice. In contrast to published literature that shows TNFα is increased after exposure to 2% ethanol for two days or after chronic ethanol feeding (5% for four weeks) [30], CCl4-induced TNFα was suppressed by moderate ethanol feeding to mice, 24 h after CCl4 exposure (total of 4 d on 2% ethanol, Figure 4A,B).
Because macrophages are major producers of TNFα, we measured hepatic accumulation of Emr1 (gene encoding F4/80, a mouse macrophage marker [31]) and Ly6C, a marker associated with inflammatory/M1 macrophages recruited to the liver after injury [31,32]. While Emr1 transcripts were reduced 24 h after CCl4 exposure in both groups of mice, ethanol-feeding did not affect the level of this transcript (Figure 4C). By contrast, CCl4 increased hepatic accumulation of Ly6C transcripts in pair-fed mice, but not ethanol-fed mice, 24 h after CCl4 exposure; this approached statistical significance (Figure 4D, p = 0.07). These data suggested that moderate ethanol exposure may have shifted hepatic macrophage populations towards a wound healing/M2-like phenotype which could promote fibrogenesis [33,34]. To address this point, we measured accumulation of hepatic Il10 and Tgfβ transcripts. Moderate ethanol feeding did not alter hepatic Il10 or Tgfβ (Figure 4E,F). Future work is needed to delineate which macrophage subset is required for TNFα production in response to CCl4. Specifically, it is important to determine whether or not resident macrophages change their phenotype or if early macrophage recruitment is required for robust TNFα production after CCl4 in pair-fed mice. Analysis of other inflammatory cytokines or chemokines may provide additional insight on how moderate ethanol alters the hepatic microenvironment to shape wound healing after acute CCl4 exposure.

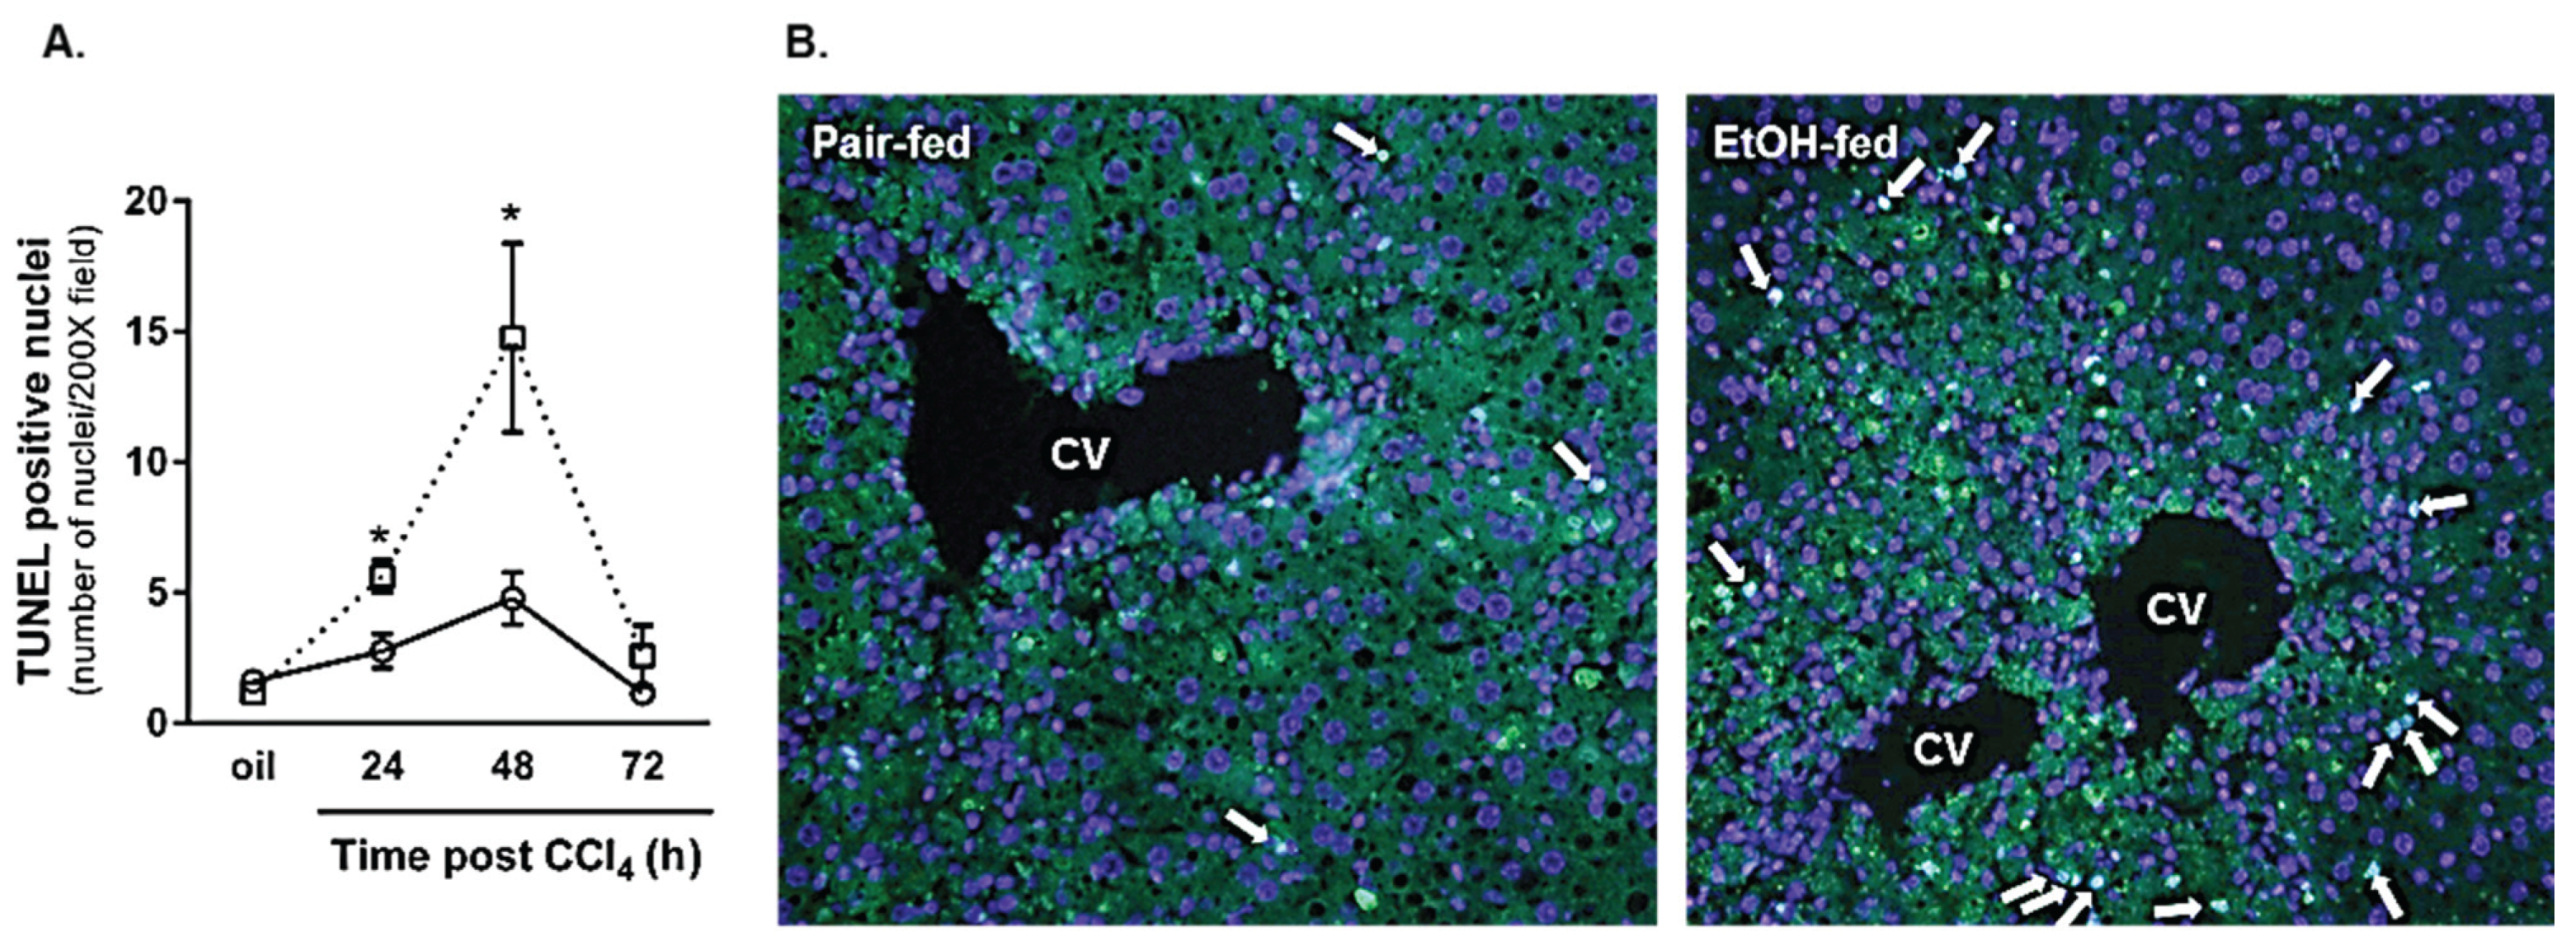
2.2.2. Hepatocyte Apoptosis

CCl4 causes predominantly necrotic liver injury [19] but hepatocyte apoptosis also occurs and contributes to hepatocyte loss [23]. Apoptosis was observed in livers from both diet groups after CCl4 exposure (Figure 5). However, consistent with impaired hepatoprotection found in livers with reduced TNFα [13], hepatocyte apoptosis was further increased in livers from ethanol-fed mice 24 and 48 h after CCl4 (Figure 5). The apoptosis occurred outside the area of hepatocyte necrosis caused by CCl4. These data are consistent with the work of others [10] and suggest that hepatocyte survival and/or sensitivity to apoptosis-inducing signals was impaired in livers from ethanol-fed mice. Taken together, moderate ethanol suppressed hepatic TNFα production, which may be related to differences in macrophage populations recruited to the liver after acute CCl4 exposure, and was associated with increased hepatocyte apoptosis.
Figure 4. Ethanol feeding suppressed hepatic inflammation early after CCl4 exposure. Real-time PCR (A) was used to determine hepatic Tnfα transcript level, while an ELISA (B) was used to determine TNFα concentration in peripheral blood from pair- and ethanol-fed mice after CCl4. Hepatic transcripts for the F4/80 gene (Emr1 (C); Ly6C (D); Il10 (E) and Tgfβ (F)) were determined using real-time PCR. For real time PCR, data are expressed as fold change over pair-fed, olive oil exposed mice after normalization to 18S. N = 4–8 mice per group. * p <0.05.
Biomolecules 06 00005 g004
Figure 5. Hepatocyte apoptosis was increased in livers from ethanol-fed mice 24 and 48 h after CCl4 exposure. The terminal deoxynucleotidyl transferase dUTP nick end labeling (TUNEL) assay was used to determine the number of apoptotic hepatocyte nuclei in livers from pair- and ethanol-fed mice 24, 48, and 72 h after CCl4 exposure. (A) Quantification of the number of TUNEL-positive hepatocyte nuclei in each 200× image (three non-overlapping images per animal); (B) Representative TUNEL staining from pair- and ethanol-fed mice 48 h (maximum hepatocyte apoptosis) after CCl4 exposure. N = 4 mice per group. * p < 0.05.
Biomolecules 06 00005 g005

2.3. Impact of Moderate Ethanol Feeding to Mice on Liver Regeneration after Acute CCl4

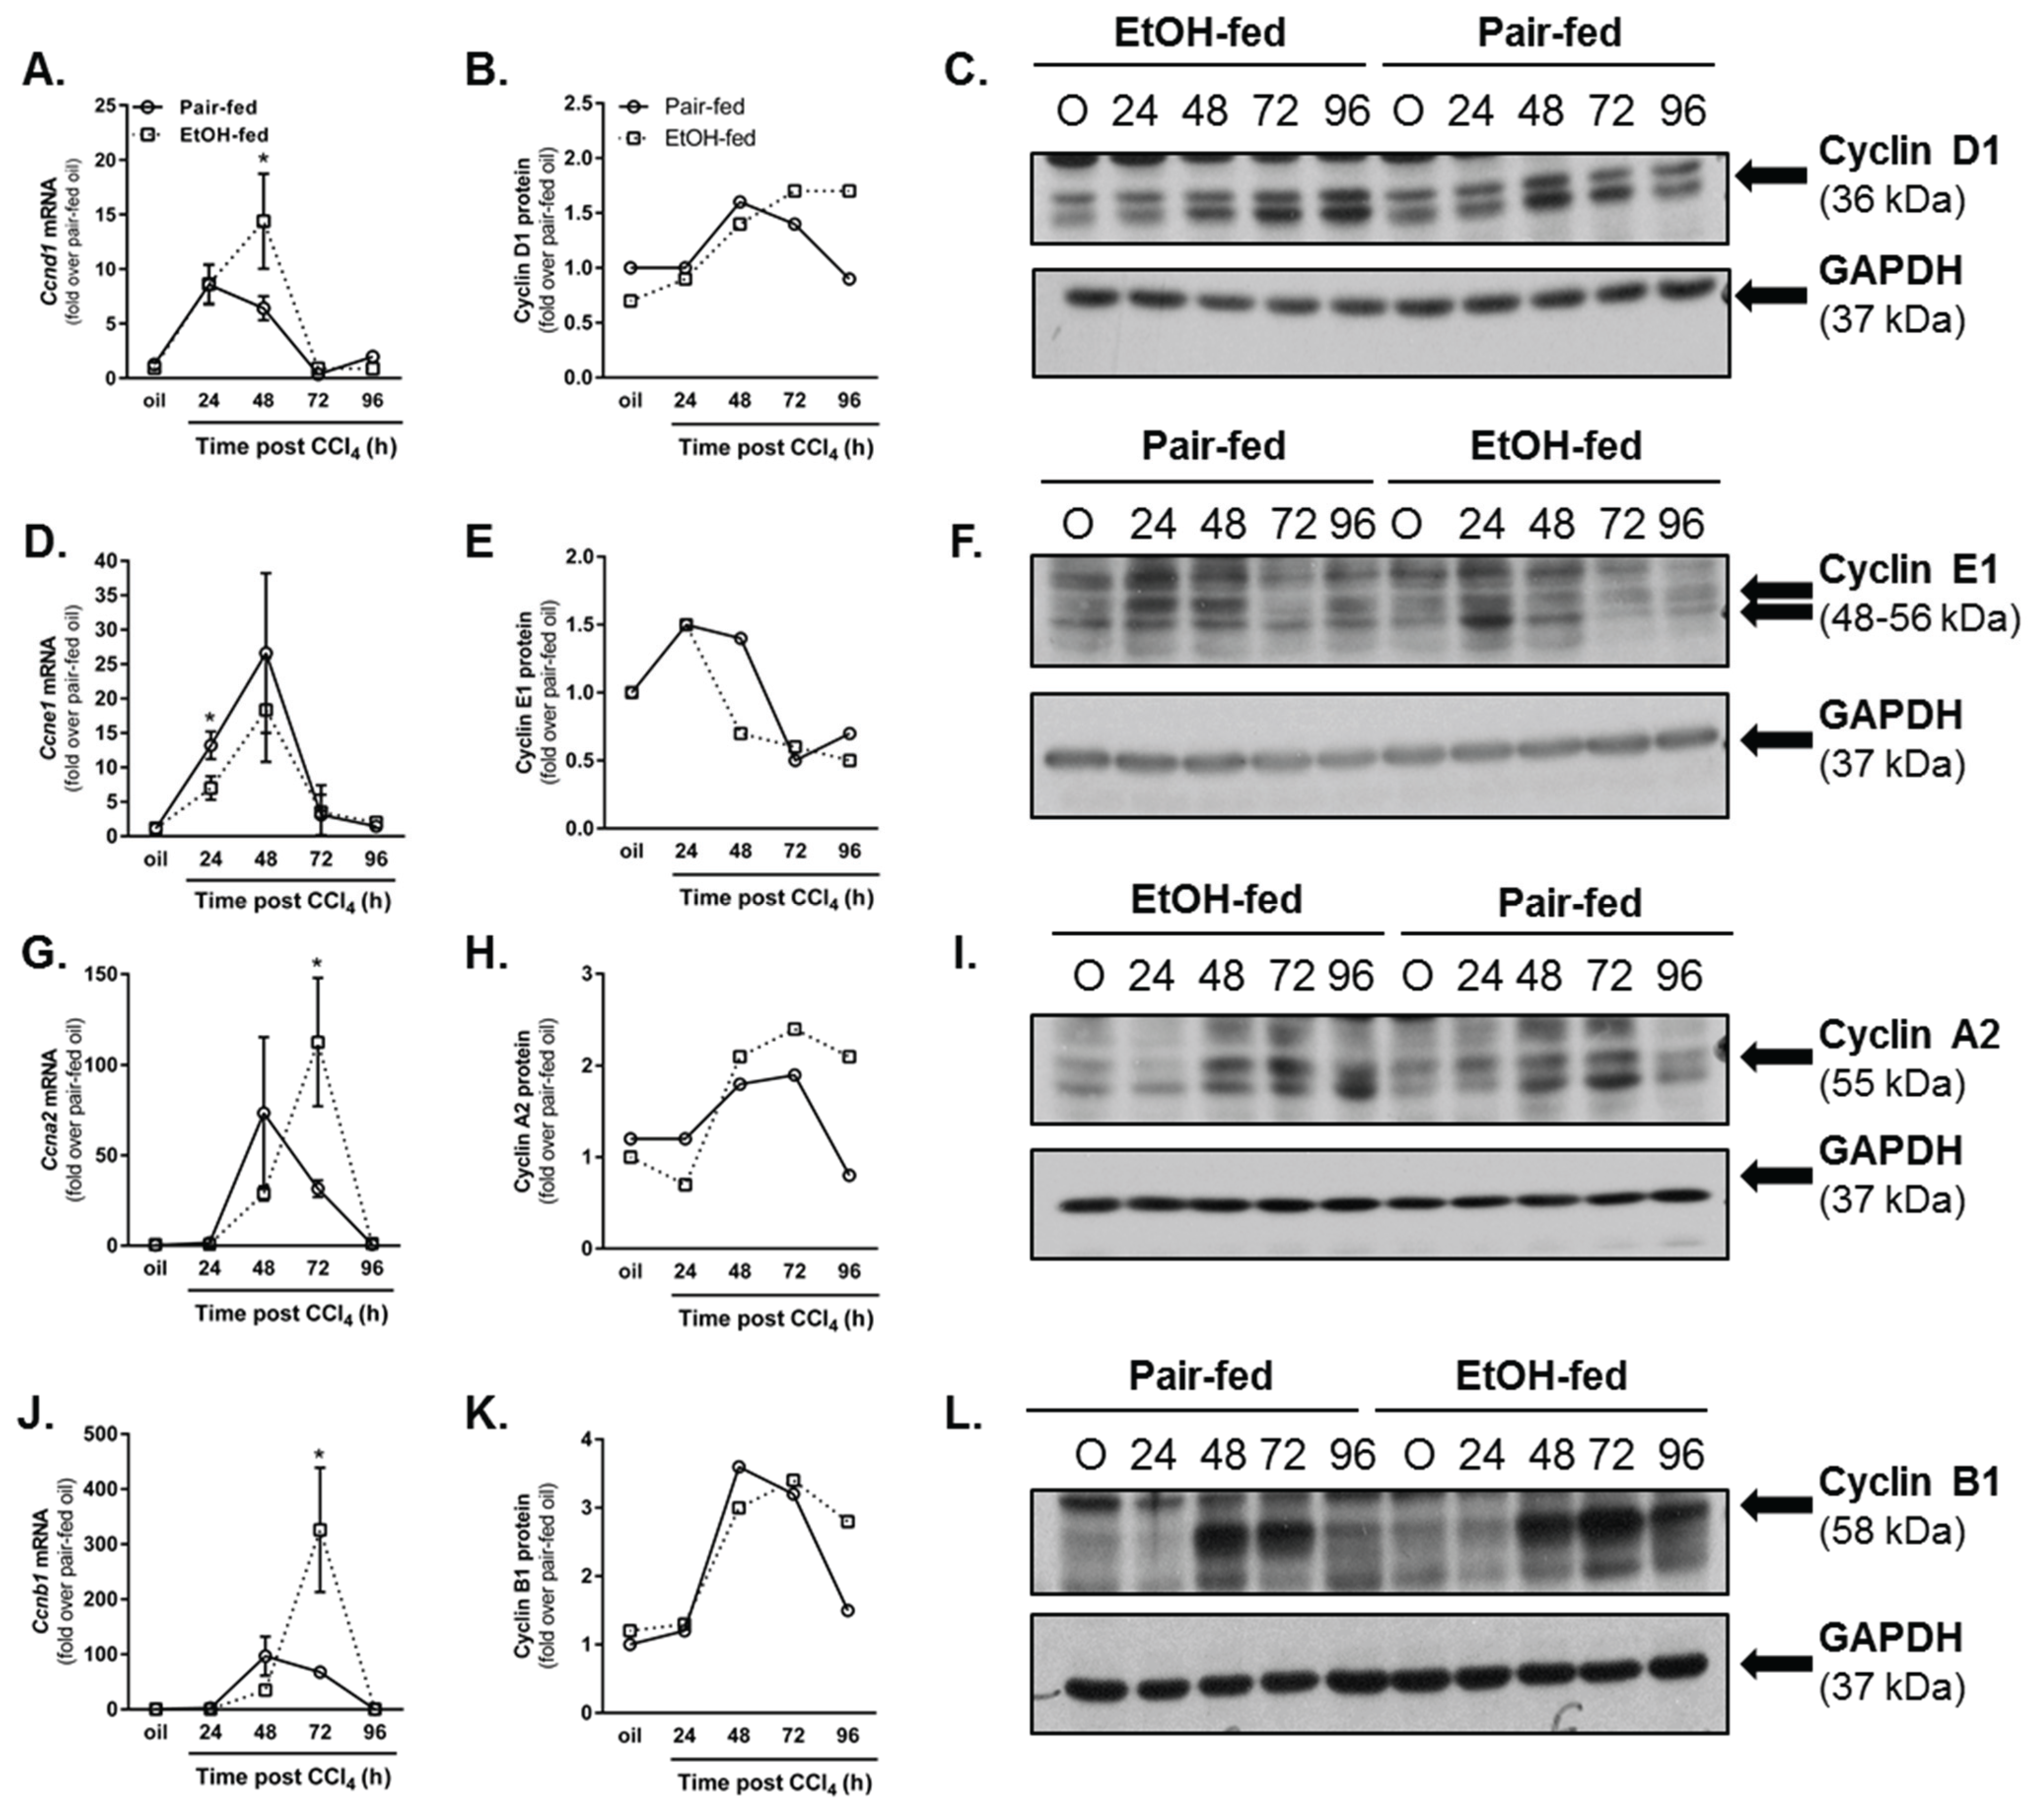
2.3.1. Dynamics of Hepatic Cyclin Content

Inflammation after liver injury is required for timely liver regeneration [29,35]. Gut-derived bacterial cell wall components such as lipopolysaccharide, complement activation products and their cognate receptors, TNFα and IL6 are all implicated in the orchestration of timely liver regeneration [29,36,37,38]. Given that TNFα was reduced and hepatocyte cell death increased after CCl4-induced liver injury, we hypothesized that liver regeneration would also be impaired by ethanol feeding. To test this hypothesis, we evaluated the hepatic cyclin D1, E1, A2 and B1 transcript and protein accumulation. Cyclin D1 is the first cyclin transcript synthesized once hepatocytes enter the cell cycle [39]. Cyclin D1 mRNA increases equivalently in livers from pair- and ethanol-fed mice 24 h after CCl4 (Figure 6A). However, 48 h after CCl4, cyclin D1 transcript levels are reduced in pair-fed mice but maintained in ethanol-fed mice (Figure 6A). At the protein level, cyclin D1 content was sustained in livers from ethanol-fed mice relative to pair-fed mice 96 h after CCl4 exposure (Figure 6B,C). Few differences in cyclin E1, the cyclin whose expression peaks between the G1 and S phases of the cell cycle [40], were observed between pair- and ethanol-fed groups; only a small but significant reduction in cyclin E1 mRNA was observed in livers from ethanol-fed mice 24 h after CCl4 (Figure 6D). Hepatic cyclin E1 protein was reduced by 50% 48 h after CCl4 exposure in ethanol-fed mice, consistent with reduced cyclin E1 mRNA (Figure 6E,F).
Figure 6. Moderate ethanol feeding enhanced hepatic cyclin content after CCl4 exposure. Cyclin D1 (AC), cyclin E1 (DF), cyclin A2 (GI) and cyclin B1 (JL) were each analyzed in livers from pair-and ethanol-fed mice after CCl4 exposure. In (A,D,G,J), real time PCR was used to determine hepatic content of cyclin transcripts while in (C,F,I,L), immunoblotting was used to determine hepatic cyclin protein content from pooled liver samples (n = 4–8 mice per group). Real time PCR data are expressed as fold change over pair-fed, olive oil exposed mice after normalization to 18S. Protein band integrated density was determined for each cyclin and GAPDH (loading control) band. After normalization to GAPDH, band densities were used to calculate fold change in cyclin protein over pair-fed mice exposed to olive oil (oil). N = 4–8 mice per group. * p < 0.05.
Biomolecules 06 00005 g006
Cyclin A2 peaks during the G2 phase of the cell cycle and is important for transition to mitosis [41,42]. Hepatic cyclin A2 transcript accumulation occurs in pair- and ethanol-fed mice. However, in contrast to pair-fed mice, ethanol-fed mice exhibited 3.5-fold higher cyclin A2 transcripts 72 h after CCl4 exposure (Figure 6G). Consistently, Cyclin A2 protein levels were more than twofold greater in livers from ethanol-fed mice 96 h after CCl4 exposure (Figure 6H,I). Cyclin B1 peaks at the G2-M phase transition [43]. At the mRNA level, cyclin B1 peaks in livers from pair-fed mice 48 h after CCl4, but this peak is delayed until 72 h after CCl4 and greater in livers from ethanol-fed mice (Figure 6J). At the protein level, the increase in cyclin B1 mRNA manifested in a 2.5-fold increase in cyclin B1 protein at 96 h after CCl4 (Figure 6K,L). Taken together, the cyclin data in Figure 6 suggest that moderate ethanol feeding did not impair hepatocyte entry into the cell cycle, but prolonged the cell cycle in liver after acute CCl4 exposure.

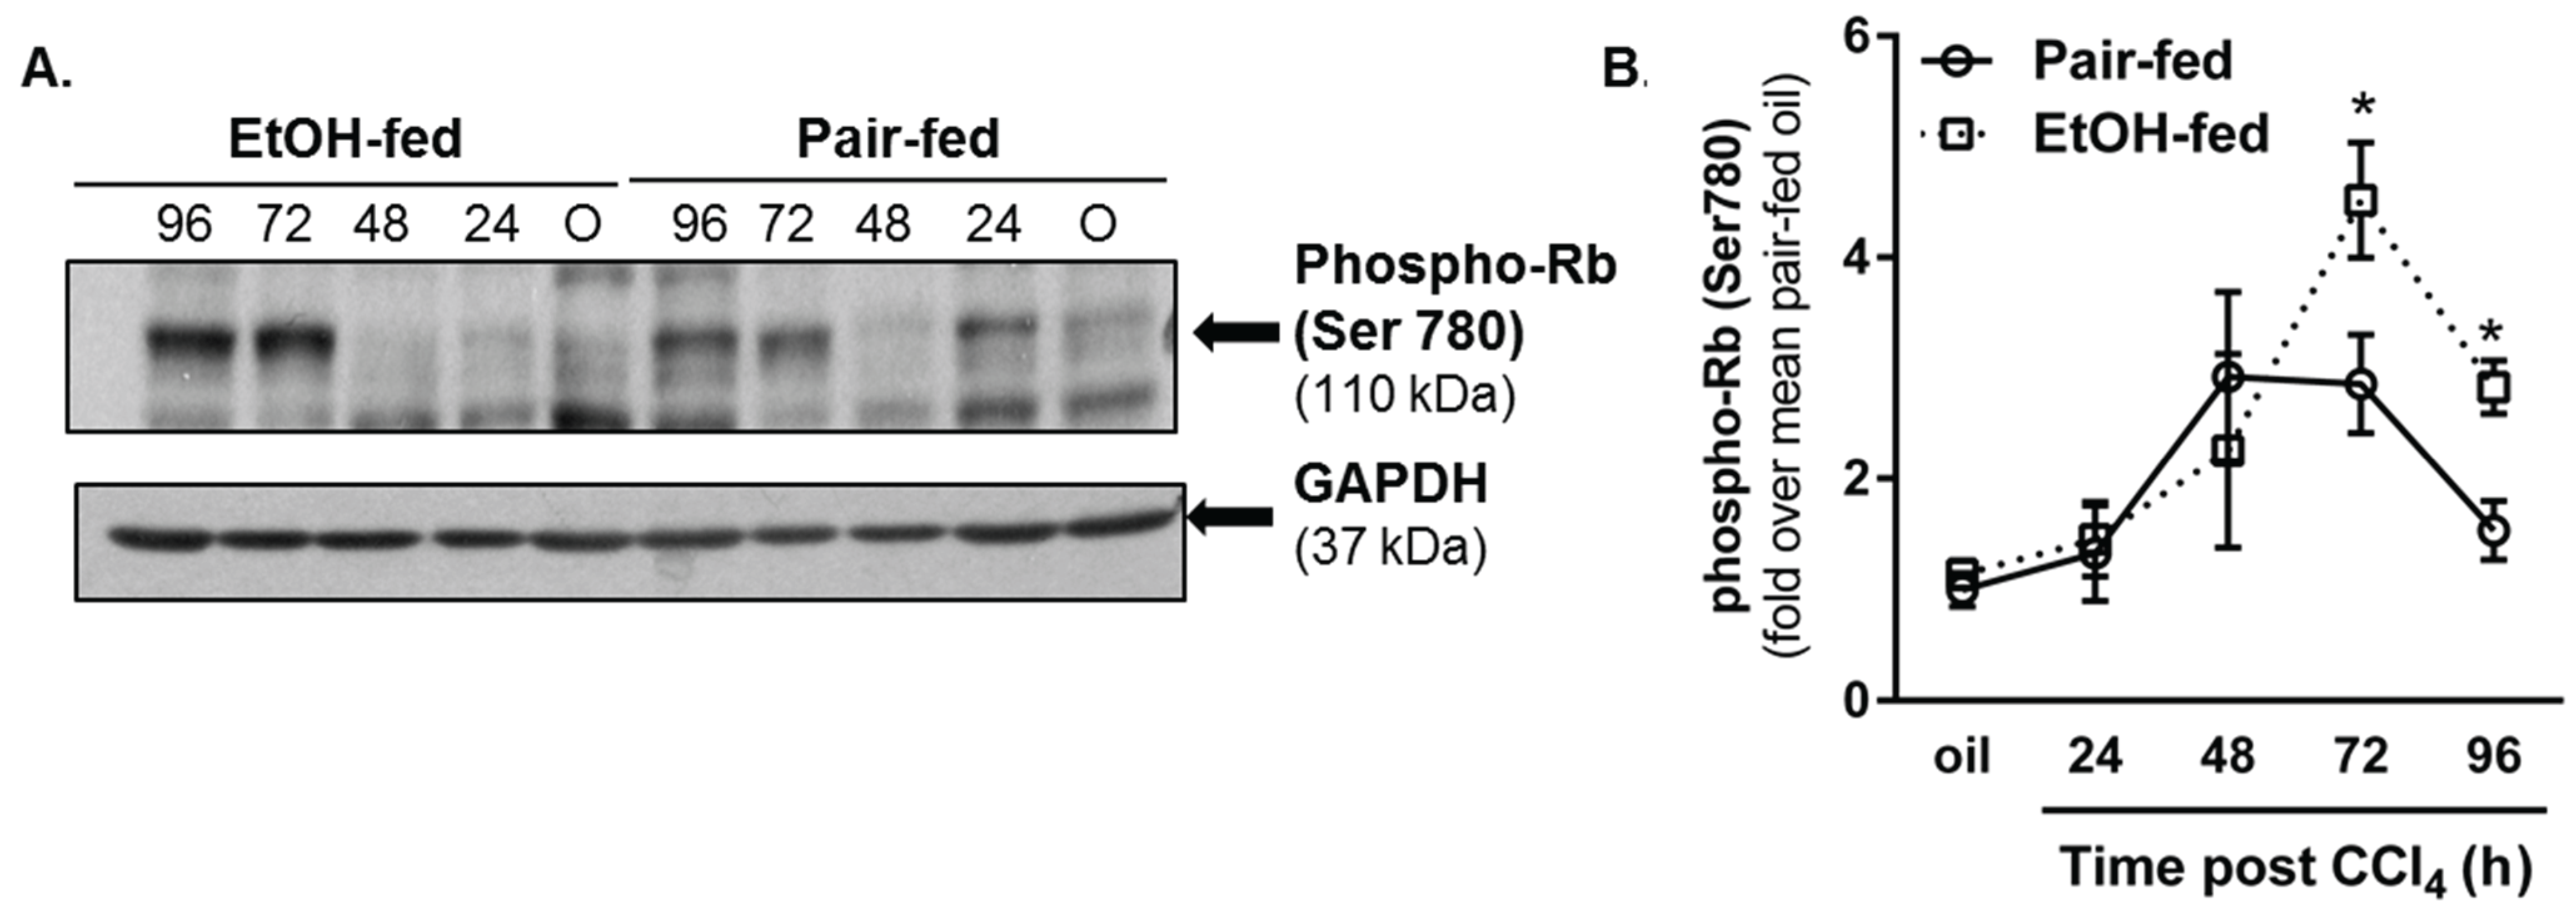
2.3.2. Retinoblastoma Phosphorylation

Given the changes in hepatic cyclin expression, we asked if other liver regeneration markers were also affected after CCl4 exposure. To this end, we evaluated phosphorylation of the retinoblastoma (Rb) protein. When hypophosphorylated, Rb binds to the E2F transcription factor and prevents its induction of cell cycle regulators such as the cyclin genes. By contrast, Rb hyperphosphorylation inhibits Rb-mediated E2F sequestration, facilitating cyclin gene expression and cell cycle progression [44]. By immunoblotting, we found Rb phosphorylation was greater in livers from ethanol-fed mice compared to pair-fed mice 72 and 96 h after CCl4 exposure (Figure 7A,B). These data are consistent with increased cyclin D1, A2 and B1 content in livers from ethanol-fed mice 96 h after CCl4.
Figure 7. Phosphorylation of the retinoblastoma (Rb) protein was increased by moderate ethanol feeding to mice. Mice on ethanol-containing diets were exposed to CCl4 and euthanized 24–96 h later. Immunoblots were used to determine hepatic content of phospho-Rb (Ser780) in livers from each mouse. (A) Representative phospho-Rb immunoblot. GAPDH was used as a loading control; (B) Semi-quantification of band densities from all blots after normalization to GAPDH. Data are graphed as fold change over pair-fed, olive oil-treated mice. N = 4–8 mice per group. * p < 0.05.
Biomolecules 06 00005 g007

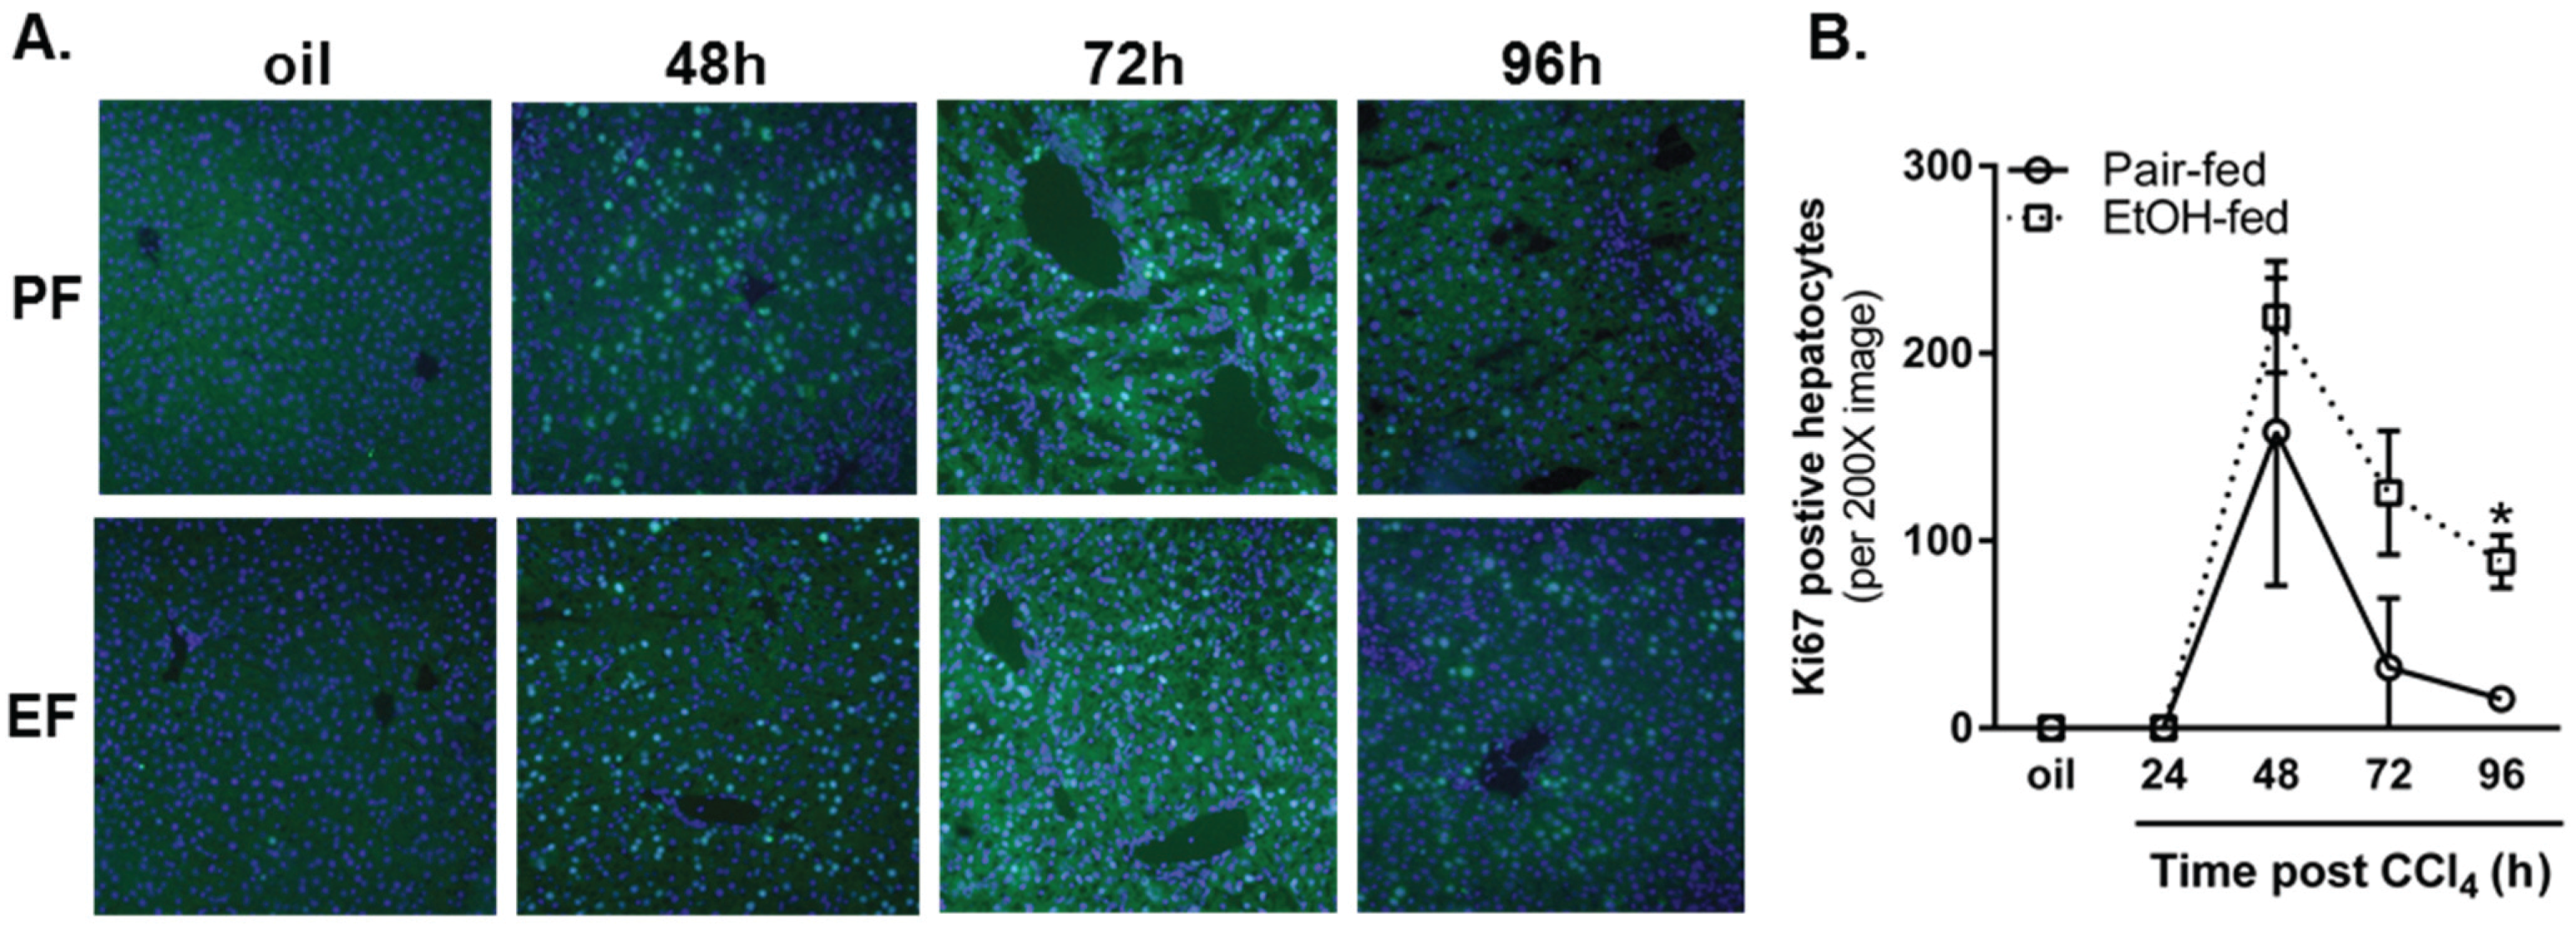
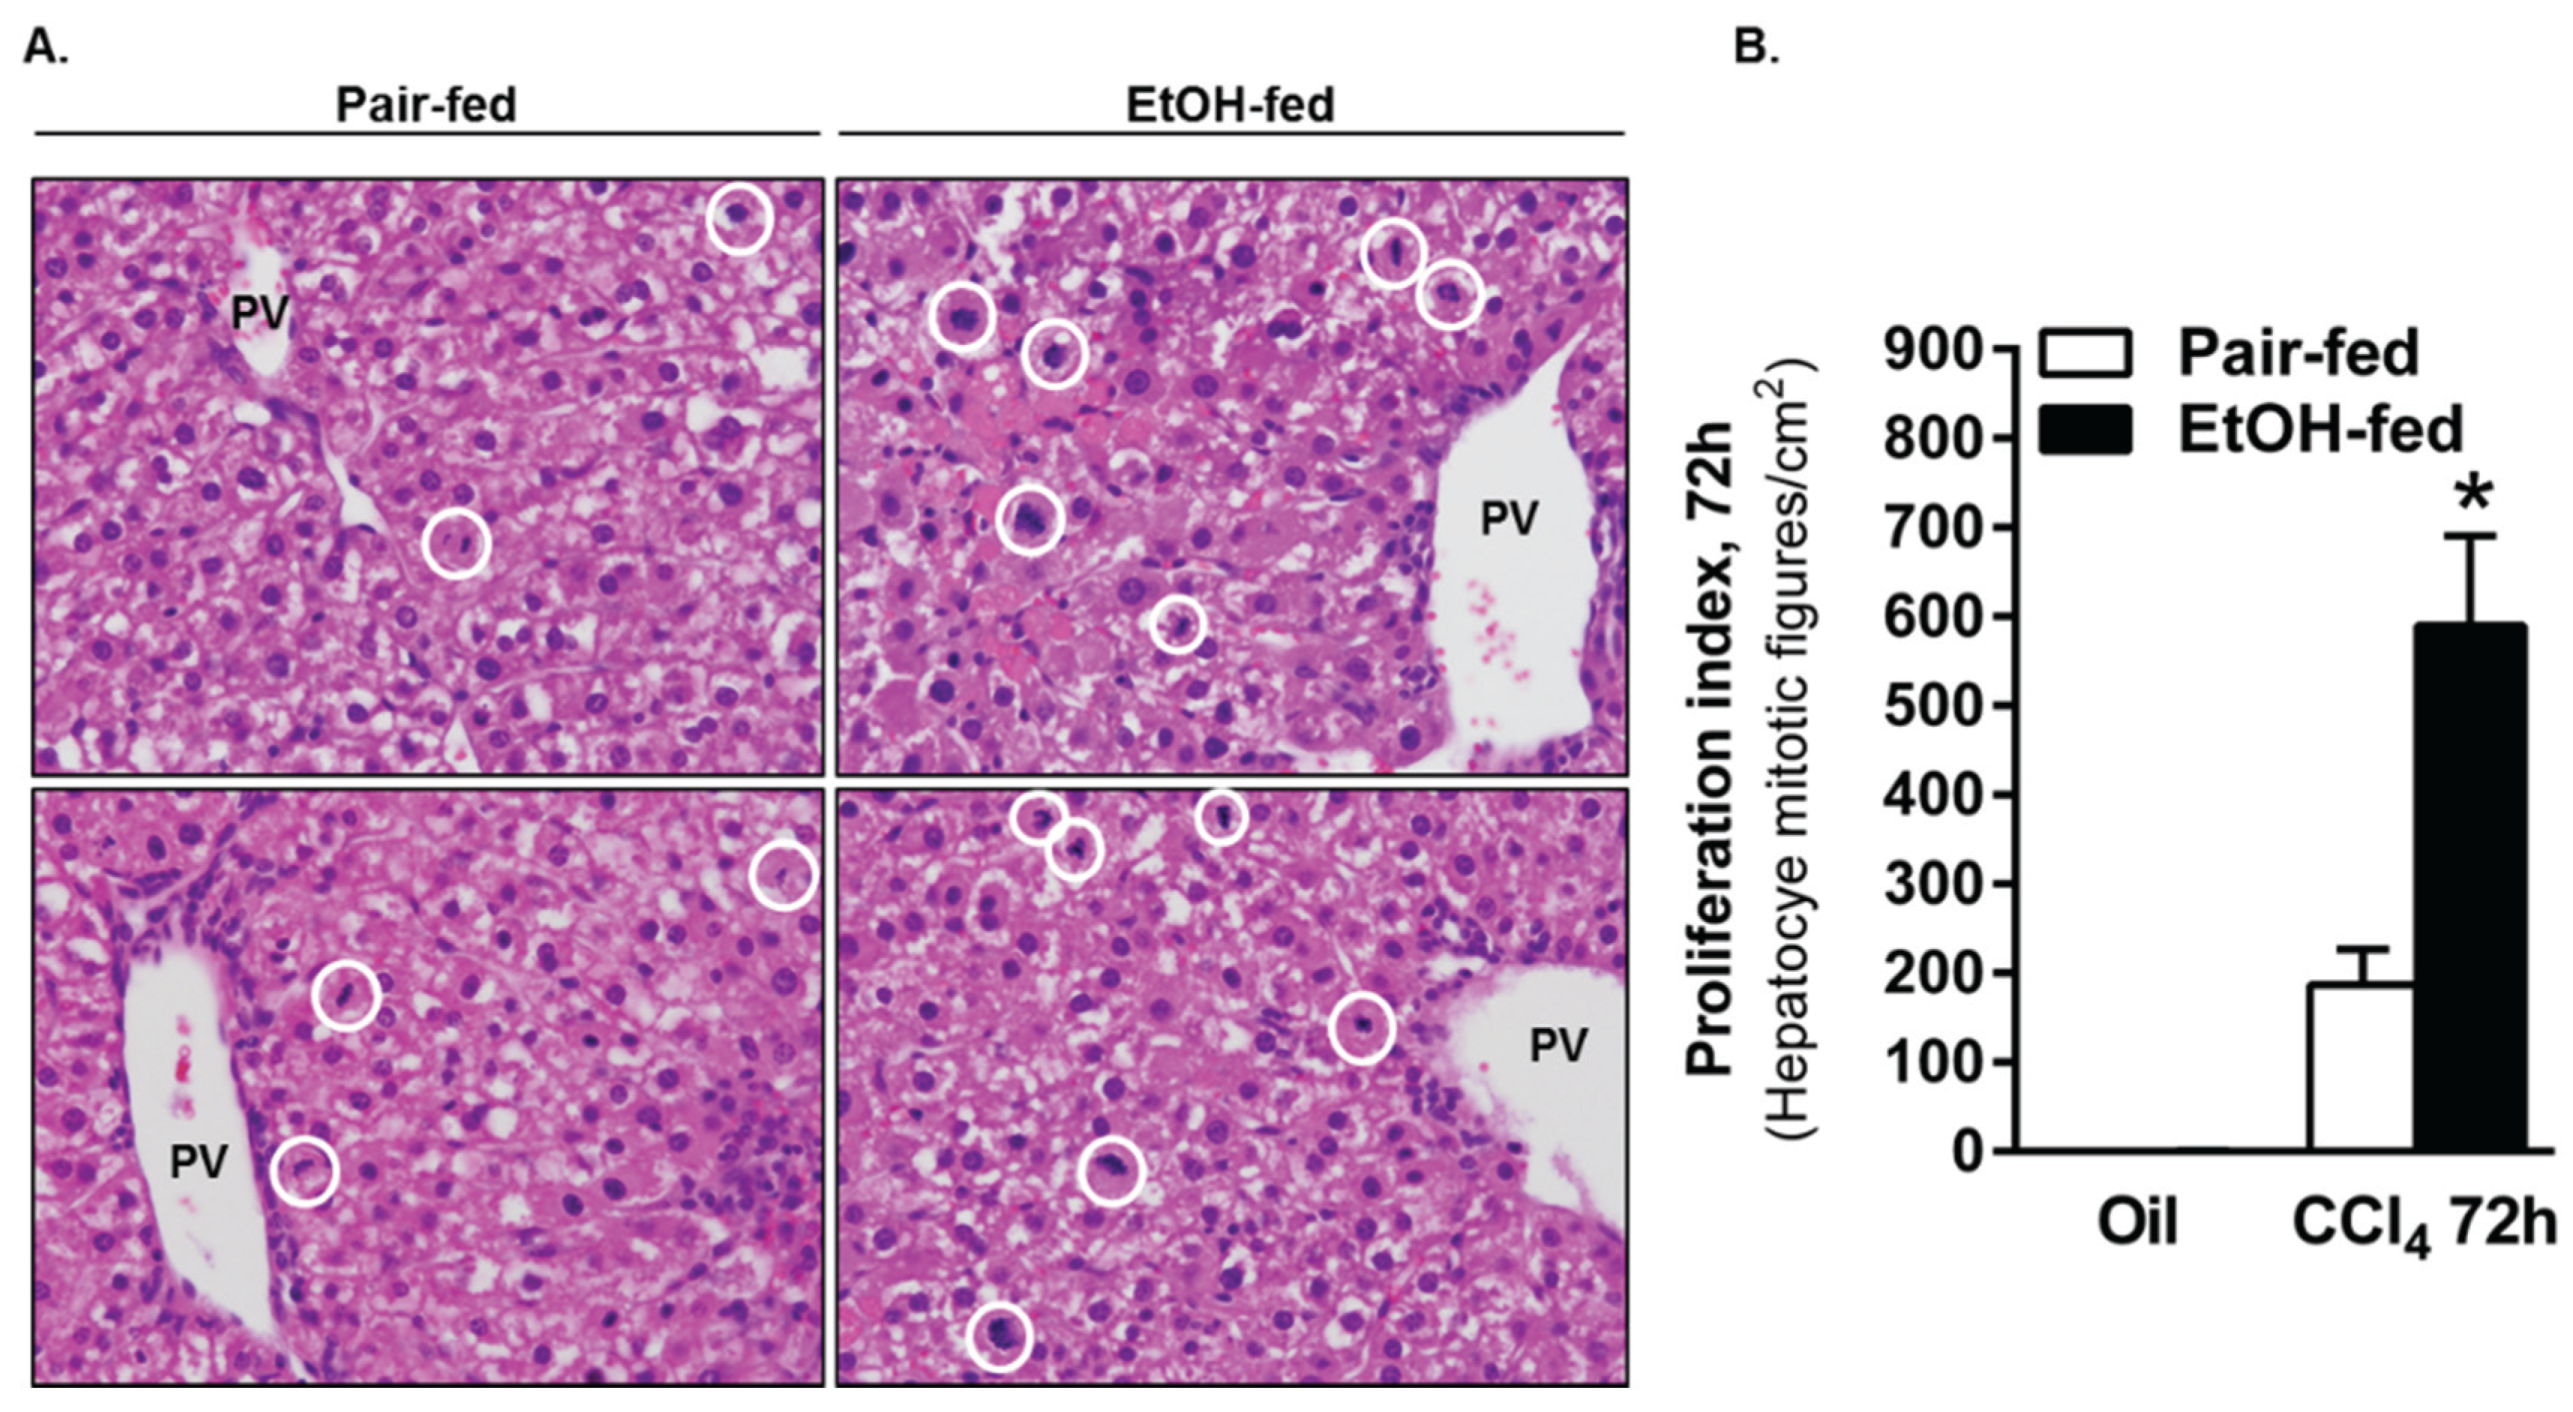
2.3.3. Ki67 Staining and Mitotic Index

Changes in cyclin expression and Rb phosphorylation were followed up by an analysis of hepatocyte proliferation assessed by Ki67 immunostaining and quantification of mitotic figures in H&E-stained liver sections. Using Ki67 immunofluorescence, we observed robust hepatocyte proliferation in livers from pair- and ethanol-fed mice 48 h after CCl4 exposure, which was not different between diet groups (Figure 8). However, as the proliferative response waned, 5.5-fold more Ki67-positive cells were found in livers from ethanol-fed mice when compared to pair-fed mice 96 h after CCl4. Moreover, the number of mitotic figures was three-fold greater in livers from ethanol-fed mice 72 h after CCl4 (Figure 9). It is interesting to note that mitotic figures were rare 96 h after CCl4 and not different between pair- and ethanol-fed mice, despite the increased Ki67-positive staining at this time point. This apparent discrepancy suggests either fewer cells in livers from ethanol-fed mice had exited the cell cycle compared to cells in livers from pair-fed mice, or an additional wave of proliferation occurs in livers from ethanol-fed mice >96 h after CCl4 exposure. Additional studies would be required to determine the reason for this apparent disconnect.
Figure 8. Moderate ethanol feeding to mice sustained hepatocyte proliferation late in the time course after CCl4 exposure. (A) Representative images from Ki67-stained livers from pair- and ethanol-fed mice by immunofluorescense (green) after CCl4. DAPI (blue) was used as a nuclear counterstain. Sections were stained on the same day and exposure times kept constant for each image; (B) Quantification of the number of Ki67-positive hepatocyte nuclei in 3–4 images from a single liver section per mouse. PF = Pair-fed, EF = Ethanol-fed. N = 3–4 mice per group. * p < 0.05.
Biomolecules 06 00005 g008
Figure 9. The number of mitotic figures was greater in livers from ethanol-fed mice 72 h after CCl4 exposure. (A) Representative images from H&E stained liver sections taken from mice 72 h after CCl4 exposure. Mitotic figures were found predominantly in Zones 1 and 2, so the images were captured using the portal vein as a landmark. The white circles in each image outline mitotic cells. (B) Graphical representation of the number of mitotic cells in livers from pair and ethanol-fed mice 72 h after CCl4 exposure. Mitotic figures were rare or not present at other time points evaluated. N = 4–8 mice per group. * p < 0.05.
Biomolecules 06 00005 g009
Collectively, the data in Figure 6, Figure 8 and Figure 9 suggest that moderate ethanol exposure induces a more robust hepatic regenerative response after acute CCl4 exposure. While some data suggest enhancement of various indices of the regenerative response at any given time point, other data suggest that the overall response may actually be prolonged. Lack of differences in the peak response would support this idea. Regardless, the more robust regenerative phenotype in livers from ethanol-fed mice is likely due to the need to replace the greater number of hepatocytes lost after acute CCl4 exposure (Figure 5). Finally, enhanced pro-regenerative signaling (Figure 7) may drive this apparently prolonged period of liver regeneration. In order to ensure that the liver regenerative response is actually prolonged and not just enhanced at late time points (i.e., 72–96 h), we would need to evaluate indices of regeneration greater than 96 h after acute CCl4 exposure.

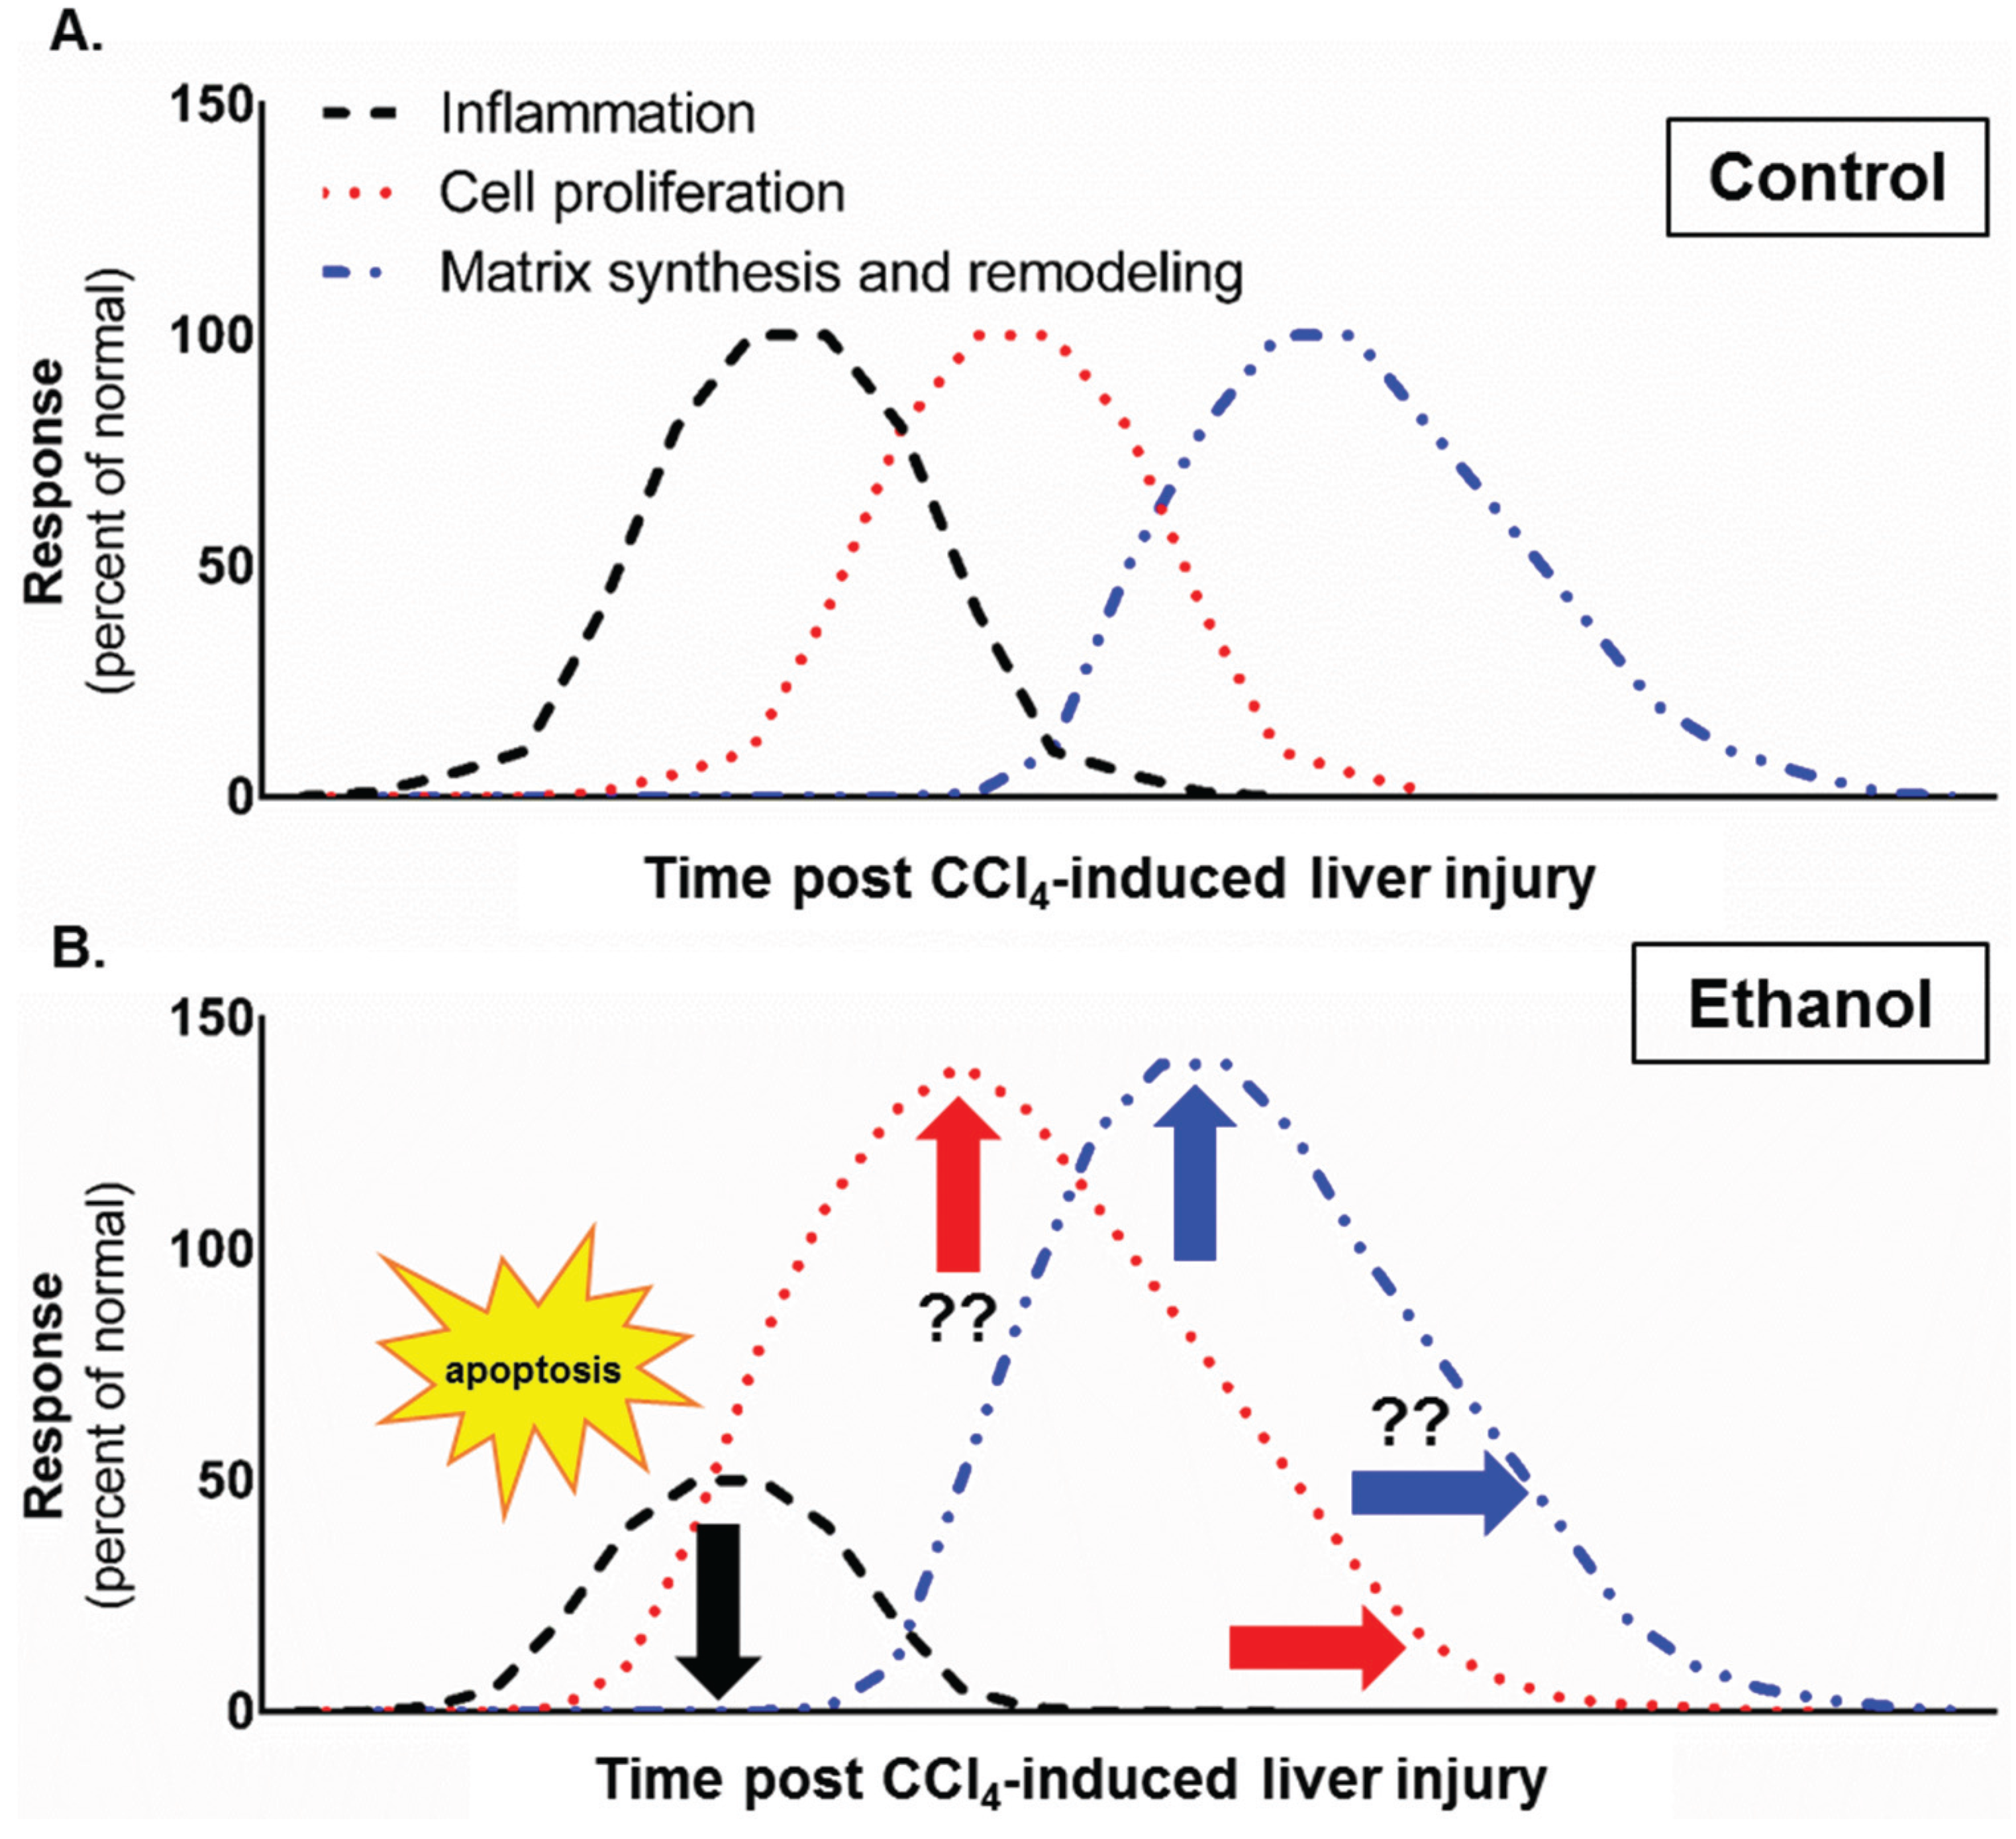
2.3.4. Role of Ethanol on Liver Regeneration

Interestingly, our data on the liver regenerative response after “chemical hepatectomy” were similar to those found after partial (surgical) hepatectomy in a high-dose binge (acute) ethanol exposure model (6 g/kg ethanol given three times before partial hepatectomy) [45]. Ding et al. observed enhanced hepatocyte proliferation after partial hepatectomy, which was also independent of liver injury. This finding was attributed to an ethanol-dependent increase in mitochondrial aldehyde dehydrogenase activity preventing mitochondrial oxidative stress and preconditioning the liver to a more rapid proliferative response [45]. Additionally, Apte et al. demonstrated that chronic ethanol exposure alone impacts hepatocyte proliferation [46]. Specifically, a significant percentage of hepatocytes are in S-phase after one, two, or three weeks of ethanol feeding to rats (5% v/v), but not after four or five weeks of ethanol feeding [46]. These authors also demonstrated that early in feeding paradigm, ethanol exposure enhanced apoptotic cell death; this likely stimulated the transient compensatory hepatocyte division observed in rats fed ethanol for 1–3 weeks. Taken together, while the apparent mechanisms promoting liver regeneration differ between ethanol exposure models, the end result was similar in these studies: ethanol exposure increases indices of hepatocyte proliferation. These data highlight the liver’s ability to appropriately respond to ethanol-mediated cell death, a property which is lost after long-term ethanol exposure.
In contrast to a beneficial effect of ethanol on liver regeneration as described above, liver regeneration after partial hepatectomy in rats after a single acute ethanol exposure (6 g/kg) did not alter 3H-thymidine incorporation when given 4 h before, at the time of or 4 or 8 h after partial hepatectomy [47]. However, when ethanol was administered 12 or 16 h after partial hepatectomy, liver regeneration was inhibited [47]. Likewise, chronic high-dose ethanol (4% or 5% v/v ethanol for five or six weeks) exposure inhibits liver regeneration. Specifically, 3H-thymidine incorporation and mitotic index are reduced after acute [47] or chronic ethanol feeding and is due to inhibition of ornithine decarboxylase activity and downstream polyamine synthesis in rats [48], and induction of redox sensitive cell cycle inhibitors in mice [49]. Collectively, the ethanol dose, pattern of exposure and timing of exposure relative to additional hepatic insult differentially regulate the hepatic proliferative response.

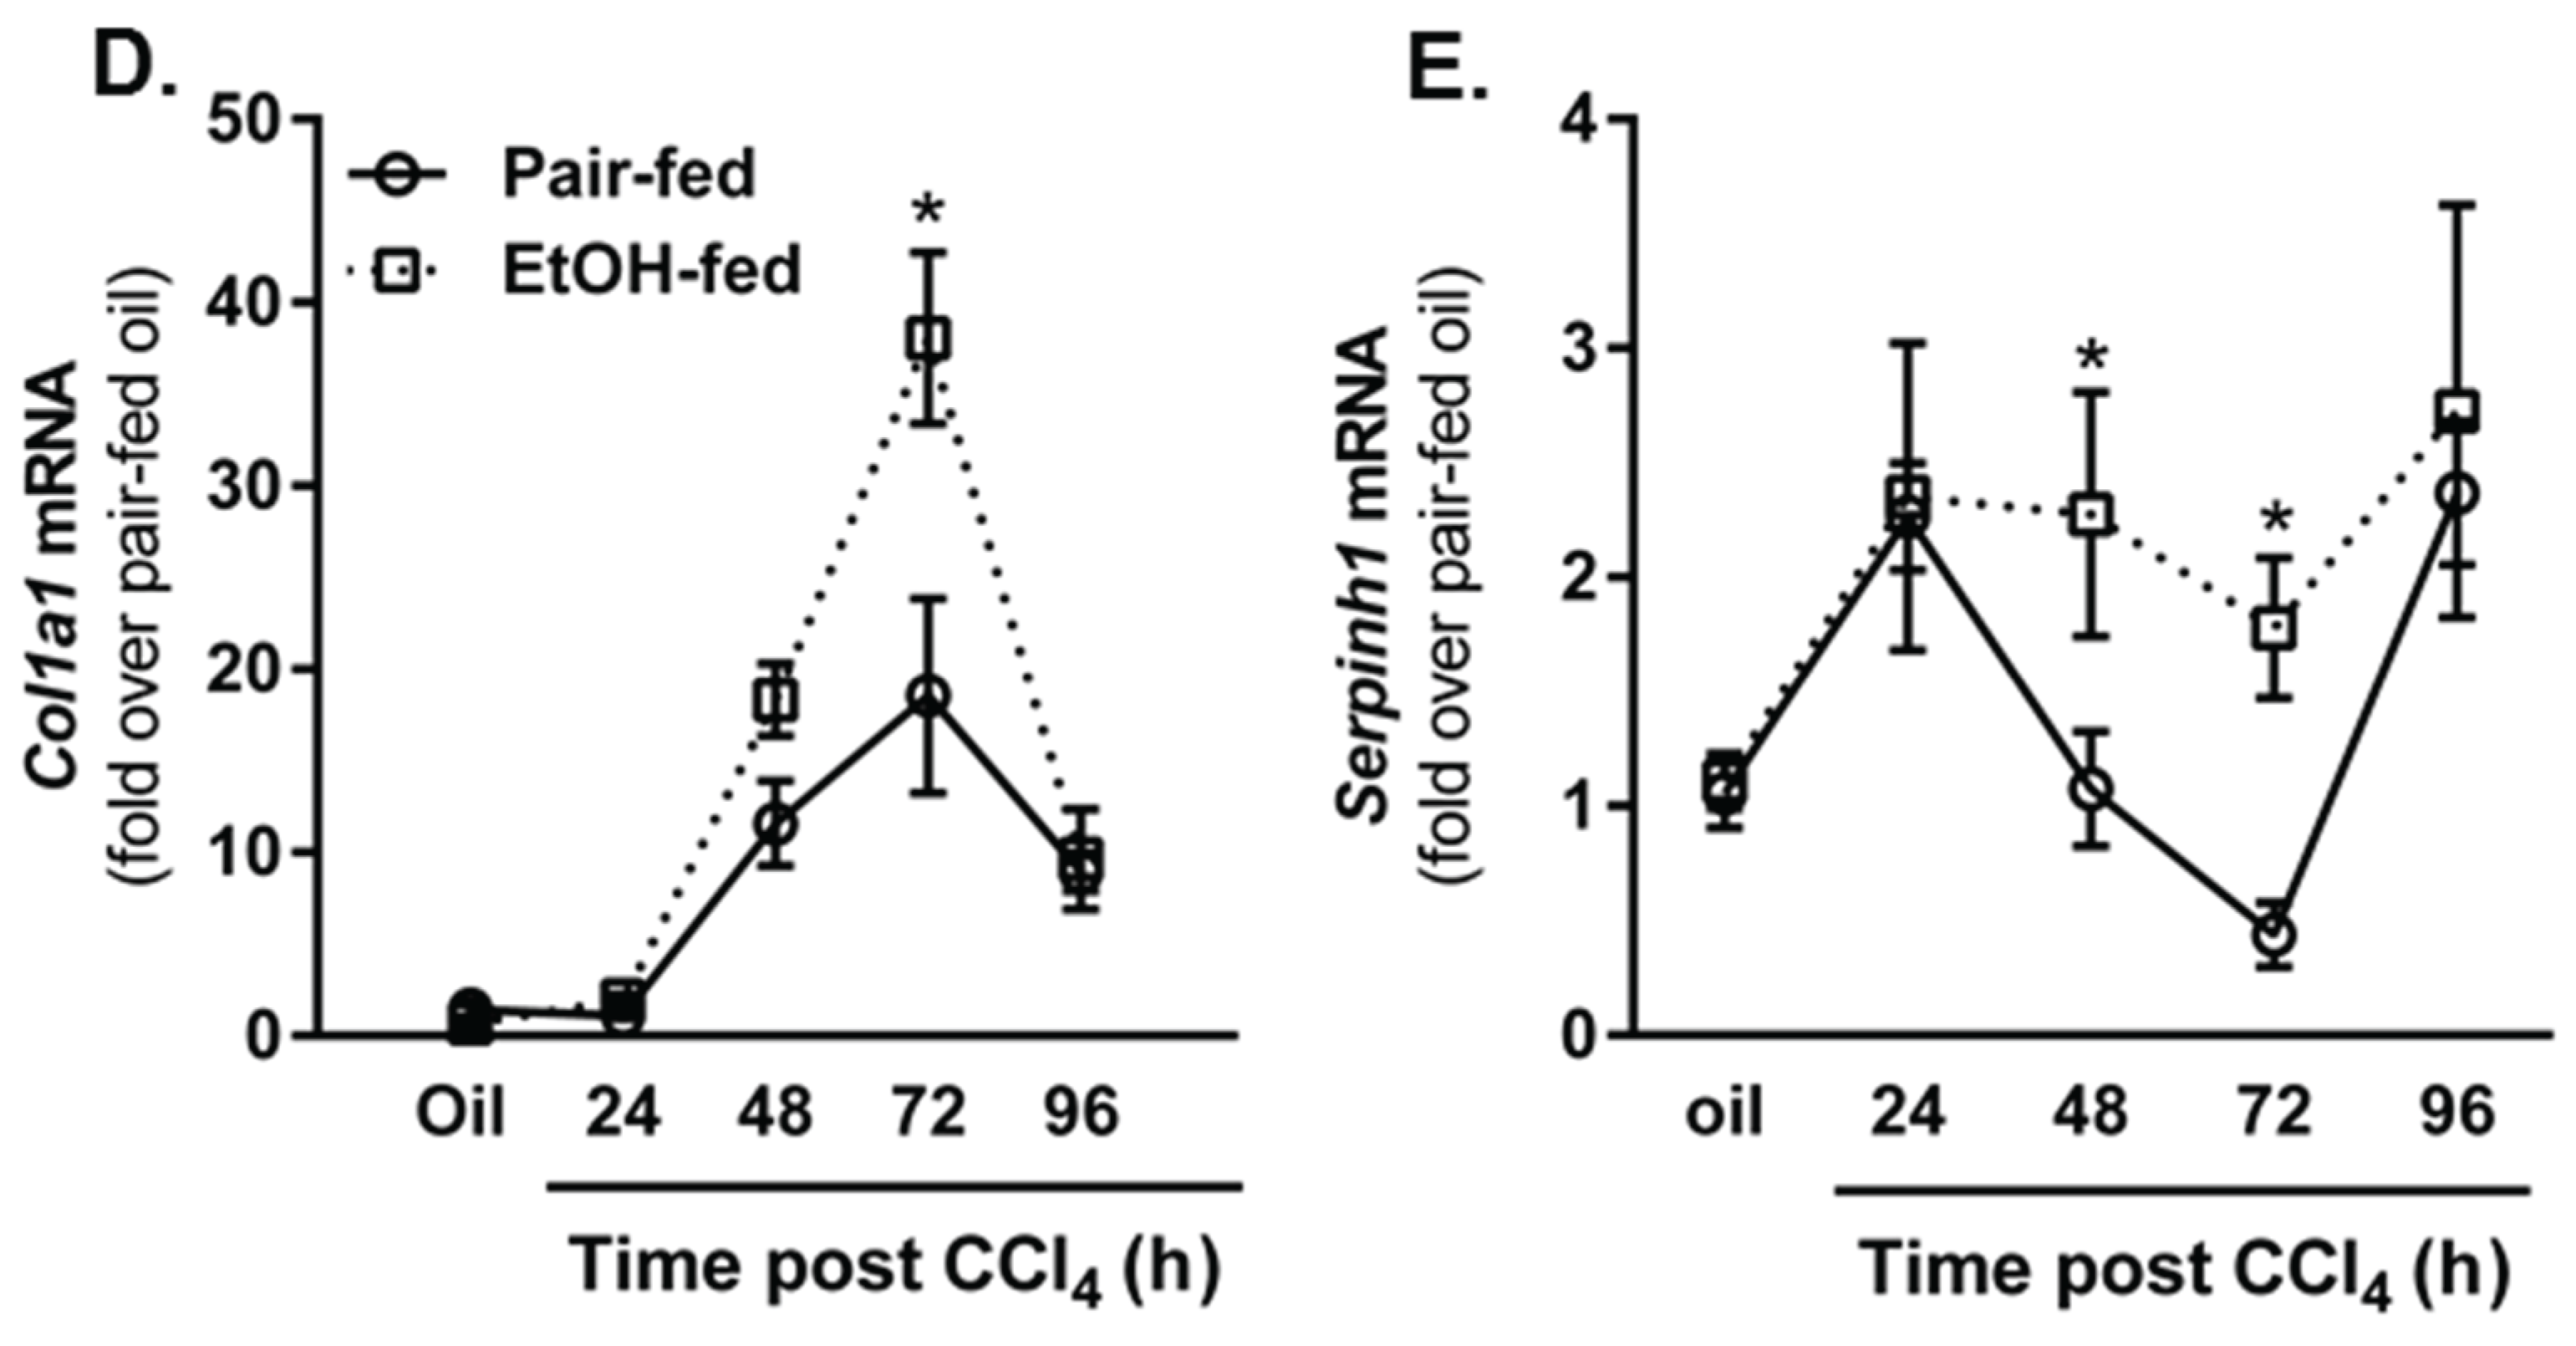
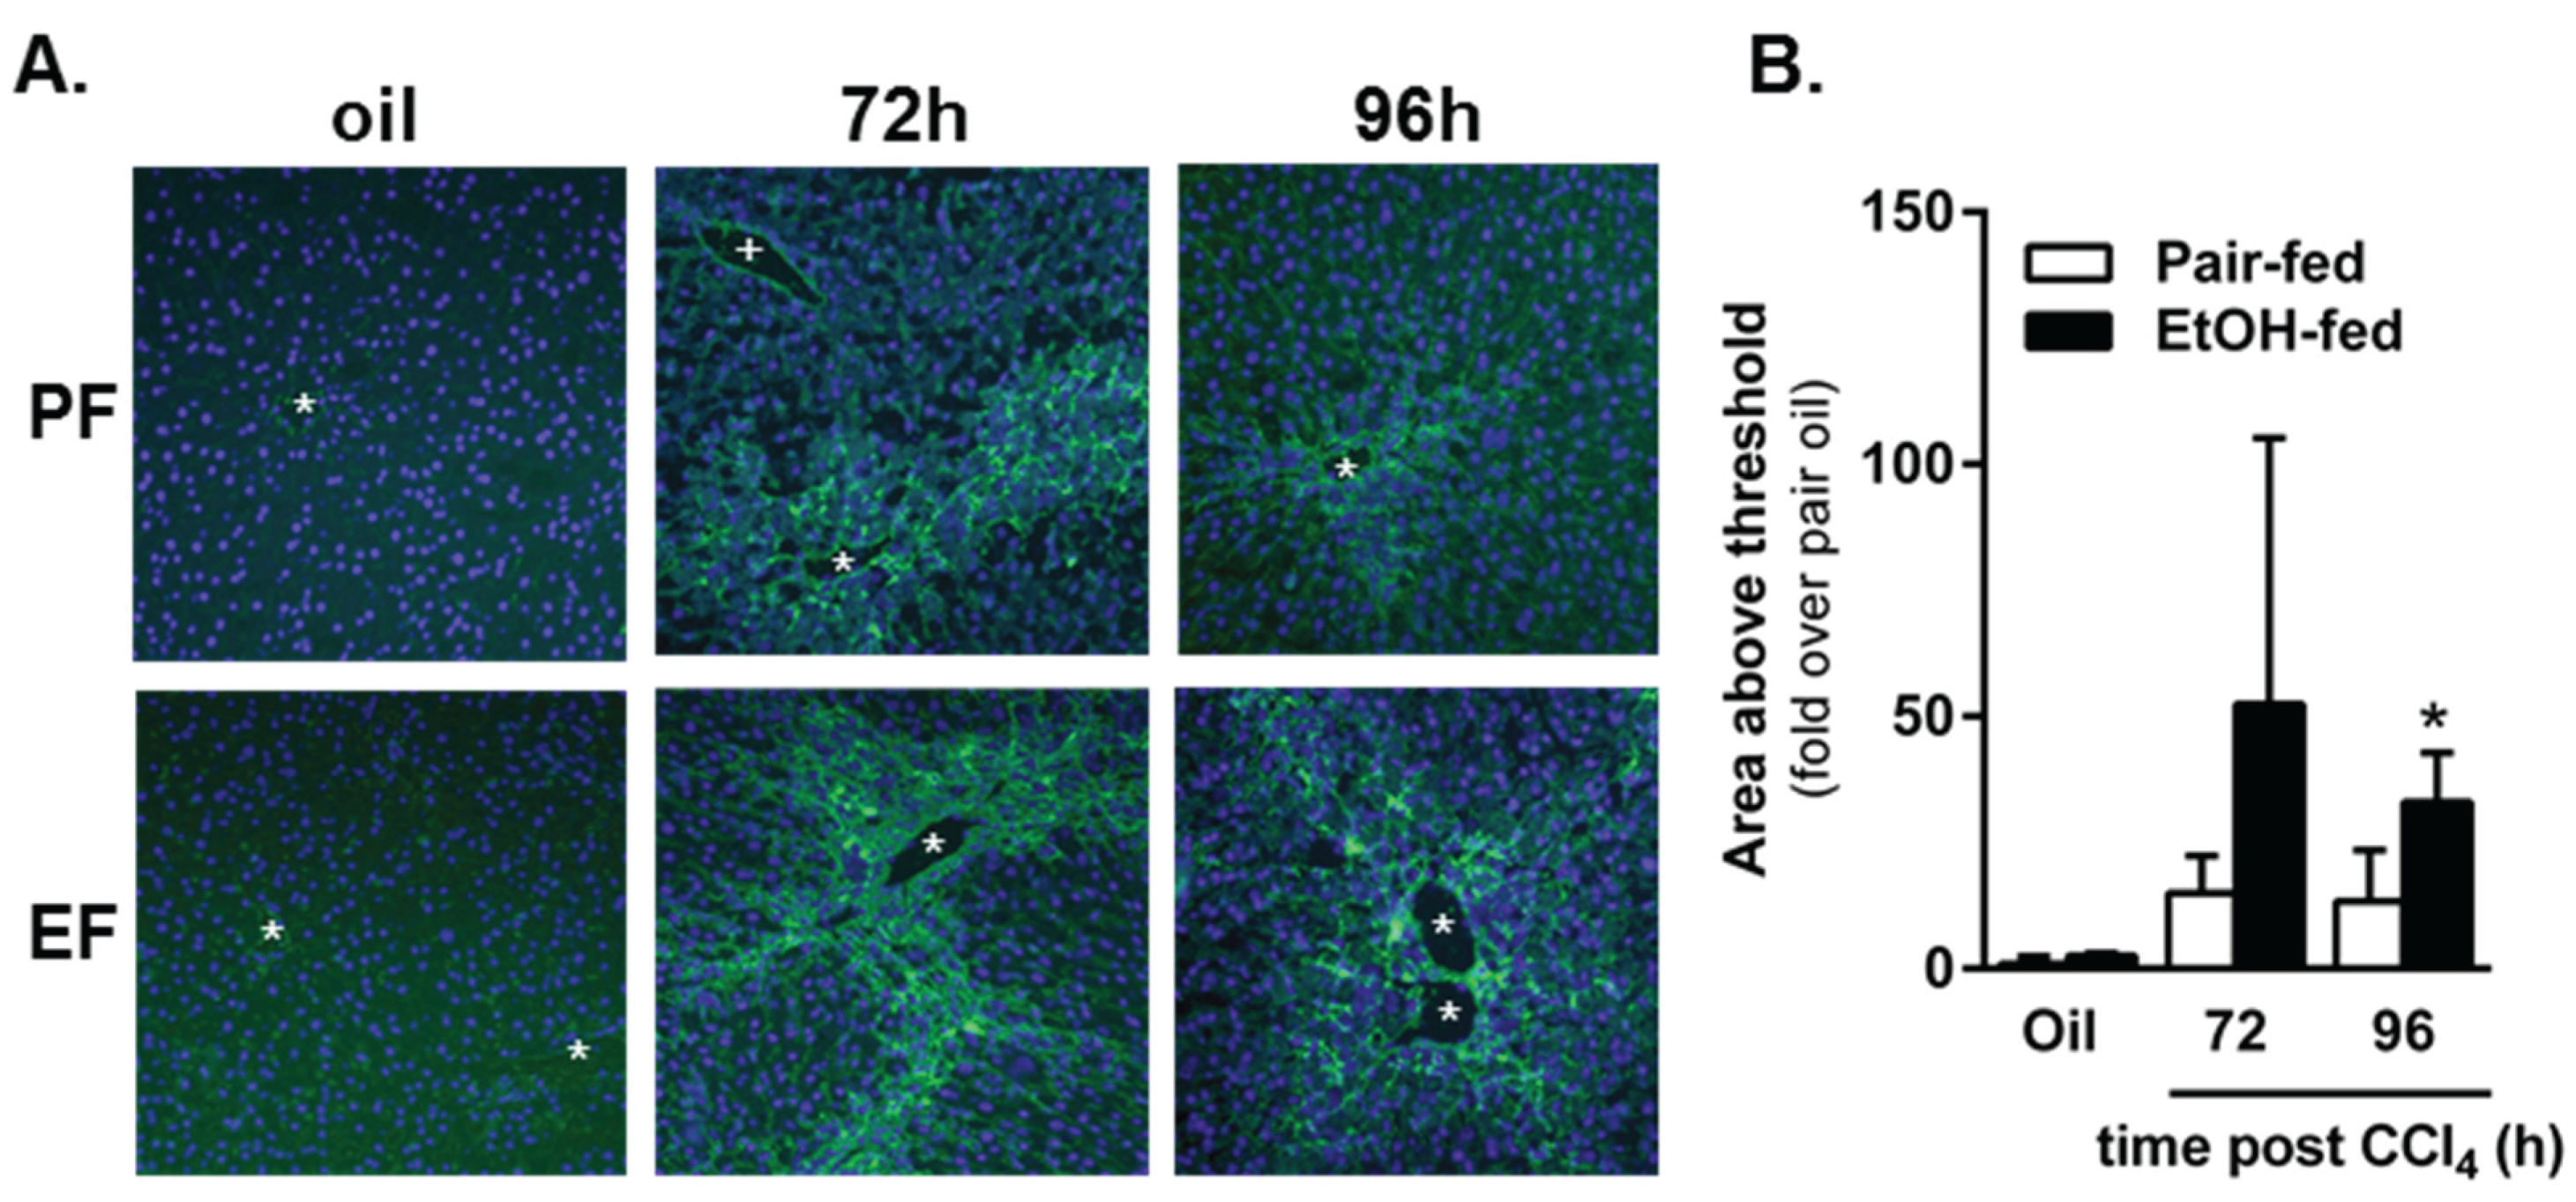
2.4. Impact of Moderate Ethanol Feeding on Hepatic Stellate Cell Activation and Extracellular Matrix (ECM) Remodeling after Acute CCl4 Exposure

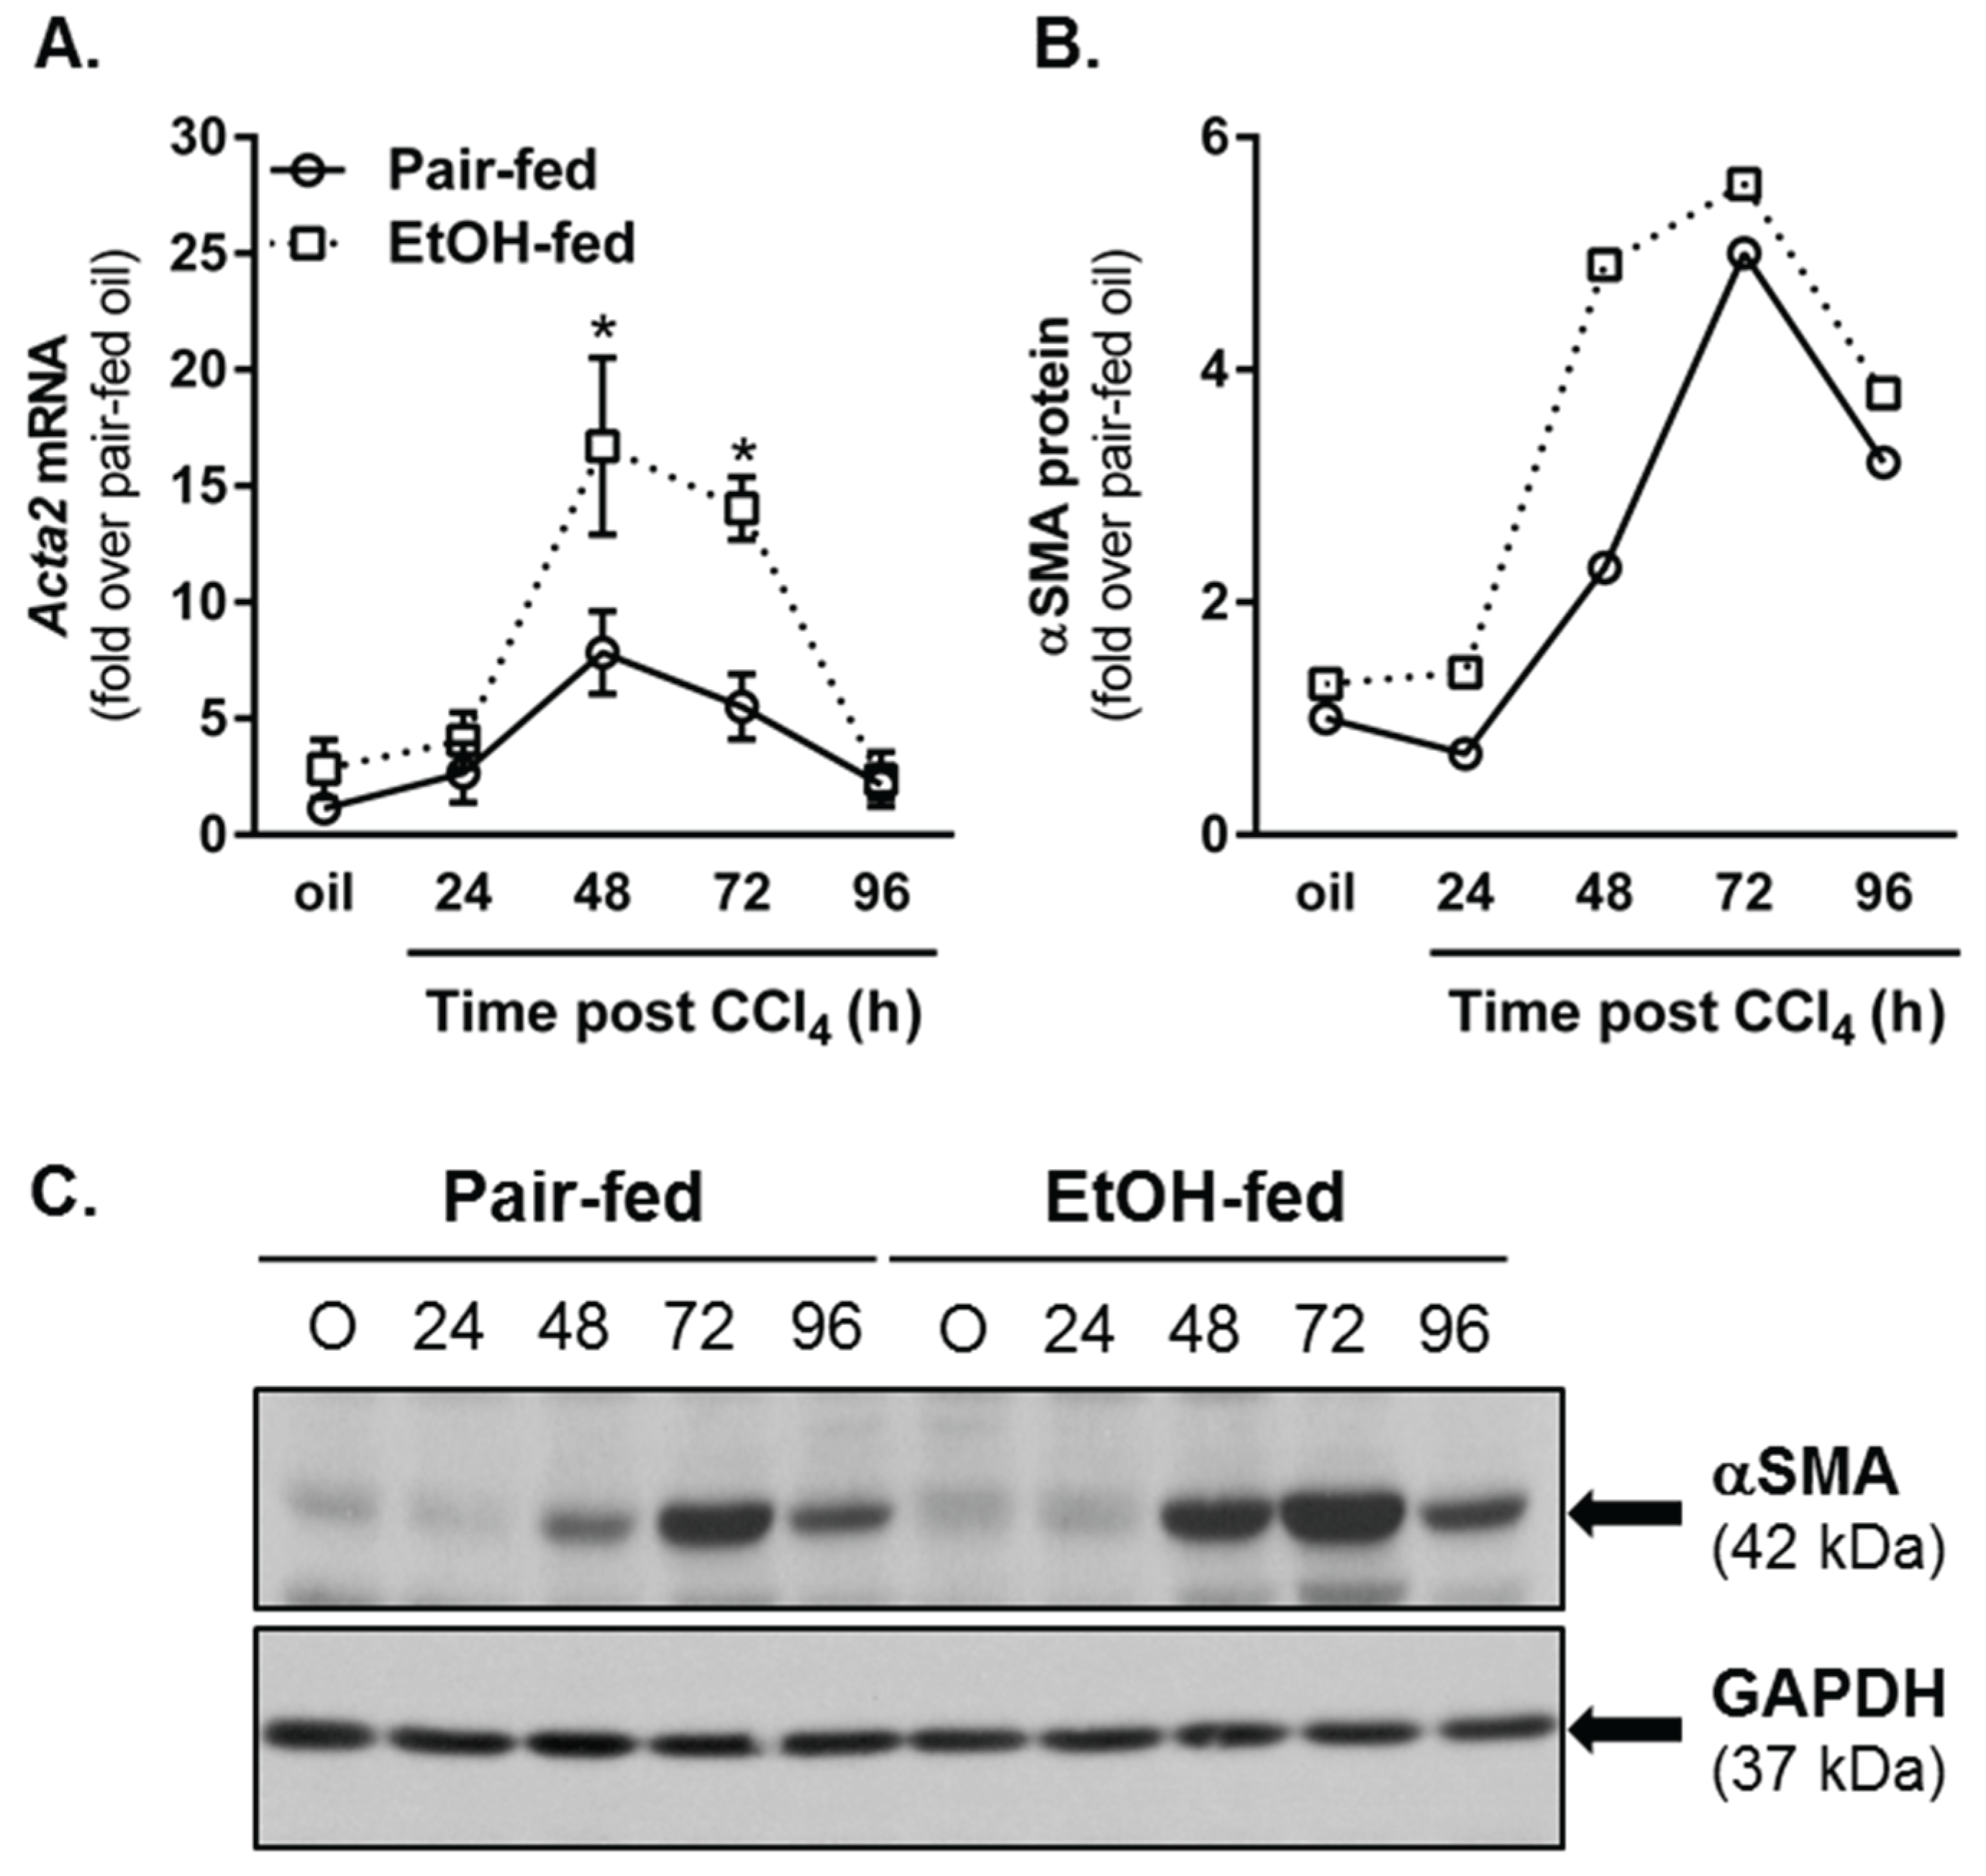
2.4.1. Hepatic Stellate Cell (HSC) Activation

The later stages of wound healing after tissue injury involve activation of resident fibroblast populations, production of extracellular matrix and matrix remodeling [4]. After liver injury induced by CCl4, hepatic stellate cells (HSC) are activated and transdifferentiate into matrix-synthesizing myofibroblasts [50]. HSC upregulate their expression of Acta2, the gene which encodes for α smooth muscle actin (αSMA), produce collagen and increase their expression of the collagen specific chaperone, heat shock protein (hsp)47 [50,51]. To determine whether or not moderate ethanol feeding to mice enhanced indices of HSC activation in our hands, we quantified Acta2 transcript and protein accumulation in livers from pair- and ethanol-fed mice. At 48 and 72 h after CCl4 exposure, hepatic αSMA was increased at the mRNA level in livers from both pair- and ethanol-fed mice, but was threefold greater in livers from ethanol-fed mice (Figure 10A). At the protein level, immunoblotting revealed a twofold increase in αSMA protein 48 h after CCl4 in livers from ethanol-fed mice; no differences between diet groups were observed at any other time point (Figure 10B,C). Consistently, hepatic transcripts for type I collagen (Col1a1) and Serpinh1 (the gene which encodes the hsp47 protein) were also increased by CCl4 exposure in both diet groups, but were increased further in livers harvested from ethanol-fed mice 72 h (Col1a1) or 48 and 72 h (Serpinh1) after CCl4 exposure. Therefore, similar to published work [8,10], CCl4-induced HSC activation and induction of markers associated with fibrogenesis were increased by moderate ethanol exposure relative to those increases observed in pair-fed mice.
Figure 10. Moderate ethanol feeding enhanced hepatic stellate cell (HSC) activation after acute CCl4 exposure. (A) Real time PCR was used to measure hepatic Acta2 transcript accumulation. Data are expressed as fold change over pair-fed, olive oil-exposed mice after normalization to 18S; (B) Semi-quantification of αSMA band density expressed as fold change of pair-fed, olive oil exposed mice after normalization to GAPDH as a loading control; (C) Representative αSMA immunoblot. Hepatic Col1a1 (D) and Serpinh1 (E) transcript accumulation were determined using real-time PCR. Data are expressed as fold change over pair-fed, olive oil-exposed mice after normalization to 18S. N = 4–8 mice per group. * p < 0.05.
Biomolecules 06 00005 g010aBiomolecules 06 00005 g010b

2.4.2. Matrix Remodeling

In addition to HSC activation and the production of ECM proteins, considerable matrix remodeling also occurs during the liver wound healing response. In the acutely injured liver, ECM degradation facilitates two things: (1) hepatocyte migration to the injured area required for liver regeneration and (2) remodeling of the ECM after liver regeneration is complete. Using in situ zymography, we observed matrix degradation 72 and 96 h after acute CCl4 exposure in pair- and ethanol-fed mice (Figure 11); there was no matrix degradation at 24 h after CCl4, and excessive background staining prevented quantification of matrix degradation at 48 h. While there was a trend toward an increase in matrix degradation in livers from ethanol-fed mice 72 h after CCl4, this was not significant. However, 96 h after CCl4 exposure, matrix degradation was increased relative to that in pair-fed mice. These data suggest that matrix remodeling is further enhanced by moderate ethanol feeding particularly late in the liver wound healing response. It is likely that this enhanced remodeling period is related to persistent necrotic tissue and prolonged regenerative response found in livers from ethanol-fed, CCl4-exposed mice (Figure 3). To determine if the response is prolonged and not just enhanced at 96 h, time points greater than 96 h would need to be evaluated.
Figure 11. Matrix metabolism was sustained by ethanol feeding to mice after acute CCl4 exposure. In situ zymography was used to determine area of gelatinase activity in frozen liver sections from pair- and ethanol-fed mice after CCl4 exposure. (A) Representative fluorescence microscopy images. The green fluorescence indicates area of gelatinase activity. The blue fluorescence (DAPI) was used as a nuclear counter stain. The asterisks denote location of central veins, while the plus sign (PF, 72 h only) denotes the location of a portal vein. Matrix metabolism occurs most robustly in the pericentral area where CCl4-induced liver injury and subsequent liver regeneration occurs; (B) Quantification of the area of fluorescence per 200× image as a fold change over pair-fed, olive oil-treated mice. PF = Pair-fed, EF = Ethanol-fed. N = 3–6 mice per group (CCl4). * (in B), p < 0.05.
Biomolecules 06 00005 g011

3. Experimental Section

3.1. Reagents

Primary antibodies used include: Cytochrome P450 2E1 (CYP2E1, AbCam, Cambridge, MA, USA, polyclonal antibody), and GAPDH (Cell Signaling, Beverly, MA, USA, clone 14C10), cyclin D1 (Cell Signaling, clone 92g2), cyclin E1 (Cell Signaling, clone HE12), cyclin A2 (Cell Signaling, clone BF683), cyclin B1 (Cell Signaling, clone v152), phospho-retinoblastoma on Ser 780 (phospho-Rb, Cell Signaling, clone D59B7), Ki67 (Abcam, polyclonal antibody), α smooth muscle actin (αSMA, AbCam, polyclonal antibody). Appropriate horseradish peroxidase (HRP)-conjugated secondary antibodies (Abcam) or fluorochrome-conjugated secondary antibodies (Ki67 only, Invitrogen, Grand Island, NY, USA) were used as detection reagents. Olive oil and carbon tetrachloride (CCl4) were purchased from Sigma-Aldrich (St. Louis, MO, USA), Buprenex analgesic (buprenorphine HCl) was manufactured by Reckitt Benckiser Healthcare (UK), Ltd., Hull England, UK, and distributed by Reckitt Benckiser Pharmaceuticals, Inc., Richmond, VA, USA.

3.2. Animal Care

Animals were treated humanely and in accordance with protocols approved by Case Western Reserve University’s (CASE) and University of Kansas Medical Center’s (KUMC) respective Institutional Animal Care and Use Committees. Both Institutions were AAALAC accredited. Female, wild-type (C57BL/6J) mice (10–12 weeks old) were purchased from Jackson Labs (Bar Harbor, ME, USA) and were allowed to acclimate to their new environments for 48 h, in ventilated cages with a 10/14 hour light/dark cycle with access to standard mouse chow and water ad libitum. For experimental procedures, mice were housed in static (CASE) or ventilated (KUMC) cages designed for use with toxic agents as required by each University’s animal care and use program and environmental health and safety offices.

3.3. Ethanol Feeding

Mice were housed two per cage and were acclimated to a nutritionally-complete, Lieber-DeCarli liquid diet (Dyets, Bethlehem, PA, USA, cat# 710260) for 2 days, after which half of the mice received a diet containing 1% ethanol for 2 days (2d), then 2% ethanol for the remainder of the experiment. Mice ate an average of 13.1 mL of the 2% ethanol-containing diet per day. Plasma ethanol levels are undetectable when measured 3 h into the dark/feeding period [30]. Control mice were pair-fed an isocaloric diet where ethanol calories were substituted by calories from maltose dextrin for the entire experiment. Pair-fed animals received the volume of diet consumed by their ethanol-fed experimental counterparts on the previous day to ensure equivalent calories were consumed between groups. There was no difference in final body weight between pair and ethanol-fed mice at each time point after CCl4 when mice were euthanized (Table 1).

3.4. Carbon Tetrachloride Exposure, Tissue Collection and Storage

After receiving 2% ethanol for 2 d, or control liquid diets, mice were given a single intraperitoneal (i.p.) injection of CCl4 (1 µL/g body weight) prediluted 1:3 in olive oil using 100 µL Hamilton syringes. Subcutaneous administration of an analgesic (Buprenex) preceded each CCl4 injection by 10 min, as done previously [52]. Control mice received analgesic and an olive oil injection and were euthanized 72 h later as done previously (refs). At 24, 48, 72 or 96 h post CCl4, mice were anesthetized using a cocktail of ketamine, xylazine and acepromazine. Blood was collected from the inferior vena cava into EDTA and aprotinin-containing tubes and placed on ice. After blood was collected, the diaphragm, superior vena cava and aorta were cut euthanizing the mouse. After euthanasia, a hepatectomy was performed. The liver was divided into several pieces while resting on an ice-cold piece of glass: the small half of the median lobe was cut into 3 pieces and placed into 2 mL tubes with 1.5 mL of RNA later, stored on the bench for 5 min, then at 4 °C for 18 h and then transferred to −20 °C until use. The large half of the median lobe was embedded in Optimal Cutting Temperature medium and frozen on a bed of frozen isopentane and then stored at −80 °C. The largest lobe of the liver (left lobe) was cut into several slices some of which were used for Western blot analysis (snap frozen in liquid nitrogen, stored at −80 °C) or fixed in formalin and later embedded in paraffin for histological and immunohistochemical analysis. The right lobe was snap frozen in liquid nitrogen and then stored at −80 °C for triglyceride quantification. All remaining liver tissue is snap frozen and archived at −80 °C; CYP2E1 activity assays were performed using one of these archived liver pieces. Blood was centrifuged at 10,000× g for 3.5 min. Plasma was collected and separated into two aliquots and frozen at −80 °C until use.
The table below contains initial and final body weights, liver weights and liver weight as a percentage of body weight.

3.5. CYP2E1 Activity Assay

Liver microsomes were prepared by homogenizing 100–150 mg of frozen liver tissue in 1 mL PBS with a loose fitting dounce homogenizer. After separation and removal of fat, 10 mL of PBS was added and the homogenate was ultracentrifuged at 105,000× g for 1 h at 4 °C. The pellet was resuspended in 0.15 M KCl and total protein concentration determined by BCA assay (Life Techologies/Pierce, Grand Island, NY, USA). Thirty micrograms of protein was added to 4 μL of 10 mM p-nitrophenol, 10 μL phosphate buffer (4 mL, 1 M K2HPO4 + 1 mL, 1 M KH2PO4 pH 7.4) and water was added to 100 μL. Ten microliters of freshly prepared NADPH (10 nM) was then added and the samples were incubated at 37 °C in a water bath for 1 h. Following incubation, 30 μL of 20% trichloroacetic acid was added, samples were vortexed, then centrifuged 10,000× g for 10 min. One hundred microliters of supernatant was added to 10 μL of 10 N NaOH and absorbance was determined at 510 nm. CYP2E1 activity was calculated using the extinction coefficient of 9.53 × 10⁵ M−1 cm−1, normalized to protein concentration and expressed as fold change over wild-type, oil-exposed mice.

3.6. Liver Injury and Steatosis Determination

Plasma alanine aminotransferase (ALT) activity was determined using a commercially available enzymatic assay (Sekisui Diagnostics, Exton, PA, USA) according to the manufacturer’s instructions. Activity was calculated using the extinction coefficient method. For triglyceride measurement, livers were digested with 3 M KOH in 65% ethanol for 1 h at 70 °C and vortexed every 20 min. Twenty-four hours later, triglyceride GPO reagent (Pointe Scientific, Canton, MI, USA) and a standard curve created using a GPO standard, were used to calculate total hepatic triglyceride content after absorbance readings at 500 nm were measured.

3.7. Histopathologic Analysis

Blinded histological assessment was performed by a board-certified pathologist. Hematoxylin and eosin (H&E)-stained liver sections were examined using a light microscope (Olympus BX-41, Olympus, Waltham, MA, USA); the following characteristics were evaluated: estimated percent necrosis, zone in which necrosis was present, estimated percent steatosis, and the presence, location and severity of inflammation.

3.8. RNA Isolation, cDNA Synthesis and Real-Time Polymerase Chain Reaction (PCR)

Total RNA was isolated from RNALater stabilized liver pieces (20–30 mg) using the Qiagen RNeasy Mini Kit (Valencia, CA, USA) after homogenization using the MP Biomedicals Fast Prep 24 bead homogenizer with lysing matrix D homogenization tubes (Solon, OH, USA). Four micrograms of RNA was reverse transcribed into cDNA using the Retroscript kit (Life Technologyies/Ambion, Grand Island, NY, USA). SYBR green (Universal Super Mix, BioRad, Hercules, CA, USA) was used for real-time PCR performed in a BioRad CFX384. Results were calculated using 2−ΔΔCt method. The data were expressed as fold change over pair-fed, olive oil-treated mice. Primers utilized in this study are found in Table 2; 18S was used as the housekeeping gene and did not differ between genotypes or time points after CCl4. Sequence sources are noted in the table, most of which were obtained from the PrimerBank [53,54,55].
Table 2. Primers used for real-time PCR transcript analysis.
Gene NameSequence SourceForward PrimerReverse Primer
Tnf[13]CCCTCACACTCAGATCATCTTCTGCTACGACGTGGGCTACAG
Emr1PrimerBank: 183583543b1CTGCACCTGTAAACGAGGCTTTTGAAAGTTGGTTTGTCCATTGC
Ly6cPrimerBank: 26353880a1GCAGTGCTACGAGTGCTATGGACTGACGGGTCTTTAGTTTCCTT
Ccnd1[52]CAGAAGTGCGAAGAGGAGGTCTCATCTTAGAGGCCACGAACAT
Ccne1PrimerBank: 6671698a1GTGGCTCCGACCTTTCAGTCCACAGTCTTGTCAATCTTGGCA
Ccna2PrimerBank: 161353443c2GCCTTCACCATTCATGTGGATTTGCTGCGGGTAAAGAGACAG
Ccnb1PrimerBank: 28195398a1AAGGTGCCTGTGTGTGAACCGTCAGCCCCATCATCTGCG
Acta2PrimerBank: 31982518b1CCCAGACATCAGGGAGTAATGGTCTATCGGATACTTCAGCGTCA
Col1a1[56]CAAGAACAGCAACGAGTACCGGTCACTGGTCAACTCCAGCAC
Serpinh1PrimerBank: 6753304a1GCCGAGGTGAAGAAACCCCCATCGCCTGATATAGGCTGAAG

3.9. TNFα Enzyme-Linked Immunosorbent (ELISA) Assay

TNFα peptide levels were determined from plasma samples collected from pair- and ethanol-fed mice at baseline (oil), 24, 48, 72 and 96 h after CCl4 exposure using and ELISA (R&D Systems, Minneapolis, MN, USA) according to the manufacturer’s instructions.

3.10. Terminal Deoxynucleotidyl Transferase-Mediate dUTP Nick End Labeling (TUNEL) Assay Procedure, Image Acquisition and Data Collection

Apoptotic hepatic DNA fragmentation was detected by TUNEL using the ApopTag Plus fluorescence in situ apoptosis detection kit (Millipore, Temecula, CA, USA) according to manufacturer’s instructions. The fluorescence was quantified as described earlier [52].

3.11. Immunoblotting

Liver lysates were prepared as described [52]. Samples were resolved on 10% SDS-PAGE gels after which total protein was transferred to PVDF membranes, blocked in 5% non-fat dry milk and then probed for proteins of interest overnight at 4 °C with agitation. HRP-conjugated secondary antibodies were used, and after an Enhanced Chemiluminescent substrate (GE Healthcare, Piscataway, NJ, USA) was applied to the membranes, luminescence was captured using radiographic film. Quantification of band density was achieved using ImageJ (National Institutes of Health, Bethesda, MD, USA). Data were normalized to a housekeeping gene (GAPDH) and data were expressed as fold change over pair-fed mice exposed to olive oil.

3.12. Ki67 Immunofluorescence Assay, Image Acquisition and Data Collection

Frozen sections (5 μm) were cut and fixed with 10% buffered formaldehyde for 10 min at room temperature (RT). All sections were treated with 0.1% Triton X-100 in PBS for 15 min at room temperature, washed three times for 2 min each in PBS, and incubated for a further 1 h with 10% normal donkey serum (Jackson ImmunoResearch Laboratories, Inc., West Grove, PA, USA) as a blocking agent. After incubation, the Ki67 polyclonal antibody solution (1:500 in 1% donkey serum) was applied to tissue sections overnight at 4 °C. The next day, the sections were washed and incubated with a fluorochrome-conjugated donkey-anti-rabbit secondary antibody (1:500, Invitrogen) for 1 h at RT. Nuclei were counterstained with 4,6-diamino-2-phenylindone (DAPI). An Olympus BX51 microscope with an Olympus BH2RFLT3 burner, Olympus DP71 camera and DP Controller software were used to capture 3 non-overlapping images from each tissue section at 200× magnification. The camera settings were chosen to minimize autofluorescence but maintain positive signal. Those settings were used for each image acquired. ImageJ was used to quantify the number of Ki67-positive hepatocyte nuclei (determined based on cell and nuclear morphology) by a blinded individual. Data were expressed as number of Ki67 positive hepatocyte nuclei per 200× image.

3.13. Mitotic Figure Quantification

Formalin-fixed, paraffin-embedded sections were cut (5 µM) and stained with hematoxylin and eosin (H&E). Micrographs were taken at 200× magnification using an Olympus BX51 microscope fitted with an Olympus DP71 camera. DP Controller software were used to acquire images (Olympus, Waltham, MA, USA). Four non-overlapping images per liver section were acquired, each of which contained a portal triad, as this is the area where mitotic figures were found. Mitotic index was determined by counting the number of mitotic figures (any mitosis stage) in each image by a blinded individual.

3.14. In Situ Zymography, Image Acquisition and Data Collection

Frozen tissue sections (7 μm) were taken from −80 °C and immediately incubated with developing buffer (100 mM Tris, pH 7.4, 100 mM NaCl, 5 mM CaCl2, 0.05% Brij-35, 0.25 mM PMSF) containing 0.1 mg/mL Oregon green, dye quenched (DQ) gelatin (Life Technologies/Molecular probes, Grand Island, NY, USA). The slides were incubated in a humid chamber at 37 °C for 16–18 h. After this incubation, a DAPI-containing solution was used as a nuclear counterstain and aqueous mounting medium. An Olympus BX51 microscope with an Olympus BH2RFLT3 burner, Olympus DP71 camera and DP Controller software were used to capture 3 non-overlapping images from each tissue section at 200× magnification. The camera settings were chosen to minimize autofluorescence but not lose positive signal. Those settings were used for each image. ImageJ was used to quantify area of the fluorescent signal generated by matrix metabolism.

3.15. Statistics

All results are presented as means ± SEM. Statistical significance was defined as p ≤ 0.05 and denoted with *. Students t-test was used when comparing two datasets and ANOVA with a Tukey’s adjustment for multiple comparisons was used when comparing time course data.

4. Conclusions

This study evaluated the impact of moderate ethanol feeding on some parameters associated with each phase of the liver wound healing response induced by acute CCl4 exposure. Our data suggest that suppression of inflammation early in the wound healing response precipitated expansion of liver injury. Expansion of liver injury was independent of CCl4-induced hepatocyte necrosis, but dependent on hepatocyte apoptosis. Given published studies, which demonstrate TNFα protects hepatocytes from apoptosis [11,12,13], we postulate that reduced TNFα in livers from ethanol-fed mice contributed to increased hepatocyte apoptosis. Perhaps as a compensatory response to the increased hepatocyte loss, the proliferative and matrix remodeling phases of the hepatic wound healing response in ethanol-fed mice were prolonged relative to that found in pair-fed mice after CCl4 exposure (Figure 12). These data help fill some gaps in our knowledge of how moderate ethanol affects wound healing after liver injury. In addition, our study suggests that moderate ethanol (two drinks per day), though considered beneficial in otherwise healthy individuals [57,58,59], can accelerate liver damage and fibrogenic changes in the liver after exposure to hepatotoxic agents, i.e., in industrial or agricultural settings. While this may appear beneficial in the context of acute liver injury as an appropriate response, long term exposure to hepatotoxic agents in individuals who regularly consume moderate amounts of ethanol may be more likely to progress to fibrosis, cirrhosis or hepatocellular carcinoma than those who abstain from drinking alcohol.
Figure 12. Effect of moderate ethanol feeding to mice on the liver wound healing response after acute hepatotoxin exposure. In (A), three phases of wound healing, inflammation (black dotted line), cell proliferation (red dotted line) and HSC activation, matrix synthesis and remodeling (blue dotted line) are depicted as overlapping curves which peak at 100% of normal response after acute CCl4; In (B), the effect of moderate ethanol on these three phases of wound healing after acute CCl4 exposure are depicted. The arrows added to the graph indicate that ethanol decreased (black downward arrow), prolonged (red right arrow) or enhanced (blue upward arrow) the related phase of the wound healing response. In brief, the data contained in this study demonstrated that early after CCl4-induced acute liver injury, inflammation is reduced in ethanol-fed mice relative to pair-fed mice. Reduced inflammation was associated with increased hepatocyte apoptosis (yellow “apoptosis” star), which occurred in parallel with a prolonged hepatocyte proliferative response. Moreover, indices of HSC activation were enhanced (peak values greater) in ethanol-fed mice. Finally, matrix degradation was prolonged in livers from ethanol-fed mice. Question marks indicate that more data is required to determine whether or not the ethanol-mediated effect, enhancement or prolongation, occurs in that phase of the wound healing response. We propose that reduction in TNFα, a surrogate marker for hepatoprotective inflammation, in ethanol-fed mice was responsible for increased apoptotic hepatocyte death and, therefore, the need for more robust hepatocyte proliferation, ECM synthesis and remodeling after CCl4-induced acute liver injury.
Biomolecules 06 00005 g012

Acknowledgments

This work was supported by funding from the Cleveland Foundation and grants from the National Institutes of Health, National Center for Research Resources (P20 RR021940 to Michele T. Pritchard), National Institute of General Medical Sciences (P20 GM103549 to Michele T. Pritchard), National Institute of Environmental Health Sciences “Training Program in Environmental Toxicology” (T32 ES007079 to Jennifer M. McCracken), and the National Institutes of Alcohol Abuse and Alcoholism (K99 AA017918A and R00 AA17918 to Michele T. Pritchard).
Special thanks to the University of Kansas Medical Center’s Laboratory Animal Resources Department for excellent animal husbandry, veterinary care, training and other assistance.

Author Contributions

Krutika T. Deshpande, Shinlan Liu and Michele T. Pritchard designed and performed experiments. Jennifer M. McCracken, Lu Jiang, Ta Ehpaw Gaw, Lindsey N. Kaydo and Zachary C. Richard performed experiments. Jennifer M. McCracken and Michele T. Pritchard performed statistics. Maura F. O’Neil performed the histopathological analysis. Michele T. Pritchard conceptualized the study, evaluated all data, interpreted results and wrote the manuscript. Krutika T. Deshpande, Jennifer M. McCracken and Michele T. Pritchard edited the manuscript.

Conflicts of Interest

The authors declare no conflict of interest.

References

  1. Bataller, R.; Rombouts, K.; Altamirano, J.; Marra, F. Fibrosis in alcoholic and nonalcoholic steatohepatitis. Best Prac. Res. Clin. Gastroenterol. 2011, 25, 231–244. [Google Scholar] [CrossRef] [PubMed]
  2. Gao, B.; Bataller, R. Alcoholic liver disease: Pathogenesis and new therapeutic targets. Gastroenterology 2011, 141, 1572–1585. [Google Scholar] [CrossRef] [PubMed]
  3. Schuppan, D.; Kim, Y.O. Evolving therapies for liver fibrosis. J. Clin. Investig. 2013, 123, 1887–1901. [Google Scholar] [CrossRef] [PubMed]
  4. Diegelmann, R.F.; Evans, M.C. Wound healing: An overview of acute, fibrotic and delayed healing. Front. Biosci. 2004, 9, 283–289. [Google Scholar] [CrossRef] [PubMed]
  5. Brem, H.; Tomic-Canic, M. Cellular and molecular basis of wound healing in diabetes. J. Clin. Investig. 2007, 117, 1219–1222. [Google Scholar] [CrossRef] [PubMed]
  6. Mathews, S.; Xu, M.; Wang, H.; Bertola, A.; Gao, B. Animals models of gastrointestinal and liver diseases. Animal models of alcohol-induced liver disease: Pathophysiology, translational relevance, and challenges. Am. J. Physiol. Gastrointest. Liver Physiol. 2014, 306, G819–G823. [Google Scholar] [CrossRef] [PubMed]
  7. Jeong, W.I.; Park, O.; Gao, B. Abrogation of the antifibrotic effects of natural killer cells/interferon-γ contributes to alcohol acceleration of liver fibrosis. Gastroenterology 2008, 134, 248–258. [Google Scholar] [CrossRef] [PubMed]
  8. Chiang, D.J.; Roychowdhury, S.; Bush, K.; McMullen, M.R.; Pisano, S.; Niese, K.; Olman, M.A.; Pritchard, M.T.; Nagy, L.E. Adenosine 2A receptor antagonist prevented and reversed liver fibrosis in a mouse model of ethanol-exacerbated liver fibrosis. PLoS ONE 2013, 8, e69114. [Google Scholar] [CrossRef] [PubMed]
  9. Roychowdhury, S.; Chiang, D.J.; McMullen, M.R.; Nagy, L.E. Moderate, chronic ethanol feeding exacerbates carbon-tetrachloride-induced hepatic fibrosis via hepatocyte-specific hypoxia inducible factor 1α. Pharmacol. Res. Perspect 2014, 2. [Google Scholar] [CrossRef] [PubMed]
  10. Roychowdhury, S.; Chiang, D.J.; Mandal, P.; McMullen, M.R.; Liu, X.; Cohen, J.I.; Pollard, J.; Feldstein, A.E.; Nagy, L.E. Inhibition of apoptosis protects mice from ethanol-mediated acceleration of early markers of CCl4-induced fibrosis but not steatosis or inflammation. Alcohol. Clin. Exp. Res. 2012, 36, 1139–1147. [Google Scholar] [CrossRef] [PubMed]
  11. Teoh, N.; Leclercq, I.; Pena, A.D.; Farrell, G. Low-dose TNF-α protects against hepatic ischemia-reperfusion injury in mice: Implications for preconditioning. Hepatology 2003, 37, 118–128. [Google Scholar] [CrossRef] [PubMed]
  12. Teoh, N.C.; Farrell, G.C. Hepatic ischemia reperfusion injury: Pathogenic mechanisms and basis for hepatoprotection. J. Gastroenterol. Hepatol. 2003, 18, 891–902. [Google Scholar] [CrossRef] [PubMed]
  13. Pritchard, M.T.; Cohen, J.I.; Roychowdhury, S.; Pratt, B.T.; Nagy, L.E. Early growth response-1 attenuates liver injury and promotes hepatoprotection after carbon tetrachloride exposure in mice. J. Hepatol. 2010, 53, 655–662. [Google Scholar] [CrossRef] [PubMed]
  14. Webber, E.M.; Bruix, J.; Pierce, R.H.; Fausto, N. Tumor necrosis factor primes hepatocytes for DNA replication in the rat. Hepatology 1998, 28, 1226–1234. [Google Scholar] [CrossRef] [PubMed]
  15. Yamada, Y.; Fausto, N. Deficient liver regeneration after carbon tetrachloride injury in mice lacking type 1 but not type 2 tumor necrosis factor receptor. Am. J. Pathol. 1998, 152, 1577–1589. [Google Scholar] [PubMed]
  16. Yamada, Y.; Kirillova, I.; Peschon, J.J.; Fausto, N. Initiation of liver growth by tumor necrosis factor: Deficient liver regeneration in mice lacking type I tumor necrosis factor receptor. Proc. Natl. Acad. Sci. USA 1997, 94, 1441–1446. [Google Scholar] [CrossRef] [PubMed]
  17. Yamada, Y.; Webber, E.M.; Kirillova, I.; Peschon, J.J.; Fausto, N. Analysis of liver regeneration in mice lacking type 1 or type 2 tumor necrosis factor receptor: Requirement for type 1 but not type 2 receptor. Hepatology 1998, 28, 959–970. [Google Scholar] [CrossRef] [PubMed]
  18. Wong, F.W.; Chan, W.Y.; Lee, S.S. Resistance to carbon tetrachloride-induced hepatotoxicity in mice which lack CYP2E1 expression. Toxicol. Appl. Pharmacol. 1998, 153, 109–118. [Google Scholar] [CrossRef] [PubMed]
  19. Weber, L.W.; Boll, M.; Stampfl, A. Hepatotoxicity and mechanism of action of haloalkanes: Carbon tetrachloride as a toxicological model. Crit. Rev. Toxicol. 2003, 33, 105–136. [Google Scholar] [CrossRef] [PubMed]
  20. Lindros, K.O. Zonation of cytochrome p450 expression, drug metabolism and toxicity in liver. Gen. Pharmacol. 1997, 28, 191–196. [Google Scholar] [CrossRef]
  21. Mehendale, H.M. Tissue repair: An important determinant of final outcome of toxicant-induced injury. Toxicol. Pathol. 2005, 33, 41–51. [Google Scholar] [CrossRef] [PubMed]
  22. Mehendale, H.M. Once initiated, how does toxic tissue injury expand? Trends Pharmacol. Sci. 2012, 33, 200–206. [Google Scholar] [CrossRef] [PubMed]
  23. Shi, J.; Aisaki, K.; Ikawa, Y.; Wake, K. Evidence of hepatocyte apoptosis in rat liver after the administration of carbon tetrachloride. Am. J. Pathol. 1998, 153, 515–525. [Google Scholar] [CrossRef]
  24. Cederbaum, A.I.; Lu, Y.; Wu, D. Role of oxidative stress in alcohol-induced liver injury. Arch. Toxicol. 2009, 83, 519–548. [Google Scholar] [CrossRef] [PubMed]
  25. Lu, Y.; Cederbaum, A.I. CYP2E1 and oxidative liver injury by alcohol. Free Radical Biol. Med. 2008, 44, 723–738. [Google Scholar] [CrossRef] [PubMed]
  26. Kenney, F.T.; Pomato, N.; Lee, K.L. Mechanisms in intracellular turnover of stable and labile enzymes. In Protein Turnover and Lysosome Function; Segal, H.L., Doyle, D.J., Eds.; Academic Press, Inc: New York, NY, USA, 1978; pp. 197–213. [Google Scholar]
  27. Eming, S.A.; Krieg, T.; Davidson, J.M. Inflammation in wound repair: Molecular and cellular mechanisms. J. Investig. Dermatol. 2007, 127, 514–525. [Google Scholar] [CrossRef] [PubMed]
  28. Prosser, C.C.; Yen, R.D.; Wu, J. Molecular therapy for hepatic injury and fibrosis: Where are we? World J. Gastroenterol. 2006, 12, 509–515. [Google Scholar] [PubMed]
  29. Taub, R. Liver regeneration: From myth to mechanism. Nat. Rev. 2004, 5, 836–847. [Google Scholar] [CrossRef] [PubMed]
  30. Roychowdhury, S.; McMullen, M.R.; Pritchard, M.T.; Hise, A.G.; van Rooijen, N.; Medof, M.E.; Stavitsky, A.B.; Nagy, L.E. An early complement-dependent and TLR-4-independent phase in the pathogenesis of ethanol-induced liver injury in mice. Hepatology 2009, 49, 1326–1334. [Google Scholar] [CrossRef] [PubMed]
  31. Epelman, S.; Lavine, K.J.; Randolph, G.J. Origin and functions of tissue macrophages. Immunity 2014, 41, 21–35. [Google Scholar] [CrossRef] [PubMed]
  32. Tacke, F.; Zimmermann, H.W. Macrophage heterogeneity in liver injury and fibrosis. J. Hepatol. 2014, 60, 1090–1096. [Google Scholar] [CrossRef] [PubMed]
  33. Ramachandran, P.; Iredale, J.P. Macrophages: Central regulators of hepatic fibrogenesis and fibrosis resolution. J. Hepatol. 2012, 56, 1417–1419. [Google Scholar] [CrossRef] [PubMed]
  34. Sica, A.; Invernizzi, P.; Mantovani, A. Macrophage plasticity and polarization in liver homeostasis and pathology. Hepatology 2014, 59, 2034–2042. [Google Scholar] [CrossRef] [PubMed]
  35. Viebahn, C.S.; Yeoh, G.C. What fires prometheus? The link between inflammation and regeneration following chronic liver injury. Int. J. Biochem. Cell Biol. 2008, 40, 855–873. [Google Scholar] [CrossRef] [PubMed]
  36. Strey, C.W.; Markiewski, M.; Mastellos, D.; Tudoran, R.; Spruce, L.A.; Greenbaum, L.E.; Lambris, J.D. The proinflammatory mediators C3a and C5a are essential for liver regeneration. J. Exp. Med. 2003, 198, 913–923. [Google Scholar] [CrossRef] [PubMed]
  37. Cressman, D.E.; Greenbaum, L.E.; DeAngelis, R.A.; Ciliberto, G.; Furth, E.E.; Poli, V.; Taub, R. Liver failure and defective hepatocyte regeneration in interleukin-6-deficient mice. Science 1996, 274, 1379–1383. [Google Scholar] [CrossRef] [PubMed]
  38. Cornell, R.P.; Liljequist, B.L.; Bartizal, K.F. Depressed liver regeneration after partial hepatectomy of germ-free, athymic and lipopolysaccharide-resistant mice. Hepatology 1990, 11, 916–922. [Google Scholar] [CrossRef] [PubMed]
  39. Baldin, V.; Lukas, J.; Marcote, M.J.; Pagano, M.; Draetta, G. Cyclin D1 is a nuclear protein required for cell cycle progression in G1. Genes Dev. 1993, 7, 812–821. [Google Scholar] [CrossRef] [PubMed]
  40. Moroy, T.; Geisen, C. Cyclin E. Int. J. Biochem. Cell Biol. 2004, 36, 1424–1439. [Google Scholar] [CrossRef] [PubMed]
  41. Pines, J.; Hunter, T. Cyclins A and B1 in the human cell cycle. Ciba Found. Symp. 1992, 170, 187–196. [Google Scholar] [PubMed]
  42. Desdouets, C.; Sobczak-Thepot, J.; Murphy, M.; Brechot, C. Cyclin A: Function and expression during cell proliferation. Prog. Cell Cycle Res. 1995, 1, 115–123. [Google Scholar] [PubMed]
  43. Kishimoto, T.; Okumura, E. In vivo regulation of the entry into M-phase: Initial activation and nuclear translocation of cyclin B/Cdc2. Prog. Cell Cycle Res. 1997, 3, 241–249. [Google Scholar] [PubMed]
  44. Duronio, R.J.; Xiong, Y. Signaling pathways that control cell proliferation. Cold Spring Harb. Perspect. Biol. 2013. [Google Scholar] [CrossRef] [PubMed]
  45. Ding, X.; Beier, J.I.; Baldauf, K.J.; Jokinen, J.D.; Zhong, H.; Arteel, G.E. Acute ethanol preexposure promotes liver regeneration after partial hepatectomy in mice by activating ALDH2. Am. J. Physiol. Gastrointest. Liver Physiol. 2014, 306, G37–G47. [Google Scholar] [CrossRef] [PubMed]
  46. Apte, U.M.; McRee, R.; Ramaiah, S.K. Hepatocyte proliferation is the possible mechanism for the transient decrease in liver injury during steatosis stage of alcoholic liver disease. Toxicol. Pathol. 2004, 32, 567–576. [Google Scholar] [CrossRef] [PubMed]
  47. Wands, J.R.; Carter, E.A.; Bucher, N.L.; Isselbacher, K.J. Inhibition of hepatic regeneration in rats by acute and chronic ethanol intoxication. Gastroenterology 1979, 77, 528–531. [Google Scholar] [PubMed]
  48. Diehl, A.M.; Wells, M.; Brown, N.D.; Thorgeirsson, S.S.; Steer, C.J. Effect of ethanol on polyamine synthesis during liver regeneration in rats. J. Clin. Invest. 1990, 85, 385–390. [Google Scholar] [CrossRef] [PubMed]
  49. Koteish, A.; Yang, S.; Lin, H.; Huang, J.; Diehl, A.M. Ethanol induces redox-sensitive cell-cycle inhibitors and inhibits liver regeneration after partial hepatectomy. Alcohol. Clin. Exp. Res. 2002, 26, 1710–1718. [Google Scholar] [CrossRef] [PubMed]
  50. Friedman, S.L. Hepatic stellate cells: Protean, multifunctional, and enigmatic cells of the liver. Physiol. Rev. 2008, 88, 125–172. [Google Scholar] [CrossRef] [PubMed]
  51. Brown, K.E.; Broadhurst, K.A.; Mathahs, M.M.; Brunt, E.M.; Schmidt, W.N. Expression of HSP47, a collagen-specific chaperone, in normal and diseased human liver. Lab. Investig. J. Tech. Methods Pathol. 2005, 85, 789–797. [Google Scholar] [CrossRef] [PubMed]
  52. Pritchard, M.T.; Malinak, R.N.; Nagy, L.E. Early growth response (EGR)-1 is required for timely cell-cycle entry and progression in hepatocytes after acute carbon tetrachloride exposure in mice. Am. J. Physiol. Gastrointest. Liver Physiol. 2011, 300, G1124–G1131. [Google Scholar] [CrossRef] [PubMed]
  53. Wang, X.; Seed, B. A PCR primer bank for quantitative gene expression analysis. Nucl. Acids Res. 2003. [Google Scholar] [CrossRef]
  54. Spandidos, A.; Wang, X.; Wang, H.; Dragnev, S.; Thurber, T.; Seed, B. A comprehensive collection of experimentally validated primers for polymerase chain reaction quantitation of murine transcript abundance. BMC Genomics 2008. [Google Scholar] [CrossRef] [PubMed]
  55. Spandidos, A.; Wang, X.; Wang, H.; Seed, B. Primerbank: A resource of human and mouse PCR primer pairs for gene expression detection and quantification. Nucleic Acids Res. 2010, 38, D792–D799. [Google Scholar] [CrossRef] [PubMed]
  56. Pritchard, M.T.; Nagy, L.E. Hepatic fibrosis is enhanced and accompanied by robust oval cell activation after chronic carbon tetrachloride administration to Egr-1-deficient mice. Am. J. Pathol. 2010, 176, 2743–2752. [Google Scholar] [CrossRef] [PubMed]
  57. Nova, E.; Baccan, G.C.; Veses, A.; Zapatera, B.; Marcos, A. Potential health benefits of moderate alcohol consumption: Current perspectives in research. Proc. Nutr. Soc. 2012, 71, 307–315. [Google Scholar] [CrossRef] [PubMed]
  58. Collins, M.A.; Neafsey, E.J.; Mukamal, K.J.; Gray, M.O.; Parks, D.A.; Das, D.K.; Korthuis, R.J. Alcohol in moderation, cardioprotection, and neuroprotection: Epidemiological considerations and mechanistic studies. Alcohol. Clin. Exp. Res. 2009, 33, 206–219. [Google Scholar] [CrossRef] [PubMed]
  59. Calabrese, E.J.; Baldwin, L.A. Ethanol and hormesis. Crit. Rev. Toxicol. 2003, 33, 407–424. [Google Scholar] [CrossRef] [PubMed]

