
Comparative Degradation of a Thiazole Pollutant by an Advanced Oxidation Process and an Enzymatic Approach


Department of Chemistry, UAE University, P.O. Box 15551, Al-Ain, UAE
*
Author to whom correspondence should be addressed.
Biomolecules 2017, 7(3), 64; https://doi.org/10.3390/biom7030064
Submission received: 2 July 2017
/
Revised: 14 August 2017
/
Accepted: 22 August 2017
/
Published: 24 August 2017
Abstract
:Organic pollutants, especially those found in water bodies, pose a direct threat to various aquatic organisms as well as humans. A variety of different remediation approaches, including chemical and biological methods, have been developed for the degradation of various organic pollutants. However, comparative mechanistic studies of pollutant degradation by these different systems are almost non-existent. In this study, the degradation of a model thiazole pollutant, thioflavin T (ThT), was carried out in the presence of either an advanced oxidation process (ultraviolet (UV) + H2O2) or a chloroperoxidase enzyme system (CPO + H2O2). The degradation was followed both spectrophotometrically and using liquid chromatography-mass spectroscopy (LC-MS), and the products formed were identified using tandem liquid chromatography-mass spectrometry-mass spectrometry (LC-MS-MS). The results show that the two remediation approaches produced different sets of intermediates, with only one common species (a demethylated form of ThT). This suggests that different degradation schemes were operating in the two systems. Interestingly, one of the major intermediates produced by the CPO + H2O2 system was a chlorinated form of thioflavin. Phytotoxicity studies showed that the CPO + H2O2-treated ThT solution was significantly (p < 0.05) less toxic than the UV + H2O2-treated ThT solution. This is the first time that a comparative mechanistic study showing in detail the intermediates generated in chemical and biological remediation methods has been presented. Furthermore, the results show that different remediation systems have very different degradation schemes and result in products having different toxicities.
1. Introduction
Aromatic compounds are a major class of toxic and potentially carcinogenic organic pollutants that must be removed from effluents before they enter bodies of water [1,2,3]. Various physical, chemical, and biological approaches have been devised to deal with these contaminants. For example, adsorption, sedimentation, coagulation, membrane filtration, and use of cucurbiturils are all examples of physical processes that have been successfully used to remove various organic pollutants [4,5]. Some of the most commonly used chemical methods include ozonation, NaOCl treatment, and advanced oxidation processes (AOPs) [6,7].
Although physical and chemical methods enjoy wide-scale applicability and are currently used in various large-scale processes, they still face some significant limitations and challenges. The biggest downside of physico-chemical methods are the high costs involved as well as the sludge produced by the processes [4]. Greener alternatives, such as the use of micro-organisms or phytoremediation, are considered to be more environmentally friendly and have shown promising results for the removal of low concentrations of organic pollutants. Compared with traditional physico-chemical methods, bioremediation may be a safer, less disruptive, and more cost-effective treatment strategy. However, a fundamental shortcoming of bioremediation is that the organisms used for this purpose may be unable to thrive in adverse and unfavorable environmental conditions, as well as the potential inefficiency of the process [8,9].
Enzymatic bioremediation is an emerging method of supplementing bio-treatment techniques. The class of enzyme that is most commonly used for bioremediation purposes is the “oxidoreductase” class of enzymes, which includes oxygenases, monooxygenases, dioxygenases, laccases, and peroxidases. These enzymes carry out redox reactions on a relatively wide range of substrates, including polycyclic aromatic hydrocarbons (PAHs), polynitrated aromatic compounds, pesticides, bleach-plant effluents, synthetic dyes, polymers, and various emerging pollutants [10,11,12,13]. Within the oxidoreductase family of enzymes, peroxidases such as lignin peroxidase (LiP), manganese-dependent peroxidase (MnP), versatile peroxidase (VP), soybean peroxidase (SBP), and chloroperoxidase (CPO) have been extensively studied due to their high potential for the degradation of various organic compounds [12,14,15]. It has been postulated that these enzymes could oxidize organic compounds through the generation of reactive free radicals, leading to the formation of lower molecular weight compounds and eventually mineralizing the pollutant. It is worth mentioning that some of the potential shortcomings of using enzymes for large-scale bioremediation purposes are their relatively high costs as well as the lack of the reusability of the enzymes and their stabilities during the remediation processes. However, most of these issues can be ameliorated by employing molecular biology approaches for the microbial recombinant expression of wild-type as well as mutated forms of these enzymes, which can then be immobilized on various supports, such as beads or membranes, to increase their stabilities as well as reusability [16]. The fungus Caldariomyces fumago secretes heme-containing CPO, also known as chloride:hydrogen-peroxide oxidoreductase. In addition to catalyzing halogenation reactions, CPO also exhibits peroxidase, catalase, and cytochrome P450-like activities. Although CPO shares common features with other heme-containing enzymes, its structure is unique, being composed of a tertiary assembly consisting primarily of eight helical segments. Our research group and others have used this enzyme for the efficient and rapid degradation of various organic pollutants [17,18,19,20,21]. Although a tremendous amount of research has been published on the use of AOPs [22,23,24] and enzymatic [18,19,25,26] approaches to the degradation of organic pollutants, including some “combination approaches” [27,28,29,30,31], to date there have been no detailed studies published that compare the degradation of a specific organic compound by these two different methods. Many questions remain about the pollutant degradation pathways, the types of intermediates generated, and the residual toxicity of the pollutants when using these two very different methods. The ultraviolet (UV) + H2O2 AOP approach relies on the pollutant molecules reacting with the hydroxyl radicals generated upon the photolysis of H2O2, whereas the CPO enzyme method relies on the enzyme heme-iron oxyradical. Therefore, it is expected that there may be significant differences in the intermediates produced during the two processes.
The aim of present study was to compare the degradation of a thiazole compound (thioflavin T, ThT) when using the classical UV + H2O2 AOP method and the CPO + H2O2 based approach. ThT can prove to be a useful model for pollution remediation studies, as its thiazole core is a common feature in some of the important emerging pollutants, such as 2-mercaptobenzothiazole (a plasticizer/vulcanizing agent), Thiabendazole and Tricyclazole (fungicidal drugs), and Meloxicam, (a non-steroidal anti-inflammatory drug). Alarmingly, all of these and other thiazole derivatives have been detected in various aquatic environments [32,33]. Moreover, as ThT is a colored compound, colorimetric changes during degradation can be monitored easily and efficiently using spectrophotometry. This study also carried out an liquid chromatography-mass spectrometry-mass spectrometry (LC-MS-MS)-based investigation to allow for a comparison of the mechanistic degradation pathways of the two remediation methods. Finally, phytotoxicity analyses were carried out to measure the residual toxicity of ThT after treatment with the AOP and CPO-based systems.
2. Results and Discussion
2.1. Degradation of ThT by UV + H2O2
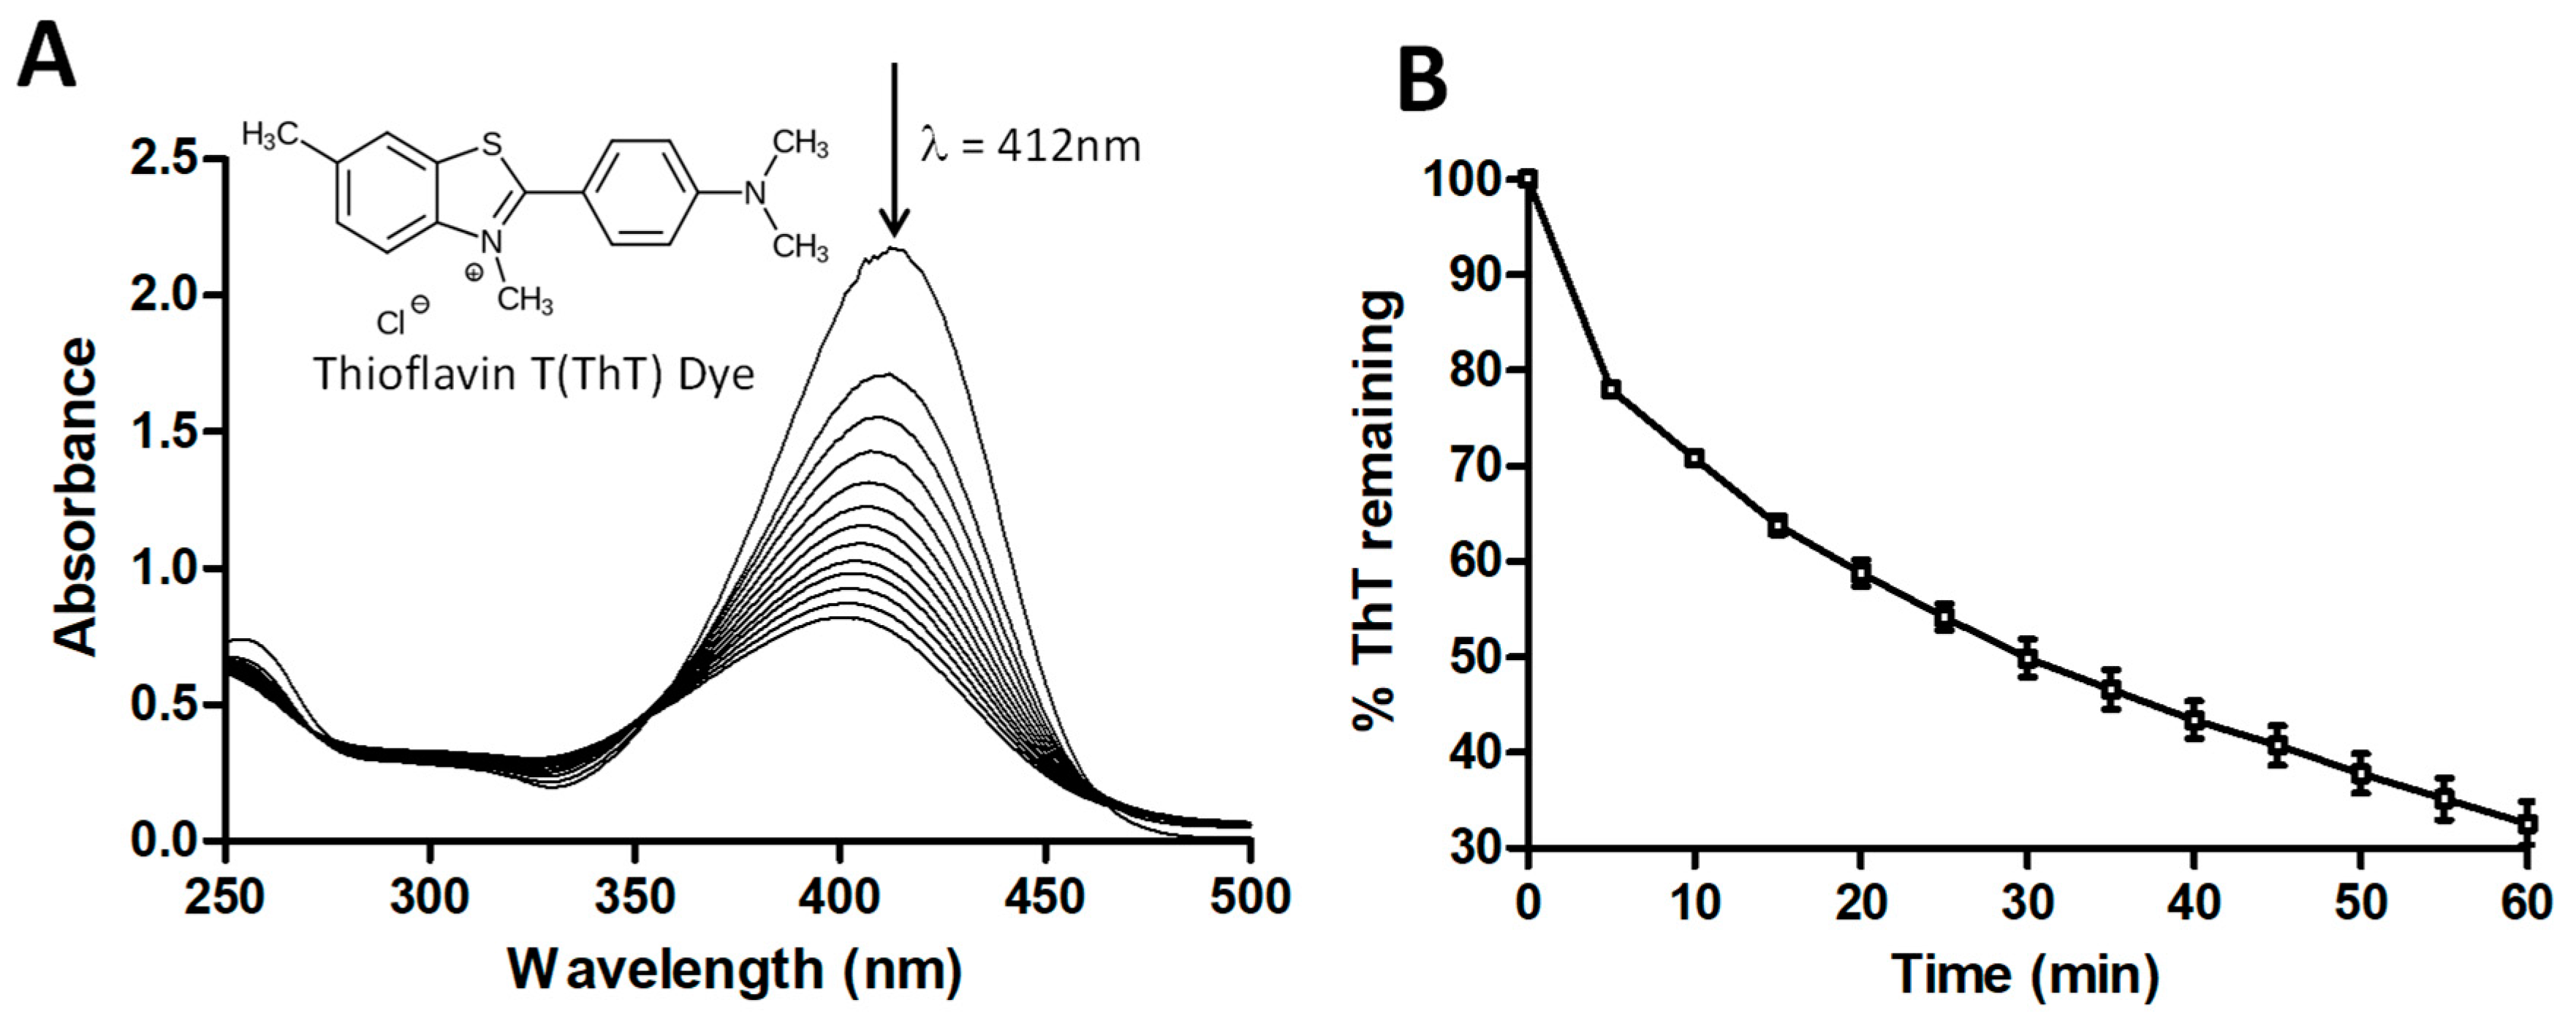
In the present work, we initially investigated the H2O2-assisted photochemical oxidation of ThT. Figure 1 shows the chemical structure as well as the absorption spectrum of ThT. Also shown is the major peak in the yellow visible region of the ThT absorption spectrum (λmax = 412 nm). The exposure of the ThT solution to UV + H2O2 caused an immediate and gradual decrease in the intensity of λmax, indicating that new compounds had formed. Figure 1B shows the degradation of λmax as a function of time, and it can be seen that about 70% of the compound had degraded after 60 min of this AOP treatment. No ThT degradation was observed in the presence of UV light or H2O2 alone. The degradation of ThT was attributed to the hydroxyl radicals (OH•) produced from H2O2 when exposed to UV radiation. Hydroxyl radicals are known to be strong oxidizing agents that can react with ThT molecules to produce intermediates that are responsible for decoloring/degradation of the original solution [34,35]. A simplified reaction scheme for this process is outlined below:
H2O2 + hv → 2 OH•
ThT + OH• → degraded products
2.2. Degradation of ThT by CPO + H2O2
In order to compare the UV + H2O2-induced degradation of ThT with an enzymatic approach, we used the well-known peroxidase CPO to degrade ThT.
Figure 2 shows the absorbance spectra of ThT when exposed to CPO + H2O2 as a function of time. As was seen for the UV + H2O2 degradation of ThT in Figure 1, the ThT started to degrade immediately upon exposure to CPO + H2O2, as evidenced by the decrease in the absorbance at 412 nm. Interestingly, as the peak at 412 nm decreased in intensity, a new peak with λmax = 350 nm appeared, with the intensity of this peak increasing over time. This is shown more clearly in Figure 2B. The increase in the absorbance this peak suggests that a new compound was being generated upon the treatment of ThT with CPO + H2O2, something that was not seen in the case of the UV + H2O2 treatment of ThT. This observation suggests that the UV + H2O2 and CPO + H2O2 processes likely have different effects on ThT.
2.3. Analysis of Product Formation Using LC-MS
Since the UV/Vis spectroscopic data for degradation of ThT by UV + H2O2 and CPO + H2O2 suggested that different degradative pathways might be operating in the two remediation methods, we wanted to confirm this using liquid chromatography-mass spectroscopy (LC-MS). Figure 3 shows the LC-MS chromatograms of ThT, ThT exposed to UV + H2O2, and ThT treated with CPO + H2O2. Additionally, the insets show the mass spectra of the major peaks in the three samples. The LC-MS analysis of the neat ThT dye shows a single major peak at a retention time of 16.11 min, with m/z = 283 (inset). This molecular weight (MW) is in agreement with the loss of the chloride counter ion from the molecular weight of the ThT dye (MW = 318.86 Da), which would be expected as the LC-MS system was operating in the positive mode. The LC-MS analysis of the ThT + UV + H2O2 sample shows a much smaller ThT peak (retention time = 16.11 min), which is consistent with the degradation of ThT. However, another major peak can also be seen at a retention time of 15.64 min. The mass spectrum of this new product peak (inset) shows it to have an m/z value of 269. In addition to this major product peak, several other smaller peaks can also be seen at the 14–16 min range. The LC-MS analysis of the ThT dye treated with CPO + H2O2 shows a very different LC profile, with the major peak having a retention time of 16.19 min. The mass spectrum of this peak shows it to have an m/z value of 317, indicating the presence of a compound that is very different from both the original ThT (m/z = 283) and the major intermediate produced during the UV/H2O2 AOP degradation of ThT (m/z = 269). In addition to this m/z = 317 peak, additional minor peaks can also be seen in the ThT + CPO + H2O2 sample.
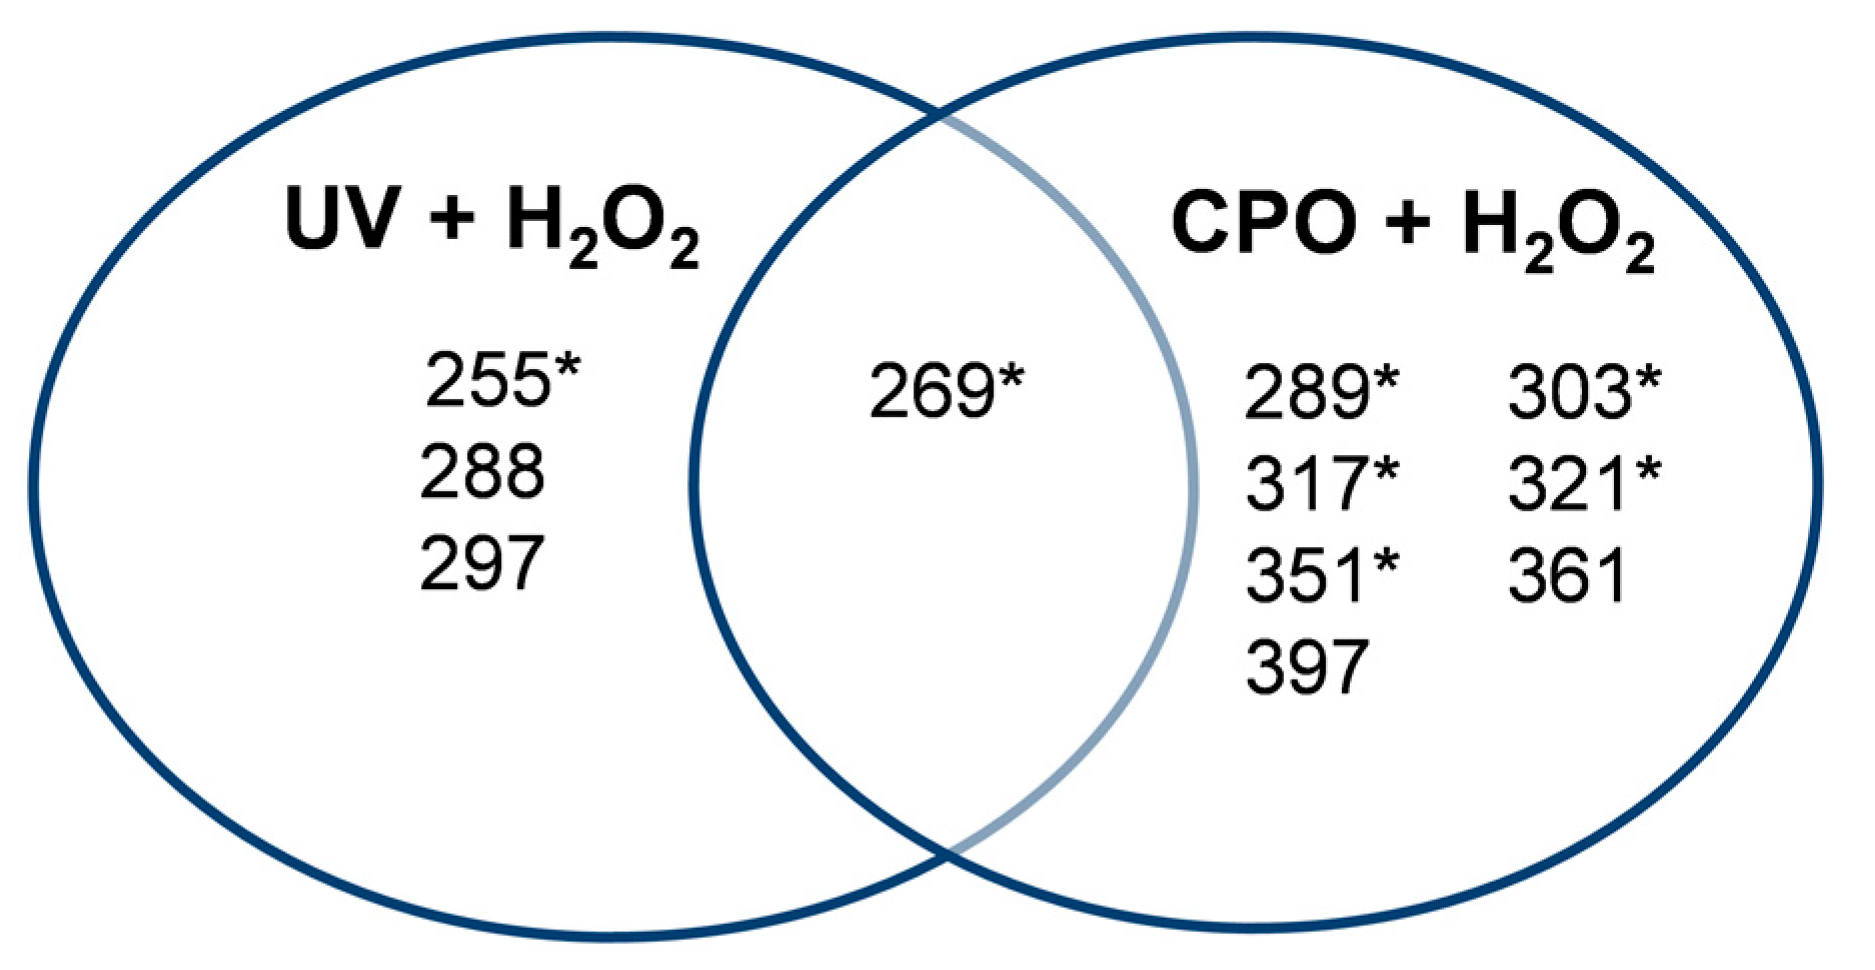
Detailed analyses of all the peaks detected after the UV + H2O2 and CPO + H2O2 treatments of ThT are shown in Table 1. As can be seen from this table, the AOP-mediated degradation of ThT (ThT + UV + H2O2) generated four intermediates with m/z values of 297, 288, 269, and 255, with the m/z = 269 peak being the most prominent intermediate (based on peak area). Interestingly, the intermediates produced during the enzymatic treatment of ThT (ThT + CPO + H2O2) were very different, with m/z values of 397, 361, 351, 321, 317, 303, 289, and 269. It is worth noticing that except for the m/z = 269 species, the two different treatments produced completely different intermediates. This interesting and novel finding is also graphically represented in Figure 4.
2.4. Mechanistic Studies
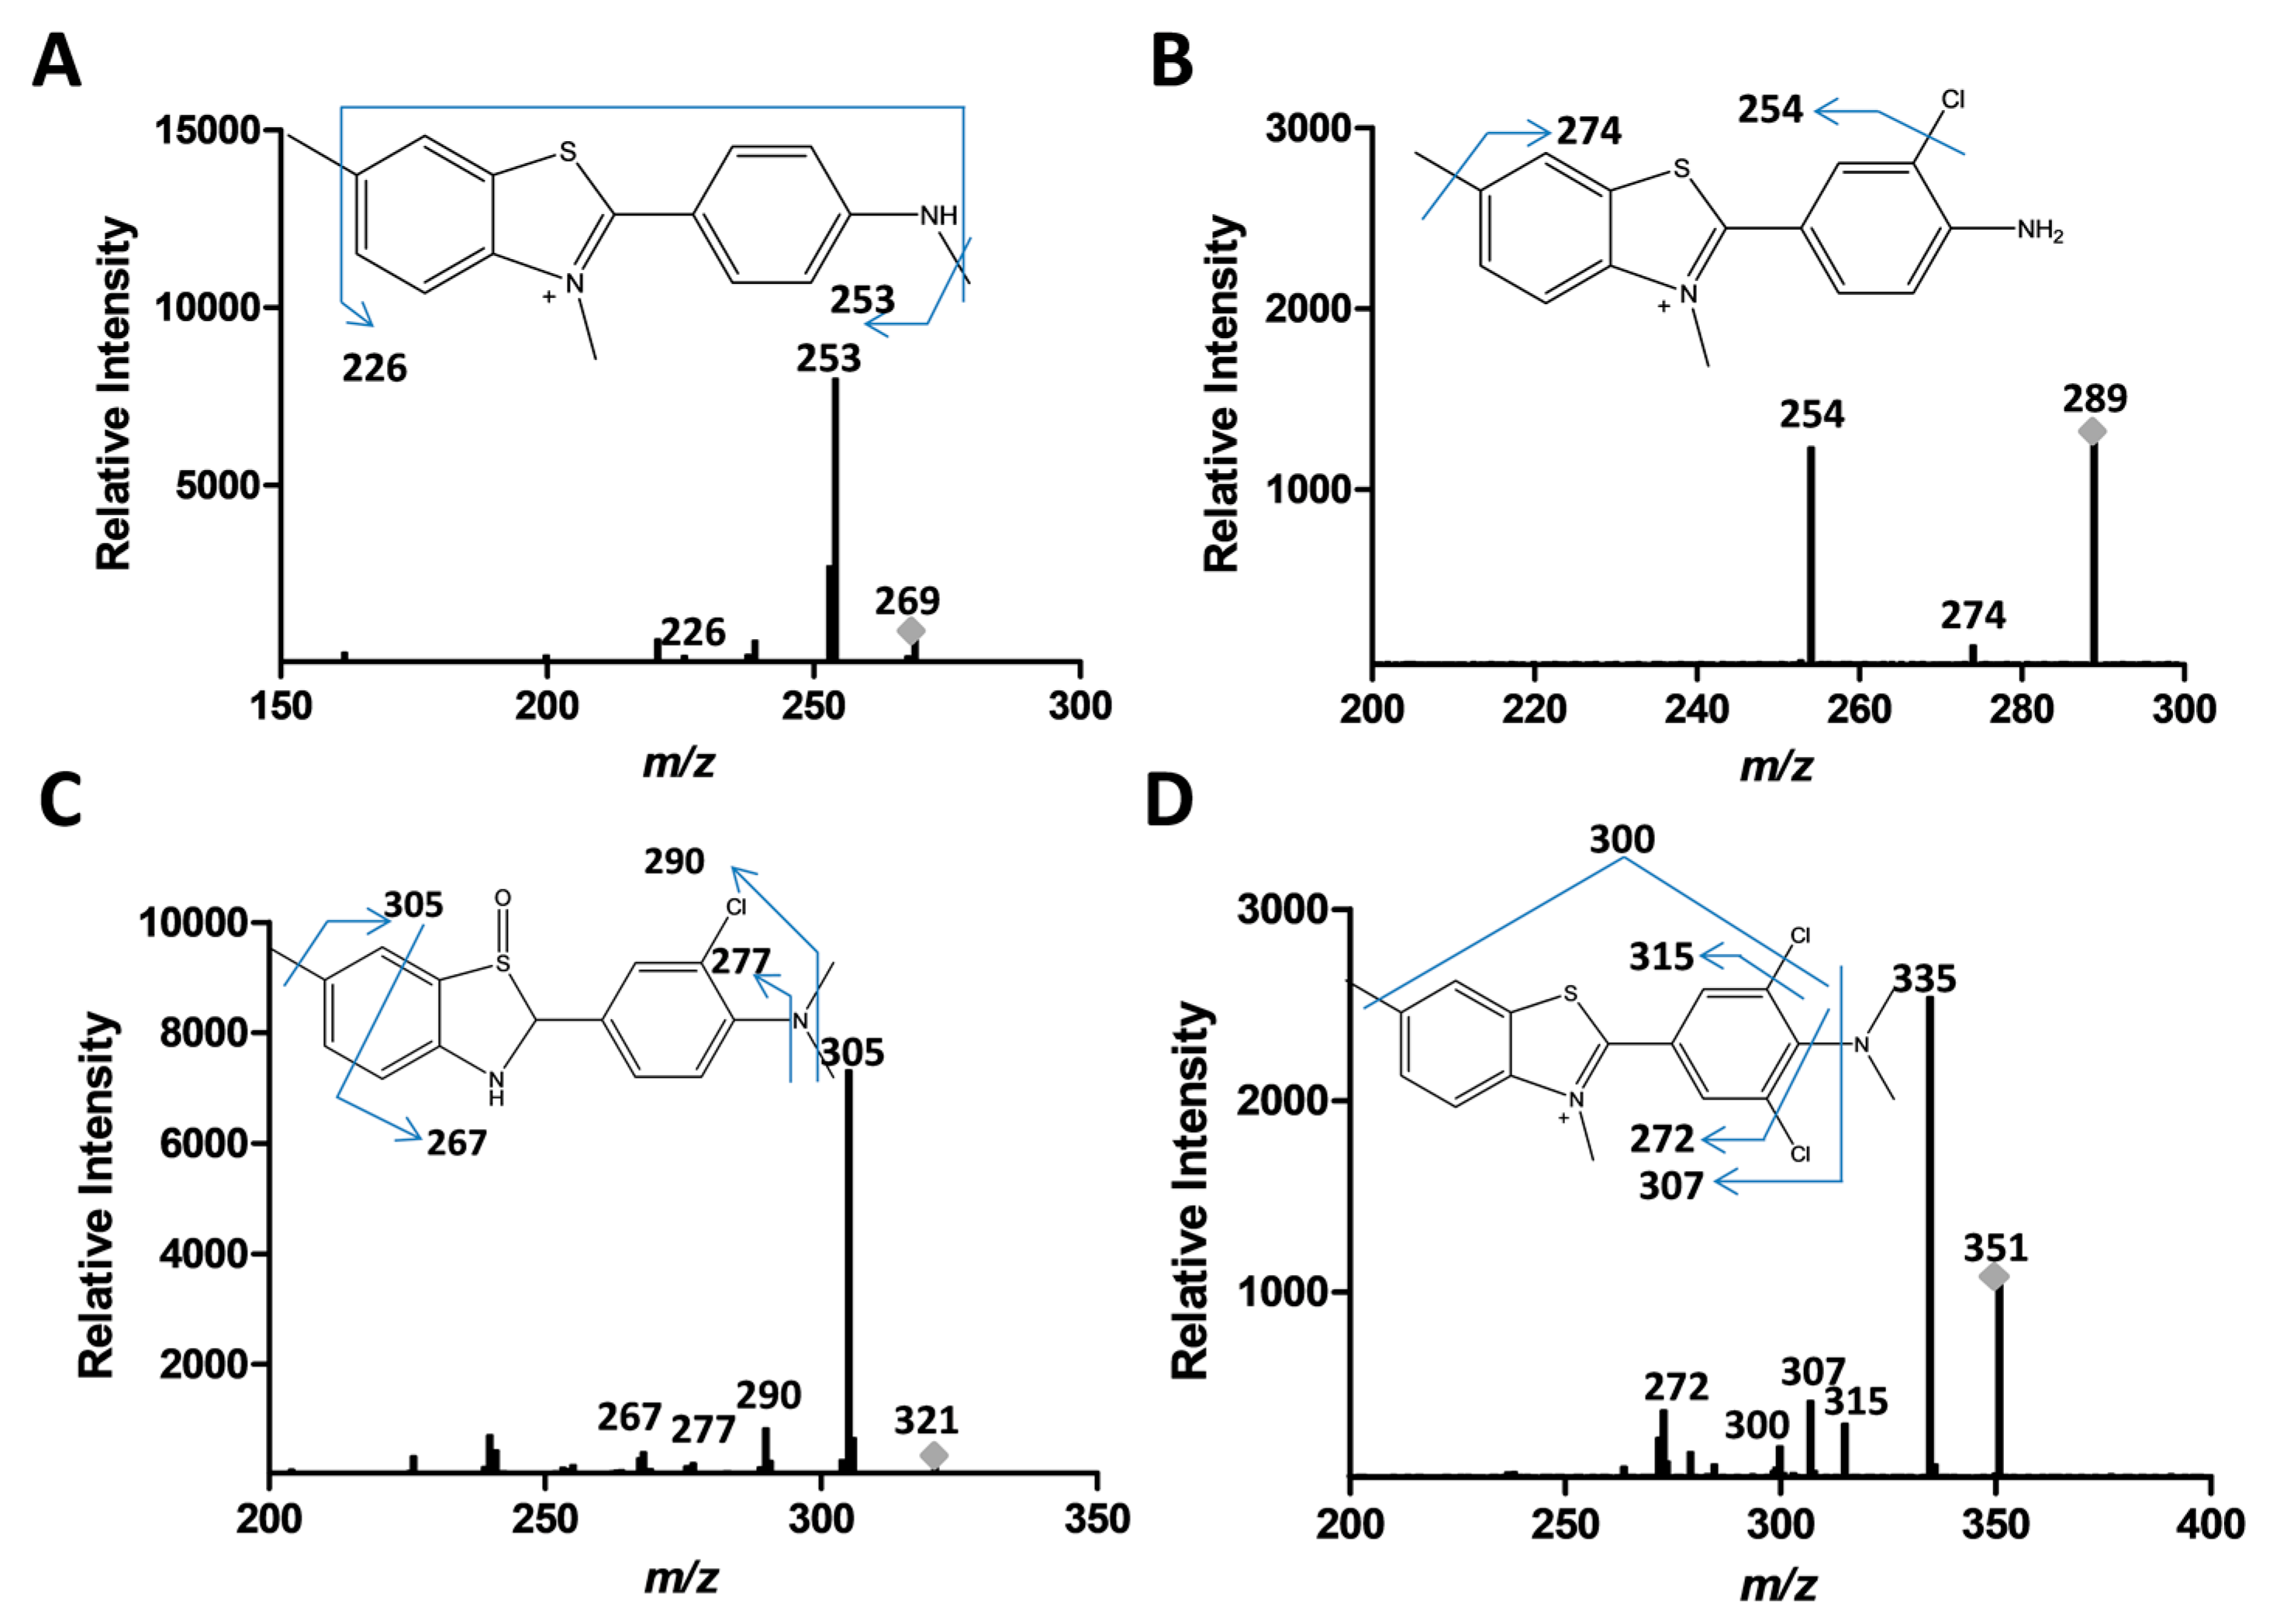
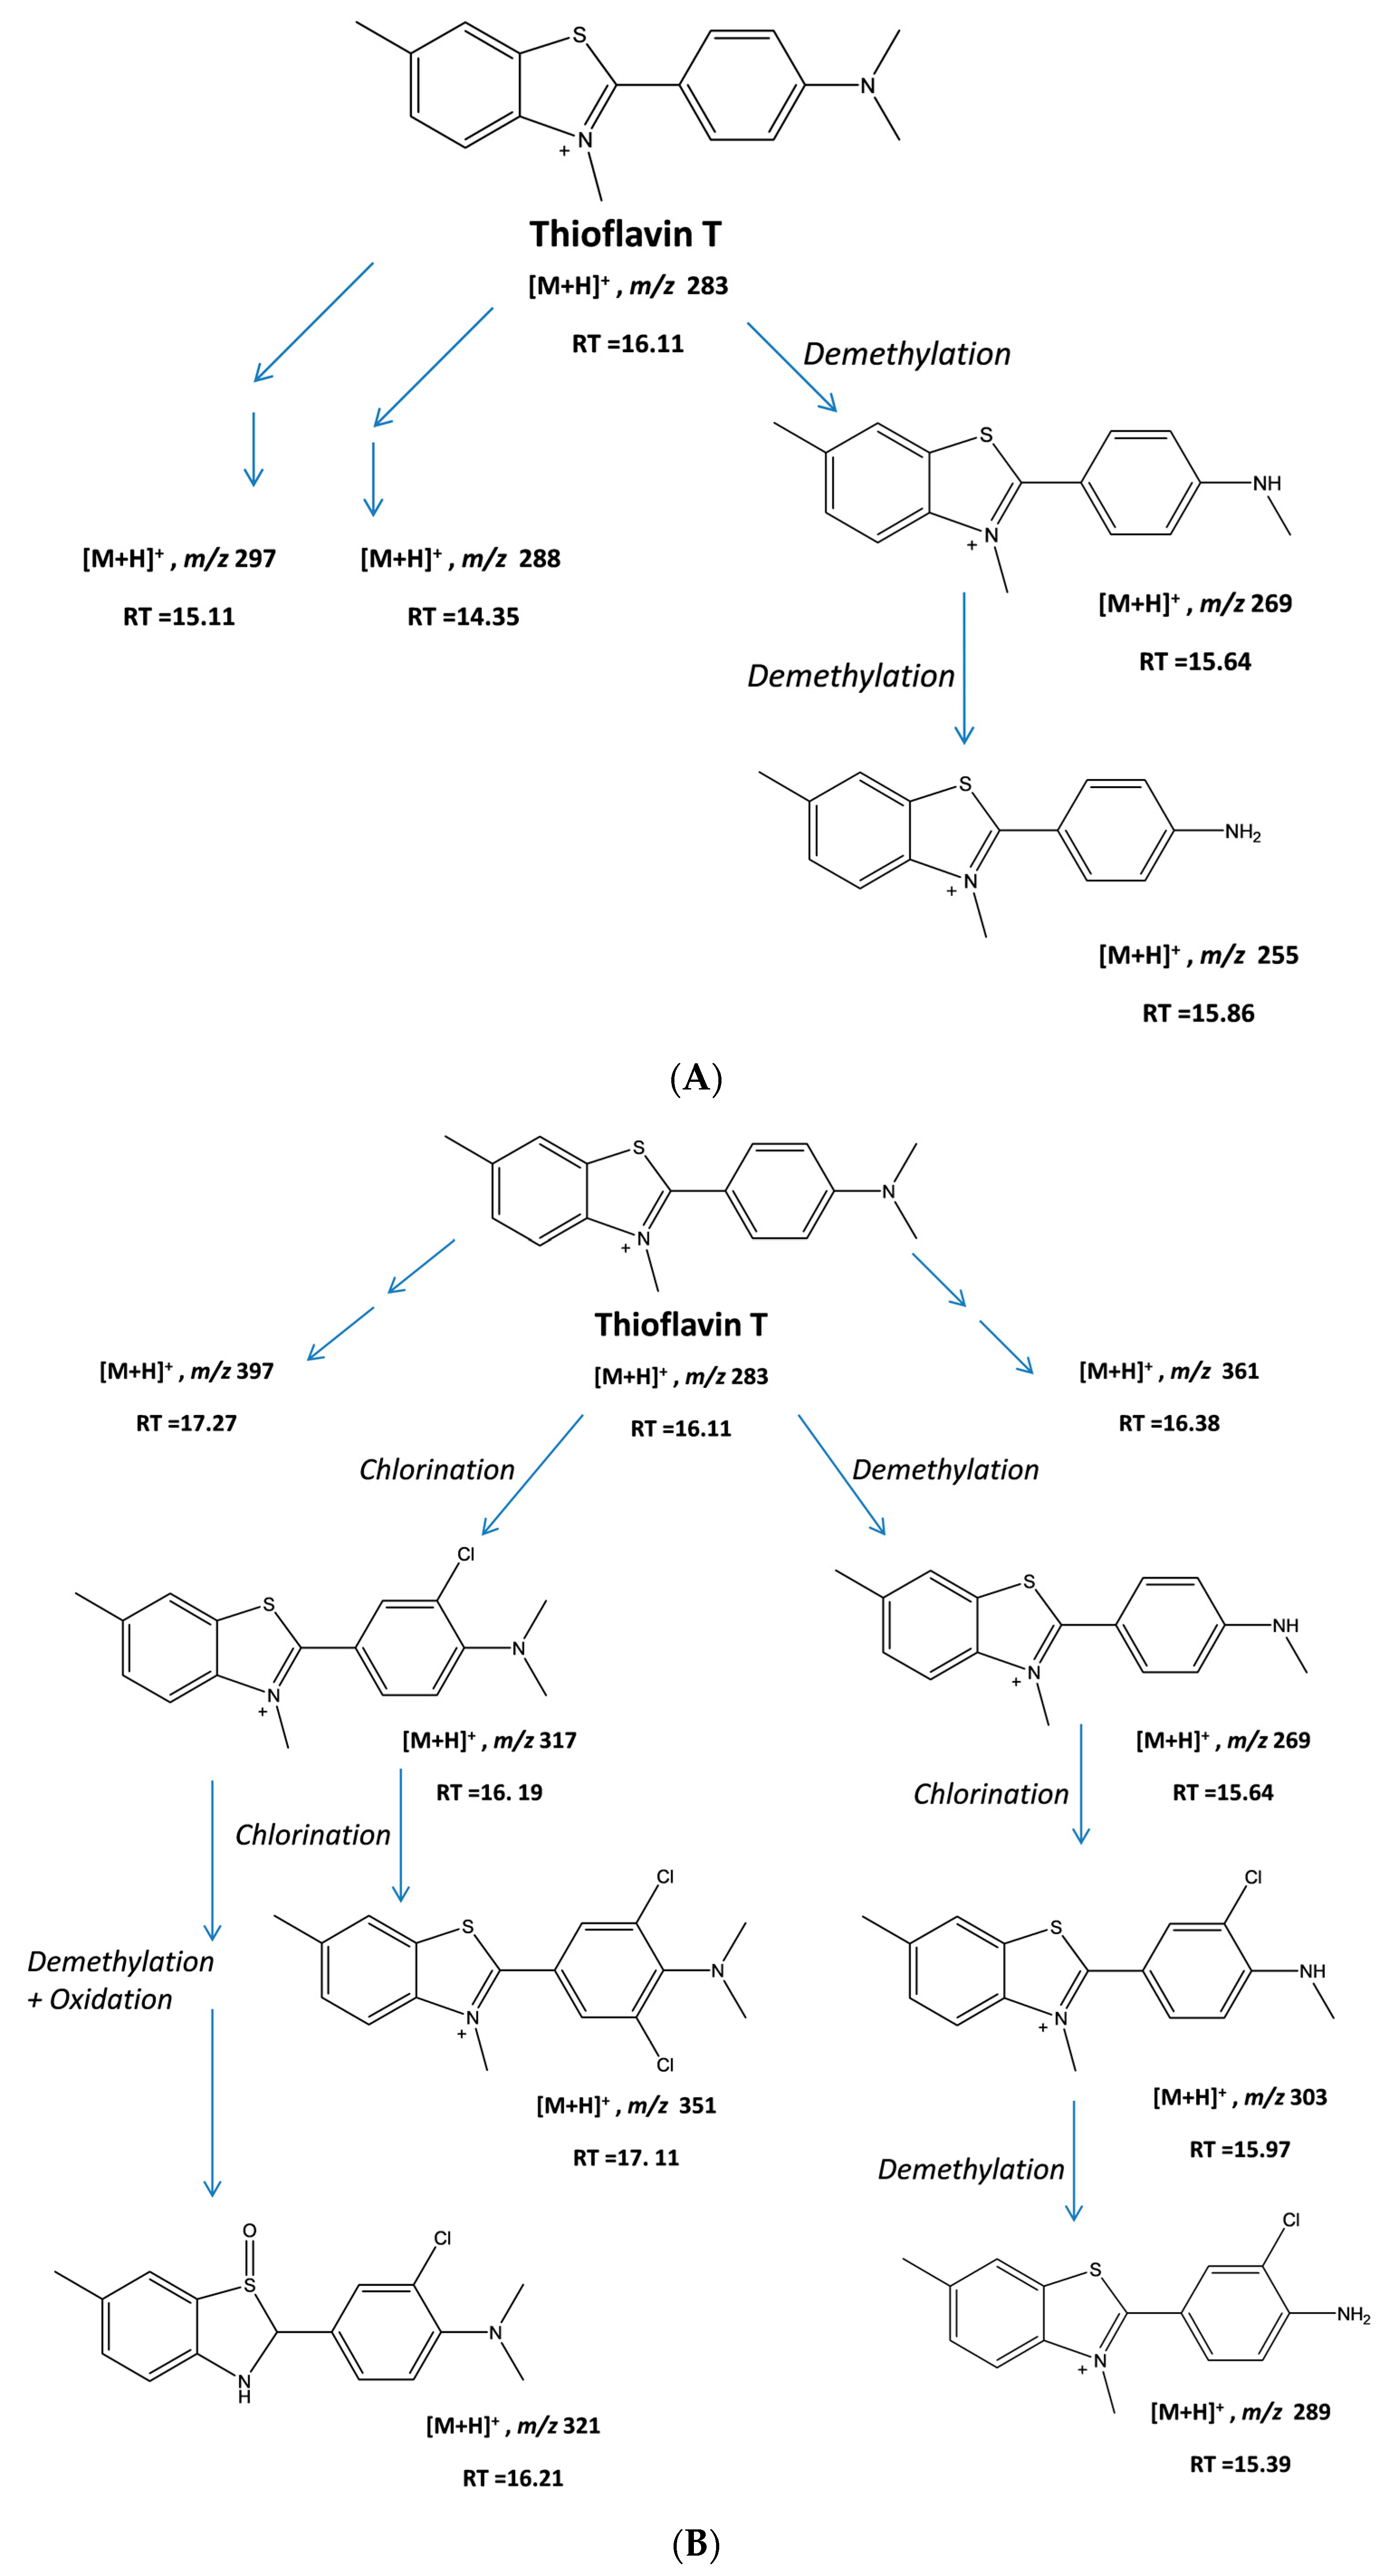
An attempt was made to propose plausible structures for the various different intermediates generated in the two different treatments by using tandem mass spectrometry-mass spectrometry (MS-MS) data. Indeed, as can be seen in Figure 5, we were able to propose structures for seven of the intermediates produced, with the relevant peaks being indicated by asterisks (*) in Figure 4. Based on the structure of the intermediates, we were able to develop plausible schemes for ThT breakdown during the UV + H2O2 and CPO + H2O2 remediation processes. In the UV + H2O2 process, the main mechanism involves the formation of OH• radicals by the UV-mediated homolysis of hydrogen peroxide. These reactive OH• radicals attack ThT, leading to the stepwise demethylation of the tertiary amine and resulting in the formation of intermediates with m/z values of 269. Subsequent demethylation produces the m/z = 255 compound. This demethylation mechanism has been previously reported by our group as well as others [38,39,40]. The decrease in the retention times of these intermediates (15.64 min and 15.8 min) on the reverse-phase column when compared to ThT (16.11 min) reflects their increased polarities. Other, more polar intermediates with m/z values of 297 and 288 and retention times of 15.11 and 14.35 min, respectively, were also produced during the UV + H2O2 treatment of ThT.
Unlike the UV-induced photolysis of H2O2, which generates reactive hydroxyl radicals, the CPO + H2O2 system entails a different mechanism. It is well-known that heme peroxidases, such as CPO, can react with H2O2 to generate an enzymatic iron oxyradical called Compound I, which can react with organic substrates to be converted to the Compound II form of the enzyme and an organic radical. The Compound II form of the enzyme can react with another organic substrate to create another organic radical molecule and regenerate the resting form of the enzyme [9], as shown below:
where SH indicates a generic substrate.
Peroxidase + H2O2 → Compound I + H2O
Compound I + SH → Compound II + S•
Compound II + SH → Peroxidase + S• + H2O
Although the above peroxidase reaction cycle does not explicitly show the generation of hydroxyl radicals, it is possible that OH radicals may also be produced in this case, as CPO is known to cleave the peroxide O–O bond through a glutamic acid residue present in its active site [41].
Besides the well-known H2O2-peroxidase cycle described above, CPO is also known to catalyze chlorination of organic compounds [18,42], as shown below:
R–H + Cl− + H2O2 + H+ → R–Cl + 2 H2O
In fact, based on the MS-MS data, our proposed degradation scheme suggests that the action of CPO on ThT in the presence of H2O2 can occur through two overlapping pathways, with the first being the chlorination of ThT, and the second being the production of OH• that can react with ThT and its chlorinated products (Figure 6B). A comparison of the abundance of the proposed species (Table 1) as determined by LC-MS-MS suggests that the chlorination pathway (317 m/z species) was at least twenty times more active than the demethylation pathway (269 m/z species). A second chlorination also occurs, yielding a compound with an m/z value of 351 (Figure 5D). The mono-chlorinated ThT could also undergo stepwise demethylation, yielding structures with m/z values of 303 and 289. An intermediate with m/z = 321 was also observed, which corresponds to the addition of an OH (oxidation) to the demethylated form of chlorinated ThT, as seen in Figure 6B.
The generation of chlorinated products of ThT observed during the CPO + H2O2 treatment of ThT was not completely unexpected, as ThT contains a chloride counter ion and it is well-established that CPO, in the presence of halide ions can lead to the halogenation of various organic substrates [43]. In fact, we have previously published that in contrast to ThT, a different but related thiazole compound (2-mercaptobenzothiazole), which did not contain a chloride counterion, did not produce any chlorinated products [18]. However, it is expected that most industrial waste streams would have relatively high concentrations of various ions, including halides [44], and hence the results presented here could be valuable and relevant in real life remediation situations.
2.5. Toxicity Studies
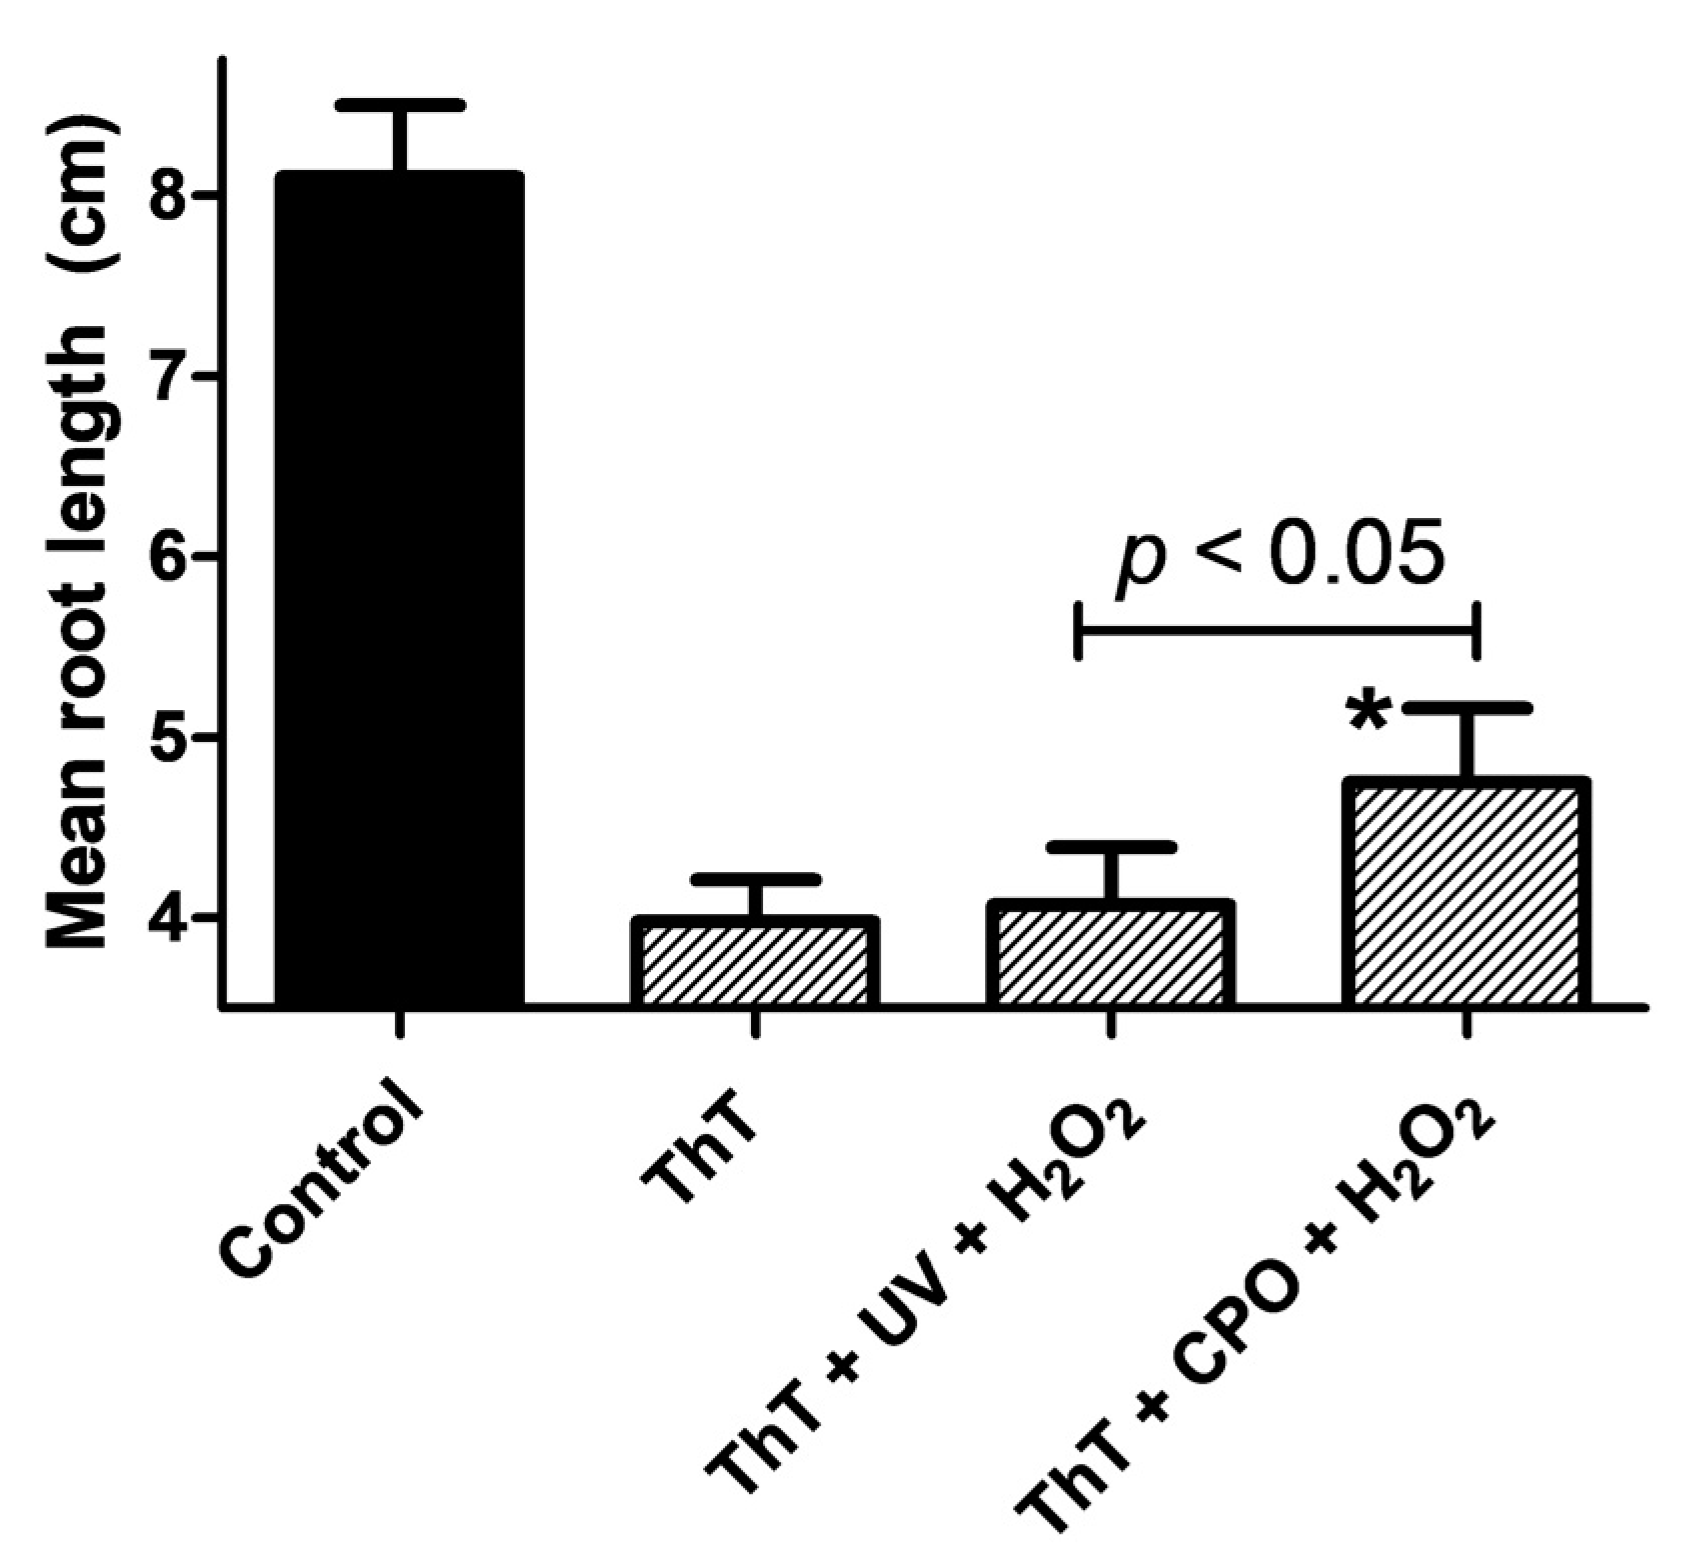
The toxicity of degradation products should be analyzed where possible, as they can often be more toxic than the parent compound [45]. Therefore, we carried out phytotoxicity studies using Lactuca sativa seeds by exposing them to AOP-remediated ThT and enzymatically treated ThT solutions. The germination of Lactuca sativa L. var. Buttercrunch seeds is a standard protocol for assessing toxicity in water and soil matrices, and is recommended for bioassays by the U.S. Environmental Protection Agency, the Food and Drug Administration, and the Organization for Economic Cooperation and Development [46]. Figure 7 shows the results of the toxicity studies, in which the root lengths of L. sativa seeds exposed to distilled water (control), neat ThT, ThT treated with UV + H2O2, or ThT treated with CPO + H2O2 were measured. As can be seen from the figure, ThT had a significant phytotoxic effect on the seeds, causing a dramatic and significant decrease in the mean root length. A significant inhibition of root lengths was also observed in the ThT + UV + H2O2 and ThT + CPO + H2O2 samples (Figure 7). However, a t-test analysis showed that the ThT + CPO + H2O2 sample was significantly (p < 0.05) less toxic than the ThT + UV + H2O2 sample. This result was quite unexpected, and suggests that one or more of the intermediates generated during the UV + H2O2 treatment of ThT could be toxic. Alternatively, the fact that the ThT + CPO + H2O2 sample still exhibited significant phytotoxicity could be explained by the fact that this sample still contained large amounts of the toxic undegraded ThT dye. Further studies will need to be carried out to allow the nature of the phytotoxicity of the ThT + UV + H2O2 sample to be understood; however, the present data shows that the UV + H2O2 and CPO + H2O2 treatments of ThT produce different intermediates that could have differing toxicities: an observation that has not been published earlier.
3. Materials and Methods
3.1. Reagents
The thiazole compound thioflavin T (whose molecular formula is C17H19ClN2S and whose formula weight is 318.86 g·mol−1) was purchased from AnaSpec (Fremont, CA, USA). Hydrogen peroxide (30% w/v) and LC-MS grade solvents, such as formic acid and acetonitrile, were purchased from Sigma-Aldrich (St. Louis, MO, USA). All of the experiments were carried out in 50 mM citrate buffer, pH 2. CPO with a specific activity of 1296 IU/mg (17 mg/mL, 405 µM) was purchased from Bio-Research Products (North Liberty, IA, USA).
3.2. Thioflavin T Decolorization
For the photolytic treatment of ThT using UV + H2O2, 1 mM H2O2 was added to ThT samples in 50 mM citrate buffer (pH 2), which were then irradiated with a UV lamp (UVGL-58, J-129, Upland, NJ, USA) from a distance of 1.5 cm. The instrument had a UV power output of 6 W and was selectively used in the 254 nm output mode for these studies. Under these conditions, no significant warming up of the irradiated solution was observed.
For the enzymatic treatment of ThT using CPO + H2O2, experiments were carried out as previously described [18]. Briefly, ThT and H2O2 (1 mM) in 50 mM citrate buffer (pH 2) was exposed to CPO (10 nM), and the changes in the full ThT spectrum were monitored.
In both the enzymatic and the photolytic studies, spectra were collected in the range of 200–800 nm using a Carry 60 Spectrophotometer (Agilent Technologies, Santa Clara, CA, USA), with a path length of 1 cm (4 mL quartz cuvette) and 412 nm was used as λmax.
3.3. LC-MS and MS-MS Analyses
The materials produced after the enzymatic and the photolytic treatments were analyzed using LC-MS, as previously described [18,19]. Briefly, all ThT samples were filtered using a 0.45 µm CA syringe filter prior to injection. The LC-MS was fitted with a ZORBAX Eclipse Plus C18 column (Agilent Technologies, Santa Clara, CA, USA) with a particle size of 1.8 µm, an inner diameter of 2.1 mm, and a length of 50 mm. The column was maintained at 35 °C, and a constant flow rate of 0.2 mL/min was maintained. The column was coupled to a 6420 Triple Quad LC-MS System detector (Agilent Technologies). Two mobile phases were used: A is water containing 0.1% formic acid, and B is 100% acetonitrile. The LC method was set as follows: 5 min of 100% A, followed by a 0–100% gradient of B from 5–20 min, then 5 min of 100% B after the gradient, and finally 5 min of 100% A. The electrospray ionization source in the LC-MS system was in positive polarity mode, the capillary voltage was set at 4000 V, the nebulizer pressure was maintained at 45 psi, the drying gas (N2) flow was 11 L/min, and the drying temperature was set at 325 °C. The mass range monitored for all of the runs was between 50 and 1000 Da. In the tandem MS experiments using the product ion mode, nitrogen gas was used for fragmentation and different collision energies were used.
3.4. Phytotoxicity Assay
The toxicity of ThT before and after the UV + H2O2 and CPO + H2O2 treatments was measured using the lettuce seed growth inhibition assay, similar to a previously described method but with slight modifications [19]. Briefly, 20 Lactuca sativa seeds were placed on sterilized Whatman filter paper, No. 3, in a Petri dish and saturated with 4 mL of the samples. The petri dishes were incubated for 5 days in a humidified chamber at 25 ± 2 °C. Distilled water was used as a negative control and ThT was used as a positive control, with each sample being tested in duplicate. The effects of the original dye and the dye samples degraded by UV + H2O2 and CPO + H2O2 were examined by measuring the lengths of the roots of the germinated seeds. Statistical analyses were conducted for each group of treated seeds (n = 40). The data were analyzed via unpaired t-tests. Data are reported as group mean ± standard deviation, and significance for all statistical comparisons was set at p < 0.05.
4. Conclusions
To the best of our knowledge, this is the first study to present a systematic comparison of the use of two different remediation methods to treat a toxic organic pollutant. We showed that treating ThT with UV + H2O2 and CPO + H2O2 produced very different degradation products, with only one common intermediate. This suggested that different organic pollutant degradation schemes were involved in these two remediation approaches, and we attempted to elucidate these mechanisms. Additionally, we showed that the AOP (UV + H2O2) and enzymatic (CPO + H2O2) treated ThT solutions had significantly different toxicities for L. sativa seeds. The unexpected and intriguing data presented here also highlights the need for a better understanding of different remediation approaches and for additional research into such comparative remediation studies.
Acknowledgments
The authors acknowledge the generous funding from the United Arab Emirates University National Water Center, grant ID 31R078, to Syed Salman Ashraf.
Author Contributions
Syed Salman Ashraf conceived and designed the experiments; Khadega A. Al-Maqdi performed the experiments; Khadega A. Al-Maqdi, Soleiman M. Hisaindee and Syed Salman Ashraf analyzed the data; all authors contributed to the writing of the manuscript.
Conflicts of Interest
The authors declare no conflict of interest.
References
- Ebele, A.J.; Abou-Elwafa Abdallah, M.; Harrad, S. Pharmaceuticals and personal care products (PPCPs) in the freshwater aquatic environment. Emerg. Contam. 2017, 3, 1–16. [Google Scholar] [CrossRef]
- Stuart, M.; Lapworth, D.; Crane, E.; Hart, A. Review of risk from potential emerging contaminants in UK groundwater. Sci. Total Environ. 2012, 416, 1–21. [Google Scholar] [CrossRef] [PubMed] [Green Version]
- Lapworth, D.J.; Baran, N.; Stuart, M.E.; Ward, R.S. Emerging organic contaminants in groundwater: A review of sources, fate and occurrence. Environ. Pollut. 2012, 163, 287–303. [Google Scholar] [CrossRef] [PubMed] [Green Version]
- Robinson, T.; McMullan, G.; Marchant, R.; Nigam, P. Remediation of dyes in textile effluent: A critical review on current treatment technologies with a proposed alternative. Bioresour. Technol. 2001, 77, 247–255. [Google Scholar] [CrossRef]
- Adeleye, A.S.; Conway, J.R.; Garner, K.; Huang, Y.; Su, Y.; Keller, A.A. Engineered nanomaterials for water treatment and remediation: Costs, benefits, and applicability. Chem. Eng. J. 2016, 286. [Google Scholar] [CrossRef]
- Bokare, A.D.; Choi, W. Review of iron-free Fenton-like systems for activating H2O2 in advanced oxidation processes. J. Hazard. Mater. 2014, 275, 121–135. [Google Scholar] [CrossRef] [PubMed]
- Kalsoom, U.; Ashraf, S.S.; Meetani, M.A.; Rauf, M.A.; Bhatti, H.N. Degradation and kinetics of H2O2 assisted photochemical oxidation of Remazol Turquoise Blue. Chem. Eng. J. 2012, 200, 373–379. [Google Scholar] [CrossRef]
- Boopathy, R. Factors limiting bioremediation technologies. Bioresour. Technol. 2000, 74, 63–67. [Google Scholar] [CrossRef]
- Rauf, M.A.; Salman Ashraf, S. Survey of recent trends in biochemically assisted degradation of dyes. Chem. Eng. J. 2012, 209, 520–530. [Google Scholar] [CrossRef]
- Ali, L.; Algaithi, R.; Habib, H.M.; Souka, U.; Rauf, M.A.; Ashraf, S.S. Soybean peroxidase-mediated degradation of an azo dye– a detailed mechanistic study. BMC Biochem. 2013, 14, 35. [Google Scholar] [CrossRef] [PubMed]
- Bibi, I.; Bhatti, H.N.; Asgher, M. Comparative study of natural and synthetic phenolic compounds as efficient laccase mediators for the transformation of cationic dye. Biochem. Eng. J. 2011, 56, 225–231. [Google Scholar] [CrossRef]
- Kalsoom, U.; Ashraf, S.S.; Meetani, M.A.; Rauf, M.A.; Bhatti, H.N. Mechanistic study of a diazo dye degradation by Soybean Peroxidase. Chem. Cent. J. 2013, 7, 93. [Google Scholar] [CrossRef] [PubMed]
- Franciscon, E.; Piubeli, F.; Fantinatti-Garboggini, F.; Ragagnin de Menezes, C.; Serrano Silva, I.; Cavaco-Paulo, A.; Grossman, M.J.; Durrant, L.R. Polymerization study of the aromatic amines generated by the biodegradation of azo dyes using the laccase enzyme. Enzym. Microb. Technol. 2010, 46, 360–365. [Google Scholar] [CrossRef] [Green Version]
- Ryan, B.J.; Carolan, N.; Ó’Fágáin, C. Horseradish and soybean peroxidases: Comparable tools for alternative niches? Trends Biotechnol. 2006, 24, 355–363. [Google Scholar] [CrossRef] [PubMed] [Green Version]
- Cheng, X.-B.; Jia, R.; Li, P.-S.; Zhu, Q.; Tu, S.-Q.; Tang, W.-Z. Studies on the Properties and Co-immobilization of Manganese Peroxidase. Chin. J. Biotechnol. 2007, 23, 90–96. [Google Scholar] [CrossRef]
- Adrio, J.L.; Demain, A.L. Microbial Enzymes: Tools for Biotechnological Processes. Biomolecules 2014, 4, 117–139. [Google Scholar] [CrossRef] [PubMed]
- Liu, L.; Zhang, J.; Tan, Y.; Jiang, Y.; Hu, M.; Li, S.; Zhai, Q. Rapid decolorization of anthraquinone and triphenylmethane dye using chloroperoxidase: Catalytic mechanism, analysis of products and degradation route. Chem. Eng. J. 2014, 244, 9–18. [Google Scholar] [CrossRef]
- Alneyadi, A.H.; Ashraf, S.S. Differential enzymatic degradation of thiazole pollutants by two different peroxidases—A comparative study. Chem. Eng. J. 2016, 303, 529–538. [Google Scholar] [CrossRef]
- Alneyadi, A.H.; Shah, I.; AbuQamar, S.F.; Ashraf, S.S. Differential Degradation and Detoxification of an Aromatic Pollutant by Two Different Peroxidases. Biomolecules 2017, 7, 31. [Google Scholar] [CrossRef] [PubMed]
- Sundaramoorthy, M.; Terner, J.; Poulos, T.L. The crystal structure of chloroperoxidase: A heme peroxidase—cytochrome P450 functional hybrid. Structure 1995, 3, 1367–1378. [Google Scholar] [CrossRef]
- Hofrichter, M.; Ullrich, R.; Pecyna, M.J.; Liers, C.; Lundell, T. New and classic families of secreted fungal heme peroxidases. Appl. Microbiol. Biotechnol. Heidelb. 2010, 87, 871–897. [Google Scholar] [CrossRef] [PubMed]
- Abdelraheem, W.H.M.; He, X.; Komy, Z.R.; Ismail, N.M.; Dionysiou, D.D. Revealing the mechanism, pathways and kinetics of UV254nm/H2O2-based degradation of model active sunscreen ingredient PBSA. Chem. Eng. J. 2016, 288, 824–833. [Google Scholar] [CrossRef]
- Oturan, M.A.; Aaron, J.-J. Advanced Oxidation Processes in Water/Wastewater Treatment: Principles and Applications. A Review. Crit. Rev. Environ. Sci. Technol. 2014, 44, 2577–2641. [Google Scholar] [CrossRef]
- Cesaro, A.; Belgiorno, V. Removal of Endocrine Disruptors from Urban Wastewater by Advanced Oxidation Processes (AOPs): A Review. Open Biotechnol. J. 2016, 10. [Google Scholar] [CrossRef]
- Rodríguez-Delgado, M.; Ornelas-Soto, N. Laccases: A Blue Enzyme for Greener Alternative Technologies in the Detection and Treatment of Emerging Pollutants. In Green Technologies and Environmental Sustainability; Springer: Cham, Switzerland, 2017; pp. 45–65. ISBN 978-3-319-50653-1. [Google Scholar]
- Dhillon, G.S.; Kaur, S. Agro-Industrial Wastes as Feedstock for Enzyme Production: Apply and Exploit the Emerging and Valuable Use Options of Waste Biomass; Academic Press: Cambridge, MA, USA, 2016; ISBN 978-0-12-802612-0. [Google Scholar]
- Calza, P.; Avetta, P.; Rubulotta, G.; Sangermano, M.; Laurenti, E. TiO2-soybean peroxidase composite materials as a new photocatalytic system. Chem. Eng. J. 2014, 239, 87–92. [Google Scholar] [CrossRef]
- Nogueira, V.; Lopes, I.; Freitas, A.C.; Rocha-Santos, T.A.P.; Gonçalves, F.; Duarte, A.C.; Pereira, R. Biological treatment with fungi of olive mill wastewater pre-treated by photocatalytic oxidation with nanomaterials. Ecotoxicol. Environ. Saf. 2015, 115, 234–242. [Google Scholar] [CrossRef] [PubMed]
- García-Montaño, J.; Domènech, X.; García-Hortal, J.A.; Torrades, F.; Peral, J. The testing of several biological and chemical coupled treatments for Cibacron Red FN-R azo dye removal. J. Hazard. Mater. 2008, 154, 484–490. [Google Scholar] [CrossRef] [PubMed]
- García-Montaño, J.; Pérez-Estrada, L.; Oller, I.; Maldonado, M.I.; Torrades, F.; Peral, J. Pilot plant scale reactive dyes degradation by solar photo-Fenton and biological processes. J. Photochem. Photobiol. Chem. 2008, 195, 205–214. [Google Scholar] [CrossRef]
- Sánchez Peréz, J.A.; Carra, I.; Sirtori, C.; Agüera, A.; Esteban, B. Fate of thiabendazole through the treatment of a simulated agro-food industrial effluent by combined MBR/Fenton processes at μg/L scale. Water Res. 2014, 51, 55–63. [Google Scholar] [CrossRef] [PubMed]
- Clarke, B.O.; Smith, S.R. Review of “emerging” organic contaminants in biosolids and assessment of international research priorities for the agricultural use of biosolids. Environ. Int. 2011, 37, 226–247. [Google Scholar] [CrossRef] [PubMed]
- Collado, N.; Rodriguez-Mozaz, S.; Gros, M.; Rubirola, A. Pharmaceuticals occurrence in a WWTP with significant industrial contribution and its input into the river system. Environ. Pollut. 2014, 185, 202–212. [Google Scholar] [CrossRef] [PubMed]
- Konstantinou, I.K.; Albanis, T.A. TiO2-assisted photocatalytic degradation of azo dyes in aqueous solution: Kinetic and mechanistic investigations. Appl. Catal. B Environ. 2004, 49, 1–14. [Google Scholar] [CrossRef]
- Georgiou, D.; Melidis, P.; Aivasidis, A.; Gimouhopoulos, K. Degradation of azo-reactive dyes by ultraviolet radiation in the presence of hydrogen peroxide. Dyes Pigments 2002, 52, 69–78. [Google Scholar] [CrossRef]
- Rauf, M.A.; Ali, L.; Sadig, M.S.A.Y.; Ashraf, S.S.; Hisaindee, S. Comparative degradation studies of Malachite Green and Thiazole Yellow G and their binary mixture using UV/H2O2. Desalination Water Treat. 2016, 57, 8336–8342. [Google Scholar] [CrossRef]
- Zhang, Q.; Li, C.; Li, T. UV/H2O2 Process Under High Intensity UV Irradiation: A Rapid and Effective Method for Methylene Blue Decolorization. CLEAN Soil Air Water 2013, 41, 1201–1207. [Google Scholar] [CrossRef]
- Hisaindee, S.; Meetani, M.A.; Rauf, M.A. Application of LC-MS to the analysis of advanced oxidation process (AOP) degradation of dye products and reaction mechanisms. TrAC Trends Anal. Chem. 2013, 49, 31–44. [Google Scholar] [CrossRef]
- He, Y.; Grieser, F.; Ashokkumar, M. The mechanism of sonophotocatalytic degradation of methyl orange and its products in aqueous solutions. Ultrason. Sonochem. 2011, 18, 974–980. [Google Scholar] [CrossRef] [PubMed]
- Meetani, M.A.; Hisaindee, S.M.; Abdullah, F.; Ashraf, S.S.; Rauf, M.A. Liquid chromatography tandem mass spectrometry analysis of photodegradation of a diazo compound: A mechanistic study. Chemosphere 2010, 80, 422–427. [Google Scholar] [CrossRef] [PubMed]
- Siegbahn, P.E.M.; Blomberg, M.R.A. Mechanisms for enzymatic reactions involving formation or cleavage of O-O bonds. Theor. Comput. Chem. 2001, 9, 95–143. [Google Scholar] [CrossRef]
- Zhang, X.; Li, X.; Jiang, Y.; Hu, M.; Li, S.; Zhai, Q. Combination of enzymatic degradation by chloroperoxidase with activated sludge treatment to remove sulfamethoxazole: Performance, and eco-toxicity assessment. J. Chem. Technol. Biotechnol. 2016, 91, 2802–2809. [Google Scholar] [CrossRef]
- Hager, L.P.; Morris, D.R.; Brown, F.S.; Eberwein, H. Chloroperoxidase II. Utilization of Halogen Anions. J. Biol. Chem. 1966, 241, 1769–1777. [Google Scholar] [PubMed]
- Correia, V.M.; Stephenson, T.; Judd, S.J. Characterisation of textile wastewaters—A review. Environ. Technol. 1994, 15, 917–929. [Google Scholar] [CrossRef]
- Silva, M.C.; Corrêa, A.D.; Amorim, M.T.S.P.; Parpot, P.; Torres, J.A.; Chagas, P.M.B. Decolorization of the phthalocyanine dye reactive blue 21 by turnip peroxidase and assessment of its oxidation products. J. Mol. Catal. B Enzym. 2012, 77, 9–14. [Google Scholar] [CrossRef]
- Ecological Effects Test Guidelines OCSPP 850.4100: Seedling Emergence and Seedling Growth; United States Environmental Protection Agency, National Service Center for Environmental Publications (NSCEP): Cincinnati, OH, USA, 2012.
Figure 1.
Thioflavin T (ThT) dye degradation by a UV + H2O2 advanced oxidation process. (A) ultraviolet/visible (UV/Vis) absorbance spectra for ThT degradation by UV + H2O2. Concentration of ThT dye = 25 ppm, pH = 2, concentration of H2O2 = 1 mM. The UV/Vis scans were taken every 5 min; (B) Percentage of ThT remaining (decrease in absorbance at 412 nm) after treatment with UV + H2O2. Concentration of ThT dye = 25 ppm, pH = 2, concentration of H2O2 = 1 mM. Data shown is the average of triplicate measurements (± standard deviation (SD)).

Figure 2.
ThT dye degradation by Chloroperoxidase (CPO) + H2O2. (A) UV/Vis absorbance spectra for ThT dye degradation by CPO + H2O2. Concentration of ThT dye = 25 ppm, pH = 2, concentration of H2O2 = 1 mM, concentration of CPO = 10 nM. The UV/Vis scans were taken every 5 min; (B) Changes in absorbances at 412 nm and 350 nm of ThT dye after treatment with CPO + H2O2. Concentration of ThT dye = 25 ppm, pH = 2, concentration of H2O2 = 1 mM, concentration of CPO = 10 nM. Data shown is the average of triplicate measurements (± SD).
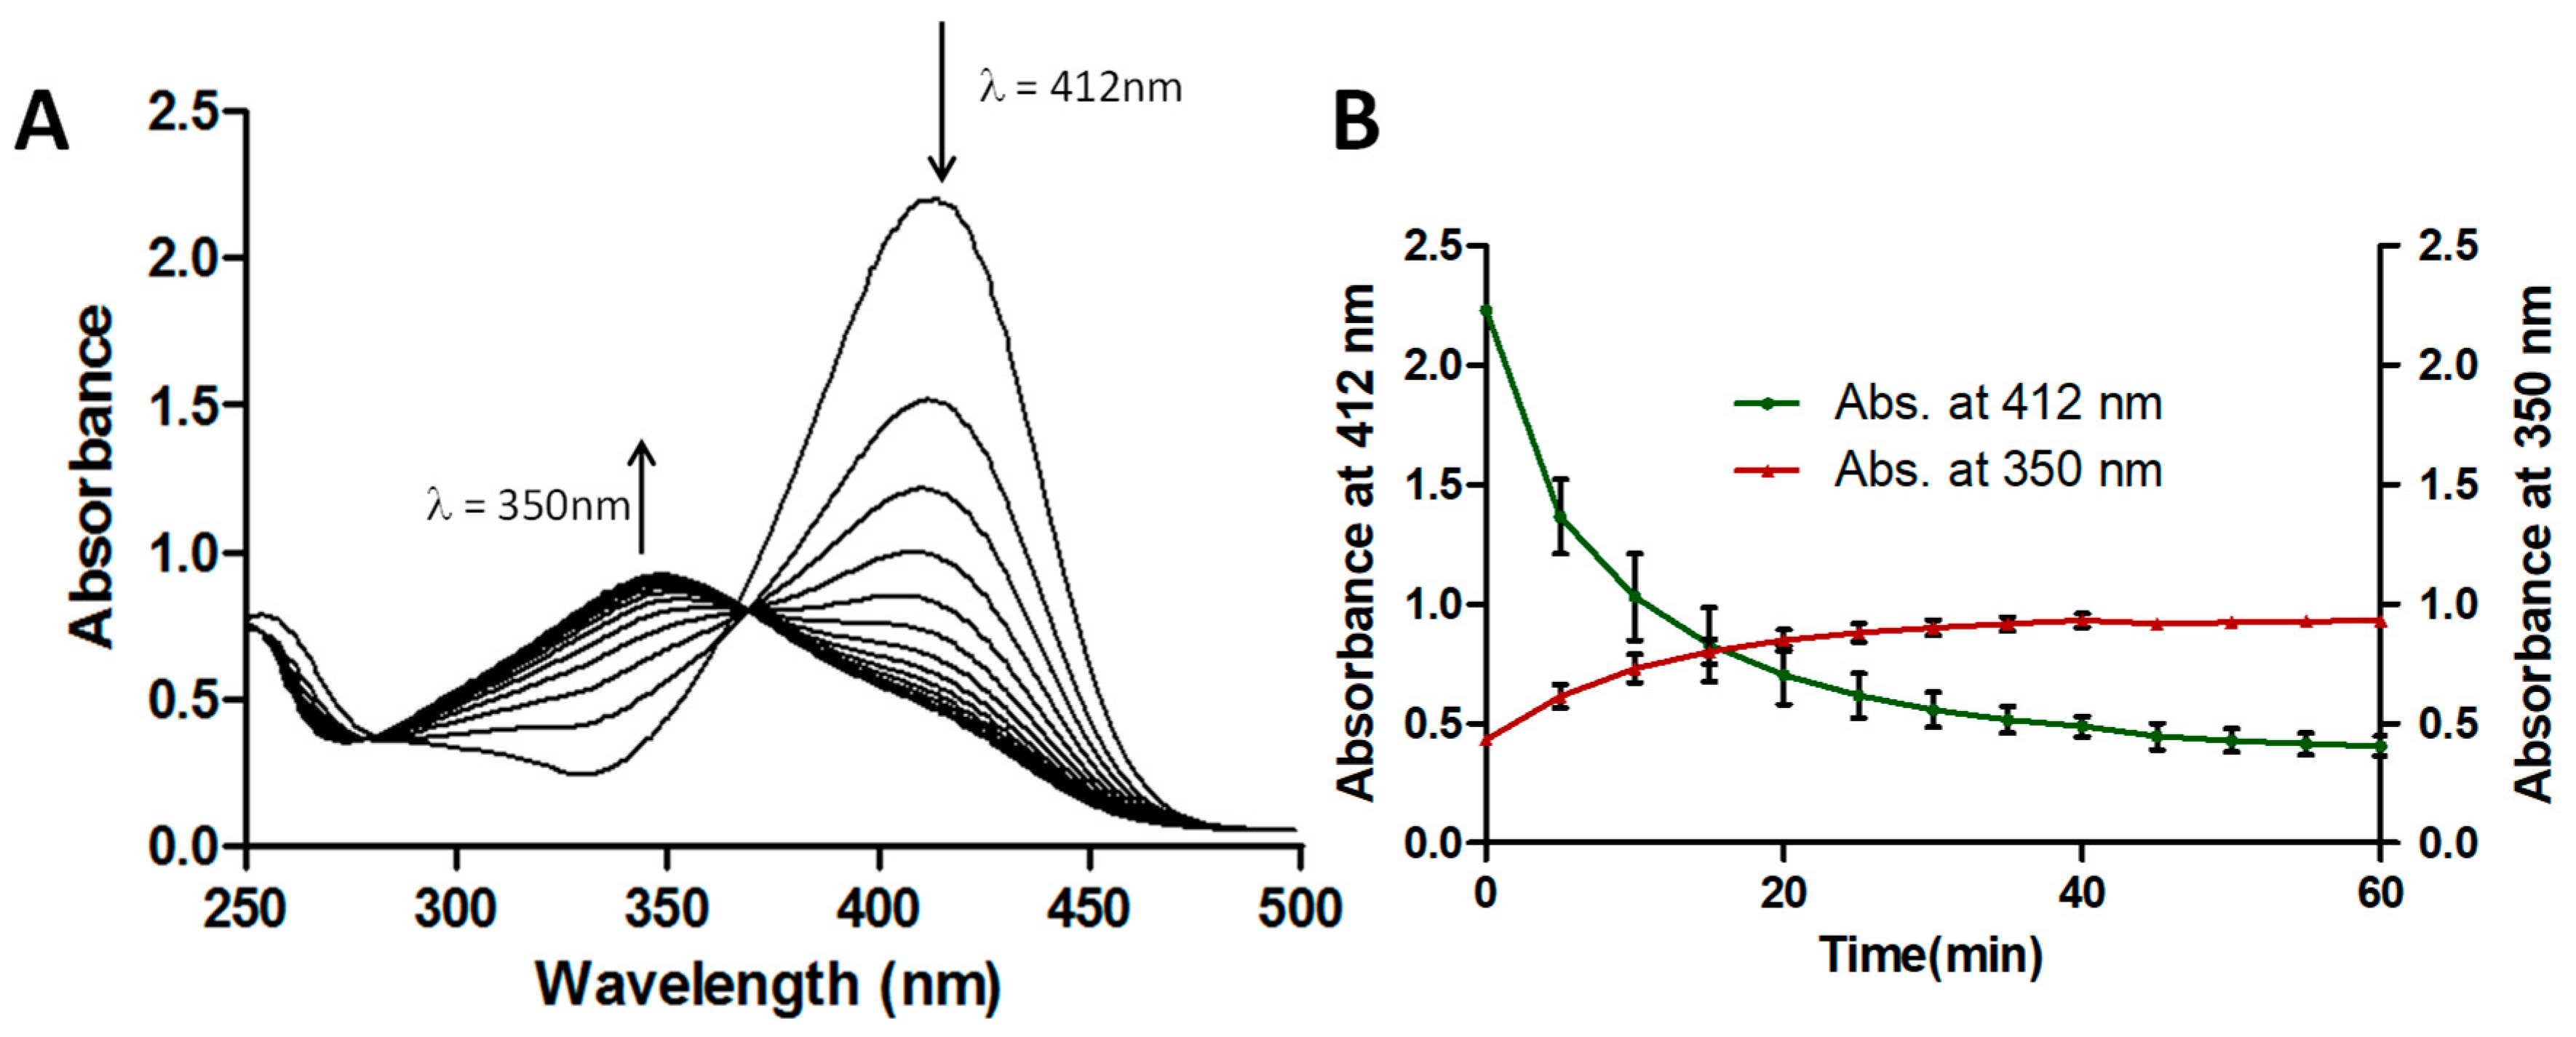
Figure 3.
Liquid chromatography-mass spectroscopy (LC-MS) chromatogram and mass spectrometry-mass spectrometry (MS-MS) analyses of ThT degraded by UV + H2O2 and CPO + H2O2 processes. The conditions for UV + H2O2 degradation were: concentration of ThT = 25 ppm, pH = 2, concentration of H2O2 = 1 mM, and for CPO + H2O2 degradation: concentration of ThT dye = 25 ppm, pH = 2, concentration of H2O2 = 1 mM, concentration of CPO = 10 nM.
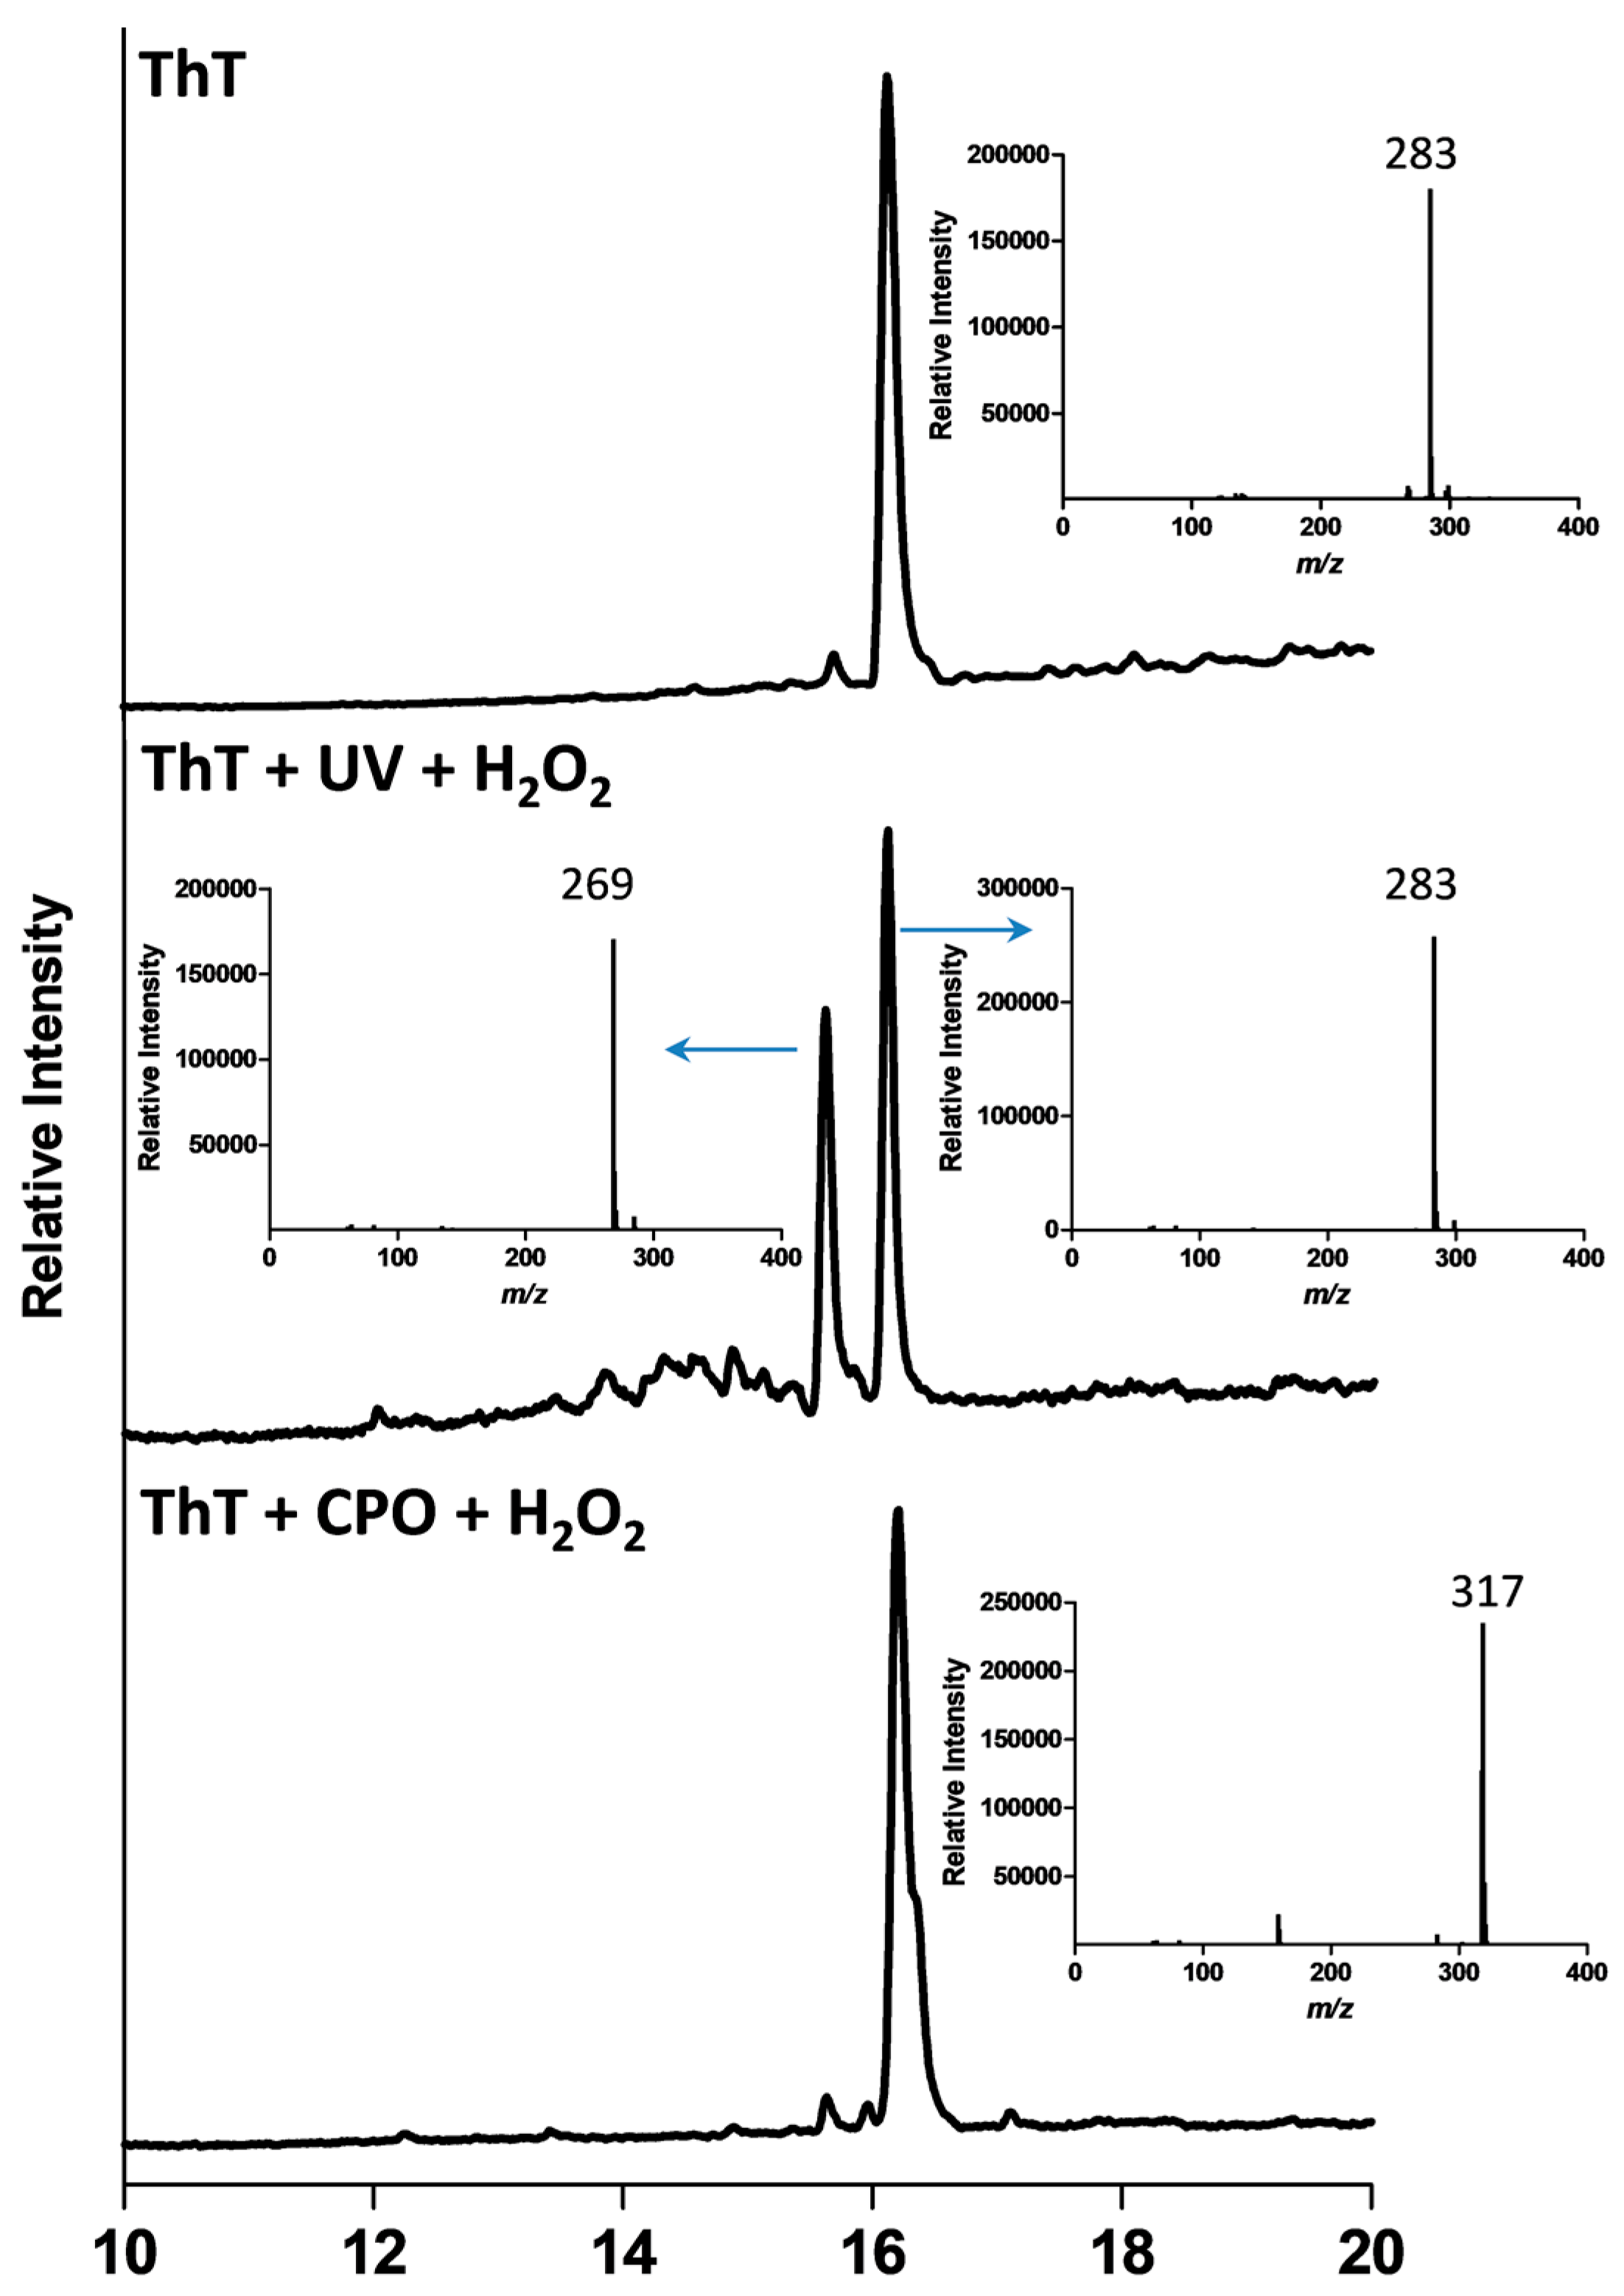
Figure 4.
Summary of the intermediates produced upon ThT degradation by UV + H2O2 and CPO + H2O2 processes. The asterisk (*) indicate intermediates whose structures are shown in Figure 6A,B.
Figure 4.
Summary of the intermediates produced upon ThT degradation by UV + H2O2 and CPO + H2O2 processes. The asterisk (*) indicate intermediates whose structures are shown in Figure 6A,B.

Figure 5.
Tandem mass spectrometry fragmentation analyses of proposed intermediates produced after ThT degradation by UV + H2O2 (m/z of 269, panel (A)) or CPO + H2O2 as shown in panels (A,B) (m/z of 289); (C) (m/z of 321) and (D) (m/z of 351).
Figure 5.
Tandem mass spectrometry fragmentation analyses of proposed intermediates produced after ThT degradation by UV + H2O2 (m/z of 269, panel (A)) or CPO + H2O2 as shown in panels (A,B) (m/z of 289); (C) (m/z of 321) and (D) (m/z of 351).

Figure 6.
(A) Proposed structures of some of the intermediates generated during the UV + H2O2-based degradation of ThT dye; (B) Proposed structures of some of the intermediates generated during the CPO + H2O2-based degradation of ThT dye. RT: retention time.
Figure 6.
(A) Proposed structures of some of the intermediates generated during the UV + H2O2-based degradation of ThT dye; (B) Proposed structures of some of the intermediates generated during the CPO + H2O2-based degradation of ThT dye. RT: retention time.

Figure 7.
ThT dye toxicity on Lactuca sativa seeds, as measured by the mean root lengths (cm) of seeds after treatment with ThT dye (25 ppm), ThT dye treated by UV + H2O2, or ThT dye treated by CPO + H2O2. Statistical analyses were performed using an unpaired t-test (n = 40); asterisk (*) denotes a significant difference (p < 0.05).


Table 1.
Peak area of intermediates produced during the degradation of ThT by UV + H2O2 and CPO + H2O2 processes.
Table 1.
Peak area of intermediates produced during the degradation of ThT by UV + H2O2 and CPO + H2O2 processes.
| Retention Time (min) | ThT + UV + H2O2 | ThT + CPO + H2O2 | ||
|---|---|---|---|---|
| m/z | Peak Area | m/z | Peak Area | |
| 14.35 | 288 | 24,398 | - | - |
| 14.86 | 255 | 161,335 | - | - |
| 15.11 | 297 | 70,562 | - | - |
| 15.39 | - | - | 289 | 27,169 |
| 15.64 | 269 | 1,216,238 | 269 | 300,854 |
| 15.97 | - | - | 303 | 190,007 |
| 16.11 | 283 | 1,789,254 | 283 | 249,499 |
| 16.19 | - | - | 317 | 6,147,872 |
| 16.21 | - | - | 321 | 138,735 |
| 16.38 | - | - | 361 | 639,968 |
| 17.11 | - | - | 351 | 81,812 |
| 17.27 | - | - | 397 | 9,472 |
© 2017 by the authors. Licensee MDPI, Basel, Switzerland. This article is an open access article distributed under the terms and conditions of the Creative Commons Attribution (CC BY) license (http://creativecommons.org/licenses/by/4.0/).
Share and Cite
MDPI and ACS Style
Al-Maqdi, K.A.; Hisaindee, S.M.; Rauf, M.A.; Ashraf, S.S. Comparative Degradation of a Thiazole Pollutant by an Advanced Oxidation Process and an Enzymatic Approach. Biomolecules 2017, 7, 64. https://doi.org/10.3390/biom7030064
AMA Style
Al-Maqdi KA, Hisaindee SM, Rauf MA, Ashraf SS. Comparative Degradation of a Thiazole Pollutant by an Advanced Oxidation Process and an Enzymatic Approach. Biomolecules. 2017; 7(3):64. https://doi.org/10.3390/biom7030064
Chicago/Turabian StyleAl-Maqdi, Khadega A., Soleiman M. Hisaindee, Muhammad A. Rauf, and Syed Salman Ashraf. 2017. "Comparative Degradation of a Thiazole Pollutant by an Advanced Oxidation Process and an Enzymatic Approach" Biomolecules 7, no. 3: 64. https://doi.org/10.3390/biom7030064
Note that from the first issue of 2016, this journal uses article numbers instead of page numbers. See further details here.