Protein Expression Profile of Twenty-Week-Old Diabetic db/db and Non-Diabetic Mice Livers: A Proteomic and Bioinformatic Analysis

Abstract
:1. Introduction
2. Results
3. Discussion
4. Materials and Methods
4.1. Animals
4.2. Sample Preparation and 2D-Polyacrylamide Gel Electrophoresis
4.3. Mass Spectrometry
4.4. Bioinformatics Analysis
5. Conclusions
Author Contributions
Acknowledgments
Conflicts of Interest
Abbreviations
| T2DM | Type 2 diabetes mellitus |
| IEF | Isoelectric focusing |
| STRING | Search Tool for the Retrieval of Interacting Genes/Proteins |
| DAVID | Database for Annotation, Visualization and Integrated Discovery |
| GO | Gene Ontology |
| BP | Biological Process |
| CC | Cellular Component |
| MF | Molecular Function |
| HCl | Hydrochloric acid |
| EDTA | Ethylenediaminetetraacetic acid |
| DTT | 1,4-Dithiothreitol |
| KEEG | Kyoto Encyclopedia of Genes and Genomes Pathway |
| PMSF | Phenylmethylsulfonyl fluoride |
| CHAPS | 3-[(3-Cholamidopropyl) dimethylammonio]-1-propanesulfonate hydrate |
| TBP | tributyl phosphine |
| IPG | Immobilized pH gradient |
| ANOVA | Analysis of variance |
| MALDI-TOF | matrix-assisted laser desorption/ionization Time-Of-Flight |
| UNIPROT | Universal Protein |
References
- Zimmet, P.; Alberti, K.G.; Magliano, D.J.; Bennett, P.H. Diabetes mellitus statistics on prevalence and mortality: Facts and fallacies. Nat. Rev. Endocrinol. 2016, 12, 616–622. [Google Scholar] [CrossRef] [PubMed]
- Alcalde-Rabanal, J.E.; Orozco-Nunez, E.; Espinosa-Henao, O.E.; Arredondo-Lopez, A.; Alcayde-Barranco, L. The complex scenario of obesity, diabetes and hypertension in the area of influence of primary healthcare facilities in mexico. PLoS ONE 2018, 13, e0187028. [Google Scholar] [CrossRef] [PubMed]
- Keith, B.P.; Robertson, D.L.; Hentges, K.E. Locus heterogeneity disease genes encode proteins with high interconnectivity in the human protein interaction network. Front. Genet. 2014, 5, 434. [Google Scholar] [CrossRef] [PubMed]
- Kontou, P.I.; Pavlopoulou, A.; Dimou, N.L.; Pavlopoulos, G.A.; Bagos, P.G. Network analysis of genes and their association with diseases. Gene 2016, 590, 68–78. [Google Scholar] [CrossRef] [PubMed]
- Perez-Vazquez, V.; Guzman-Flores, J.M.; Mares-Alvarez, D.; Hernandez-Ortiz, M.; Macias-Cervantes, M.H.; Ramirez-Emiliano, J.; Encarnacion-Guevara, S. Differential proteomic analysis of the pancreas of diabetic db/db mice reveals the proteins involved in the development of complications of diabetes mellitus. Int. J. Mol. Sci. 2014, 15, 9579–9593. [Google Scholar] [CrossRef] [PubMed]
- Ke, M.; Wu, H.; Zhu, Z.; Zhang, C.; Zhang, Y.; Deng, Y. Differential proteomic analysis of white adipose tissues from T2d KKAy mice by LC-ESI-QTOF. Proteomics 2017, 17. [Google Scholar] [CrossRef] [PubMed]
- Giebelstein, J.; Poschmann, G.; Hojlund, K.; Schechinger, W.; Dietrich, J.W.; Levin, K.; Beck-Nielsen, H.; Podwojski, K.; Stuhler, K.; Meyer, H.E.; et al. The proteomic signature of insulin-resistant human skeletal muscle reveals increased glycolytic and decreased mitochondrial enzymes. Diabetologia 2012, 55, 1114–1127. [Google Scholar] [CrossRef] [PubMed] [Green Version]
- Guo, Y.; Darshi, M.; Ma, Y.; Perkins, G.A.; Shen, Z.; Haushalter, K.J.; Saito, R.; Chen, A.; Lee, Y.S.; Patel, H.H.; et al. Quantitative proteomic and functional analysis of liver mitochondria from high fat diet (hfd) diabetic mice. Mol. Cell. Proteom. 2013, 12, 3744–3758. [Google Scholar] [CrossRef] [PubMed]
- Valle, A.; Catalan, V.; Rodriguez, A.; Rotellar, F.; Valenti, V.; Silva, C.; Salvador, J.; Fruhbeck, G.; Gomez-Ambrosi, J.; Roca, P.; et al. Identification of liver proteins altered by type 2 diabetes mellitus in obese subjects. Liver Int. 2012, 32, 951–961. [Google Scholar] [CrossRef] [PubMed]
- Chen, J.Y.; Chou, H.C.; Chen, Y.H.; Chan, H.L. High glucose-induced proteome alterations in hepatocytes and its possible relevance to diabetic liver disease. J. Nutr. Biochem. 2013, 24, 1889–1910. [Google Scholar] [CrossRef] [PubMed]
- Du, Y.; Cai, T.; Li, T.; Xue, P.; Zhou, B.; He, X.; Wei, P.; Liu, P.; Yang, F.; Wei, T. Lysine malonylation is elevated in type 2 diabetic mouse models and enriched in metabolic associated proteins. Mol. Cell. Proteom. 2015, 14, 227–236. [Google Scholar] [CrossRef] [PubMed]
- Pedersen, B.A.; Wang, W.; Taylor, J.F.; Khattab, O.S.; Chen, Y.H.; Edwards, R.A.; Yazdi, P.G.; Wang, P.H. Hepatic proteomic analysis revealed altered metabolic pathways in insulin resistant akt1(+/−)/akt2(−/−) mice. Metabolism 2015, 64, 1694–1703. [Google Scholar] [CrossRef] [PubMed]
- Holper, S.; Nolte, H.; Bober, E.; Braun, T.; Kruger, M. Dissection of metabolic pathways in the db/db mouse model by integrative proteome and acetylome analysis. Mol. Biosyst. 2015, 11, 908–922. [Google Scholar] [CrossRef] [PubMed]
- M Guzmán-Flores, J.; C Flores-Pérez, E.; Hernández-Ortíz, M.; López-Briones, S.; Ramírez-Emiliano, J.; Encarnación-Guevara, S.; Pérez-Vázquez, V. Comparative proteomics of liver of the diabetic obese db/db and non-obese or diabetic mice. Curr. Proteom. 2016, 13, 231–236. [Google Scholar] [CrossRef]
- Sharabi, K.; Tavares, C.D.; Rines, A.K.; Puigserver, P. Molecular pathophysiology of hepatic glucose production. Mol. Asp. Med. 2015, 46, 21–33. [Google Scholar] [CrossRef] [PubMed] [Green Version]
- Chatzigeorgiou, A.; Halapas, A.; Kalafatakis, K.; Kamper, E. The use of animal models in the study of diabetes mellitus. In Vivo 2009, 23, 245–258. [Google Scholar] [PubMed]
- Guarner, V.; Rubio-Ruiz, M.E. Low-grade systemic inflammation connects aging, metabolic syndrome and cardiovascular disease. Interdiscip. Top. Gerontol. 2015, 40, 99–106. [Google Scholar] [CrossRef] [PubMed]
- Lebel, M.; de Souza-Pinto, N.C.; Bohr, V.A. Metabolism, genomics, and DNA repair in the mouse aging liver. Curr. Gerontol. Geriatr. Res. 2011, 2011, 859415. [Google Scholar] [CrossRef] [PubMed]
- Fatima, F.; Nawaz, M. Long distance metabolic regulation through adipose-derived circulating exosomal mirnas: A trail for rna-based therapies? Front. Physiol. 2017, 8, 545. [Google Scholar] [CrossRef] [PubMed]
- Chung, S.T.; Hsia, D.S.; Chacko, S.K.; Rodriguez, L.M.; Haymond, M.W. Increased gluconeogenesis in youth with newly diagnosed type 2 diabetes. Diabetologia 2015, 58, 596–603. [Google Scholar] [CrossRef] [PubMed]
- Visinoni, S.; Khalid, N.F.; Joannides, C.N.; Shulkes, A.; Yim, M.; Whitehead, J.; Tiganis, T.; Lamont, B.J.; Favaloro, J.M.; Proietto, J.; et al. The role of liver fructose-1,6-bisphosphatase in regulating appetite and adiposity. Diabetes 2012, 61, 1122–1132. [Google Scholar] [CrossRef] [PubMed]
- Srinivasan, K.; Ramarao, P. Animal models in type 2 diabetes research: An overview. Indian J. Med. Res. 2007, 125, 451–472. [Google Scholar] [PubMed]
- Amano, S.; Yamagishi, S.; Kato, N.; Inagaki, Y.; Okamoto, T.; Makino, M.; Taniko, K.; Hirooka, H.; Jomori, T.; Takeuchi, M. Sorbitol dehydrogenase overexpression potentiates glucose toxicity to cultured retinal pericytes. Biochem. Biophys. Res. Commun. 2002, 299, 183–188. [Google Scholar] [CrossRef]
- Hagopian, K.; Ramsey, J.J.; Weindruch, R. Caloric restriction counteracts age-related changes in the activities of sorbitol metabolizing enzymes from mouse liver. Biogerontology 2009, 10, 471–479. [Google Scholar] [CrossRef] [PubMed]
- Havel, P.J. Dietary fructose: Implications for dysregulation of energy homeostasis and lipid/carbohydrate metabolism. Nutr. Rev. 2005, 63, 133–157. [Google Scholar] [CrossRef] [PubMed]
- Chen, X.; Wei, S.; Yang, F. Mitochondria in the pathogenesis of diabetes: A proteomic view. Protein Cell 2012, 3, 648–660. [Google Scholar] [CrossRef] [PubMed]
- Newsholme, P.; Abdulkader, F.; Rebelato, E.; Romanatto, T.; Pinheiro, C.H.; Vitzel, K.F.; Silva, E.P.; Bazotte, R.B.; Procopio, J.; Curi, R.; et al. Amino acids and diabetes: Implications for endocrine, metabolic and immune function. Front. Biosci. 2011, 16, 315–339. [Google Scholar] [CrossRef]
- Tessari, P.; Cecchet, D.; Cosma, A.; Puricelli, L.; Millioni, R.; Vedovato, M.; Tiengo, A. Insulin resistance of amino acid and protein metabolism in type 2 diabetes. Clin. Nutr. 2011, 30, 267–272. [Google Scholar] [CrossRef] [PubMed]
- Vogel, A.; van Den Berg, I.E.; Al-Dhalimy, M.; Groopman, J.; Ou, C.N.; Ryabinina, O.; Iordanov, M.S.; Finegold, M.; Grompe, M. Chronic liver disease in murine hereditary tyrosinemia type 1 induces resistance to cell death. Hepatology 2004, 39, 433–443. [Google Scholar] [CrossRef] [PubMed] [Green Version]
- Schattenberg, J.M.; Schuchmann, M. Diabetes and apoptosis: Liver. Apoptosis 2009, 14, 1459–1471. [Google Scholar] [CrossRef] [PubMed]
- Nishikawa, T.; Araki, E. Impact of mitochondrial ros production in the pathogenesis of diabetes mellitus and its complications. Antioxid. Redox Signal. 2007, 9, 343–353. [Google Scholar] [CrossRef] [PubMed]
- Tang, Z.; Xia, N.; Yuan, X.; Zhu, X.; Xu, G.; Cui, S.; Zhang, T.; Zhang, W.; Zhao, Y.; Wang, S.; et al. Prdx1 is involved in palmitate induced insulin resistance via regulating the activity of p38mapk in hepg2 cells. Biochem. Biophys. Res. Commun. 2015, 465, 670–677. [Google Scholar] [CrossRef] [PubMed]
- Magnusson, M.; Wang, T.J.; Clish, C.; Engstrom, G.; Nilsson, P.; Gerszten, R.E.; Melander, O. Dimethylglycine deficiency and the development of diabetes. Diabetes 2015, 64, 3010–3016. [Google Scholar] [CrossRef] [PubMed]
- Martini, L.A.; Catania, A.S.; Ferreira, S.R. Role of vitamins and minerals in prevention and management of type 2 diabetes mellitus. Nutr. Rev. 2010, 68, 341–354. [Google Scholar] [CrossRef] [PubMed]
- Juwono, J.; Martinus, R.D. Does hsp60 provide a link between mitochondrial stress and inflammation in diabetes mellitus? J. Diabetes Res. 2016, 2016, 8017571. [Google Scholar] [CrossRef] [PubMed]
- Guzman-Flores, J.M.; Lopez-Briones, S. Cells of innate and adaptive immunity in type 2 diabetes and obesity. Gac. Med. Mex. 2012, 148, 381–389. [Google Scholar] [PubMed]
- Jimenez-Flores, L.M.; Lopez-Briones, S.; Macias-Cervantes, M.H.; Ramirez-Emiliano, J.; Perez-Vazquez, V. A ppargamma, nf-kappab and ampk-dependent mechanism may be involved in the beneficial effects of curcumin in the diabetic db/db mice liver. Molecules 2014, 19, 8289–8302. [Google Scholar] [CrossRef] [PubMed]
- Pardo, F.N.; Altirriba, J.; Pradas-Juni, M.; Garcia, A.; Ahlgren, U.; Barbera, A.; Slebe, J.C.; Yanez, A.J.; Gomis, R.; Gasa, R. The role of raf-1 kinase inhibitor protein in the regulation of pancreatic beta cell proliferation in mice. Diabetologia 2012, 55, 3331–3340. [Google Scholar] [CrossRef] [PubMed]
- Xie, W.; Wood, A.R.; Lyssenko, V.; Weedon, M.N.; Knowles, J.W.; Alkayyali, S.; Assimes, T.L.; Quertermous, T.; Abbasi, F.; Paananen, J.; et al. Genetic variants associated with glycine metabolism and their role in insulin sensitivity and type 2 diabetes. Diabetes 2013, 62, 2141–2150. [Google Scholar] [CrossRef] [PubMed] [Green Version]
- Maumus, S.; Marie, B.; Vincent-Viry, M.; Siest, G.; Visvikis-Siest, S. Analysis of the effect of multiple genetic variants of cardiovascular disease risk on insulin concentration variability in healthy adults of the stanislas cohort. The role of fgb-455 g/a polymorphism. Atherosclerosis 2007, 191, 369–376. [Google Scholar] [CrossRef] [PubMed]
- Choi, C.S.; Ghoshal, P.; Srinivasan, M.; Kim, S.; Cline, G.; Patel, M.S. Liver-specific pyruvate dehydrogenase complex deficiency upregulates lipogenesis in adipose tissue and improves peripheral insulin sensitivity. Lipids 2010, 45, 987–995. [Google Scholar] [CrossRef] [PubMed]
- Samuel, V.T.; Shulman, G.I. The pathogenesis of insulin resistance: Integrating signaling pathways and substrate flux. J. Clin. Investig. 2016, 126, 12–22. [Google Scholar] [CrossRef] [PubMed]
- Chen, H.S.; Wu, T.E.; Juan, C.C.; Lin, H.D. Myocardial heat shock protein 60 expression in insulin-resistant and diabetic rats. J. Endocrinol. 2009, 200, 151–157. [Google Scholar] [CrossRef] [PubMed]
- Yamaguchi, M.; Murata, T. Involvement of regucalcin in lipid metabolism and diabetes. Metabolism 2013, 62, 1045–1051. [Google Scholar] [CrossRef] [PubMed]
- Kutmon, M.; Evelo, C.T.; Coort, S.L. A network biology workflow to study transcriptomics data of the diabetic liver. BMC Genom. 2014, 15, 971. [Google Scholar] [CrossRef] [PubMed]
- UniProt, C. Uniprot: A hub for protein information. Nucleic Acids Res. 2015, 43, D204–D212. [Google Scholar] [CrossRef]
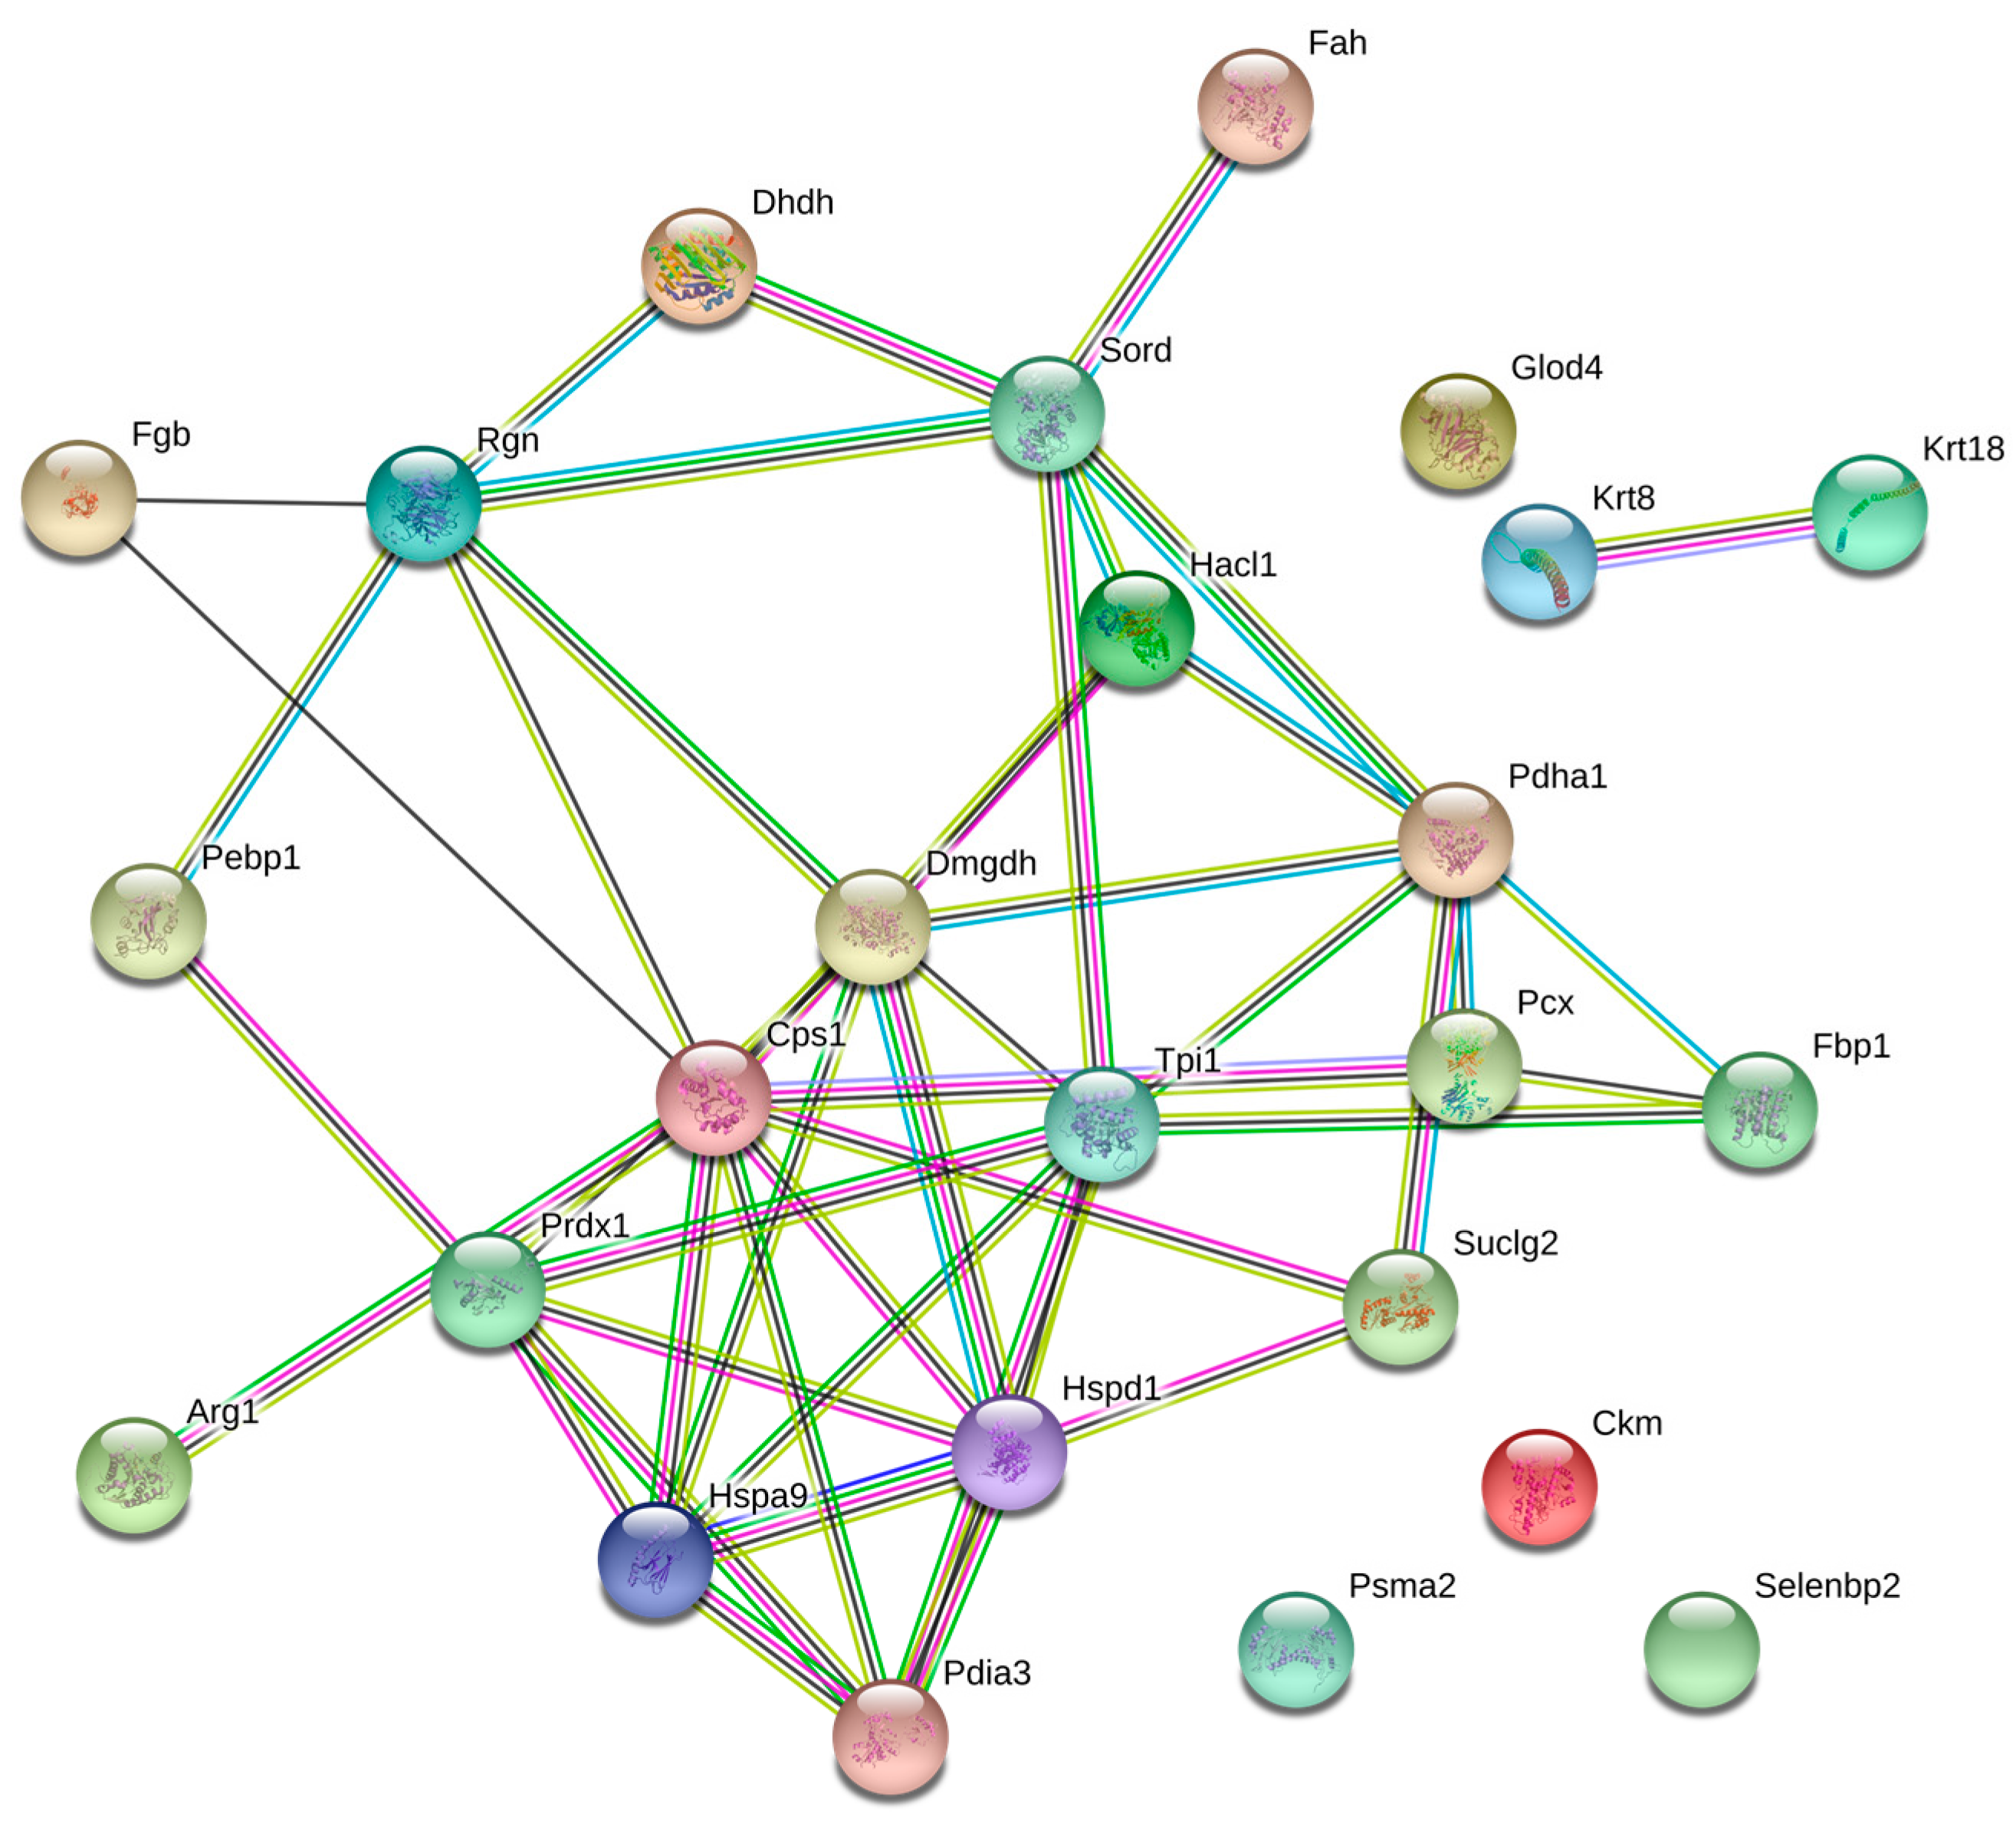
- Szklarczyk, D.; Morris, J.H.; Cook, H.; Kuhn, M.; Wyder, S.; Simonovic, M.; Santos, A.; Doncheva, N.T.; Roth, A.; Bork, P.; et al. The string database in 2017: Quality-controlled protein-protein association networks, made broadly accessible. Nucleic Acids Res. 2017, 45, D362–D368. [Google Scholar] [CrossRef] [PubMed]
- Huang, D.W.; Sherman, B.T.; Lempicki, R.A. Systematic and integrative analysis of large gene lists using david bioinformatics resources. Nat. Protoc. 2009, 4, 44–57. [Google Scholar] [CrossRef] [PubMed]


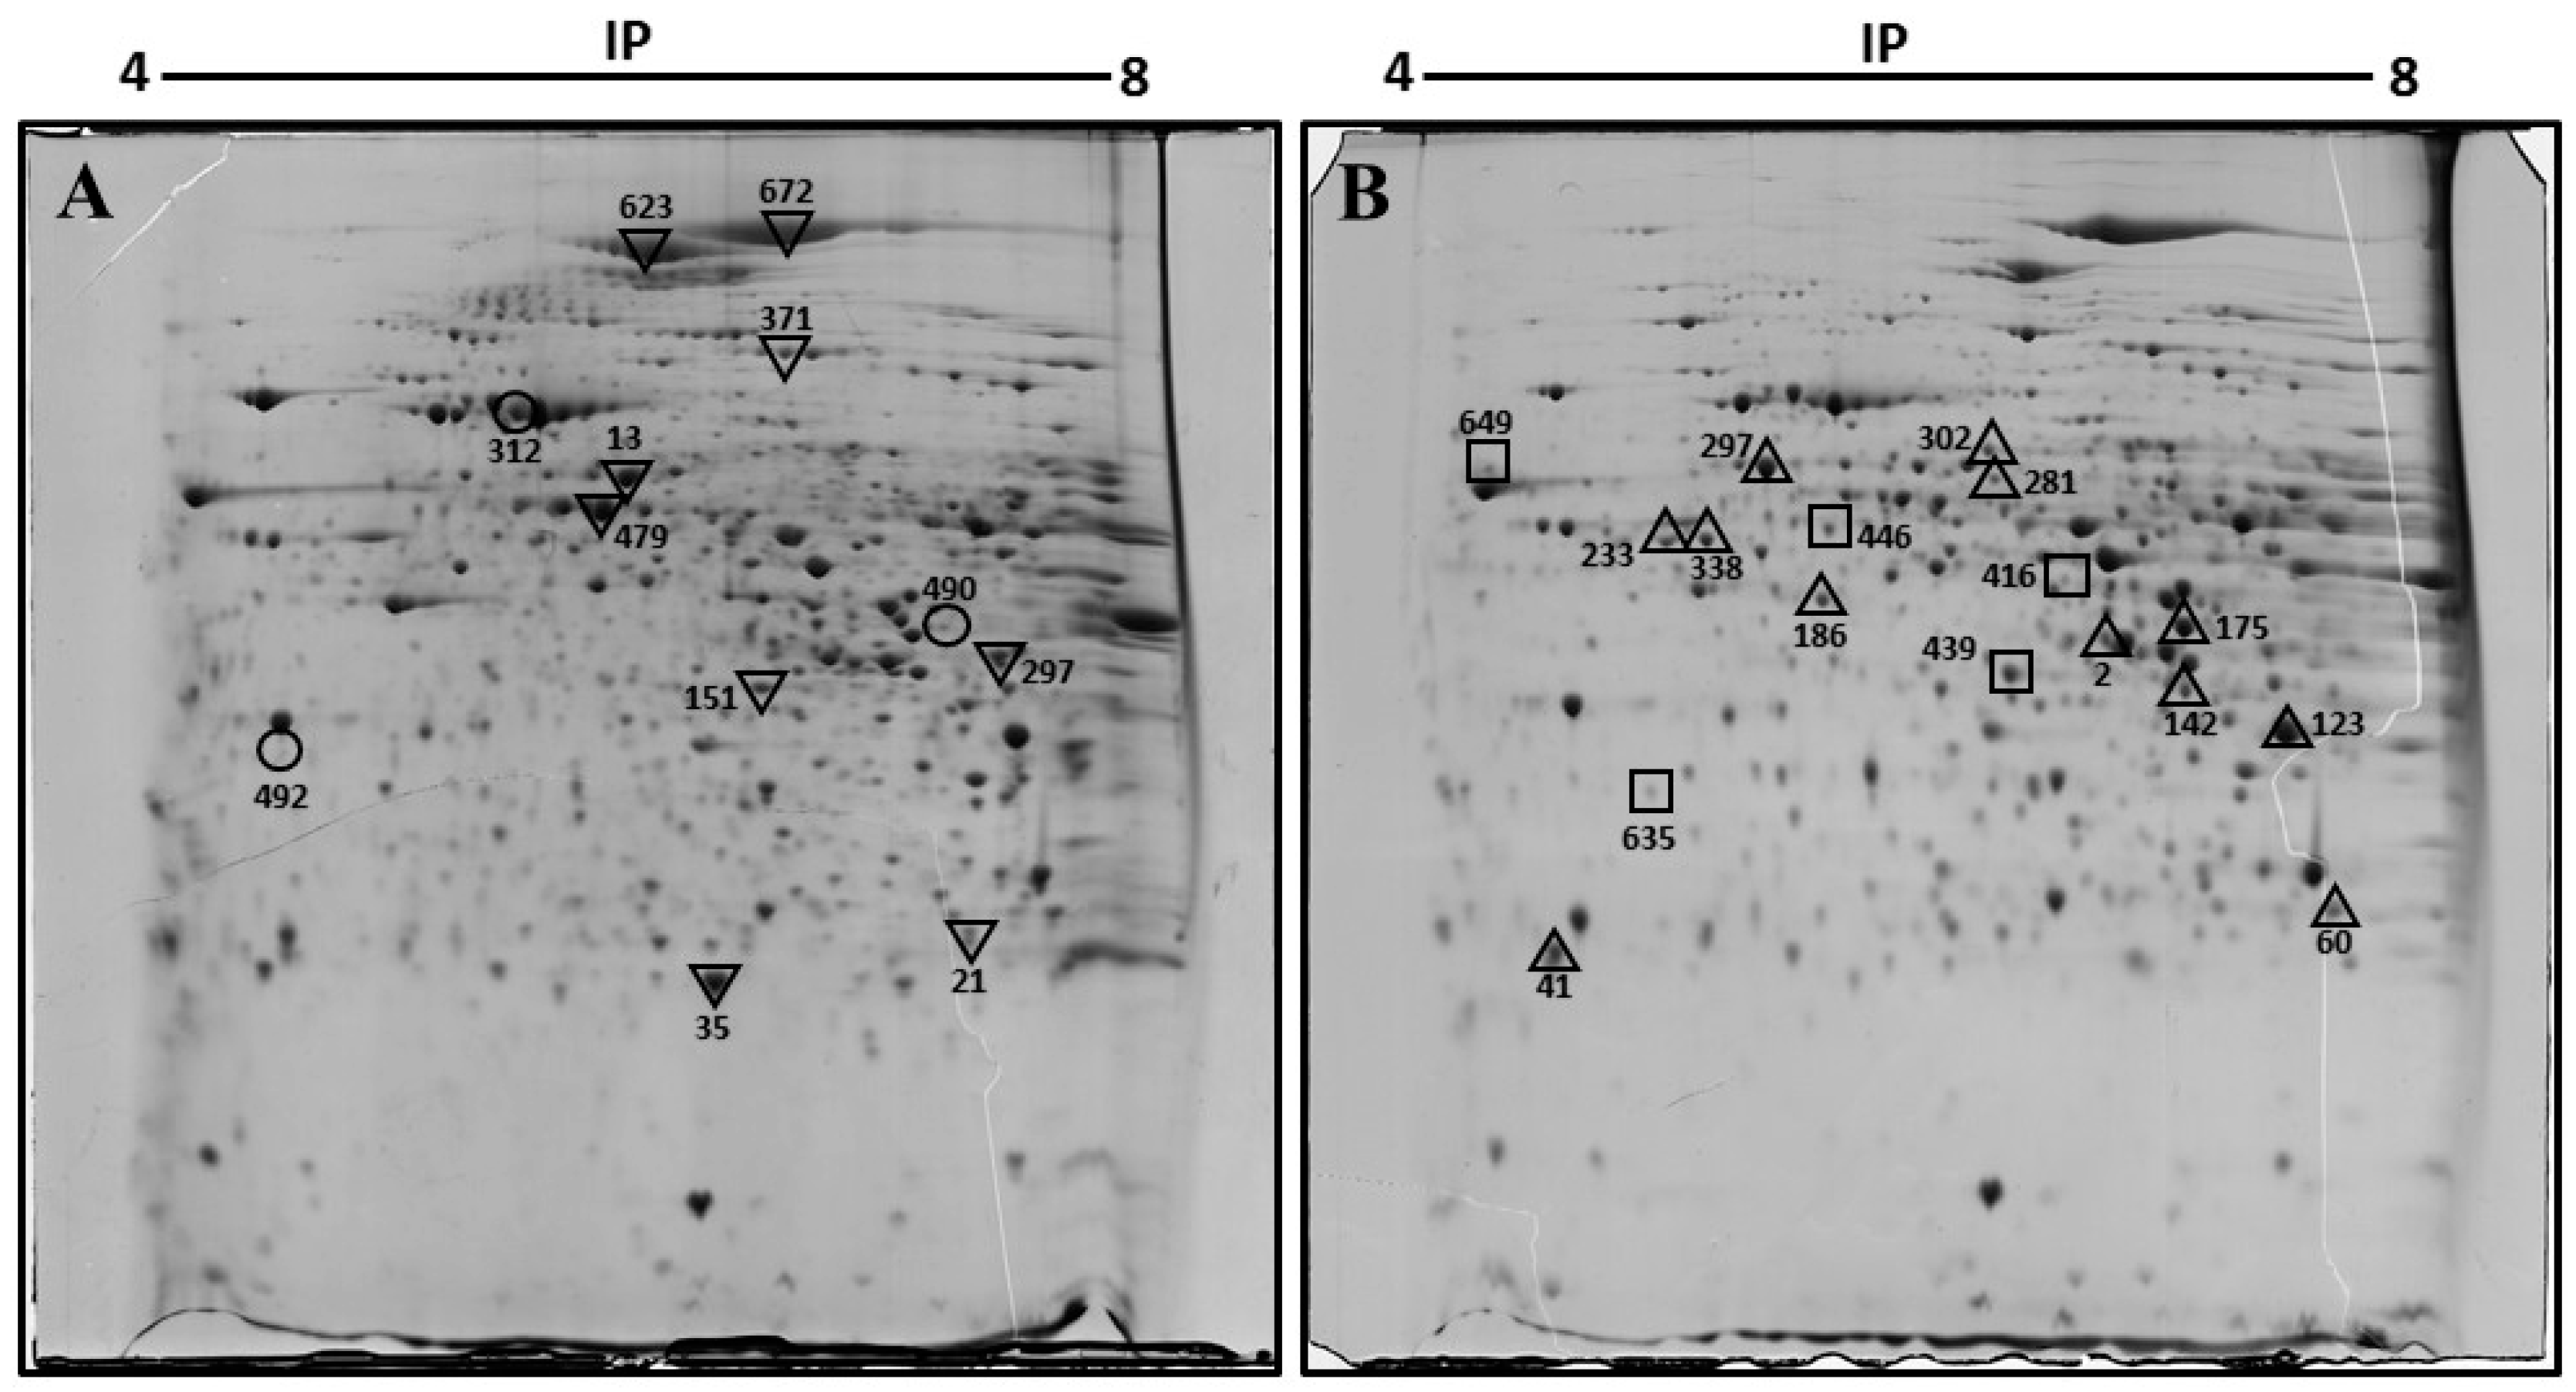
| Spot Number | Protein Name | Gene Name | UniProt Accession | Mascot Score | Sequence Coverage (%) | pI | Fold Change | Function |
|---|---|---|---|---|---|---|---|---|
| 297 | 60 kDa heat shock protein, mitochondrial | Hspd1 | P63038 | 140 | 33 | 5.91 | +7.1 | Macromolecular assembly |
| 302 | 2-hydroxyacyl-CoA lyase 1 | Hacl1 | Q9QXE0 | 68 | 17 | 5.89 | +3.3 | Lipid metabolism |
| 281 | Fibrinogen beta chain | Fgb | Q8K0E8 | 127 | 37 | 6.68 | +2.5 | Coagulation and immunity |
| 233, 338 | Keratin, type I cytoskeletal 18 | Krt18 | P05784 | 147 | 28 | 5.22 | +5.4 | Filament reorganization |
| 123 | Keratin, type II cytoskeletal 8 | Krt8 | P11679 | 205 | 47 | 5.70 | +1.7 | Cell structure |
| 186 | Succinyl-CoA ligase [GDP-forming] subunit beta, mitochondrial | Suclg2 | Q9Z2I8 | 136 | 35 | 6.58 | +4.2 | Citrate cycle |
| 2 | Sorbitol dehydrogenase | Sord | Q64442 | 69 | 33 | 6.60 | +1.7 | Fructose metabolism |
| 17 | Fumarylacetoacetase | Fah | P35505 | 100 | 27 | 6.70 | +2.4 | Amino-acid degradation |
| 60 | Triosephosphate isomerase | Tpi1 | P17751 | 128 | 33 | 6.90 | +2.7 | Gluconeogenesis |
| 41 | Phosphatidylethanolamine-binding protein 1 | Pebp1 | P70296 | 75 | 51 | 5.19 | +2.2 | Binds ATP |
| 142 | Arginase-1 | Arg1 | Q61176 | 91 | 46 | 6.60 | +2.50 | Urea cycle |
| 416 | Pyruvate dehydrogenase E1 component subunit alpha, somatic form, mitochondrial | Pdha1 | P35486 | 118 | 9.40 | Novo | Citrate cycle | |
| 439 | Trans-1,2-dihydrobenzene-1,2-diol dehydrogenase | Dhdh | Q9DBB8 | 120 | 36 | 6.03 | Novo | Oxidoreductase |
| 635 | Glyoxalase domain-containing protein 4 | Glod4 | Q9CPV4 | 166 | 48 | 5.28 | Novo | Detoxification |
| 623 | Pyruvate carboxylase, mitochondrial | Pcx | Q05920 | 128 | 23 | 6.25 | −4.1 | Citrate cycle |
| 672 | Carbamoyl-phosphate synthase [ammonia], mitochondrial | Cps1 | Q8C196 | 159 | 17 | 6.48 | −4.6 | Urea cycle |
| 371 | Dimethylglycine dehydrogenase, mitochondrial | Dmgdh | Q9DBT9 | 172 | 26 | 7.60 | −5.6 | Amine degradation |
| 13 | Protein disulfide-isomerase A3 | Pdia3 | P27773 | 124 | 35 | 5.88 | −2.1 | Apoptosis |
| 479 | Selenium-binding protein 2 | Selenbp2 | Q63836 | 119 | 38 | 5.78 | −2.1 | Protein transport |
| 151 | Fructose-1,6-bisphosphatase 1 | Fbp1 | Q9QXD6 | 88 | 24 | 6.15 | −2.2 | Gluconeogenesis |
| 35 | Peroxiredoxin-1 | Prdx1 | P35700 | 207 | 51 | 8.26 | −6.1 | Oxidoreductase |
| 21 | Proteasome subunit alpha type-2 | Psma2 | P49722 | 71 | 35 | 8.39 | −2.5 | Protease |
| 312 | Stress-70 protein, mitochondrial | Hspa9 | P38647 | 98 | 20 | 5.80 | D | Chaperone |
| 492 | Regucalcin | Rgn | Q64374 | 73 | 36 | 5.00 | D | Biosynthesis vitamin c |
| 490 | Creatine kinase M-type | Ckm | P07310 | 100 | 34 | 6.60 | D | ATP-binding |
| GO/Pathway Name | p Value | Genes | |
|---|---|---|---|
| BP 1 | GO:0006006/Glucose metabolic process | 1.6 × 10⁻³ | Fbp1, Pcx, Pdha1, Tpi1 |
| BP | GO:0043603/Cellular amide metabolic process | 2 × 10⁻³ | Arg1, Cps1, Tpi1 |
| BP | GO:0009064/Glutamine family amino acid metabolic process | 2.4 × 10⁻³ | Arg1, Cps1, Fah |
| BP | GO:0046395/Carboxylic acid catabolic process | 8.2 × 10⁻³ | Hacl1, Dmgdh, Fah |
| BP | GO:0055114/Oxidation-reduction process | 2.5 × 10⁻² | Dhdh, Dmgdh, Prdx1, Pdha1, Sord |
| CC 2 | GO:0005739/Mitochondrion | 2.5 × 10⁻⁴ | Cps1, Dmgdh, Glod4, Hspa9, Prdx1, Hspd1, Pcx, Pdha1, Suclg2 |
| CC | GO:0005759/Mitochondrial matrix | 2.3 × 10⁻² | Hspd1, Pcx, Pdha1 |
| MF 3 | GO:0001883/Purine nucleoside binding | 1.3 × 10⁻² | Cps1, Ckm, Dmgdh, Hspa9, Pebp1, Hspd1, Pcx, Suclg2 |
| MF | GO:0019842/Vitamin binding | 1.8 × 10⁻² | Hacl1, Dmgdh, Pcx |
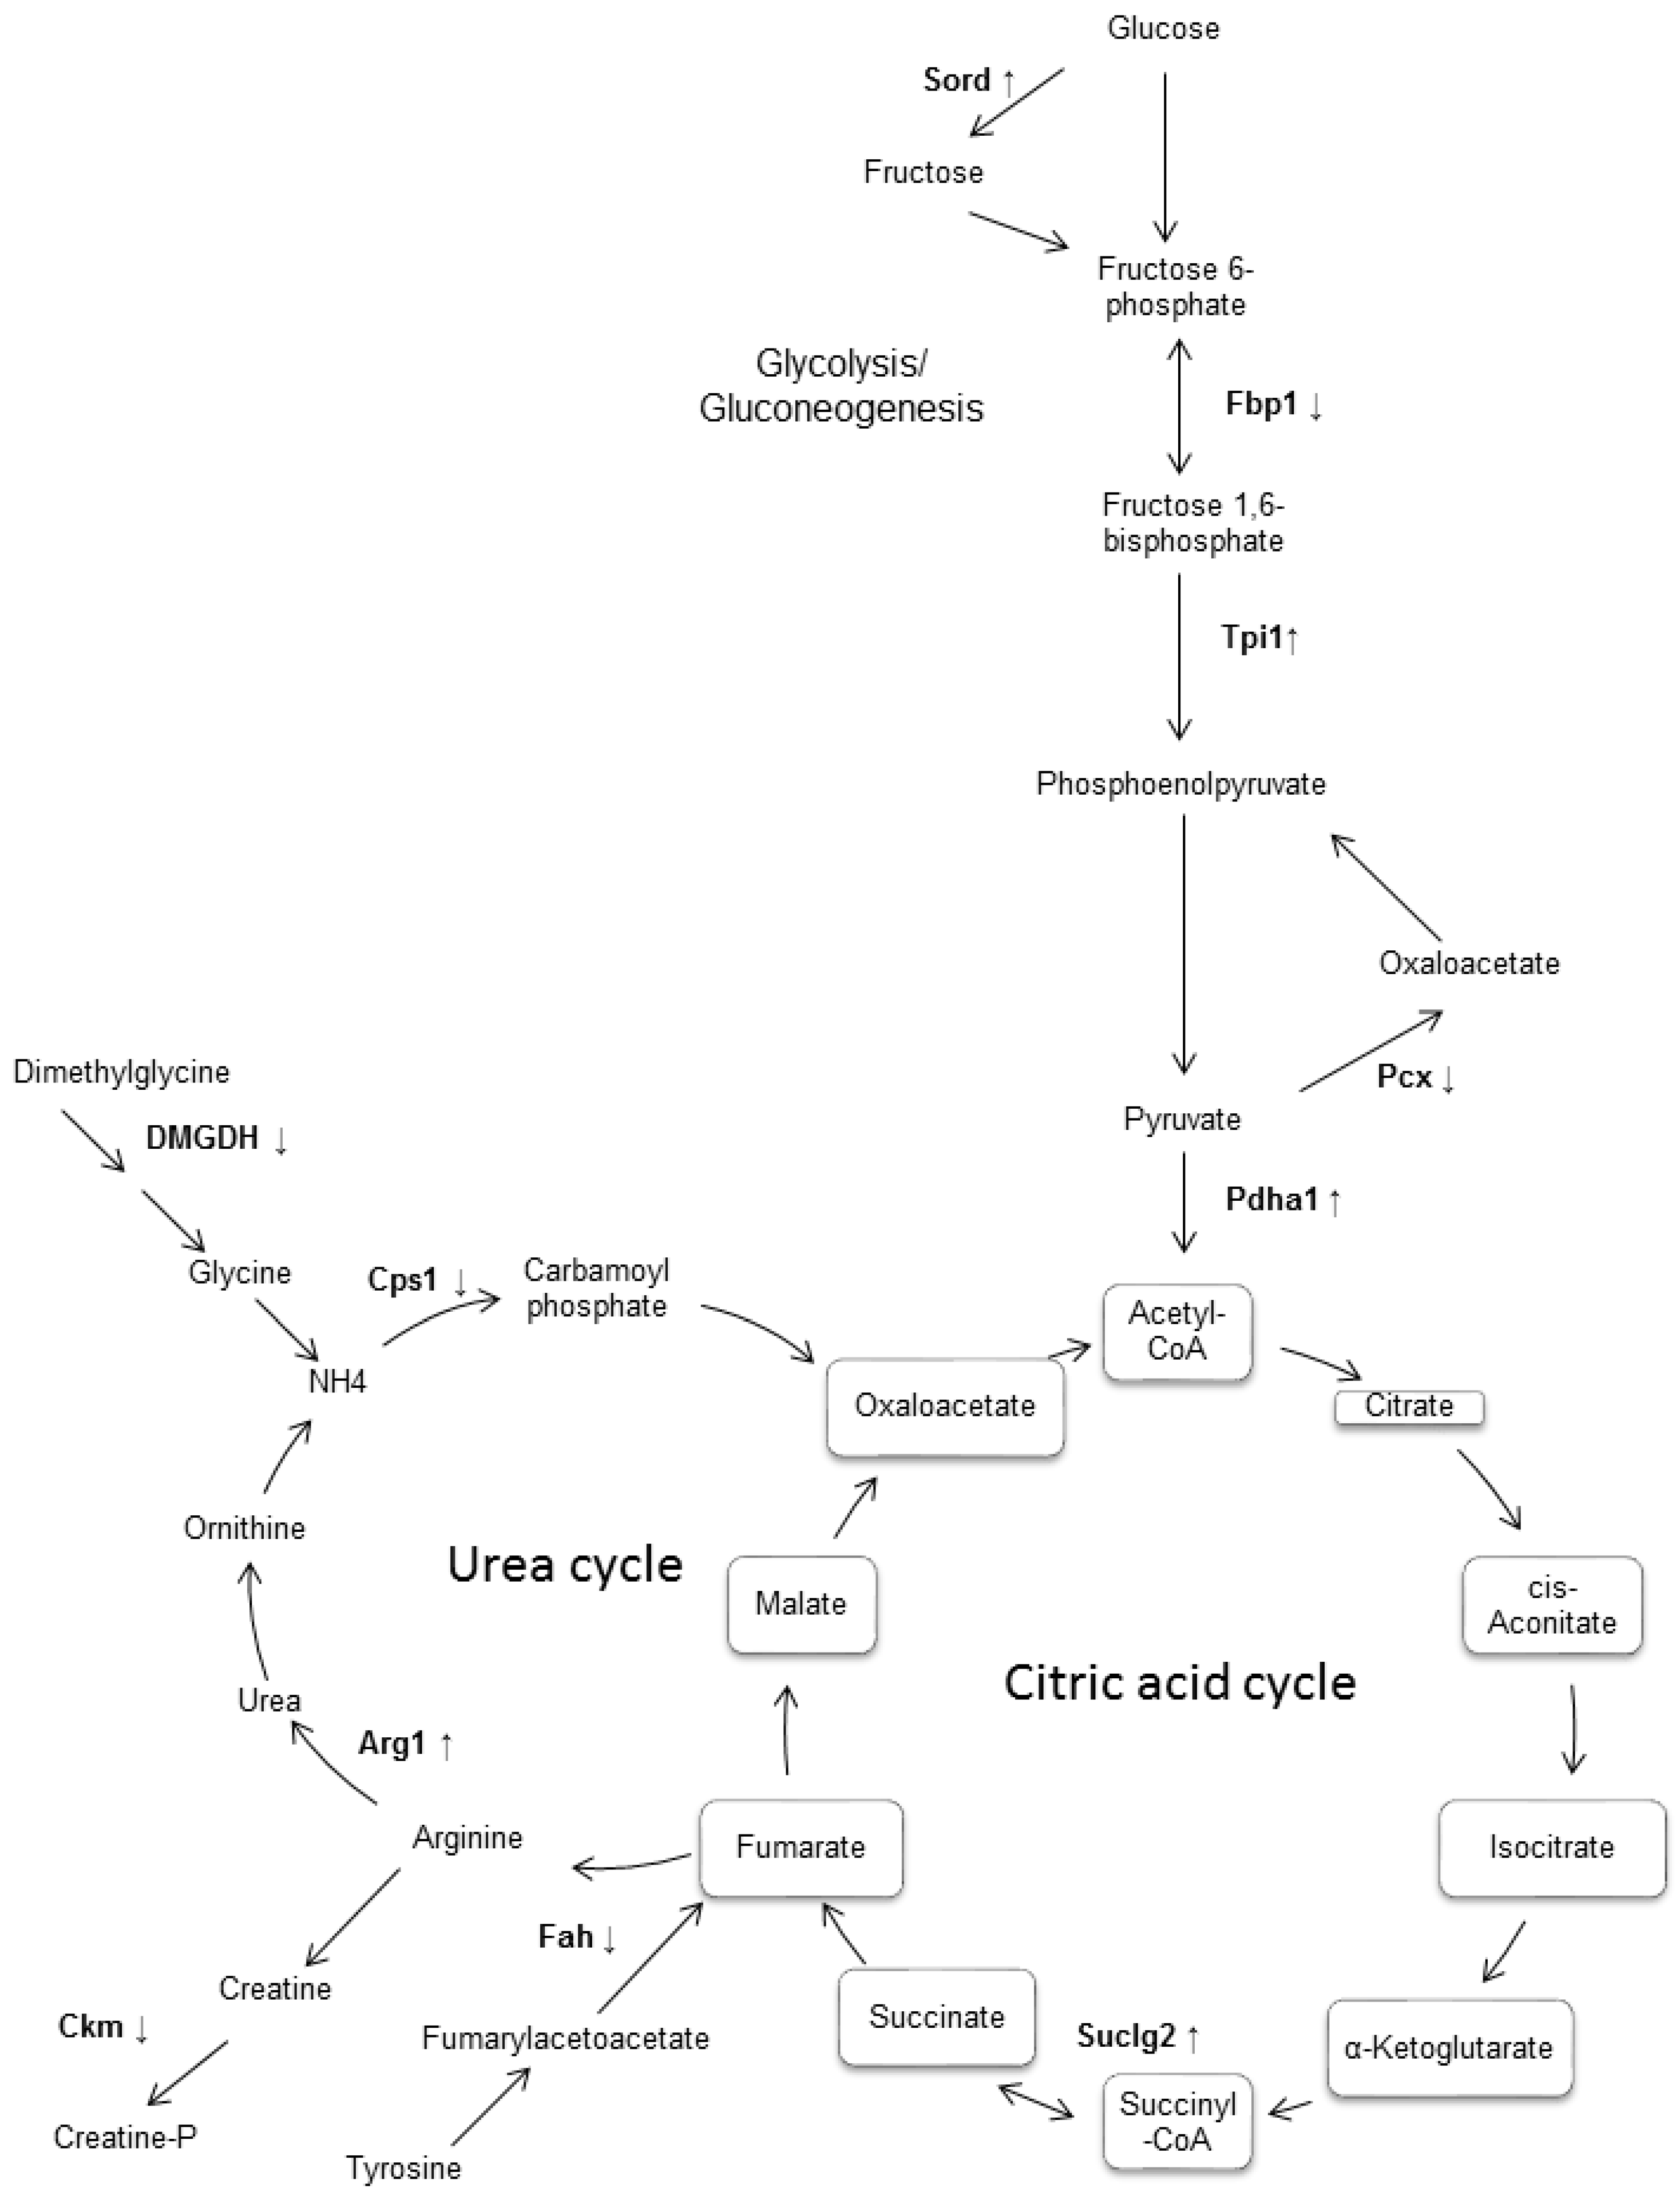
| KEGG 4 | mmu00020/Citrate cycle (TCA cycle) | 3.2 × 10⁻³ | Pcx, Pdha1, Suclg2 |
| KEGG | mmu00051/Fructose and mannose metabolism | 4.6 × 10⁻³ | Fbp1, Sord, Tpi1 |
| KEGG | mmu00330/Arginine and proline metabolism | 9.2 × 10⁻³⁴ | Arg1, Cps1, Ckm |
| KEGG | mmu00010/Glycolysis/Gluconeogenesis | 1.5 × 10⁻² | Fbp1, Pdha1, Tpi1 |
© 2018 by the authors. Licensee MDPI, Basel, Switzerland. This article is an open access article distributed under the terms and conditions of the Creative Commons Attribution (CC BY) license (http://creativecommons.org/licenses/by/4.0/).
Share and Cite
Guzmán-Flores, J.M.; Flores-Pérez, E.C.; Hernández-Ortiz, M.; Vargas-Ortiz, K.; Ramírez-Emiliano, J.; Encarnación-Guevara, S.; Pérez-Vázquez, V. Protein Expression Profile of Twenty-Week-Old Diabetic db/db and Non-Diabetic Mice Livers: A Proteomic and Bioinformatic Analysis. Biomolecules 2018, 8, 35. https://doi.org/10.3390/biom8020035
Guzmán-Flores JM, Flores-Pérez EC, Hernández-Ortiz M, Vargas-Ortiz K, Ramírez-Emiliano J, Encarnación-Guevara S, Pérez-Vázquez V. Protein Expression Profile of Twenty-Week-Old Diabetic db/db and Non-Diabetic Mice Livers: A Proteomic and Bioinformatic Analysis. Biomolecules. 2018; 8(2):35. https://doi.org/10.3390/biom8020035
Chicago/Turabian StyleGuzmán-Flores, Juan Manuel, Elsa Cristina Flores-Pérez, Magdalena Hernández-Ortiz, Katya Vargas-Ortiz, Joel Ramírez-Emiliano, Sergio Encarnación-Guevara, and Victoriano Pérez-Vázquez. 2018. "Protein Expression Profile of Twenty-Week-Old Diabetic db/db and Non-Diabetic Mice Livers: A Proteomic and Bioinformatic Analysis" Biomolecules 8, no. 2: 35. https://doi.org/10.3390/biom8020035