Building a ROS-Based Testbed for Realistic Multi-Robot Simulation: Taking the Exploration as an Example


1
Le2i Laboratory, University of Technology of Belfort-Montbéliard (UTBM), 90010 Belfort, France
2
CAR Team, IMT Lille Douai, 59500 Douai, France
3
DISP Laboratory, University Lyon 2, 69007 Lyon, France
*
Author to whom correspondence should be addressed.
Robotics 2017, 6(3), 21; https://doi.org/10.3390/robotics6030021
Submission received: 9 August 2017
/
Revised: 8 September 2017
/
Accepted: 11 September 2017
/
Published: 12 September 2017
Abstract
:While the robotics community agrees that the benchmarking is of high importance to objectively compare different solutions, there are only few and limited tools to support it. To address this issue in the context of multi-robot systems, we have defined a benchmarking process based on experimental designs, which aimed at improving the reproducibility of experiments by making explicit all elements of a benchmark such as parameters, measurements and metrics. We have also developed a ROS (Robot Operating System)-based testbed with the goal of making it easy for users to validate, benchmark, and compare different algorithms including coordination strategies. Our testbed uses the MORSE (Modular OpenRobots Simulation Engine) simulator for realistic simulation and a computer cluster for decentralized computation. In this paper, we present our testbed in details with the architecture and infrastructure, the issues encountered in implementing the infrastructure, and the automation of the deployment. We also report a series of experiments on multi-robot exploration, in order to demonstrate the capabilities of our testbed.
1. Introduction
Many robotic applications can benefit from using a fleet of robots instead of relying on a single robot [1]. Indeed, having multiple robots means an increase of robustness through redundancy. Besides, multiple robots can perform tasks in parallel and thus speed up the execution time, which can ultimately improve system performance. The latter is extremely important for some applications such as search and rescue after earthquakes, fire searching inside buildings, and humanitarian mine clearance.
However, the use of multi-robot systems raises the coordination challenges [2]. To truly benefit from the potential parallelism of a robotic fleet, we need some strategies to organize robot activities in a way that ensures robust, long-term highest-performance operation. Unfortunately, building optimal or near-optimal coordination strategies is not straightforward. This is why there is substantial effort put by the research community to address instances of this problem such as the multi-robot exploration and mapping [3,4,5,6,7,8,9,10,11,12,13].
This paper also takes the exploration and mapping of an unknown environment (see Figure 1) as a specific instantiation, with which we can test our solution in an actual application. A coordination strategy of such application may be to assign to each robot, a set of areas to explore in a way that tends to minimize both the time required to build an environment map and the total energy consumed by the robotic fleet [14]. Nevertheless, there are many other possible strategies and it is a curse when people need to choose the most appropriate one for a specific application in a given environment and with some particular set of robots. Moreover, strategies were usually evaluated with different robots, simulators, environments and conditions, leading to quantitatively incomparable of results presented in different papers.
Comparing different approaches is a facet of the broader issue of evaluating and benchmarking robotic systems [15,16,17]. Regarding benchmarking of multi-robot systems, realistic simulations have many advantages over experiments with actual robots. On the one hand, simulations are repeatable, faster to deploy, and can be fully automatic, which enable a wide comparison of different algorithms with different setups (e.g., robots types, fleet sizes, environments). On the other hand, experiments run on actual robots can be very expensive, especially in the case of large-scale fleets.
From our point of view, a simulation testbed for multi-robot systems is nowadays crucial to rapidly reproduce experiments. Moreover, simulated environments as realistic as possible are necessary in order to get reliable results and truly compare different coordination strategies under different conditions. Some key topics include ensuring robot control software run at the same rate as in the real world [18], and making the communication in simulation more realistic for networked multi-robot systems [19]. In any case, simulations are eventually used to prepare the tests in the real world. The community has been working at developing simulators that can accurately simulate real world environments. Some representative projects are Stage [20], Webots [21], V-REP [22], Gazebo [23] and MORSE [24].
In this paper, we report our experience on building a testbed using:
- the ROS middleware [25] to build robot control software,
- the MORSE simulator to provide highly realistic 3D simulation environments,
- and a computer cluster to support large-scale robot simulation.
Our testbed is developed with the intention to provide the community with a reproducible framework for easily benchmarking different algorithms for multi-robot systems. Specifically,
- ROS is an open-source meta-operating system, which is nowadays acknowledged as a standard robot software platform and is widely spread throughout the research community,
- MORSE is an open-source simulator and independent of any robot architecture and communication framework, implemented with a realistic 3D physics engine, and
- computer cluster running open-source Unix-like operating system is available or easy to build in numerous institutions.
We released our simulation scenarios, developed ROS packages, and scripts for autonomous deployment of the testbed infrastructure and experiments, also as open-source, available at https://github.com/yzrobot/mrs_testbed.
Moreover, our testbed is simulator-independent. One can use Stage or Gazebo instead of MORSE without any modifications on the robot side, since the simulator in our testbed is considered to be a ROS node (http://wiki.ros.org/Nodes). The testbed is also real-world prepared. ROS provides modularity that uncouples the control software from the drivers of the robot body. This feature allows us to use exactly the same control software in simulations and in real robot experiments. Two videos, respectively showing simulation and real robot experiments, are also available on the aforementioned website.
The contributions of this paper are twofold. First, we describe the current architecture of our testbed for benchmarking multi-robot systems, discuss the trade-offs of this architecture, and report different design decisions we have made to being able to use the shared computer cluster in our university. Second, an experiment must be reproducible so we argue that the experimental design needs to be explicitly and clearly defined, including parameters and metrics. Parameters influence the experimental results, which must be fixed for a single experimental run. The experimental design should then define how many runs need to be done and what are the values of the parameters for each run. On the other hand, a set of metrics needs to be well defined in order to properly evaluate the performance of the algorithms. For example, in multi-robot exploration experiments, the exploration time can be served as one of the metrics to evaluate the performance of the coordinated exploration strategy. However, other metrics related to computer resource consumption (e.g., CPU and RAM) and communication (e.g., input/output data rate) can also be considered.
The remainder of the paper is organized as follows: Section 2 gives an overview of the related literature; Section 3 introduces the process we have defined to benchmark multi-robot exploration; Section 4 presents our testbed for simulated multi-robot fleet benchmarking; Section 5 describes the experimental design and results obtained with our testbed; Section 6 discusses several important issues related to benchmarking simulated multi-robot systems; Finally, conclusions and future research are discussed in Section 7.
2. Related Work
Benchmarking of multi-robot systems is crucial to evaluate and compare different coordination strategies but it is still a recent topic addressed by our community. For example, the EURON (European Robotics Research Network) has started to build knowledge through investigation of different aspects of this topic since 2006 [26]. Recent reported results include [15,16]. The former presented a survey on multi-robot search and rescue problem and benchmarked five algorithms for cooperative exploration tasks with different number of robots. The latter proposed a methodology for evaluating frontier-based multi-robot exploration and also compared five task allocation methods used in the exploration problem. The proposed methodology includes an exploration framework, benchmarks and an experimental protocol.
Testbed can play a vital part in benchmarking process. However, so far only a few are (re-)usable for the assessment of multi-robot applications. Robotic competitions such as the DARPA (Defense Advanced Research Projects Agency) Challenge and the RoboCup can be served as an option [27]. It indeed provides an opportunity for researchers to benchmark approaches against each other to enhance understanding of relative advantages and shortcomings with its clearly defined measures of success. However, participating in competitions is a costly and long-term effort that requires an integrated implementation of complete robotic systems. Moreover, competitions lack the possibility to easily repeat an experiment with different approaches.
Simulation instead, can overcome the above problems, especially for multi-robot applications. However, only the use of simulator is not enough to achieve the goal of benchmarking multi-robot systems and quantitatively comparing them. Experiments must be reproducible in order to allow researchers to compare their approach with existing ones, where the reproducibility implies that there are no hidden assumptions so that people can reproduce the experiments using a different simulator. Moreover, the simulation should be as realistic as possible, because benchmarks are defined to evaluate applications prepared for the real world rather than a simplified version. For example, simulating a large number of robots on a single physical computer hides the fact of network bandwidth consumption for the communication between robots, that would not be possible in practice. The rest of this section presents some representative simulation environments.
An experimental testbed for large-scale multi-robot systems is described in [28]. This testbed aimed at the experimental verification and validation of different distributed robotic applications in an indoor environment. The authors first reviewed several hardware and software resources, then chose Scarab and Khepri for the robot models, Player [20] for the robot middleware, and Gazebo for the 3D simulator. While this work presented an interesting framework, few information is provided related to the benchmarking process and the challenges that one has to face when building such a testbed. Moreover, their testbed does not always completely capture the behaviors of the robots due to differences between reality and the simulated environment. These differences consist of model inaccuracies, simulation approximations, and local rather than distributed communication links. In contrast, we have avoided these problems in our testbed thanks to our choices of a realistic engine for the simulation and distributing robot controllers into a computer cluster. We also provide an experience report on how to build such a testbed and challenges that one has to face to build a similar one, and introduce a benchmarking process in which we make experimental design explicit to help people reproduce the experiments.
Another testbed has been introduced in [29]. This testbed contains about eight hundreds of PCs which are connected through intelligent switches that enable experiments with various topology structures. Each PC in the network is assumed to be a mobile robot. However, this work mainly focused on the network configuration and installation issues for large-scale simulation, while the simulated robot and world were highly virtualized. In contrast, our testbed addresses more realistic simulations.
A complementary work to ours is the RoboNetSim [19], which is a framework for realistic simulation of the communication in networked multi-robot systems. It was designed to work with different simulators and simulate fleets of hundreds of robots. Therefore, this framework can be integrated into our testbed to enable even more realistic simulations with different networking configurations and topologies.
3. Benchmarking Process
The key requirement for a testbed is the automation of the benchmarking process (see Figure 2). It starts with a user defined experimental design, in which the user specifies the value of parameters, and the data to be collected during the experimental runs. Then, experiments are automatically performed by the testbed, without any manual intervention. Besides, the experiments are independent of one another, which can run either sequentially or in parallel, depending on available resources. Last, collected data are post-processed in order to compute evaluation metrics dedicated to quantitative benchmarking performed experiments, and compare various settings (i.e., parameter values).
Another important requirement is the reusability of the testbed, meaning that the latter should be as much independent as possible from its applications. We achieve this by using a general purpose simulator and middleware. As a specific instantiation of the general testbed that will be presented in the next section, we dedicate the remainder of this section to a more detailed discussion of related concepts on multi-robot exploration problem. This part is also an extension of our previous work [30].
3.1. Parameters
Many parameters can influence the experimental results due to the complexity of multi-robot environments. We list below, the most relevant parameters for multi-robot exploration, which can be grouped into three families, including Robot, Fleet and Environment. Our goal is to provide the community with basis to define a reference database of benchmark setups, where each setup refers to a different configuration of parameters. This idea has already been shown in different areas, such as databases of images for facial recognition (http://www.face-rec.org/databases/) and arenas defined in the RoboCup Rescue competition (http://wiki.robocup.org/Robot_League#Field_Description).
Robot
- Mathematical and physical models such as size, shape and weight. For example, it can be difficult or impossible to get a big robot pass through a narrow doorway.
- Kinematic models such as velocity and acceleration.
- Mechanical models such as holonomic and non-holonomic.
- Computing capabilities such as CPU and RAM. Typically, we need to take into consideration resources available for computing when we choose an algorithm. Simple algorithms running on constraint devices might have better performance than sophisticated ones.
- Sensor properties such as sampling frequency, range and resolution. For example, sensor can actually affect localization accuracy and mapping quality.
3.2. Fleet
- Number of robots. An intuitive thinking would be that more robots can lead to faster exploration. However, it actually depends on the coordination strategies among robots.
- Fleet homogeneity. An heterogeneous fleet consisting of aerial and ground robots would exhibit better performance over a homogeneous one. However, it also depends on the coordination strategies among different types of robots.
- Initial position of robots. Depending on deployment environment, in particular the form of obstacles, exploration performance can be significantly impacted by robots’ position where they start mission from [14].
- Communication bandwidth. Some algorithms require a large amount of data exchange among robots. The performance of a multi-robot system might significantly drop with a limited network bandwidth.
- Communication range. Communication between robots is typically achieved by wireless network, while the coverage of the latter may vary. Robots might get disconnected and not be able to communicate with each other when they are out of WiFi range. However, this issue can be mitigated by taking into account network connectivity in path planning [9,31].
Environment
- Terrain size. Obviously, exploring a large terrain requires more time than a smaller one. However, this can sometimes be mitigated by increasing the number of robots.
- Obstacle material, density and shape. The material of the obstacle mainly affects the wireless communication. Regarding the obstacle density, typically, there is less space to explore in an environment with many obstacles. The effect of the obstacle shape on the robot is mainly reflected in the navigation. For example, the navigation is more complicated with concave obstacles where deadlocks can occur, or when multiple robots are located in the same area [32].
- Landform. Exploration of a large single area takes probably less time than exploration of an environment that is decomposed into several open areas but connected with narrow corridors. In the latter, it is likely that robots might obstruct one another.
- Dynamicity. If the environment is changing (e.g., doors opening and closing, or humans and other robots moving around), the exploration time and the associated cost can vary in different experimental runs. Dealing with dynamicity falls into the realm of problems of path planning and obstacle avoidance. However, the interference of the latter leads to coordination becoming an NP-hard optimization problem.
3.3. Metrics
The metrics are served to quantitatively analyze and compare different coordination strategies. In this section, we introduce two categories of evaluation metric among multi-robot systems. One is for single robot, the other is for whole fleet. These metrics can be used to comprehensively assess the performance of a strategy implemented in our testbed.
3.3.1. Robot
Metrics for single robot quantify primarily the resource consumption of the robot. They allow us not only to compare different solutions, but also analyze the applicability of a given solution to a robotic fleet by answering the following questions:
- Does an embedded computer have enough CPU resources to perform all computations fast enough?
- Does an embedded computer have enough RAM resources to avoid memory ballooning and swapping, which impacts the speed of computing?
- Are robot network interfaces suitable for communication required for inter-collaboration?
We therefore propose to measure the CPU and RAM usages as well as network transmission rate on the simulated robot, among which the CPU usage is the sum of user and system CPU times, the RAM usage is the percentage of memory in use, and the network transmission rate is the total number of kilobytes received/transmitted per second.
3.3.2. Fleet
Metrics for whole fleet quantify primarily the overall multi-robot system performance for a given task, which include:
Exploration Time
This is the most commonly used metric in the state-of-the-art [3,4,10,14], which measures the total time required to complete an exploration mission for a robot fleet. In our definition, timing begins when at least one robot in the fleet started the exploration, and ends when at least one has explored a predefined percentage (e.g., 99%) of the whole terrain. The time is measured in wall-clock time, showing us how many days, hours, minutes, and seconds that the fleet has spent on the exploration process.
One of the goals regarding the optimization of multi-robot exploration is to minimize the overall exploration time. The challenge of achieving this goal remains to make each robot moving to the “best” position in order to maximize the exploration area (i.e., information gain) and minimize at the same time the usage of robots (e.g., exploration cost). Unfortunately, this problem is NP-hard for known and beyond the scope of this paper.
Exploration Cost
The distance-based metrics have been widely used in multi-robot systems to estimate the cost of a mission [4,10,14,33], especially for task allocation. We define the exploration cost as the sum of the distances traveled by all robots of the fleet:
where n is the number of robots in the fleet, and is the distance traveled by robot i. However, the definition of this metric can be varied according to users’ needs. It could be the energy consumed by the computational resources such as CPU, RAM and network bandwidth, or even the price of the robots and their handling and maintenance costs.
Exploration Efficiency
Efficiency is often measured as the ratio of useful output to total input. In the case of space exploration, it is directly proportional to the amount of information retrieved from the environment, and inversely proportional to the costs incurred by the robot fleet [33]:
where A is the total explored area in square meters. For example, if the value of the exploration efficiency is 1.6, meaning that each time all robots from the fleet move by 1 m, they discover on average 1.6 m2 of the terrain.
Exploration Safety
The collision among robots are extremely undesirable for multi-robot systems. The risk of collision increases with the fleet size, which is difficult to identify and evaluate due to the lack of available information. However, this problem can be alleviated by using coordination strategies. We therefore define the safety metric as the number of collisions occurred during the exploration process:
where S is a predefined cardinal and is the total number of collisions experienced by robot i. Obviously, the greater the value, the higher the safety.
Map Completeness
Map building is a task tightly coupled with the exploration. The completeness of robot-built map is a major problem that researchers are concerned about [16,34,35]. Using this metric requires a prior knowledge about the terrain to be explored and mapped. We therefore define the map completeness as the ratio between the explored area A and the ground-truth area G:
Map Quality
Building up an entirely accurate environment map by autonomous robot is still an open problem. Reasons for the errors of a map could be at the hardware (sensors accuracy) and/or the software (SLAM algorithms) level. To identify these errors, we need a ground-truth map of the environment. The occupancy grid map is widely used to represent the unknown, occupied and free space in the exploration problem. Let denote the grid cell with coordinates . Then an occupancy grid map m can be represented as , where each stores an occupancy value specifying whether a cell is unknown, occupied or free. We therefore define the map error as the number of cells in the explored grid map having different value from their counterpart in the ground-truth:
There is another factor we need to consider: results obtained from this formula are also affected by the resolution of the map (i.e., size of the cell). A larger cardinal of cell will be required for a higher resolution map. By using the same sensor and algorithm, the error is likely to be larger in a high resolution map than in a low one. A good exploration performance must show a trade-off between the map error and its resolution.
Given the above, we now define the map quality as the overlap of the explored and the ground-truth area as a ratio to the latter:
where is the cell size in square meters. As we can see from the definition, unlike the map quality metric defined in [16,35], which mainly focuses on the completeness of the built map (i.e., percent of the mapped areas), we are more concerned about its topological accuracy.
3.4. Experimental Design
An experimental design consists of:
- Parameters: This is a set of all parameters introduced in Section 3.1. For each parameter, users must provide one or more values that will be used in experimental runs.
- Parameter vectors: A parameter vector contains a single value for each parameter, and it will be used to perform a single experimental run. Users can either list all parameter vectors, or provide a function to compute them.
- Iterations: This is the number of times to repeat each experimental run. This element is very necessary for scientific experiments, especially in robotics, since there are several non-deterministic components from the hardware such as noises on laser scan and odometry, or from the software like algorithms implemented for SLAM. It is also necessary for using the computer cluster in numerous institutions, because the cluster is usually shared use where there is no constant network bandwidth.
- Stop conditions: It expresses when to stop each experimental run. It can be a condition to evaluate whether the experiment is completed with success, or a timeout to evaluate failed runs in order to avoid infinite loop.
- Measurements: These are the data to collect for each experimental run. Users have to state when to perform each measurement, by providing a frequency for periodic measurements or a triggering condition to collect data upon the occurrence of some event.
- Metrics: These are the formulas introduced in Section 3.3, which compute the benchmark results from the collected data.
An example of an experimental design is shown in Table 1. For each benchmarking process, users should provide a similar table to enable the reproducibility of experiments. That is, another person can run the experiments in another environment and reach the same conclusion such as “algorithm A is faster than B”. Instead, achieving replicability, meaning that the experiments can be repeated with exactly the same result such as “algorithm A is 100 s faster than B”, which is more challenging. The latter requires to have exactly the same testbed, i.e., with the same hardware and software setups.
4. Testbed
In this section, we present the current status of our testbed. We first describe its abstract architecture, then the infrastructure we have built as well as the challenges we have faced, and last, how to automate the deployment process.
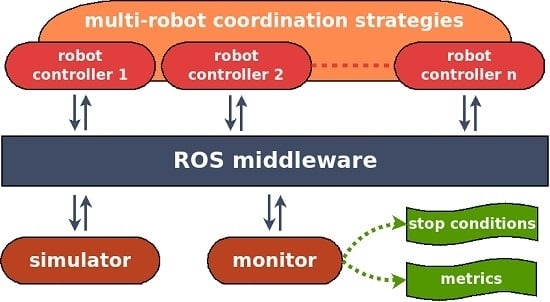
4.1. Architecture
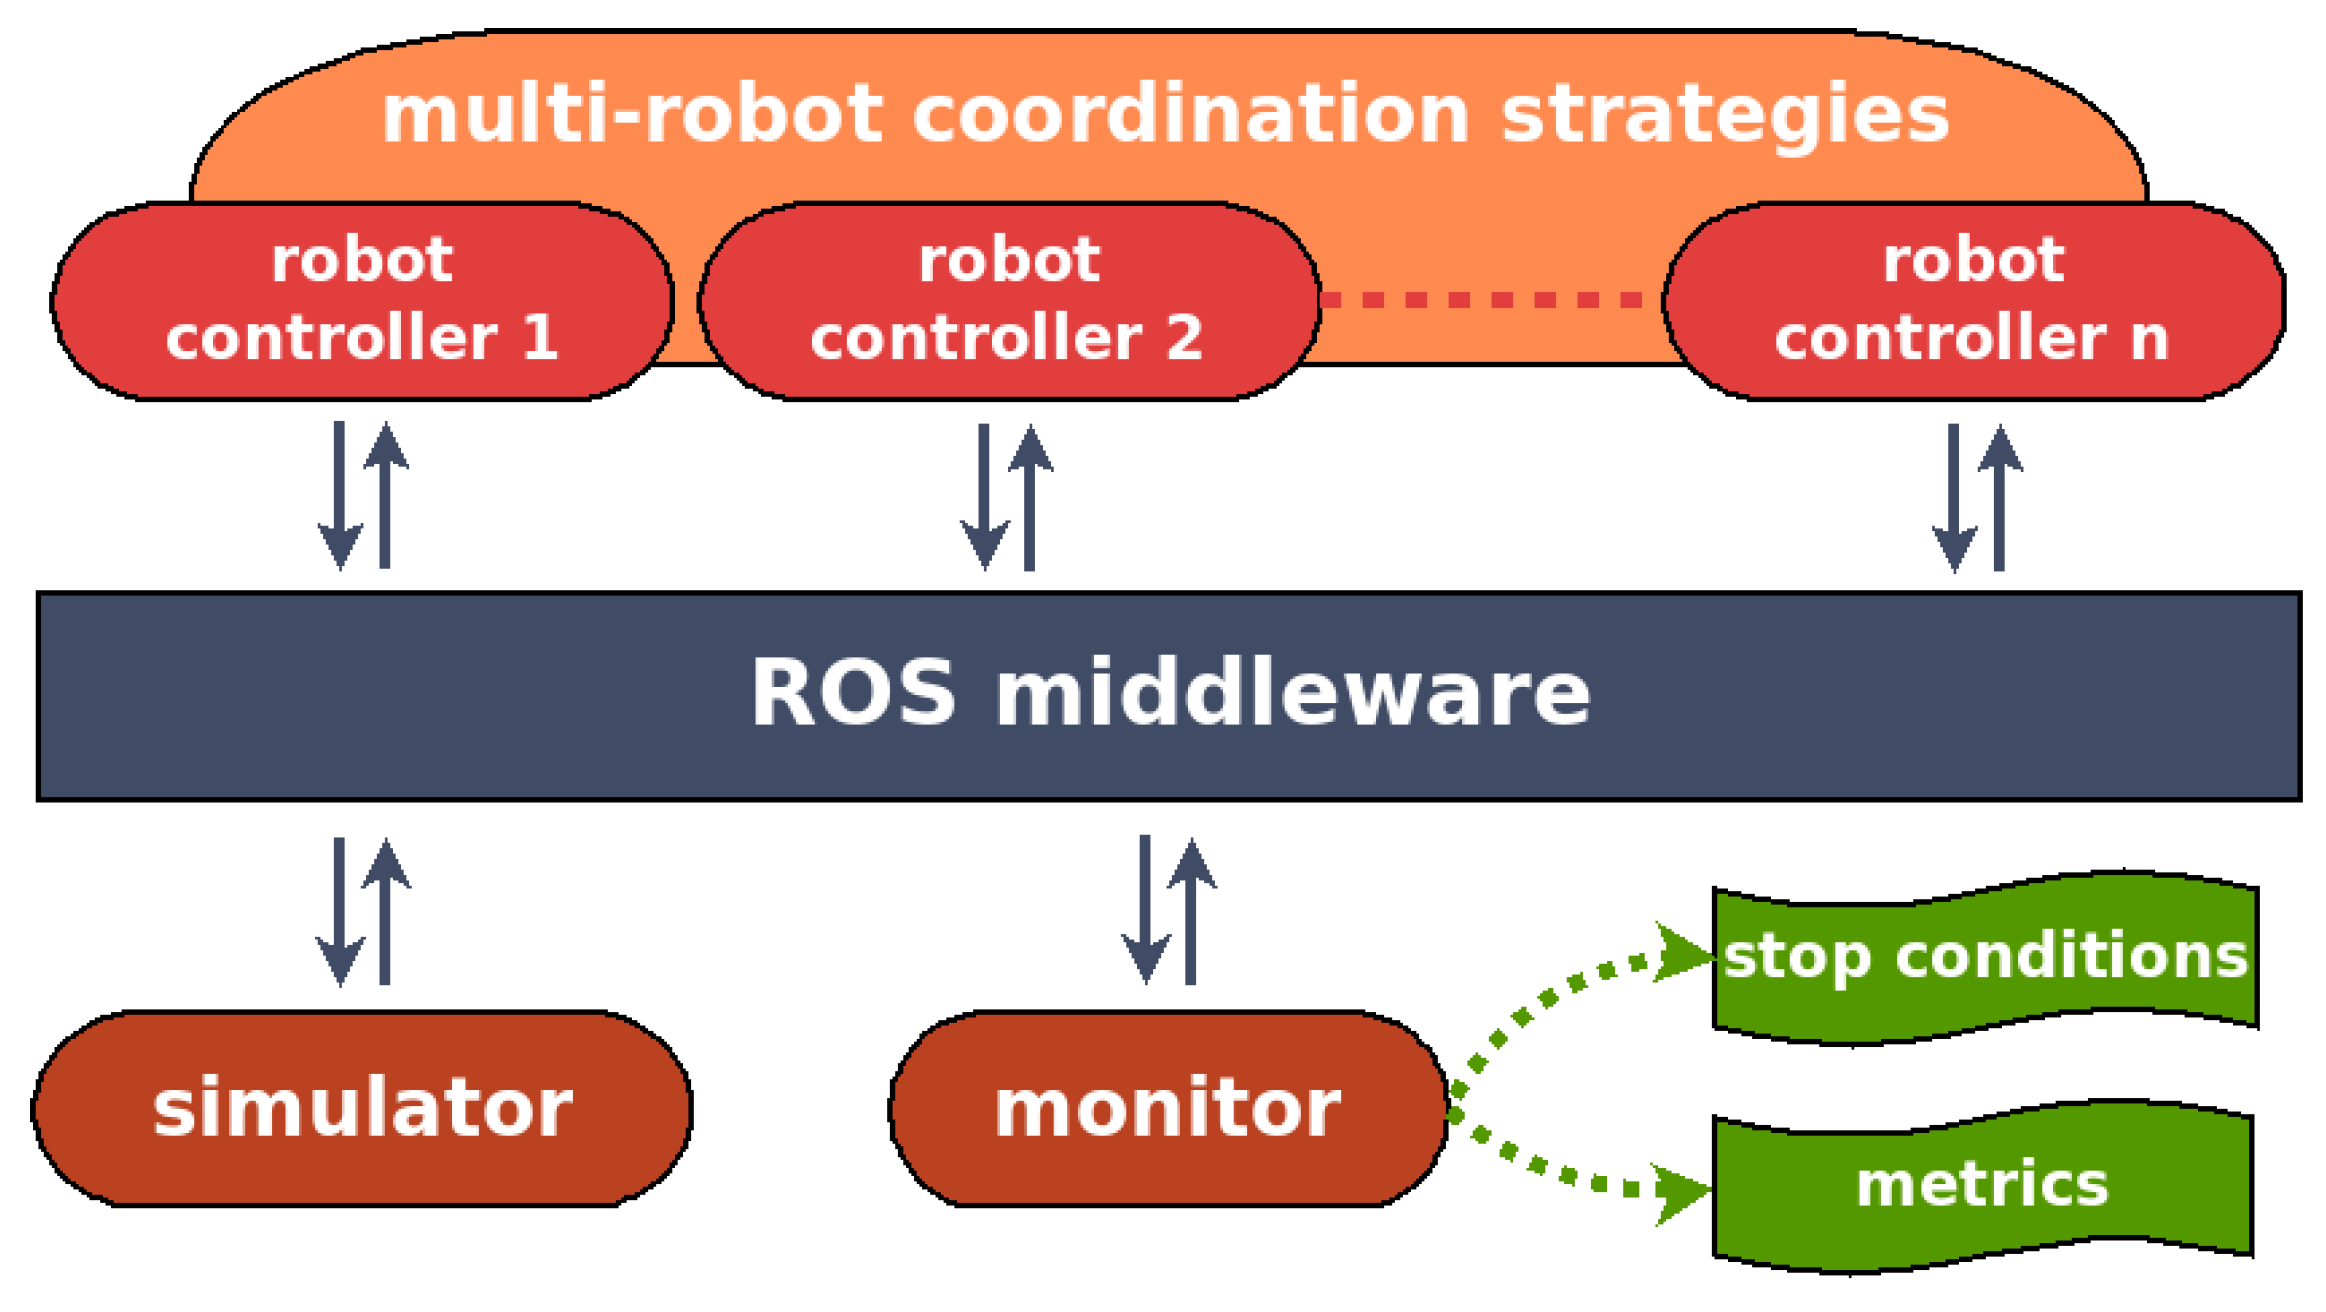
The architecture of our testbed is illustrated in Figure 3. It is composed of four parts: a simulator, a monitor, a set of robot controllers, and the ROS middleware used to connect all of them. In particular, we use the MORSE 3D realistic simulator and wrap it up into a ROS node. The monitor is also performed as a ROS node, which allows us to supervise the experimental processes. Specifically, it can stop the experiment when the stop condition is triggered, collect measurement data and compute the metrics afterwards.
Each robot controller materializes as a set of ROS nodes. For the sake of realistic benchmarking, we use the same controller as the one running on actual robots. The coordination strategies is shown as cross-cutting the robot controllers since we are mainly interested in distributed approaches. This means each robot controller should provide some ROS nodes dedicated to coordination. However, our architecture also support centralized approaches, for which the ROS nodes dedicated to coordination can be performed independently from the robot controllers.
4.2. Infrastructure
The MORSE simulator and the system monitor are deployed on a workstation with 8 processors, 8GB RAM, a GeForce GTX 770 graphics card and a 1000 Mbps Ethernet adapter. The robot controllers are deployed on a computer cluster in order to meet the computation requirement for simulation of multiple robots in real time. The cluster consists of 70 computing nodes which can provide resources required for high-performance distributed applications. Each computing node contains multiple processors varying from 8 to 12, and RAM varying from 16 GB to 48 GB. The communication including inter-node in cluster and cluster-workstation are achieved through a wired network.
To our knowledge, operating systems running on the computer cluster in different institutions are varied. For example, our cluster is running on CentOS that is not supported by ROS. To overcome this problem, we used an open-source virtual machine (VM, https://www.virtualbox.org/), which is also a trade-off to maximize the reusability of our testbed. For each robot controller, we used a VM with Ubuntu 12.04.1 LTS and ROS Groovy. Since all controllers run under the same infrastructure, the potential slow-down should be evenly distributed. As a result, we believe that the use of VM does not impact relative ratios of benchmarking results of different approaches.
The network communication in our testbed consists of three parts:
- Communication between the simulator and the robot controllers. The simulator sends sensory data including laser scans and odometry to the controllers, and receives motion control information from the latter. The amount of data to be transmitted and thus the required network bandwidth increase obviously with the number of robots to simulate.
- Communication between the monitor and the robot controllers. The monitor receives measurement data such as explored maps and traveled distances from the controllers. The usage of network bandwidth mainly depends on the size of the terrain to explore.
- Communication between the robot controllers. This part of data is mainly caused by the coordination strategies such as map exchange and coordinate frame transform among robots. The transmission rate may also depend on the size of the terrain to explore and increase with the number of robots to simulate.
Moreover, the communication between different ROS nodes is achieved using publish-subscribe pattern.
4.3. Challenges
4.3.1. Emulated Hardware
Utility-maximization resource allocation for the computer cluster is our primary concern. To explore multi-scale trade-offs between the performance of VM and the required resources of the cluster for multi-robot exploration simulations, we conducted several experiments with different emulated hardware configurations. We fixed the number of robots to 8 and the RAM of each VM to 2 GB, while varied the number of processors allocated to each VM and the number of deployed computing nodes from 1 to 8. Table 2 shows the experimental results with exploration of the terrain shown in Figure 4d, in which the exploration time is the mean of 5 identical runs.
As it can be seen from the table, the occupied network bandwidth for the communication between the simulator and the robot controllers as well as the RAM used by each VM are the same for all the configurations, while the team of robots with two processors each got the shortest exploration time. This configuration was then chosen for our experiments, that will be presented in Section 5. An alternative could be to use four processors per VM, since it is only a second slower than the one with two processors. However, this is an unnecessary waste of resources, and typically, for a shared-use computer cluster, the more computing resources we request, the longer we have to wait before having a computing slot allocated to run the experiments. Furthermore, it is worth pointing out that metrics other than exploration time can also be used as a reference according to the needs.
4.3.2. Network Bandwidth
Realistic simulation of a large number of robots requires high computational power. This is why our testbed relies on a computer cluster. However, since robot controllers need to communicate with each other and also with the simulator over a network, the bandwidth of the latter becomes a major constraint on large-scale simulation. Obviously, more robots to simulate implies more data need to be exchanged over the network. This may give rise to a network overload, thus result in data loss and inconsistent robot behaviors, and eventually lead to simulation failures.
As mentioned in Section 4.2, the data to be transmitted over the network mainly includes laser scans, odometry, motion control information, explored maps, and coordinate frame transforms. Indeed, reducing the data publishing frequencies can alleviate network load. However, the reduction should be restricted to keep the simulation realistic. Table 3 summarizes relevant frequencies used in our experiments. At the simulator side, the frequency of the MORSE simulator was set to 60 Hz in order to handle the simulation in real time (i.e., one second of time in simulation is equal to one second of time in the real world). The laser was set to 25 Hz, which is the minimum operating frequency of an actual SICK LMS500 laser scanner. The odometry was set to 10 Hz, which is the default rate of an actual Pioneer 3-DX robot. At the robot controller side, both the transform rate from map to odometry for the gmapping package (SLAM) and the publishing rate of movement commands for the move_base package were set to 10 Hz.
4.4. Automated Deployment
Deployment automation is an important requirement for a testbed. However, it is a slightly complex process for multi-robot simulation, especially with a computer cluster. We have fully automatized the deployment work by scripting all file manipulation, program execution and text printing, which are summarized in Algorithm 1.
The job scheduling on the computer cluster is performed by a Portable Batch System (PBS) [36], which can allocate computational tasks among the available computing resources. The number of requested computing nodes (denoted by ) can be computed by the maximum number of robots in a fleet (denoted by ) and the number of robots that can be deployed on each node (denoted by ):
| Algorithm 1 Multi-robot simulation deployment |
|
For example, we need 2 processors per robot according to the results presented in Section 4.3.1, so for those computing nodes which have 8 processors. Suppose , so . In addition, it can be seen that our proposal allows to sequentially launch several experiments with different team sizes, and several trials for each team size allow us to get objective results from a statistical point of view.
As mentioned in Section 4.2, each simulated robot in a team is encapsulated into a VM image. Typically, the VM images take up a lot of storage space and as a consequence, the time required to deploy all of them may be long. In our case, the image file for a robot controller reaches 6.8 GB. Obviously, the deployment time is proportional to the number of robots. We propose here an efficient strategy (see Algorithm 2) to speed up the VM deployment process. A so-called prototype VM is first built corresponding to a generic robot controller (e.g., Ubuntu with required ROS packages). This prototype is then copied to a temporary storage area of the file system of each computing node. In the end, we can clone it locally as many times as needed, only with a different IP address assigned to each new VM.
| Algorithm 2 Robot controllers deployment |
|
5. Experiments
This section presents experiments that were conducted in our testbed. We implemented the frontier-based approach for autonomous exploration with a fleet of robots [3] and benchmarked a probabilistic approach for map merging [4]. Specifically, frontiers are regions on the boundary between open space and unexplored space, and each robot determines itself (i.e., autonomously) which frontier to go based on its explored map. This is actually a decentralized mechanism. Map exchange is the only coordination strategy among robots, in which each robot integrates the map from other robots into its own by fusing the probability of each grid cell. Once the robot updates its explored map, it will move towards the nearest frontier. Other experiments conducted using this testbed can be found in our previous work [14], where we performed several benchmarks to determine the optimal size of a multi-robot fleet for an exploration mission.
5.1. Instantiated Experimental Design
The instantiated experimental design is summarized in Table 4. Some parameters have a fixed value, i.e., the same value was used in all simulation runs. According to Section 3.4, this table provides all required information to reproduce our experiments. In particular, we experimented with different fleet sizes ranging from 1 to 30 identical robots, i.e., homogeneous team of simulated Pioneer 3-DX robots with 2 CPUs and 2 GB RAM. Each robot was equipped with a SICK LMS500 laser scanner, which provides 180 sample points with 190 degrees field of view and a maximum range of 26 m. As the same as the actual one, the maximum speed of the simulated robot was set to 1.2 m/s for linear and 5.24 rad/s for rotational motion. A zero mean Gaussian white noise was added to the odometry data, where the standard deviation was 0.022 m for position noise (i.e., x and y) and 0.02 rad for rotation noise. These noises are very close to the actual Pioneer 3-DX robot, making our simulation as realistic as possible.
The robots were initially placed along a vertical line, starting from the top left corner of the terrain to the bottom left corner. The distance between two adjacent robots was set to 2 m. The robots communicated with each other over a wired Gigabit Ethernet network. The maximum communication range between them was set to 200 m, based on their relative position in the simulated environment. The impact of obstacles to communication was ignored, due to the fact that the MORSE simulator does not currently support it. We will address this issue in our future work and provide different communication models for the testbed.
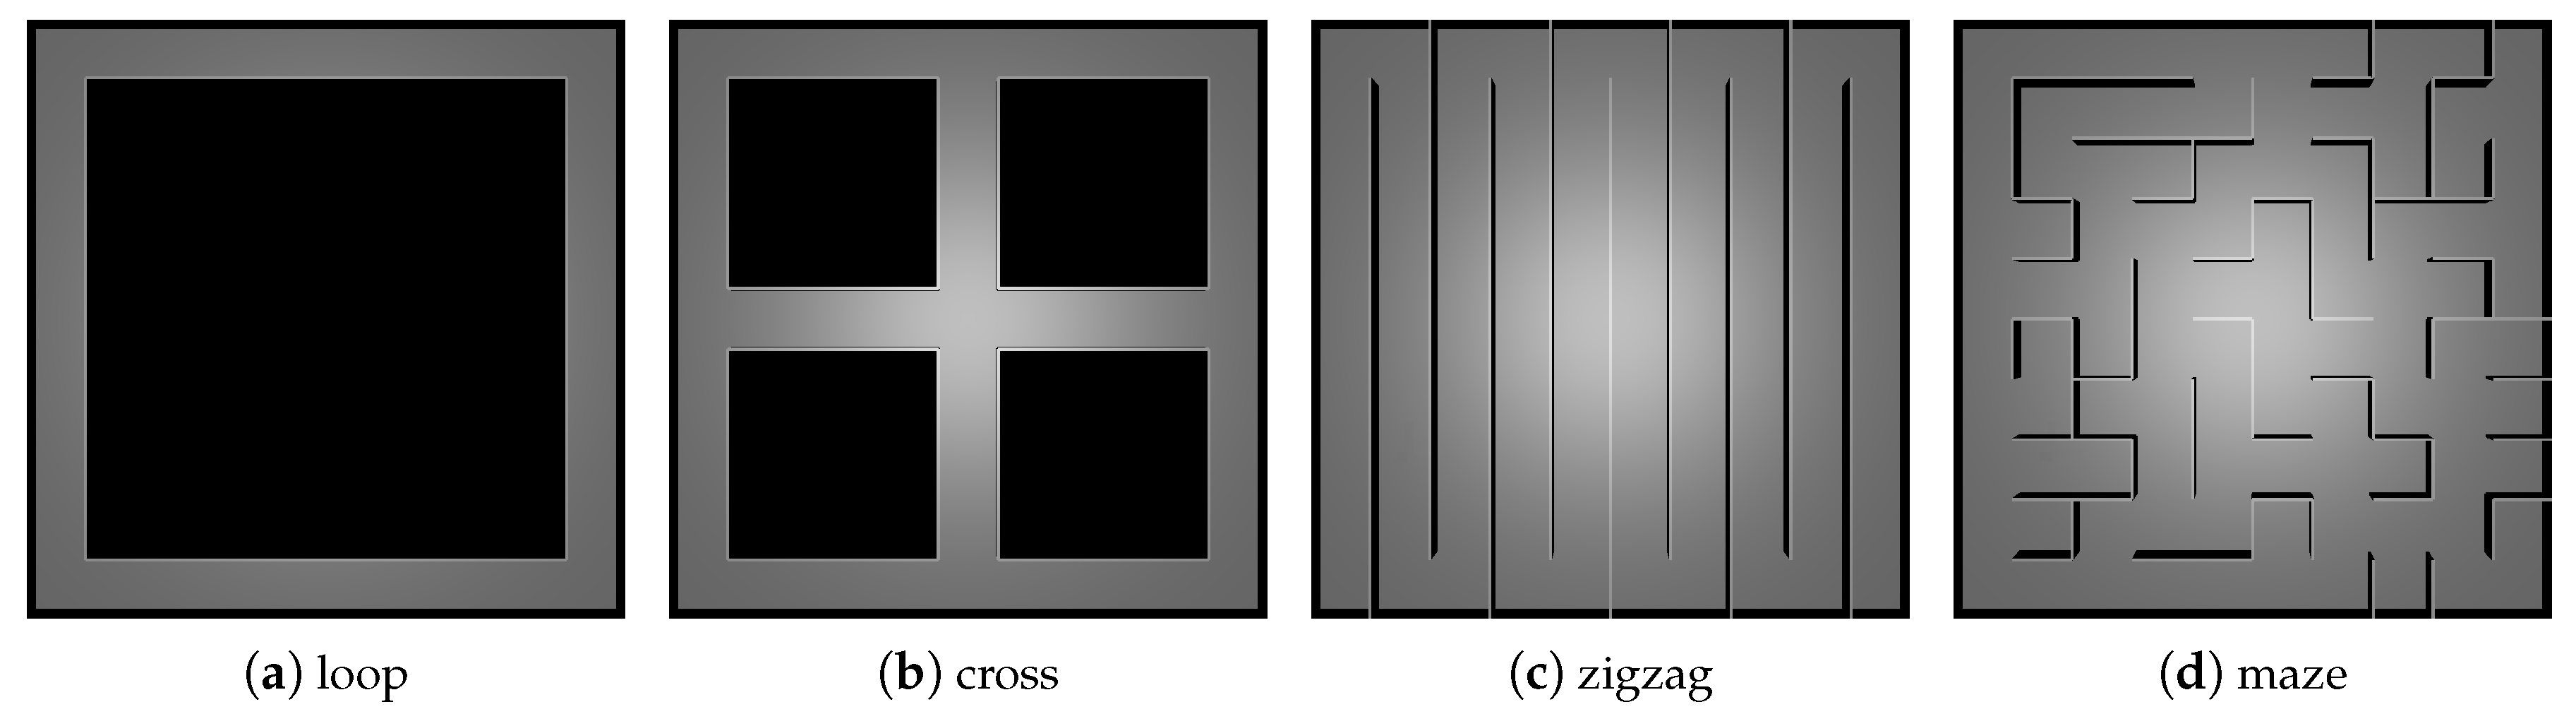
Inspired by the RoboCup Rescue competition, four experimental terrains (see Figure 4) were created with the same size but different topological structures (i.e., explorable areas):
- The loop terrain has a low obstacle density and a simple obstacle shape, in which there is no road fork (similar to beltway).
- The cross terrain contains five road forks but the obstacle density is still low (similar to crossroad).
- The zigzag terrain has no road fork but more obstacles, and it has a long solution path for the robot (similar to square-grid street).
- The maze terrain is the most complex which contains many obstacles and dead ends (similar to whole city).
All terrains are 80 m long and 80 m wide. The height of the obstacles was set to 2 m and the width of roads was fixed to 8 m.
5.2. Robot Controller
The robot controller has been fully implemented into ROS with high modularity. The software architecture is illustrated in Figure 5, which mainly includes four ROS packages:
- gmapping (http://wiki.ros.org/gmapping) is part of official ROS packages, which performs a laser-based SLAM (Simultaneous Localization And Mapping). It provides a ROS node that takes in laser scan data, builds a map, and estimates the robot’s current pose within the map frame. Taking advantage of this package, we extracted the pose information of robot (http://wiki.ros.org/pose_publisher), then feed it to the explore package.
- explore (http://wiki.ros.org/explore) was originally developed by BOSCH, which implemented the frontier-based approach for single robot exploration. We extended it to support multi-robot system (http://wiki.ros.org/explore_multirobot) by publishing explored map, estimated cost and expected information gain, and receiving map from other robots via the coordination package.
- coordination was developed as an abstract interface to the testbed. Users can implement their own coordination strategies such as map merging (http://wiki.ros.org/map_merging), task planning and motion planning. In our case, it provides the merged map to the explore package and the frontier position to the move_base package.
- move_base is also part of official ROS packages, which implements Dijkstra’s algorithm to global path planning and Dynamic Window approach to local collision avoidance.
An important benefit of our software design is the system robustness. When a robot is not able to coordinate with the team due to communication problems or other robots failures, it can still keep working and make its own decisions. For example, the robot can get a goal position from the explore package in the absence of the coordination package. In a sense, the use of the coordination package is not mandatory but it can overcome individual cognitive biases, thus improve the system performance. It is worth pointing out that our testbed does not force explicit coordination (i.e., communication) between robots. The algorithms without any inter-robot communication (e.g., implicit coordination) can also be benchmarked in our testbed.
5.3. Benchmarking Results
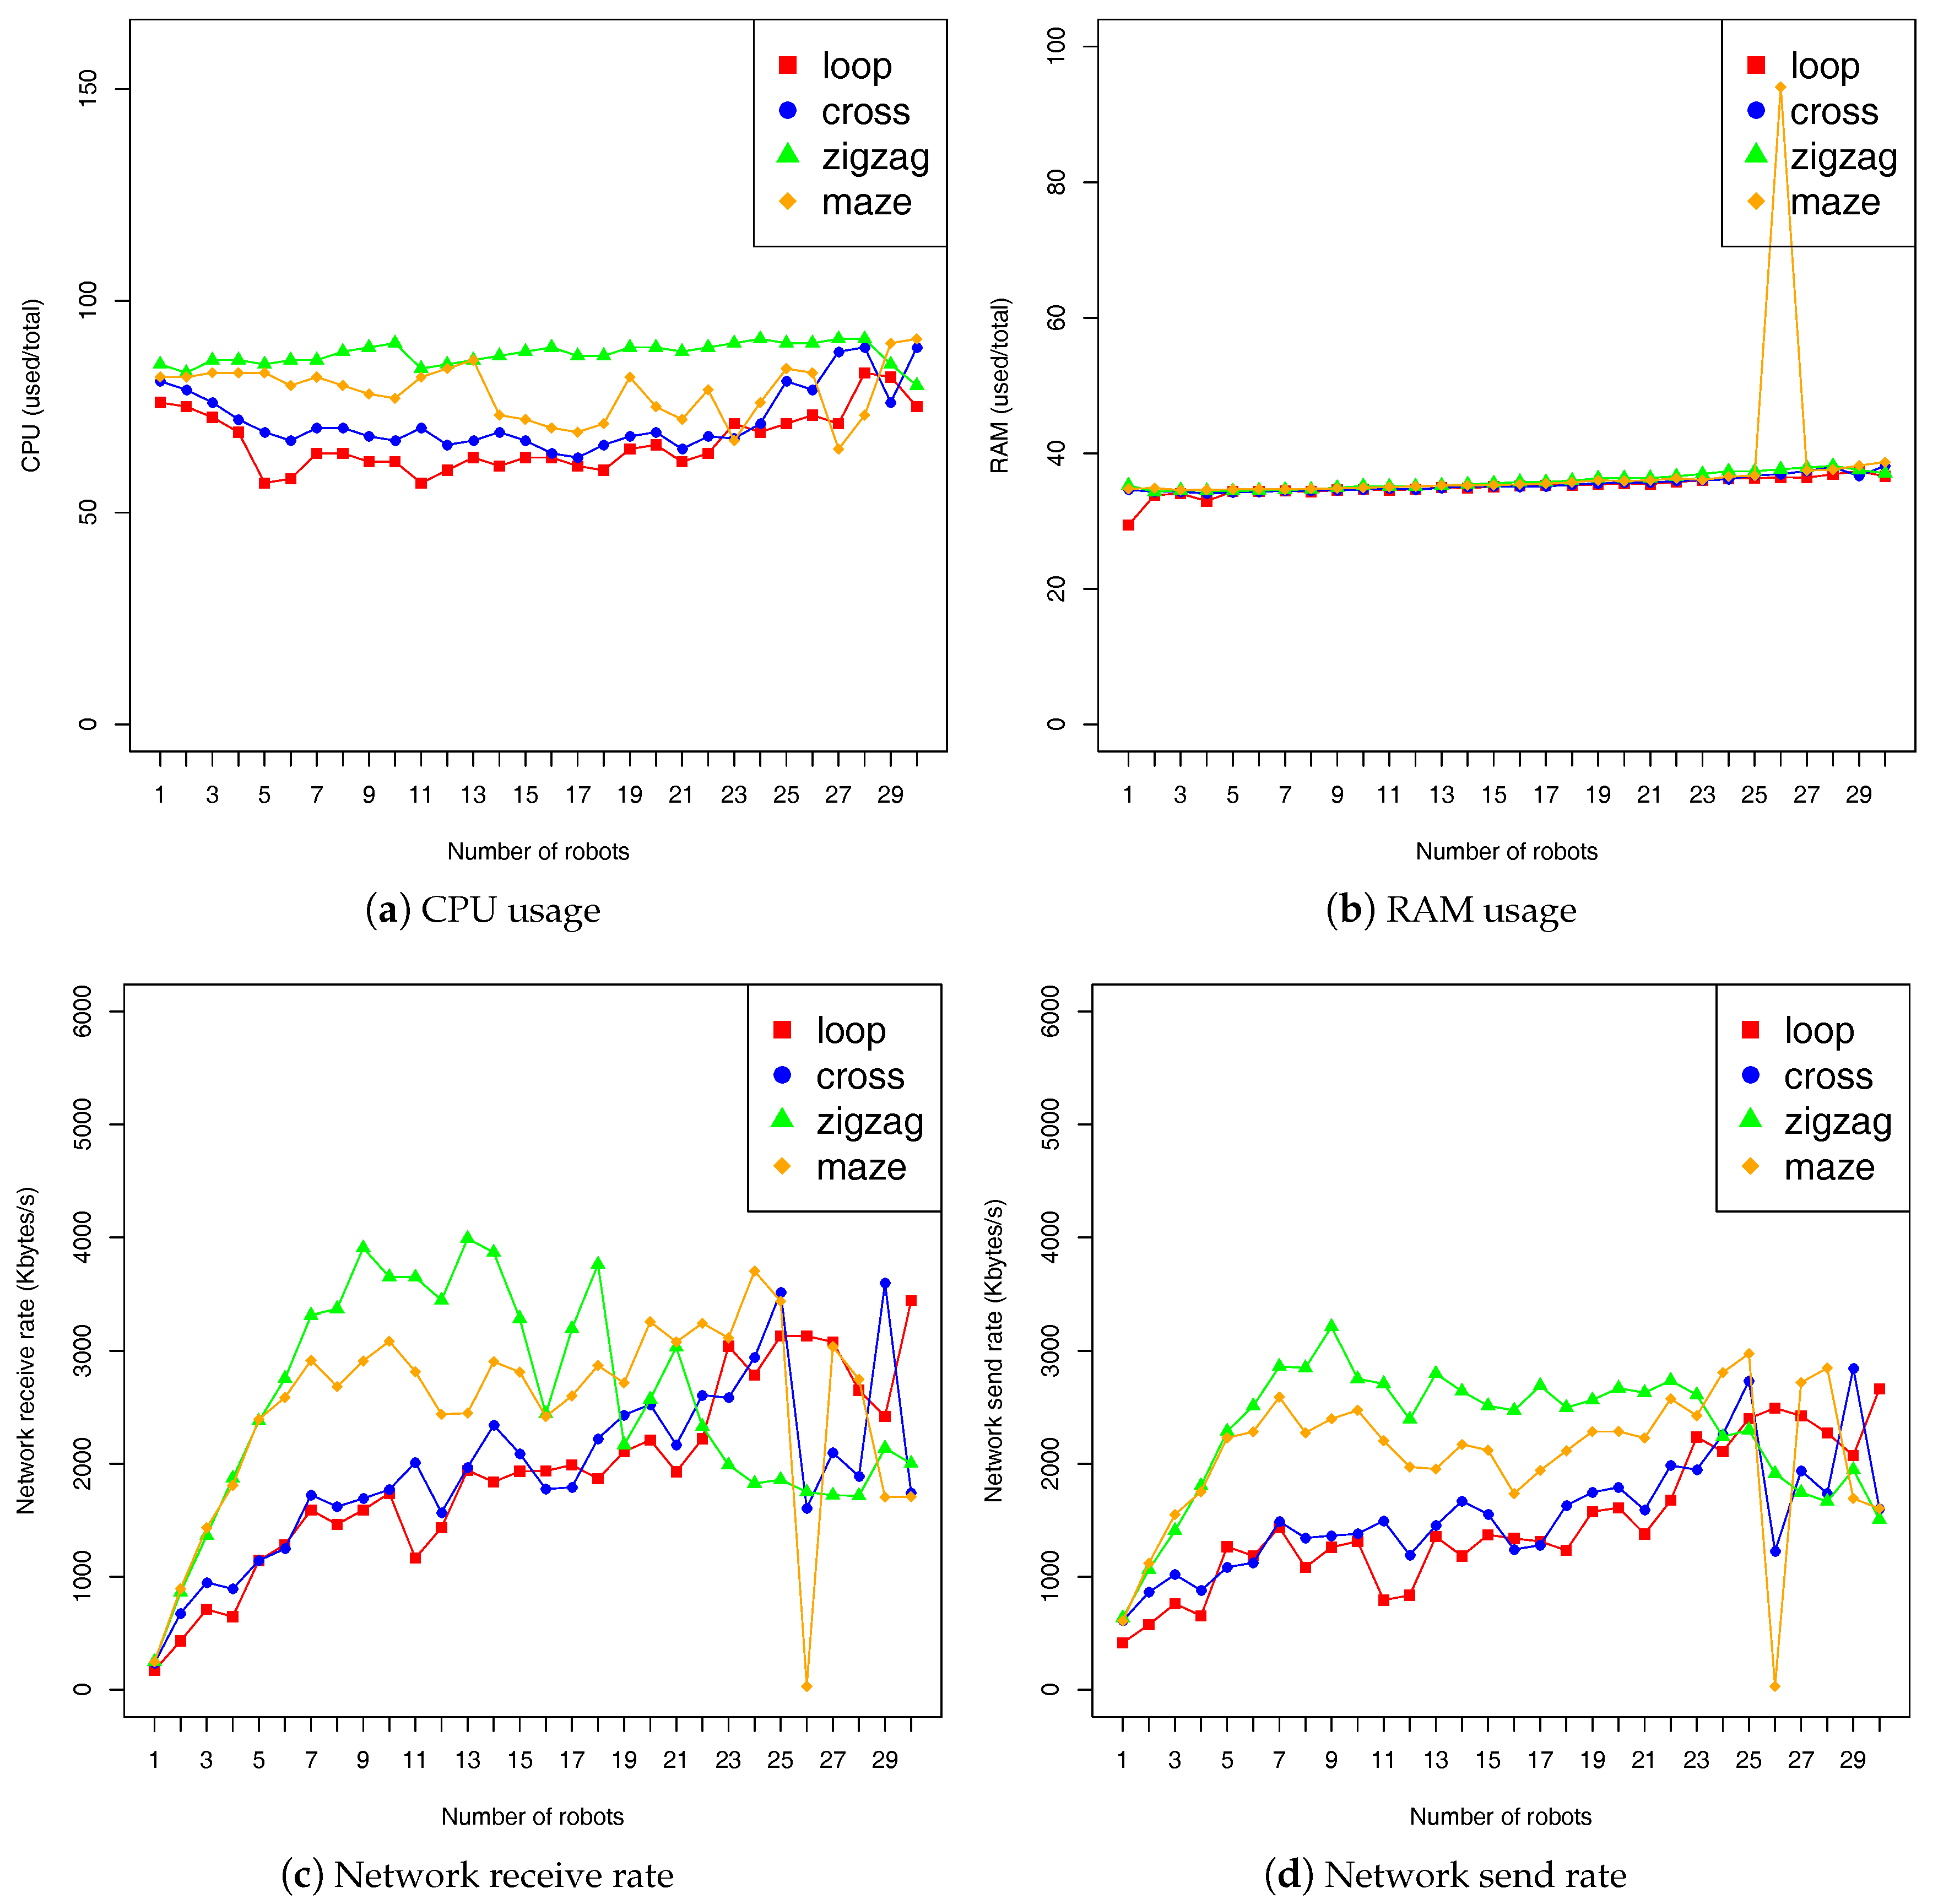
The benchmarking results are given in Figure 6 and Figure 7. Each figure contains four plots, each corresponding to a metric. In each plot, the abscissa denotes the fleet size, and the ordinate denotes the measurement. Figure 6 illustrates results from the use of “robot” metrics as presented in Section 3.3.1. We measured the metrics once every 5 s for each robot in the fleet, and display the mean of all measurements:
where m is the number of measurements (indexed by j) for the robot i, and n is the number of robots in the fleet. Of course, the measurement timing can be changed according to user’s needs and also specific applications. The results first confirm the trade-offs we made on the emulated robot hardware (see Section 4.3.1). The CPU usage was less then 90% and the RAM usage was holding at around 35%. The network receive and send rate was not more than 4 Mb/s. The results also show that, with the zigzag terrain, robots consume typically more CPU and network. This is mainly because robots need to plan longer path in this terrain, and hence require more computation and data exchanges. Furthermore, it can be seen that we got a high deviation with the fleet size of 26 robots in the maze terrain. This is an actual negative impact of shared use of our computer cluster, which should be addressed in our future work.
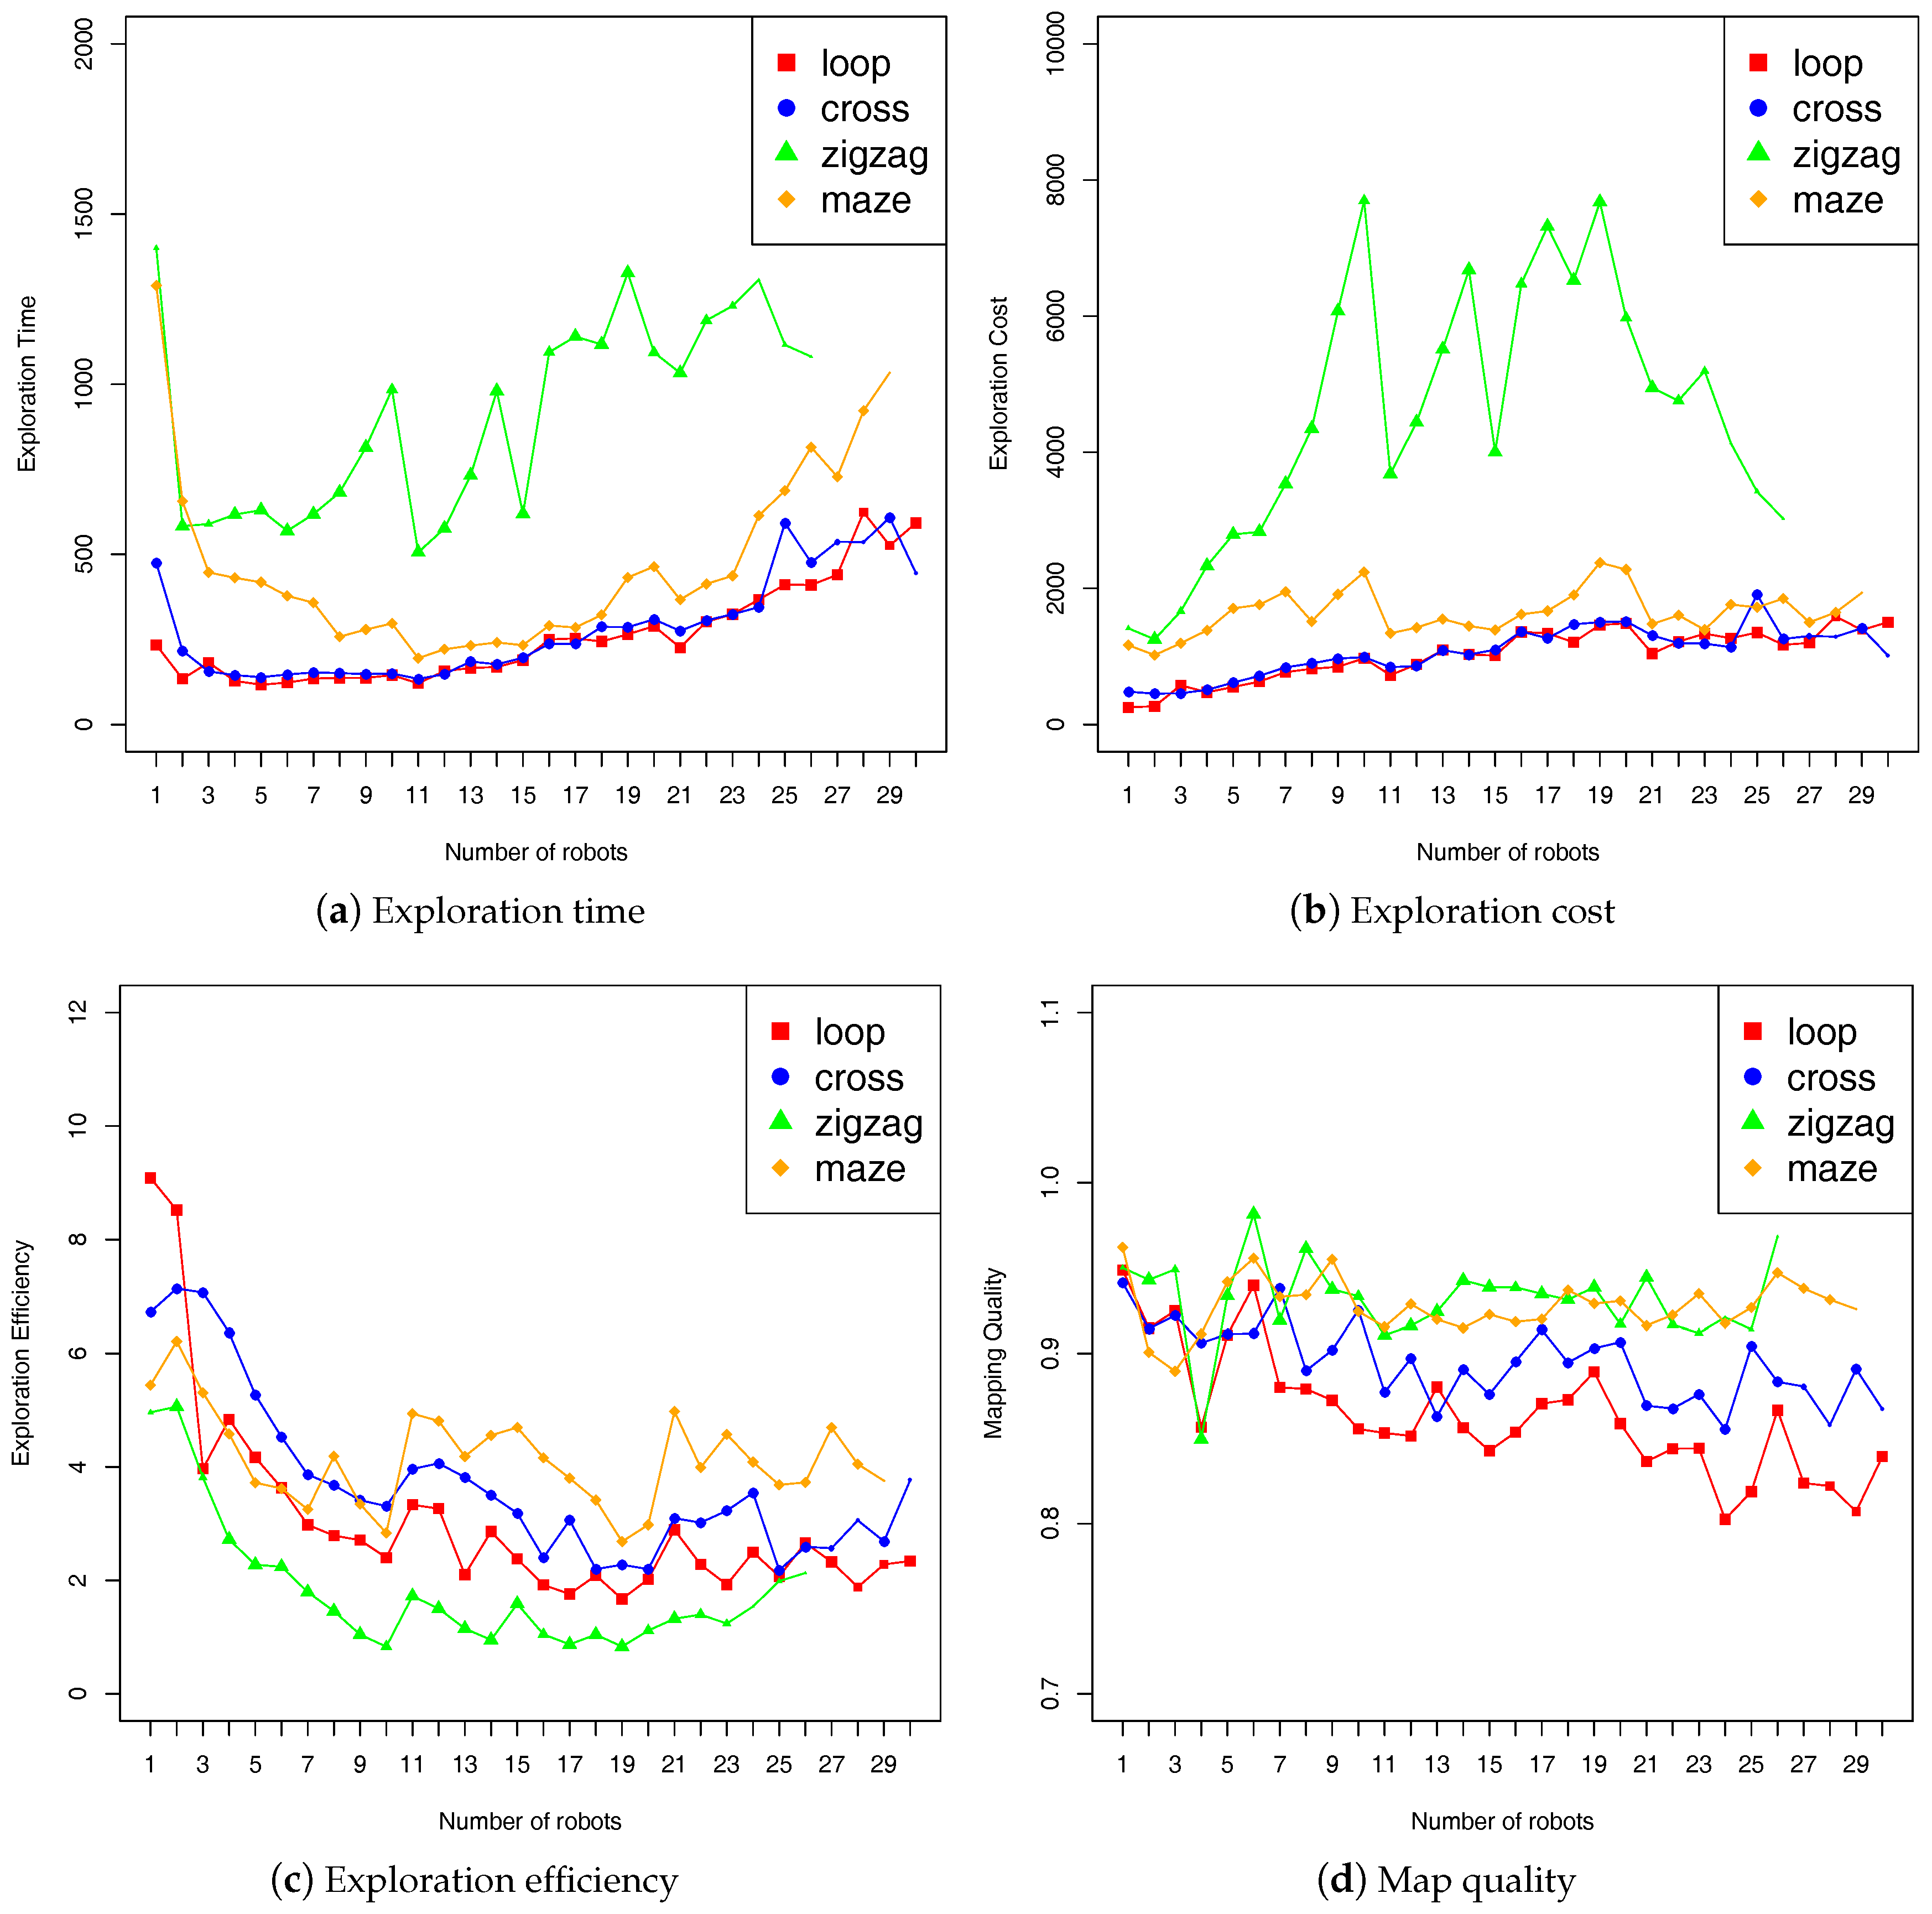
Figure 7 shows the measurements by using the “fleet” metrics as described in Section 3.3.2. We performed 5 runs for each fleet size, and display the mean value of these runs. The symbol size of the mean value in the plots varies with the number of success runs (i.e., 1 to 5), and it will not be displayed if all 5 runs fail. It can be seen that system performance is the lowest with the zigzag terrain. Our experiments showed that exploration was mainly performed by a single robot in this terrain, because there is only one frontier which is always the closest to the same robot (i.e., the one at the top left corner of the terrain). In addition, the optimal fleet size of the robots can be assessed according to these benchmarking results. For example, to explore the maze terrain the ideal fleet should have 11 robots, with which we can get less exploration time and cost while ensuring high exploration efficiency.
6. Discussion
6.1. Network Reliability
In real multi-robot systems, coordination often relies on direct communication via wireless network interfaces. Robots form a wireless Mobile Ad Hoc Network (MANET) that is subject to disconnection when they move away from each other to perform their tasks [9,31]. This unreliability can have serious impacts on coordination strategies among robots. Making realistic simulation requires to take into account such network unreliability. This is why in our testbed, robots can communicate only if they are within a certain range that is specific to the wireless technology used in simulated robots. However, range is only one facet of wireless networking. There are other factors which can influence communication reliability such as radio interferences, communication delays, and signal attenuation caused by obstacles. More realistic simulation need to integrate models of radio propagation and network protocols as done in RoboNetSim [19].
However, a direct consequence of the introduction of these models is an increase in the computational overhead. More importantly, simulating unreliability requires to change the ROS architectural model. Currently, ROS is based on a central node called ROS master (http://wiki.ros.org/Master), which provides naming and registration services to the rest of the nodes in the ROS system. It keeps record of topic publishers and subscribers, as well as service providers, and hence enables individual ROS nodes to discover one another. An unreliable network means that disconnections should be reflected by the ROS master. The ROS community is aware of this problem that arises when a robot gets disconnected in ROS-based multi-robot systems. The response to this issue is being address by a ROS special interest group that targets a so-called multi-master (http://wiki.ros.org/sig/Multimaster) solution.The core idea is to use one master inside each reliable network, that is typically one master per robot since robot parts are often connected through a wired network. Masters that will be connected to each other through unreliable networks (i.e., wireless), should update their registries depending on discoveries or disconnections.
6.2. Network Bandwidth
In our testbed, network is used for intra-robot communication between the robot controller and the robot body, and also for inter-robot communication between different robots. Depending on the network topology in the computer cluster and the bandwidth of the network, there might be some limitations on the maximum number of robots that can be simulated. The number can be less than what we can obtain in a real setting. In the latter, the intra-robot communication is performed within the robot (typically wired), while the inter-robot communication is typically done through a wireless network. Moreover, in a real setting with decentralized working scheme, different groups of robots far from each other beyond the wireless range can form different networks allowing communication in parallel. The total bandwidth can thus be much greater than the maximum allowed by used network interfaces due to parallelism. Another opportunity for parallel communication occurs when robots embed different network interfaces working on different channels (i.e., radio frequencies) or using different technologies (e.g., Wifi, WiMax, and HSPA). This parallelism is impossible with a typical flat bus style network topology in a computer cluster. Last, the network of the computer cluster used for the testbed is also used for other communications, including network file systems traffic, management traffic, job scheduling traffic, and other jobs running on the cluster.
6.3. Hardware in the Loop
Some work draws a strict separation between simulations and tests on multi-robot systems [28], while other researchers propose to introduce hardware in the loop [37]. The latter performed some hybrid experiments, in which a subset of simulated robot parts were replaced by actual hardware. This actually showed a promising manner where the transition from simulation to real machine experiment is more progressive.
In our proposal, we rely on the ROS middleware. The robot controllers, the sensors and the actuators are all ROS nodes, which communicate through ROS topics. The modularity and the network abstraction designed in our testbed enable different deployment schemas. Simulated sensors and actuators can be replaced by nodes that wrap hardware sensors and actuators. This can be done step by step and integrated in a robot testing methodology such as the one presented in [38].
Besides, control nodes can also be deployed on actual robots, which allows a more accurate estimation of the impact of computing capabilities. Moreover, using robot onboard computer instead of the computer cluster has another benefit. The former typically offers two or more network interfaces including Ethernet and WiFi. The wireless interface can be used for inter-robot communication for coordination, while the wired interface can be used to communicate with simulated sensors and actuators. Consequently, we could avoid at least part of network load problems that limit the maximum fleet size as discussed in Section 6.2.
7. Conclusions
In this paper, we presented a ROS-based testbed for realistic multi-robot simulation. Our testbed uses MORSE simulator for realistic simulation and a computer cluster for decentralized computation. We released our MORSE simulation scenarios, the developed ROS packages, and the scripts for autonomous deployment, as open-source publicly available to the research community. In addition, we provided a detailed description of benchmarking process based on experimental design, which aimed to improve the reproducibility of experiments. We advocate that an experimental design must explicitly declare all elements of a benchmark such as parameters and metrics. Our testbed is fully automated, which enables to continuously benchmark different algorithms under different conditions, without any manual intervention.
Another contribution of this paper is an experience report on building a testbed with shared-use computer cluster as is often the case in many institutions. We showed how to set up the testbed in such a context, the challenges and how to face them. To validate and evaluate our testbed, we benchmarked the frontier-based exploration approach with a fleet of robots using a probabilistic map merging algorithm. While most parameters were with fixed values, we varied a few of them: the number of robots and the terrain characteristics. We thus demonstrated the impact of the latter on the exploration performance.
As with future work, we would like to define a collection of reference experimental designs. The collection will consist of several vectors, where each vector corresponds to a set of particular values with respect to robot, fleet and environment. Our goal is to provide the multi-robot community with the seed for a database that will be used to compare different algorithms similarly to what is done in other communities. This should ultimately provide us insights on how to compare existing solutions, and which algorithm should be used for a given problem.
Acknowledgments
This work is part of the SUCRé project that is supported by the Nord-Pas-de-Calais region of France.
Author Contributions
Zhi Yan, Luc Fabresse, Jannik Laval and Noury Bouraqadi designed the testbed; Zhi Yan implemented the testbed and performed the experiments; Zhi Yan, Luc Fabresse, Jannik Laval and Noury Bouraqadi wrote the paper.
Conflicts of Interest
The authors declare no conflict of interest.
References
- Parker, L.E. Multiple Mobile Robot Systems; Springer: Berlin/Heidelberg, Germany, 2008; pp. 921–941. [Google Scholar]
- Yan, Z.; Jouandeau, N.; Cherif, A.A. A Survey and Analysis of Multi-Robot Coordination. Int. J. Adv. Robot. Syst. 2013, 10, 399. [Google Scholar] [CrossRef]
- Yamauchi, B. Frontier-Based Exploration Using Multiple Robots. In Proceedings of the 2nd International Conference on Autonomous Agents, Minneapolis, MN, USA, 10–13 May 1998; pp. 47–53. [Google Scholar]
- Burgard, W.; Moors, M.; Fox, D.; Simmons, R.; Thrun, S. Collaborative Multi-Robot Exploration. In Proceedings of the 2000 IEEE International Conference on Robotics and Automation (ICRA), San Francisco, CA, USA, 24–28 April 2000; pp. 476–481. [Google Scholar]
- Vazquez, J.; Malcolm, C. Distributed Multirobot Exploration Maintaining a Mobile Network. In Proceedings of the 6th IEEE International Conference on Intelligent Systems (IS), Varna, Bulgaria, 22–24 June 2004; pp. 113–118. [Google Scholar]
- Howard, A. Multi-robot Simultaneous Localization and Mapping using Particle Filters. Int. J. Robot. Res. 2006, 25, 1243–1256. [Google Scholar] [CrossRef]
- Sheng, W.; Yang, Q.; Tan, J.; Xi, N. Distributed multi-robot coordination in area exploration. Robot. Auton. Syst. 2006, 54, 945–955. [Google Scholar] [CrossRef]
- Rooker, M.N.; Birk, A. Multi-robot exploration under the constraints of wireless networking. Control Eng. Pract. 2007, 15, 435–445. [Google Scholar] [CrossRef]
- Doniec, A.; Bouraqadi, N.; Defoort, M.; Le, V.T.; Stinckwich, S. Distributed Constraint Reasoning Applied to Multi-robot Exploration. In Proceedings of the 21st IEEE International Conference on Tools with Artificial Intelligence (ICTAI), Newark, NJ, USA, 2–4 November 2009; pp. 159–166. [Google Scholar]
- Stachniss, C. Robotic Mapping and Exploration; Springer: Berlin, Germany, 2009. [Google Scholar]
- Cabrera-Mora, F.; Xiao, J. A Flooding Algorithm for Multirobot Exploration. IEEE Trans. Syst. Man Cybern. Part B 2012, 42, 850–863. [Google Scholar] [CrossRef] [PubMed]
- Moratuwage, D.; Wang, D.; Rao, A.; Senarathne, N.; Wang, H. RFS Collaborative Multivehicle SLAM: SLAM in Dynamic High-Clutter Environments. IEEE Robot. Autom. Mag. 2014, 21, 53–59. [Google Scholar] [CrossRef]
- Saeedi, S.; Paull, L.; Trentini, M.; Seto, M.; Li, H. Group Mapping: A Topological Approach to Map Merging for Multiple Robots. IEEE Robot. Autom. Mag. 2014, 21, 60–72. [Google Scholar] [CrossRef]
- Yan, Z.; Fabresse, L.; Laval, J.; Bouraqadi, N. Team Size Optimization for Multi-robot Exploration. In Proceedings of the 4th International Conference on Simulation, Modeling, and Programming for Autonomous Robots (SIMPAR), Bergamo, Italy, 20–23 October 2014; pp. 438–449. [Google Scholar]
- Faigl, J.; Kulich, M. On benchmarking of frontier-based multi-robot exploration strategies. In Proceedings of the 2015 European Conference on Mobile Robots (ECMR), Lincoln, UK, 2–4 September 2015. [Google Scholar]
- Couceiro, M.S.; Vargas, P.A.; Rocha, R.P.; Ferreira, N.M.F. Benchmark of swarm robotics distributed techniques in a search task. Robot. Auton. Syst. 2014, 62, 200–213. [Google Scholar] [CrossRef] [Green Version]
- Bonsignorio, F.; Pobil, A.P.D.; Messina, E. Fostering Progress in Performance Evaluation and Benchmarking of Robotic and Automation Systems. IEEE Robot. Autom. Mag. 2014, 21, 22–25. [Google Scholar] [CrossRef]
- Taylor, J.R.; Drumwright, E.M.; Parmer, G. Making Time Make Sense in Robotic Simulation. In Proceedings of the 4th International Conference on Simulation, Modeling, and Programming for Autonomous Robots (SIMPAR), Bergamo, Italy, 20–23 October 2014; pp. 1–12. [Google Scholar]
- Kudelski, M.; Gambardella, L.M.; Caro, G.A.D. RoboNetSim: An integrated framework for multi-robot and network simulation. Robot. Auton. Syst. 2013, 61, 483–496. [Google Scholar] [CrossRef]
- Gerkey, B.P.; Vaughan, R.T.; Howard, A. The Player/Stage Project: Tools for Multi-Robot and Distributed Sensor Systems. In Proceedings of the 11th International Conference on Advanced Robotics (ICAR), Coimbra, Portugal, 30 June–3 July 2003; pp. 317–323. [Google Scholar]
- Michel, O. Cyberbotics Ltd. WebotsTM: Professional Mobile Robot Simulation. Int. J. Adv. Robot. Syst. 2004, 1, 39–42. [Google Scholar] [CrossRef]
- Freese, M.; Singh, S.P.N.; Ozaki, F.; Matsuhira, N. Virtual Robot Experimentation Platform V-REP: A Versatile 3D Robot Simulator. In Proceedings of the 2nd International Conference on Simulation, Modeling, and Programming for Autonomous Robots (SIMPAR), Darmstadt, Germany, 15–18 November 2010; pp. 51–62. [Google Scholar]
- Koenig, N.P.; Howard, A. Design and use paradigms for Gazebo, an open-source multi-robot simulator. In Proceedings of the 2004 IEEE/RSJ International Conference on Intelligent Robots and Systems (IROS), Chicago, IL, USA, 14–18 September 2004; pp. 2149–2154. [Google Scholar]
- Echeverria, G.; Lemaignan, S.; Degroote, A.; Lacroix, S.; Karg, M.; Koch, P.; Lesire, C.; Stinckwich, S. Simulating Complex Robotic Scenarios with MORSE. In Proceedings of the 3rd International Conference on Simulation, Modeling, and Programming for Autonomous Robots (SIMPAR), Tsukuba, Japan, 5–8 November 2012; pp. 197–208. [Google Scholar]
- Quigley, M.; Conley, K.; Gerkey, B.; Faust, J.; Foote, T.; Leibs, J.; Wheeler, R.; Ng, A.Y. ROS: An open-source Robot Operating System. In Proceedings of the ICRA’09 Workshop on Open Source Software, Guiyang, China, 18–20 September 2009. [Google Scholar]
- Del Pobil, A.P.; Madhavan, R.; Messina, E. Benchmarks in robotics research. In Proceedings of the 2006 IEEE/RSJ International Conference on Intelligent Robots and Systems, Beijing, China, 9–15 October 2006. [Google Scholar]
- Anderson, M.; Jenkins, O.C.; Osentoski, S. Recasting Robotics Challenges as Experiments. IEEE Robot. Autom. Mag. 2011, 18, 10–11. [Google Scholar] [CrossRef]
- Michael, N.; Fink, J.; Kumar, V. Experimental Testbed for Large Multirobot Teams. IEEE Robot. Autom. Mag. 2008, 15, 53–61. [Google Scholar] [CrossRef]
- Okada, T.; abd Razvan Beuran, J.N.; Tan, Y.; Shinoda, Y. Large-scale Simulation Method of Mobile Robots. In Proceedings of the IEEE 2nd International Symposium on Universal Communication (ISUC), Osaka, Japan, 15–16 December 2008. [Google Scholar]
- Yan, Z.; Fabresse, L.; Laval, J.; Bouraqadi, N. Metrics for Performance Benchmarking of Multi-robot Exploration. In Proceedings of the 2015 IEEE/RSJ International Conference on Intelligent Robots and Systems (IROS), Hamburg, Germany, 28 September–2 October 2015; pp. 3407–3414. [Google Scholar]
- Le, V.T.; Bouraqadi, N.; Stinckwich, S.; Moraru, V.; Doniec, A. Making networked robots connectivity-aware. In Proceedings of the 2009 IEEE International Conference on Robotics and Automation (ICRA), Kobe, Japan, 12–17 May 2009; pp. 3502–3507. [Google Scholar]
- Lampe, A.; Chatila, R. Performance Measure for the Evaluation of Mobile Robot Autonomy. In Proceedings of the 2006 IEEE International Conference on Robotics and Automation (ICRA), Orlando, FL, USA, 15–19 May 2006; pp. 4057–4062. [Google Scholar]
- Zlot, R.; Stentz, A.T.; Dias, M.B.; Thayer, S. Multi-Robot Exploration Controlled by a Market Economy. In Proceedings of the 2002 IEEE International Conference on Robotics and Automation (ICRA), Washington, DC, USA, 11–15 May 2002. [Google Scholar]
- Frank, S.; Listmann, K.D.; Haumann, A.D.; Willert, V. Performance Analysis for Multi-robot Exploration Strategies. In Proceedings of the 2nd International Conference on Simulation, Modeling, and Programming for Autonomous Robots (SIMPAR), Darmstadt, Germany, 15–18 November 2010; pp. 399–410. [Google Scholar]
- Scrapper, C.; Madhavan, R.; Lakaemper, R.; Censi, A.; Godil, A.; Wagan, A.; Jacoff, A. Quantitative Assessment of Robot-Generated Maps. In Performance Evaluation and Benchmarking of Intelligent Systems; Springer: New York, NY, USA, 2009; pp. 221–248. [Google Scholar]
- Henderson, R.L. Job scheduling under the Portable Batch System. In Proceedings of the Workshop on Job Scheduling Strategies for Parallel Processing, Santa Barbara, CA, USA, 5 April 1995; Springer: Berlin, Germany; New York, NY, USA, 1995; pp. 279–294. [Google Scholar]
- Zhu, J.; Zheng, Q.; Liang, Y.; Liang, M. A component-based hybrid testbed for multi-mobile robots. In Proceedings of the 2009 International Conference on Information and Automation, Macau, China, 22–24 June 2009. [Google Scholar]
- Laval, J.; Fabresse, L.; Bouraqadi, N. A methodology for testing mobile autonomous robots. In Proceedings of the 2013 IEEE/RSJ International Conference on Intelligent Robots and Systems (IROS), Tokyo, Japan, 3–7 November 2013; pp. 1842–1847. [Google Scholar]
Figure 1.
MORSE 3D simulator (left) and collaborative generated map derived from one robot (right). In the left half, the red areas represent the laser scans. In the right half, the blue blocks indicate the potential targets, the green block indicates the current target, the red lines indicate the loop closures, and the green line represents the path planning from robot current position to the target position.
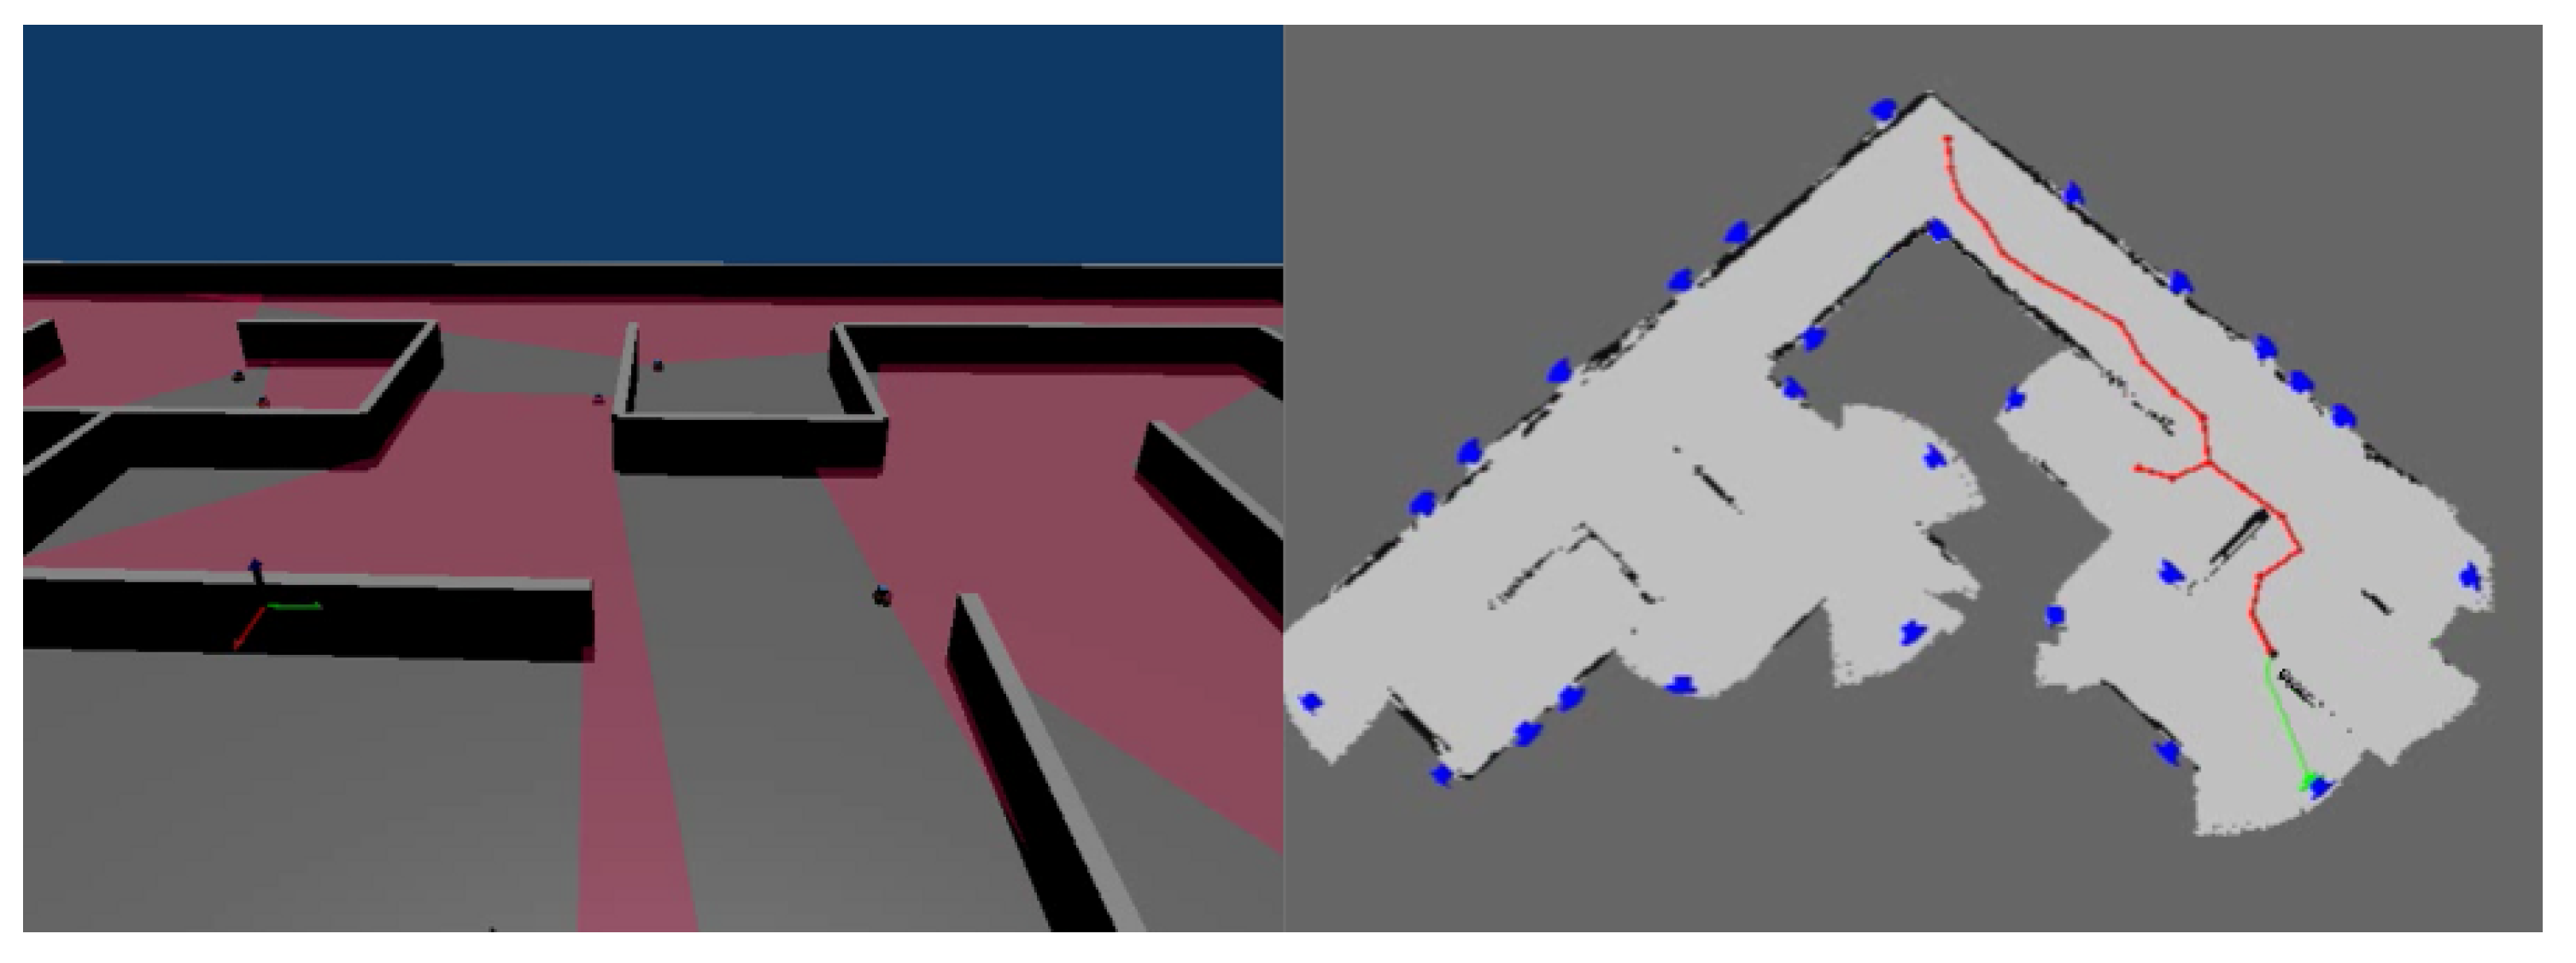
Figure 2.
A full benchmarking process: from experimental design to metric measurements.
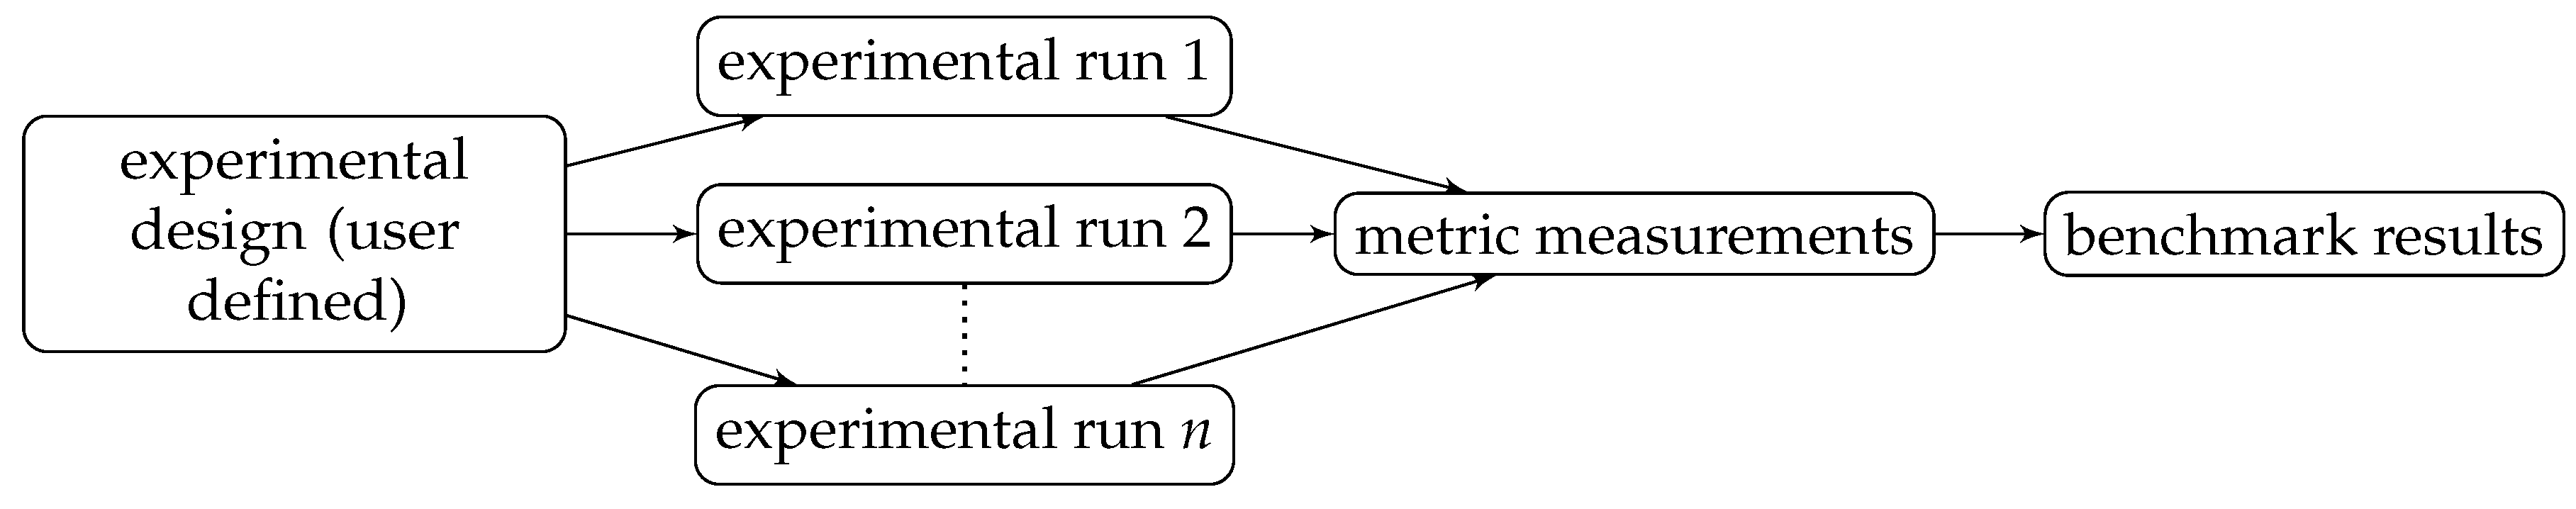
Figure 3.
Architecture of our testbed.

Figure 4.
Our experimental terrains.

Figure 5.
Architecture of our robot control software.
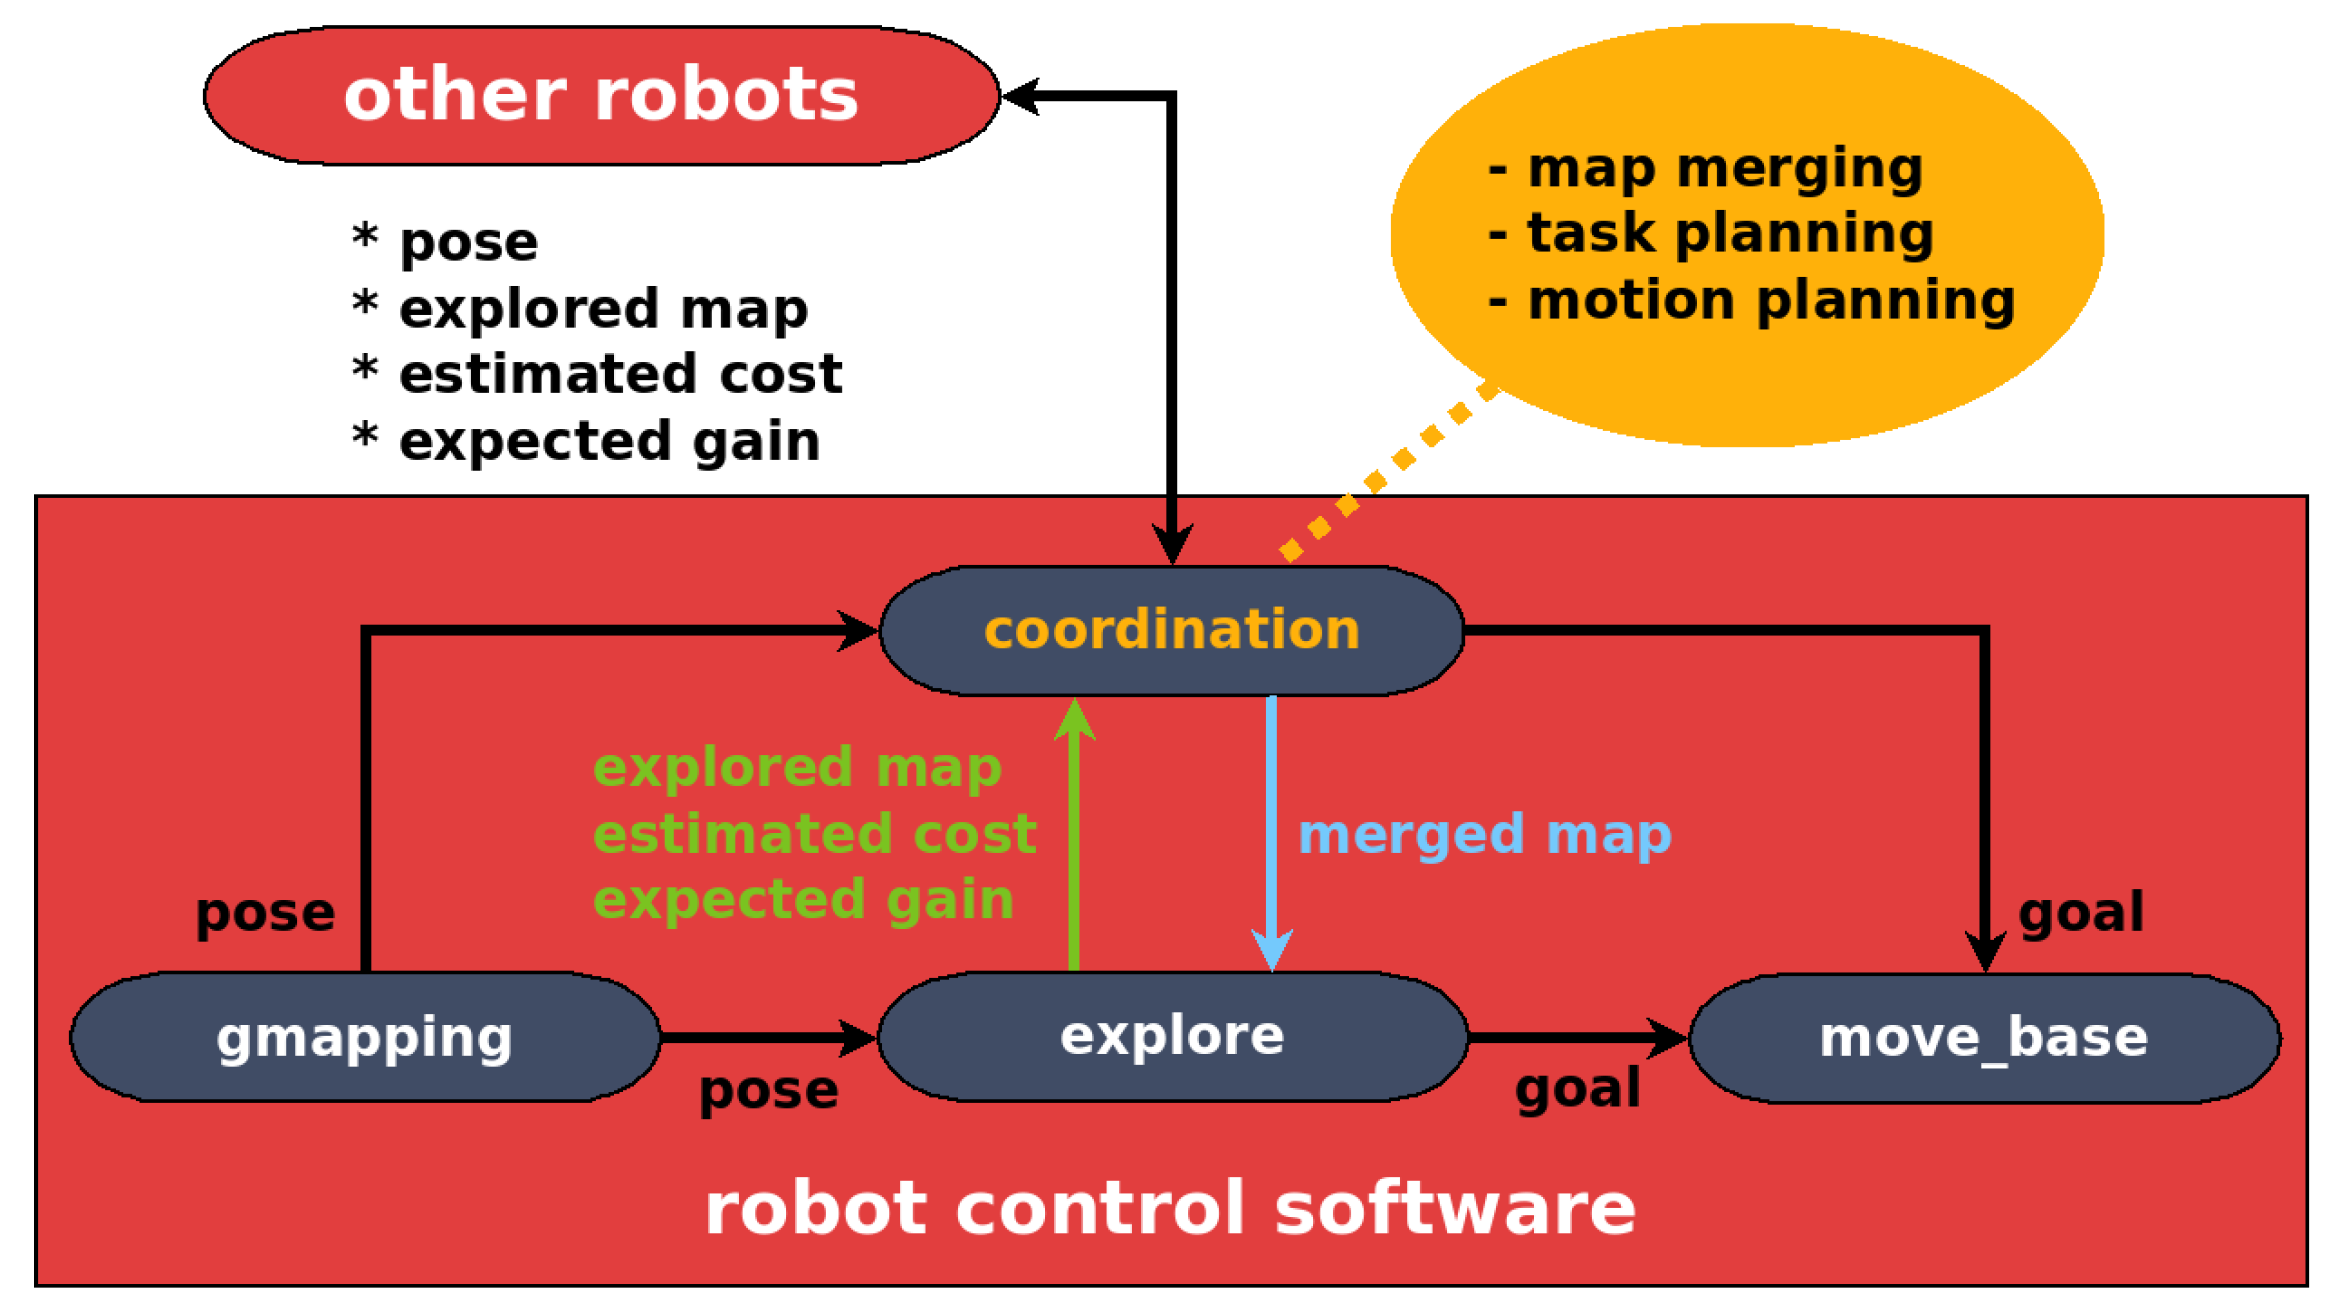
Figure 6.
Results from the use of “robot” metrics.

Figure 7.
Results from the use of “fleet” metrics.

Table 1.
Example of an experimental design.
| Parameters | Robot: Pioneer 3-DX |
| Number of robots: [1, 30] | |
| … | |
| Parameter vectors | All possible combinations |
| Iterations | 5 |
| Stop conditions | 99% of explored terrain |
| 2000 s of elapsed time | |
| Measurements | Explored area per simulation step |
| % of used CPU of each robot per 5 s | |
| … | |
| Metrics | Exploration time |
| Exploration cost | |
| … |
Table 2.
Performance testing with different emulated hardware configurations.
| Processor(s) per VM | 1 | 2 | 4 | 8 |
| Computing node(s) | ||||
| Robot(s) per node | 8 | 4 | 2 | 1 |
| Exploration time (in seconds) | 489 s | 349 s | 350 s | 384 s |
| Occupied network bandwidth (simulator ↔ robot controllers) | ≈85 Mb/s | |||
| RAM used by each VM | ||||
Table 3.
Frequencies used in our testbed.
| MORSE simulator | simulator | 60 Hz |
| laser | 25 Hz | |
| odometry | 10 Hz | |
| ROS packages | gmapping (transform_publish_period) | 10 Hz |
| move_base (controller_frequency) | 10 Hz |
Table 4.
Experimental design of a multi-robot frontier-based exploration.
| Parameters | Robot | Robot Model: Pioneer 3-DX |
| Computing Capabilities: | ||
| 2 CPUs, 2 GB RAM | ||
| Maximum speed: 1.2 m/s, 5.24 rad/s | ||
| Laser rangefinder: SICK LMS500 | ||
| Fleet | Number of robots: [1, 30] | |
| Homogeneity: | ||
| homogeneous (Pioneer 3-DX) | ||
| Robot initial positions: | ||
| top left to bottom left corner, every 2 m | ||
| Communication network: | ||
| wired Gigabit Ethernet | ||
| Communication range: 200 m | ||
| Environment | Terrains: | |
| Terrain size: 80 m × 80 m | ||
| Obstacle height: 2 m | ||
| Road width: 8 m | ||
| Parameter vectors | All possible combinations | |
| Iterations | 5 | |
| Stop conditions | 99% of explored terrain | |
| 2000 s of elapsed time | ||
| Measurements | Explored area per simulation step | |
| % of CPU used by each robot every 5 s | ||
| % of RAM used by each robot every 5 s | ||
| Kbytes received by each robot every 5 s | ||
| Kbytes sent by each robot every 5 s | ||
| Metrics | Exploration time | |
| Exploration cost | ||
| Exploration efficiency | ||
| Map quality | ||
© 2017 by the authors. Licensee MDPI, Basel, Switzerland. This article is an open access article distributed under the terms and conditions of the Creative Commons Attribution (CC BY) license (http://creativecommons.org/licenses/by/4.0/).
Share and Cite
MDPI and ACS Style
Yan, Z.; Fabresse, L.; Laval, J.; Bouraqadi, N. Building a ROS-Based Testbed for Realistic Multi-Robot Simulation: Taking the Exploration as an Example. Robotics 2017, 6, 21. https://doi.org/10.3390/robotics6030021
AMA Style
Yan Z, Fabresse L, Laval J, Bouraqadi N. Building a ROS-Based Testbed for Realistic Multi-Robot Simulation: Taking the Exploration as an Example. Robotics. 2017; 6(3):21. https://doi.org/10.3390/robotics6030021
Chicago/Turabian StyleYan, Zhi, Luc Fabresse, Jannik Laval, and Noury Bouraqadi. 2017. "Building a ROS-Based Testbed for Realistic Multi-Robot Simulation: Taking the Exploration as an Example" Robotics 6, no. 3: 21. https://doi.org/10.3390/robotics6030021
Note that from the first issue of 2016, this journal uses article numbers instead of page numbers. See further details here.