Convolutional Neural Network based Estimation of Gel-like Food Texture by a Robotic Sensing System

1
Department of Mechanical Engineering, Graduate School of Engineering, Osaka University, 2-1 Yamadaoka, Suita 565-0871, Japan
2
San-Ei Gen F.F.I., Inc., 1-1-11 Sanwa-cho, Toyonaka 561-8588, Japan
*
Author to whom correspondence should be addressed.
Robotics 2017, 6(4), 37; https://doi.org/10.3390/robotics6040037
Submission received: 31 October 2017
/
Revised: 24 November 2017
/
Accepted: 29 November 2017
/
Published: 1 December 2017
Abstract
:This paper presents a robotic sensing system that evaluates the texture of gel-like food, in which not only mechanical characteristics, but also geometrical characteristics of the texture are objectively and quantitatively evaluated. When a human chews a gel-like food, the person perceives the changes in the shape and contact force simultaneously on the tongue. Based on their impression, they evaluate the texture. To reproduce this procedure using a simple artificial mastication robot, the pressure distribution of the gel-like food is measured, and the information associated with both the geometrical and mechanical characteristics is simultaneously acquired. The relationship between the value of the human sensory evaluation of the texture and the pressure distribution image is then modeled by applying a convolutional neural network. Experimental results show that the proposed system succeeds in estimating the values of a human sensory evaluation for 23 types of gel-like food with a coefficient of determination greater than 0.92.
1. Introduction
So far, human haptic perception [1] and haptic sensor-display devices [2,3] have been studied. Let us consider food texture that a human perceives in the mouth. Gel-like foods used in nursing care have been developed for the nutritional support and rehabilitation of elderly people with oral difficulties. Such gel-like foods are soft and fragile, allowing them to be broken up by the tongue without the use of the teeth. However, from the viewpoint of quality of life for persons under nursing-care, it is desirable for such foods to have a delicious taste while maintaining safety during mastication and swallowing [4]. Deliciousness depends not only on the chemical properties such as taste or aroma, but also on physical properties such as texture [5]. Compared with liquid food, texture is particularly more important for solid food, including gel-like food used in nursing care [6].
When a human compresses and fractures food with their teeth, tongue and palate, he/she perceive the changes in food shape, size and contact force simultaneously. Food texture is the impression in mouth during this process. Food texture is expressed by various terms [7] and categorized into mechanical characteristics (e.g., hardness and fragility) and geometrical characteristics (e.g., smoothness, stickiness and granularity) [8] and is evaluated by humans directly through a sensory evaluation. Therefore, a tremendous amount of labor is required to collect reliable and equitable evaluation data. Regarding such mechanical characteristics, an instrumental evaluation method that quantitatively assesses the food texture through physical measurements has been developed. In texture profile analysis (TPA) [9], the texture is evaluated based on the force response curve obtained through compression. The instruments used with this principle have come into practical use [10,11]. In addition, other studies have applied robotics and sensing techniques to evaluate texture. Iwata et al. developed a haptic device that displays the force profile obtained via measurements in a human’s mouth when biting into food [12]. Sun et al. discussed the design of a chewing machine that can analyze the food texture, where the 3D force profile during food chewing is measured [13]. Xu et al. developed a life-sized masticatory robot for characterizing texture, where the required torque of the actuators for chewing motion is evaluated using foods with different degrees of hardness [14]. These studies have attempted to evaluate the force- or torque-response-based texture, namely the mechanical characteristics.
On the other hand, a vision system and image analysis have been utilized to recognize the geometrical condition of food bolus during or after mastication. Hoebler et al. employed an image analysis to recognize the particle sizes of pasta after mastication [15]. Using the spatial gray level dependence method (SGLDM) [16], Arvisenet et al. differentiated the images of apples crunched using instrumental mastication with different compression motions [17]. Tournier et al. succeeded in classifying bread boluses made under different conditions of mastication using SGLDM [18]. Instead of using vision, Kohyama et al. discussed the relationship between the water activity value of crackers and the pressure distribution measured through a compression test [19]. Using SGLDM, they also discussed the characterization of the pressure distribution of the fracturing of a crispy food product [20]. In the authors’ previous work, we discussed a method for modeling the pressure distribution data and texture using SGLDM [21]. Johnson and Adelson developed the GelSight sensor that can measure the 3D shape and size of an object and detected the characteristic appearance of the surface of a biscuit [22]. As mentioned above, there are several approaches to acquiring the geometrical characteristics of food. However, there are no instrumental methods that can adapt to various food textures associated with delicate impressions during mastication.
This paper presents a robotic sensing system for evaluating food texture, in which not only mechanical characteristics, but also geometrical characteristics of the texture of gel-like food can be evaluated. To artificially reproduce the basic principle of human texture sensing, the proposed system comprises pressure distribution measurements and texture estimation processing. Using a simple artificial mastication robot, the pressure distribution of the gel-like food during compression and fracturing is measured, allowing the information associated with both the geometrical and mechanical characteristics to be simultaneously acquired. The pressure distribution data are treated as a time series image. In recent years, convolutional neural networks (CNN) have been actively used as a powerful tool for adaptive image classification [23,24,25,26,27]. The advantage of CNN is to learn the filters that work as the feature extractor, whereas this function was hand-designed based on the prior knowledge and effort of designers in traditional methods. By employing a CNN, appropriate features of a pressure distribution image are extracted, and the relationship between the human sensory evaluation of texture and the pressure distribution data is mathematically modeled. Finally, the proposed system was verified experimentally using 23 different kinds of gel-like food and four texture terms. It was shown that the values of a sensory evaluation can be appropriately estimated.
The remainder of this paper is organized as follows. In Section 2, an outline of the proposed system is described. In Section 3, pressure distribution measurements using a simple mastication robot are provided. In Section 4, an input image and the architecture of the CNN model are presented. In Section 5, the experimental validation is described. Finally, Section 6 provides some concluding remarks regarding this study.
2. Outline of the Proposed Sensing System
Figure 1 shows an outline of the proposed sensing system evaluating the texture of gel-like foods.
Preparation of the value of the sensory evaluation: The values of the human sensory evaluation for various types of gel-like food, which are handled as the teaching data, are obtained by a panel of experts, as shown in Figure 1a. Let denote the value of the sensory evaluation for texture term i (e.g., elasticity, ; smoothness, ), where is defined within the range of 0–100. See Section 5.1 for details.
Pressure distribution measurement: To reproduce human mastication using the tongue, a simple mastication robot is utilized, as shown in Figure 1b. The robot is composed of a base, movable upper plate and a pressure distribution sensor. The pressure distribution sensor is implemented in the base. The gel-like food sample is compressed and fractured on the base, and the pressure distribution p is measured as time series data, which can be processed as image frames. The pressure distribution data of various types of gel-like food with different textures are collected.
Texture estimation processing: As shown in Figure 1c, the relationship between the pressure distribution and the value of the sensory evaluation is modeled using a CNN. First, the input image for the CNN is formed by connecting the frames of the pressure distribution images. Then, a CNN model that outputs the value of the sensory evaluation of texture is constructed. The CNN model is trained using back propagation to reduce the error between the estimation and the true value. By giving the pressure distribution image of an unknown gel-like substance to the trained model, the value of the texture sensory evaluation can be estimated.
The details of the above procedure are described in the next section, along with representative experimental data.
3. Pressure Distribution Measurement
This section describes the pressure distribution measurement during artificial mastication. After describing the experimental setup, how the pressure distribution changes through the compression and fracturing of the gel-like food is shown.
3.1. Artificial Mastication
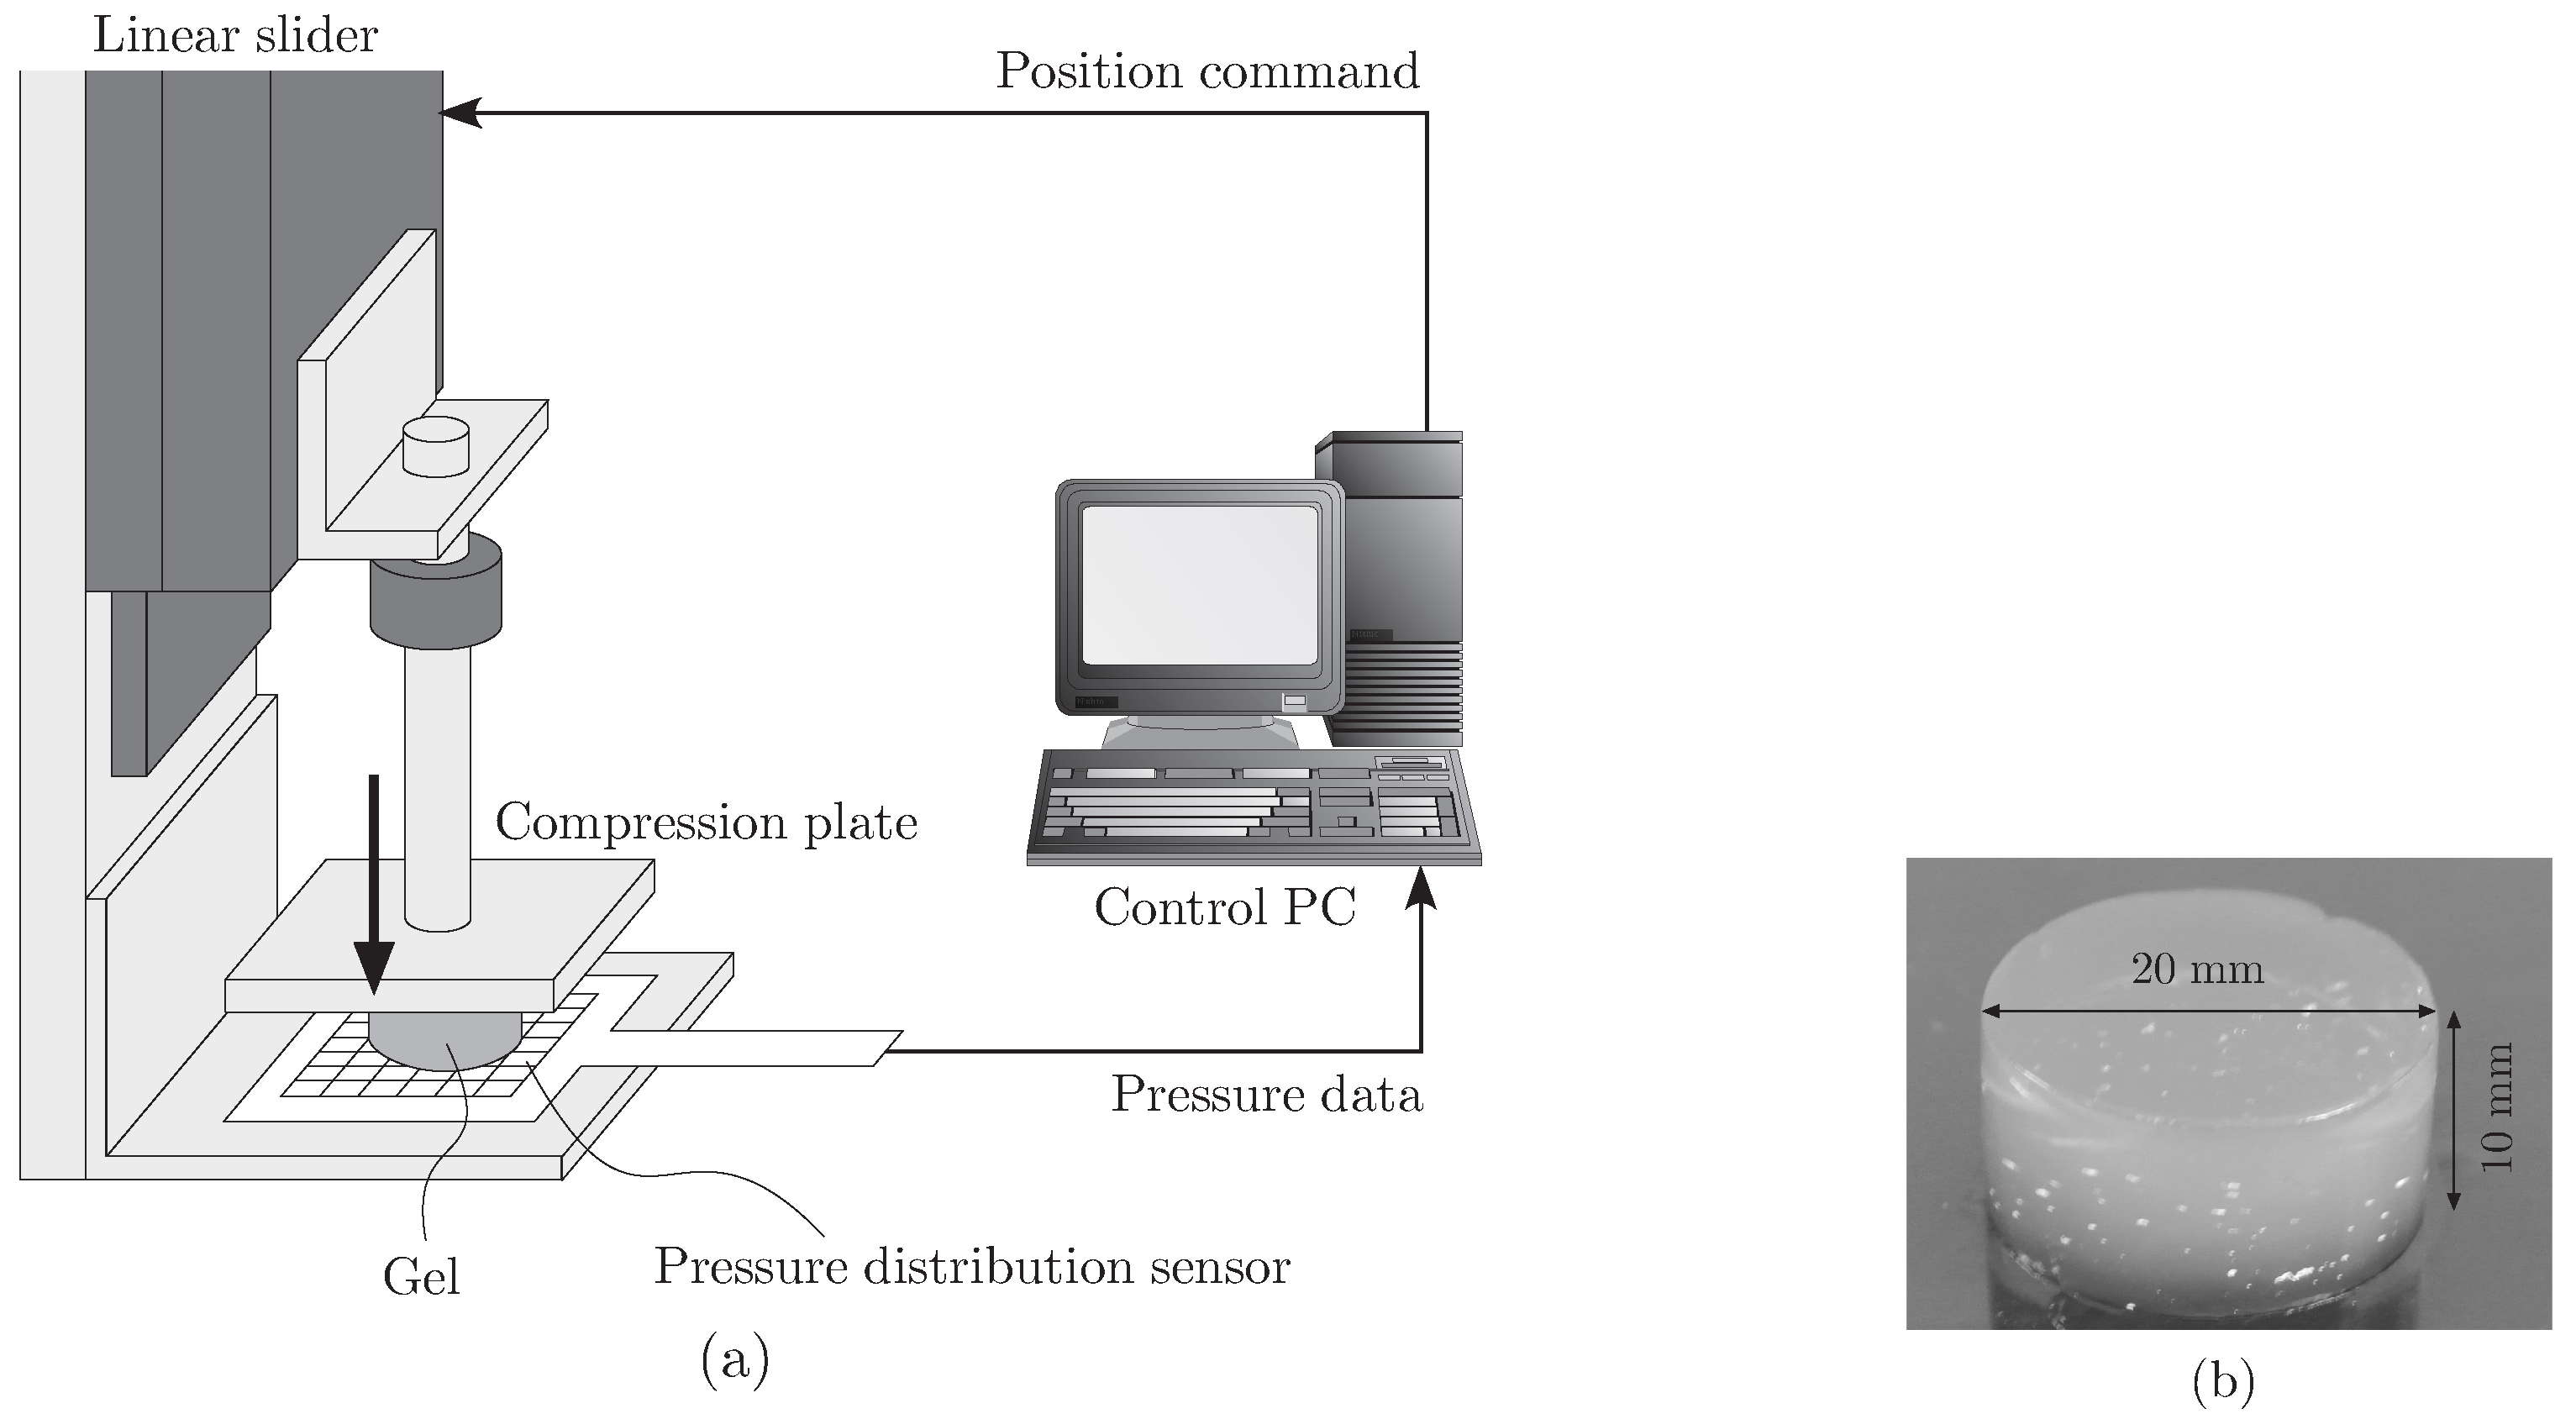
Figure 2a shows an overview of the experimental setup. Whereas the upper compression plate is driven using a linear slider controlled by a PC, the lower plate is fixed at the base. A pressure distribution sensor (I-SCAN System [28]), with a measurement range of 44 mm × 44 mm, a spatial resolution of 1 mm, a temporal resolution of 10 ms and a pressure resolution of 0.2 kPa, is attached to the surface of the lower plate. Figure 2b shows a representative gel-like food. The gel-like food has a cylindrical shape (diameter of 20 mm and height of 10 mm) and is placed at the center of the pressure distribution sensor. The upper plate moves downward and makes contact with the gel-like food ( s). The rigid plate moves downward at a speed of 2 mm/s, and the gel-like food is compressed and fractured for 4.5 s. During this period ( s), the pressure distribution is measured and recorded as time series data in the PC.
3.2. Pressure Distribution Image
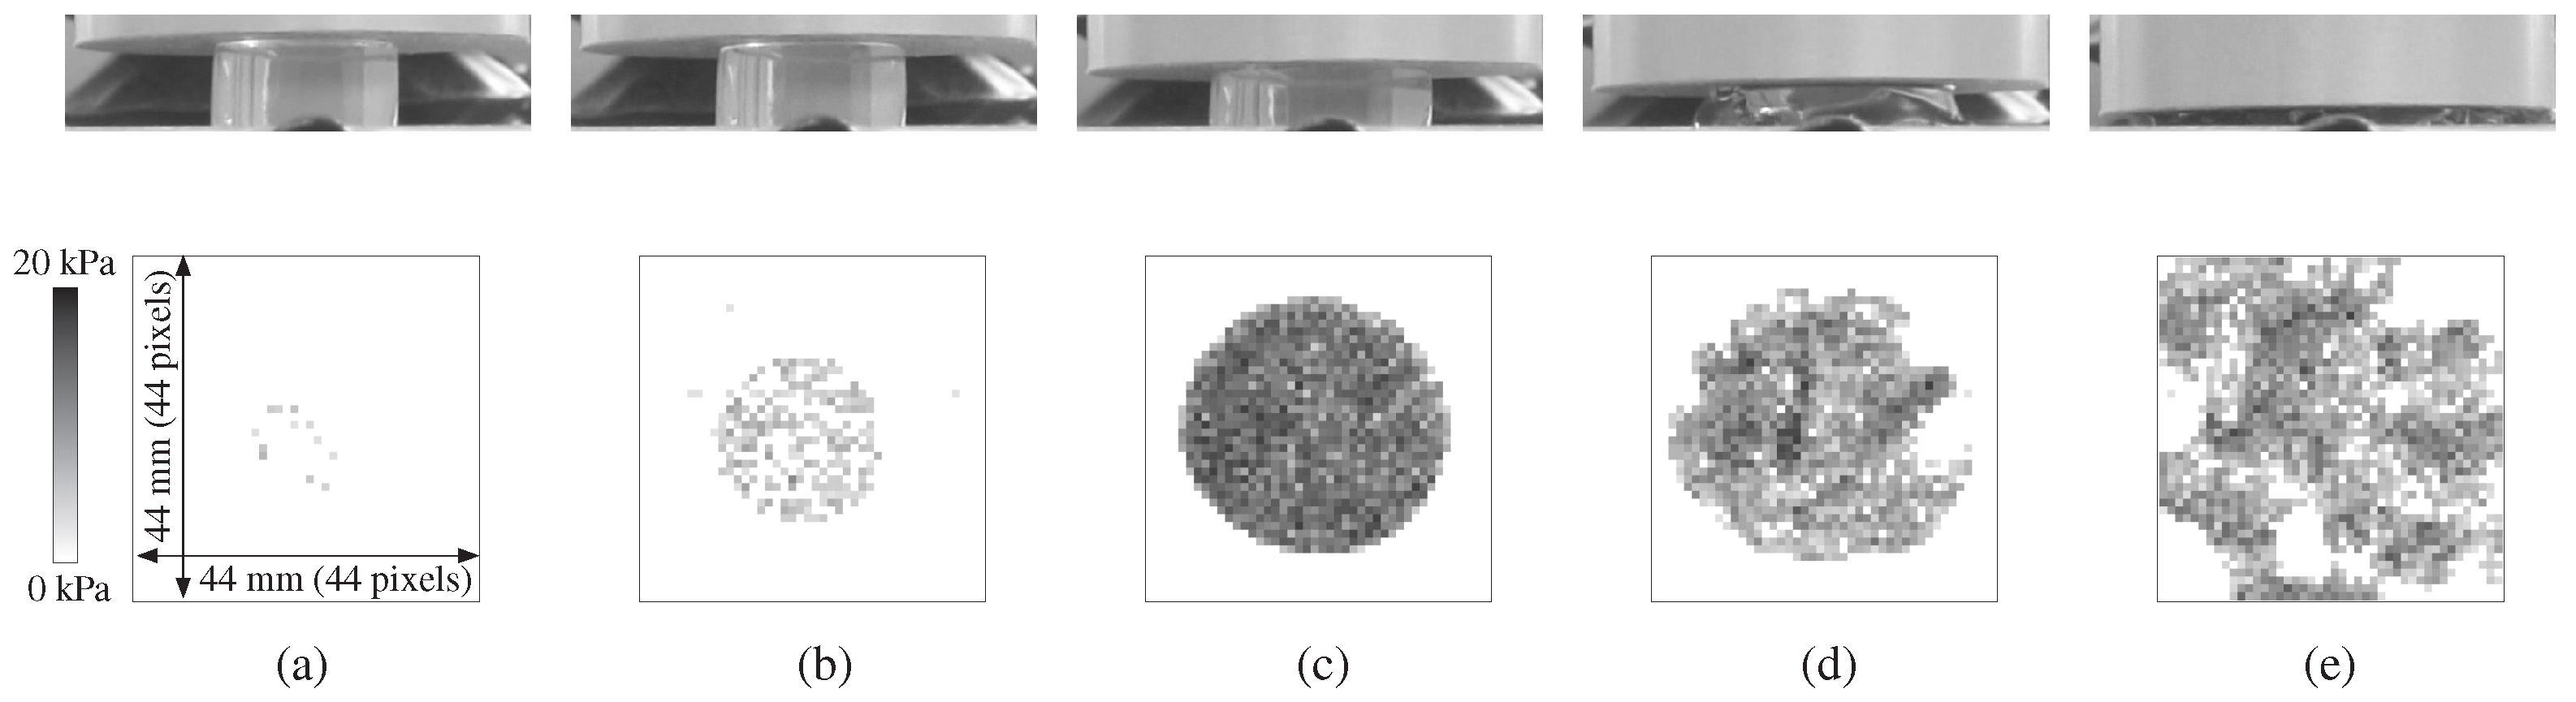
Considering a spatial resolution of 1 mm and measurement range of 44 mm × 44 mm for the pressure distribution sensor, a frame of the pressure distribution is converted into an image of 44 pixels × 44 pixels in size. Each pixel has an integer value within the range of 0–255, which corresponds to a pressure value within the range of 0–45 kPa.
Figure 3 shows images of a representative gel-like food during compression and fracturing, with the pressure distribution images shown in the second row. Figure 3a shows the first contact between the upper plate and the gel-like food, which can be detected by observing the output of the pressure distribution sensor. From this moment, the pressure distribution is recorded. As shown in Figure 3b, as the gel-like food is compressed, a pressure distribution with a circular shape is observed. As shown in Figure 3c, the gel-like food is further compressed, and the pressure distribution, which represents the surface size of the gel-like food, increases. The gel-like food is then fractured, as shown in Figure 3d, and it can be clearly observed based on the pressure distribution. Figure 3e shows the final state. In this case, the gel-like food is broken into smaller pieces, forming a paste. As described above, based on the pressure distribution measurement, we can see what occurs during the compression-fracture test of the gel-like food.
4. Texture Estimation Processing Using CNN
This section describes the preprocessing of the input image and the architecture of the CNN for modeling the relationship between the pressure distribution and the value of the texture sensory evaluation.
4.1. Input Image
As described in the previous section, time series pressure distribution data are treated as time series image data. Thus far, methods applying a time series image or video data as the input of a CNN have been proposed [29,30]. Saitoh et al. proposed a sequence image representation, namely a concatenated frame image (CFI) and a CFI-based CNN model for visual speech recognition [30]. A CFI is formed by concatenating frames sampled at uniform intervals from a video sequence. Based on this approach, some representative frames are chosen from the pressure distribution images and are serially connected. An outer frame with a width of two pixels and a value of zero is given in advance to each pressure image. This outer frame works as the boundary between neighboring images. Consequently, each pressure image becomes pixels pixels in size. In Figure 4, a reaction force response curve during compression and fracturing of a gel-like food is illustrated. As the plate compresses the gel-like food, the force increases. The gel-like food then begins to be fractured. At this moment (), the force decreases. Here, can be detected by checking whether the force response curve decreases with an appropriate threshold. After the force decreases once, it increases again until the plate stops (). Along with such a force response, we adopt two methods for sampling the pressure image frames. For the first method, fifteen image frames are sampled with uniform time intervals and are serially connected, as shown in the lower image in Figure 4. The number of frames is , and the frames at are sampled. For the second method, two representative image frames in the compression-fracture sequence are sampled and concatenated, as shown in the upper image in Figure 4. We sample the frame at the moment of fracture () and the frame at the final state of compression (). Note that the input image contains sufficient information regarding the temporal transition of the pressure distribution, whereas the input image contains the minimum information in this regard.
4.2. CNN Model
Various CNN models have been proposed, and the performance for classification tasks has been improved [23,24,25,26,27]. We designed a CNN model based on AlexNet [23], which is a typical CNN model. Figure 5 shows the CNN architecture utilized in this study, where local response normalization is skipped for simplicity. In addition, because we use this type of CNN model for regression, not for classification, the loss function is the mean squared error. The input data are a image or image, and the output is the value of the sensory evaluation of the texture. The size of the input image is . The CNN has four convolution layers, three pooling layers, two fully-connected layers and an output layer. The convolution layers C1, C2 and C3 have filters with a stride of one. Each convolution layer is followed by a pooling layer. All pooling layers use max pooling with a stride of two. The convolution layer C4 has filters with a stride of two. The number of filters for the four convolution layers are , , and , respectively. Through the fully-connected layers F1 and F2 (output layer) for regression, the estimated value of the sensory evaluation is obtained.
5. Experimental Validation
This section describes the experiments conducted to confirm the validity of the proposed system for the texture estimation.
5.1. Materials and Method
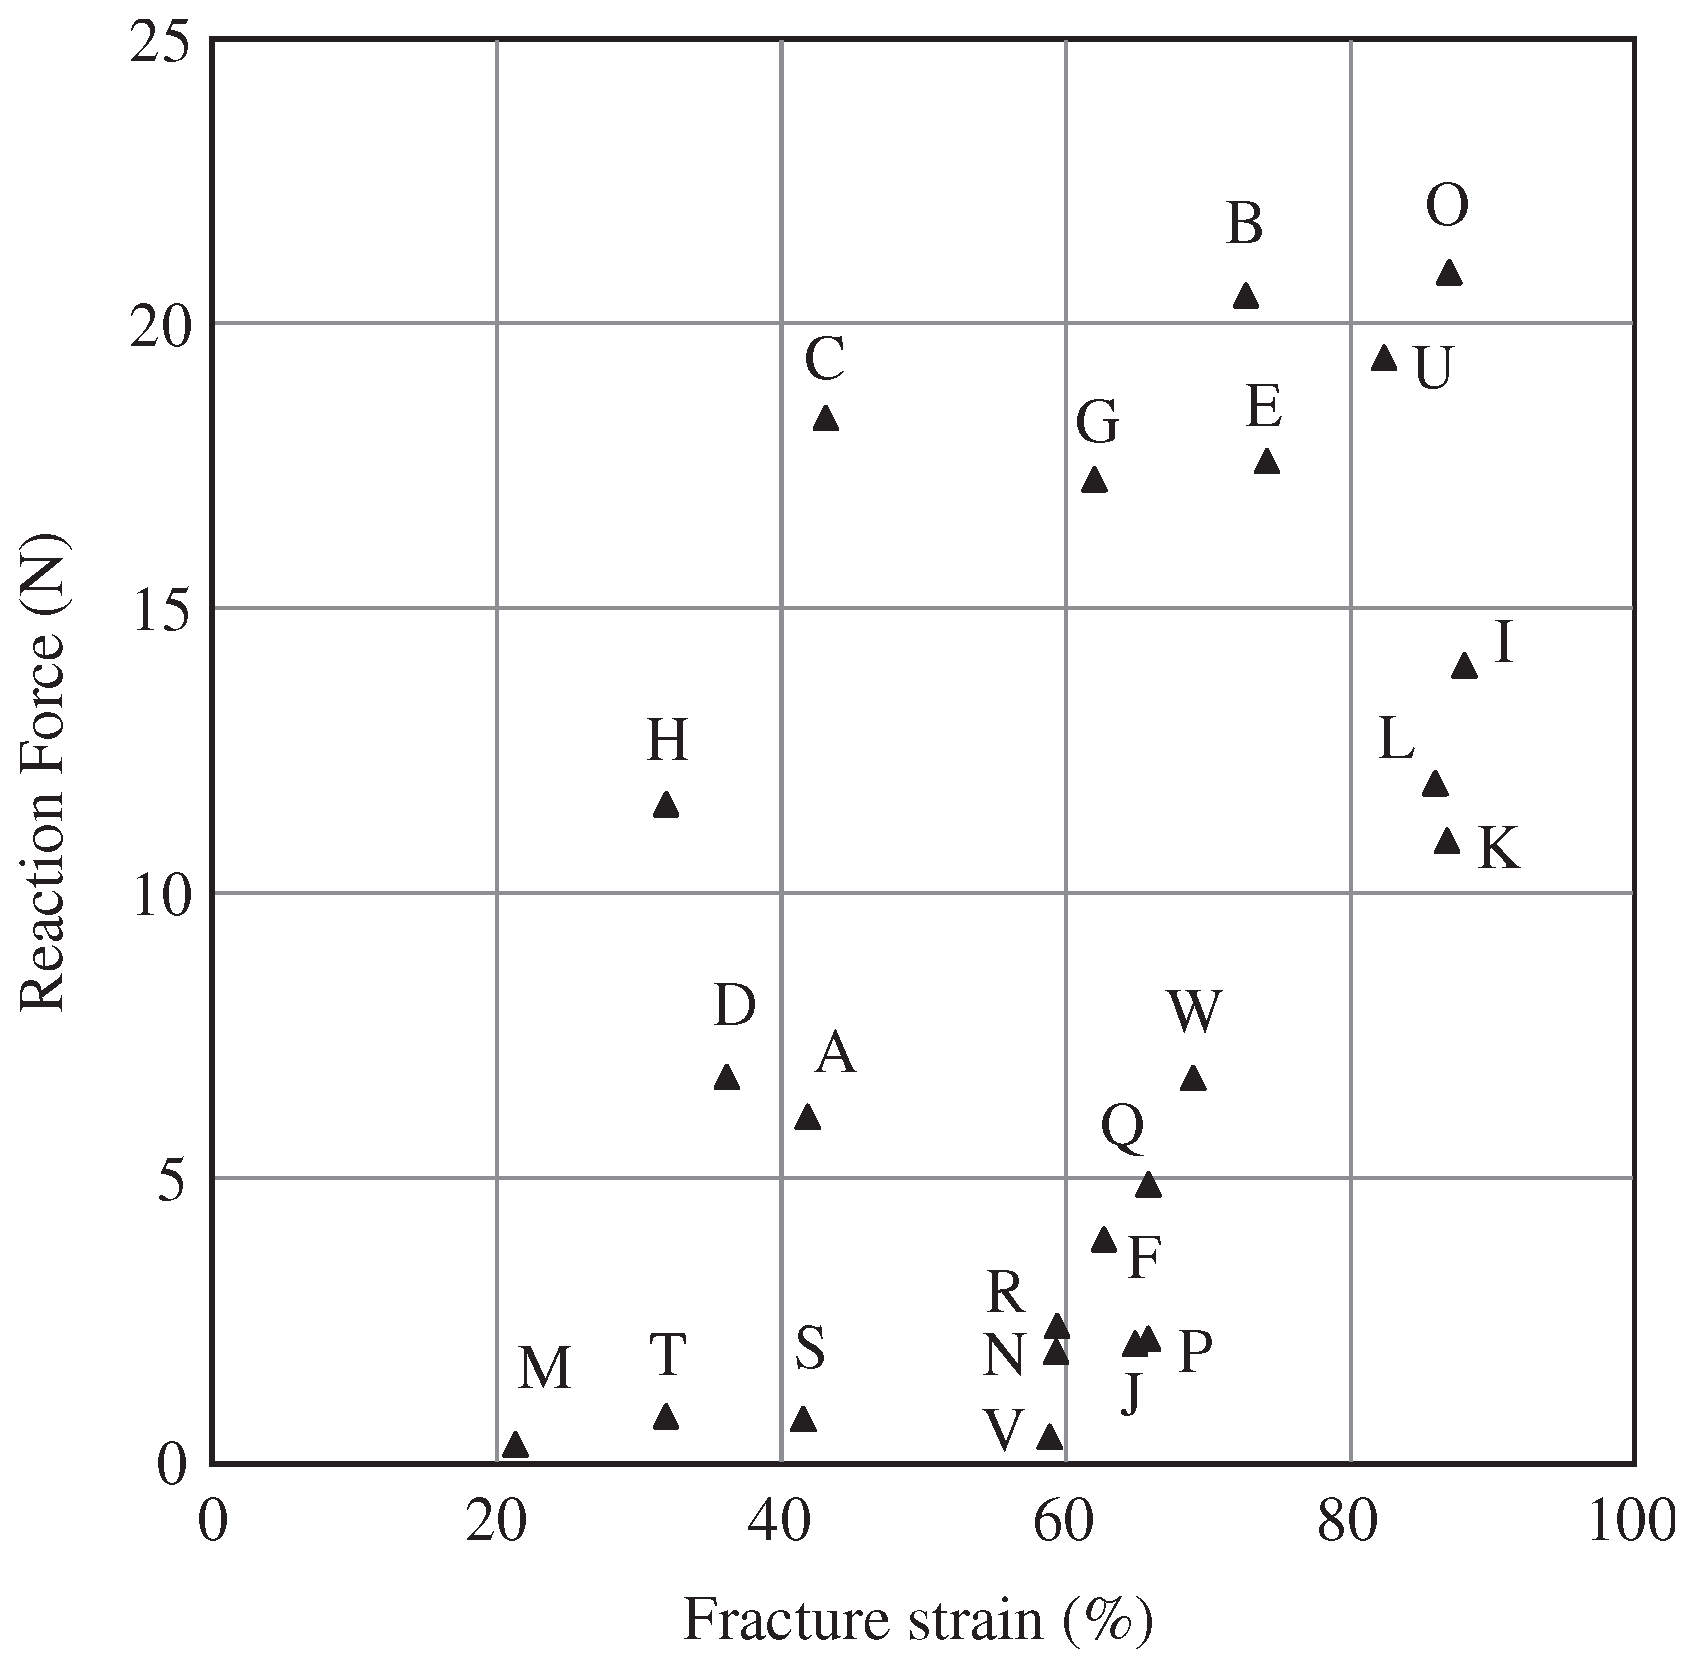
Twenty-three different types of gel-like food were tested. They were made by blending water, gellan gum, agar, etc. Figure 6 shows the fracture characteristics of the tested gel-like foods A–W. Four texture terms, elasticity (), smoothness (), stickiness () and granularity () were considered (Elasticity is the impression of a gel-like food’s extension and the extent to which it pushes back the tongue before fracturing. Smoothness is the impression of smoothness at the surface of the gel before fracturing. Stickiness is the impression of difficulty in spreading the gel-like food after fracturing. Granularity is the impression of granularity at the surface of the gel-like food after fracturing. We chose them from [7], as representative texture terms for evaluating gel-like foods.). Whereas elasticity is a mechanical characteristic, smoothness, stickiness and granularity are geometrical characteristics. In the preparations, a sensory evaluation based on the visual analog scale method [31] was carried out. In this method, a 100 mm-long scale was set with a texture term description, as shown in Figure 1a. The left side represents no sensation, and the right side indicates the maximum sensation of the texture term. The panelist marks a point on the line representing the sensation during mastication. The value of the sensory evaluation is determined by measuring the length from the left end of the line to the point marked by the panelist, in millimeters. Eight panelists participated in this experiment (they are experts of sensory evaluation of food texture). The mean values of the eight panelists were used as the teaching data for the modeling process. Table 1 shows – for the gel-like foods A–W.
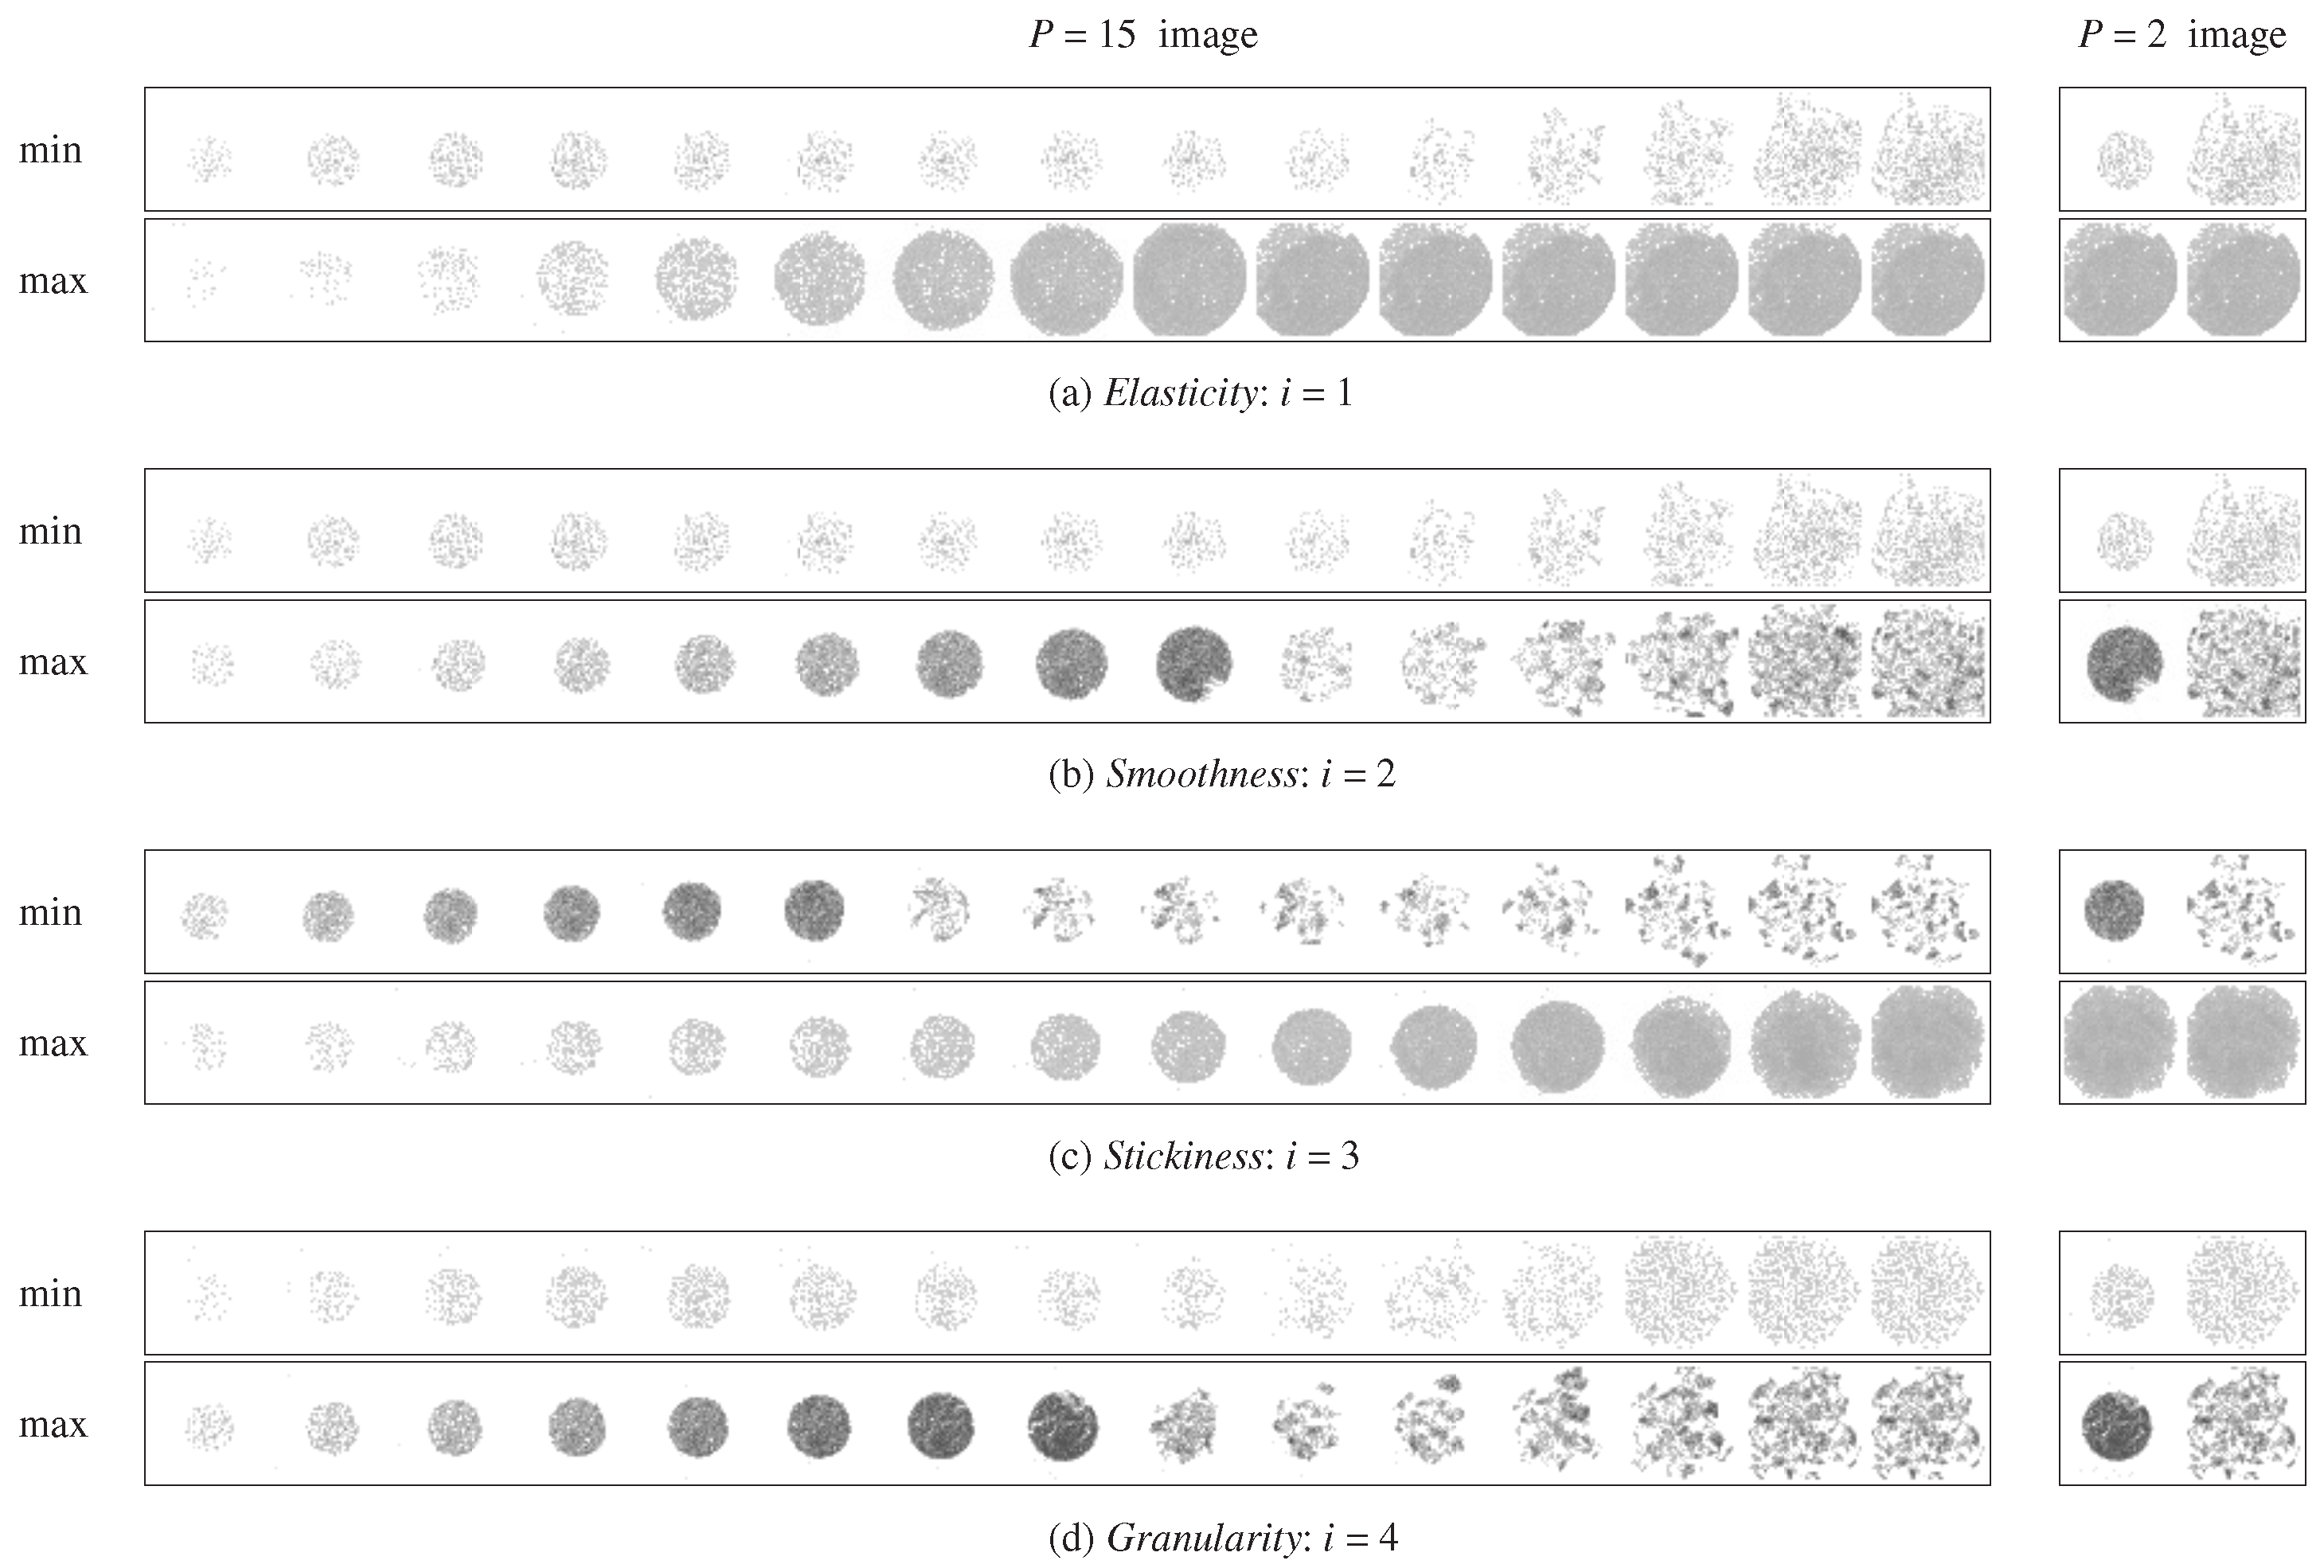
Figure 7 shows examples of the input images of and . For each texture term shown in (a–d), the upper row shows the input image of the gel-like food with the maximum value of the sensory evaluation, and the lower row shows the input image of the gel-like food with the minimum value of the sensory evaluation. In Figure 7, the pixel value of the image is twice its original value for greater visibility. In the lower row of Figure 7a,c, the input image of is formed by concatenating the same two pressure images at . In these gel-like foods, the force curve did not decrease clearly during the compression-fracturing test. Based on this, we set .
The pressure distribution data of 138 specimens (=23 types × 6 specimens each) were measured through the compression-fracture tests conducted on artificial mastication. We augmented the data by employing rotated images with angles of , and . Here, a leave-one-out cross validation (LOOCV) [32] was employed. In this experiment, one data point was excluded in advance from all 138 data points, where a data point consists of pressure distribution data and the value of the sensory evaluation. Using other data points, we trained the CNN model and estimated the value of the sensory evaluation of the excluded data point. Such training and estimation were applied for all 138 data points. Note that the CNN model was trained for each texture term i. We created and trained the CNN model on Chainer, a flexible framework for neural networks. We adopted a rectified linear unit (ReLU) as the activation function, except for the output layer. The activation function of the output layer is the identity function for regression. We trained the model using Adam [33] as the optimizer. Training was conducted with mini-batches of size eight and was stopped after 200 epochs.
5.2. Results and Discussion
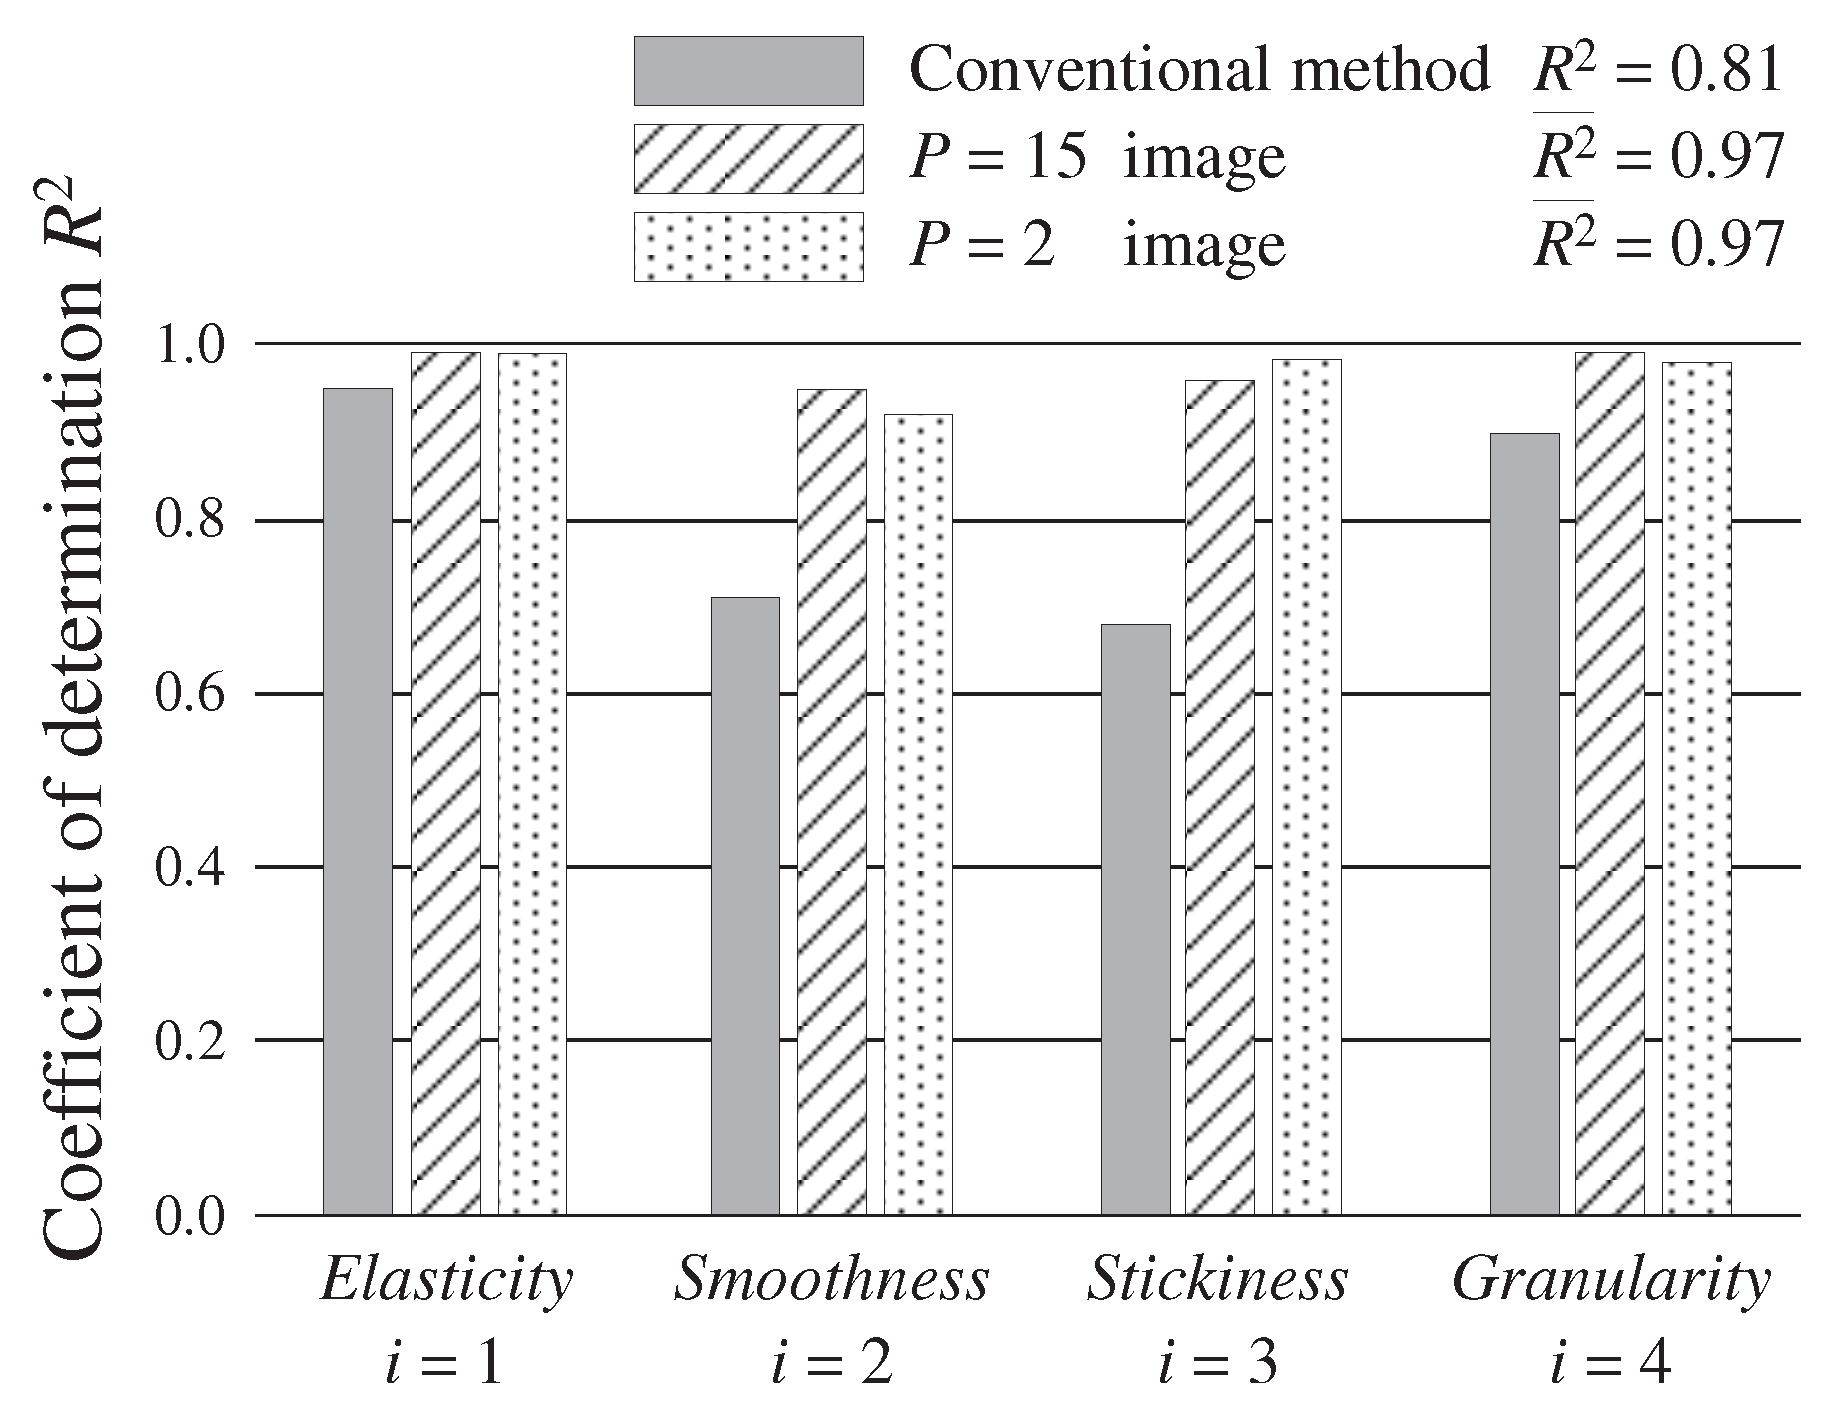
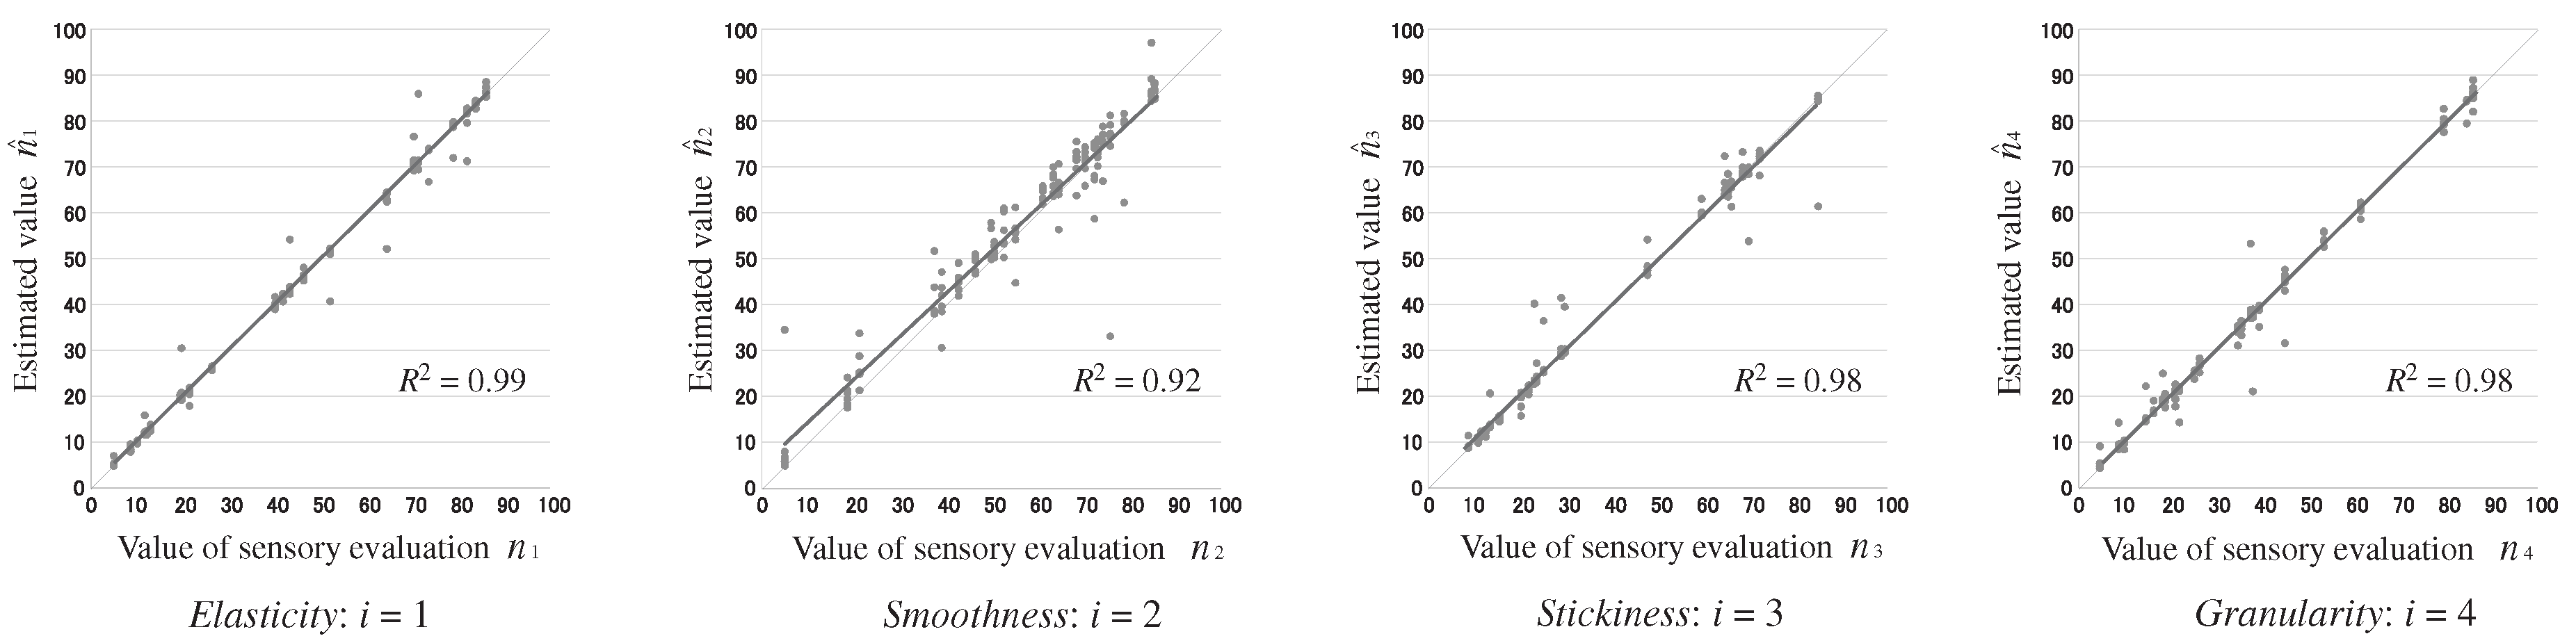
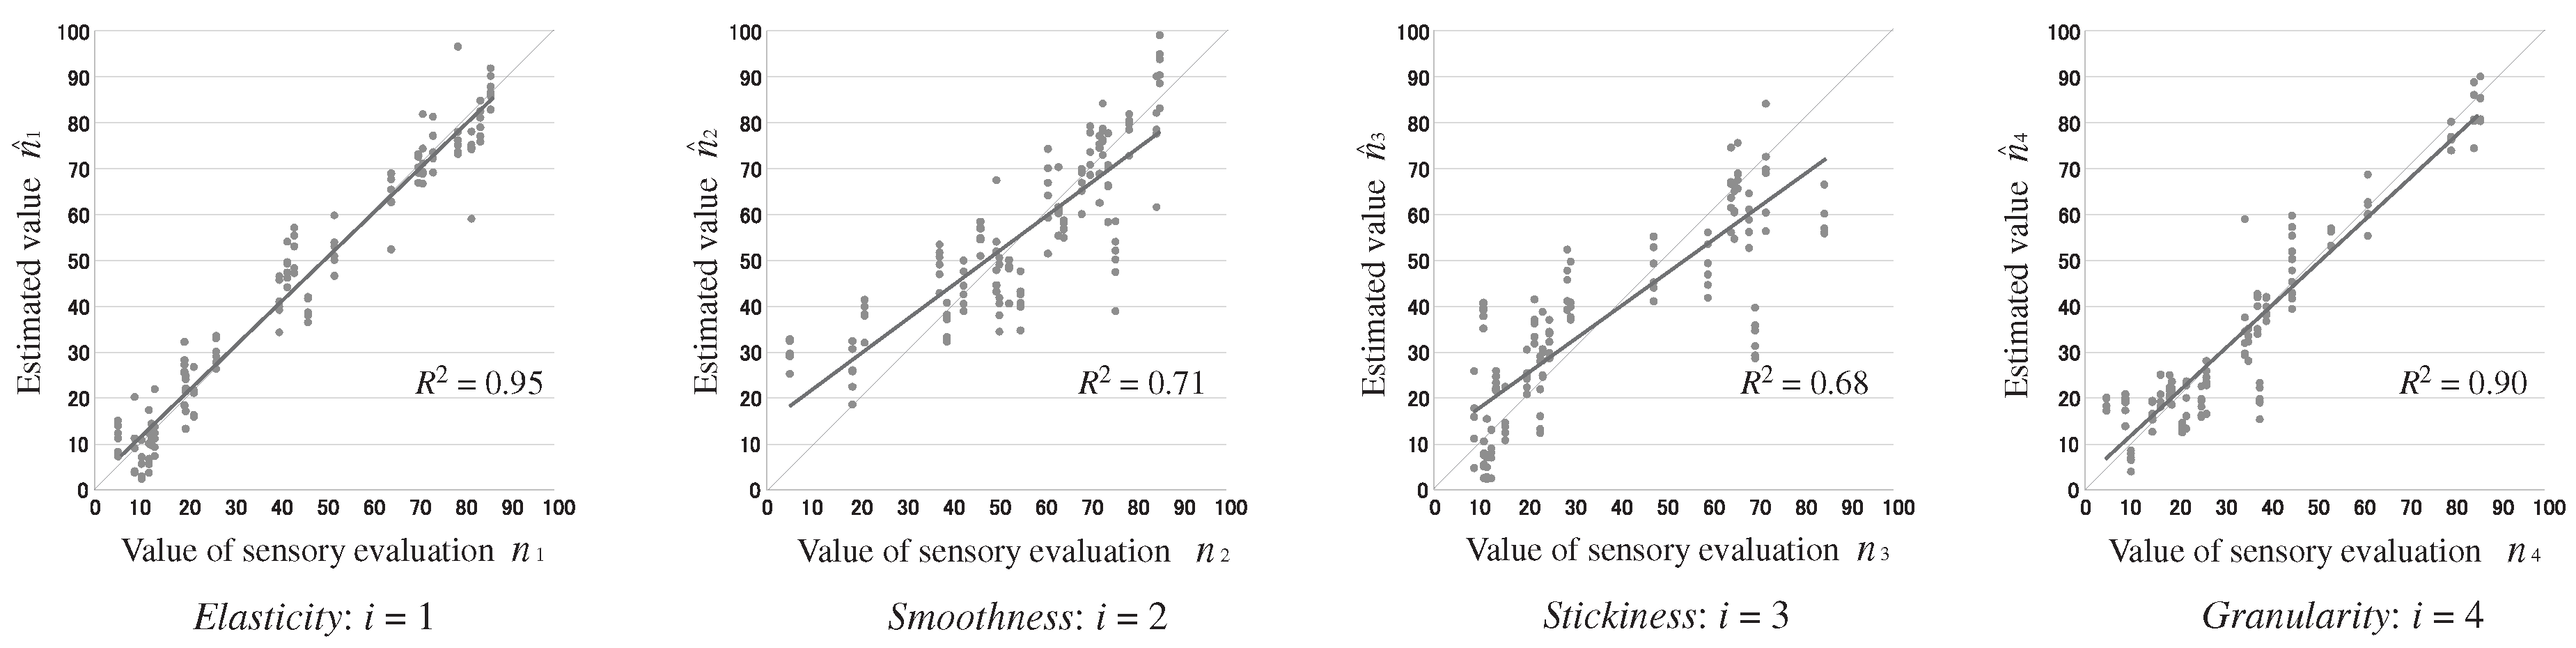
Figure 8a,b shows the estimation error when using the and input images, respectively, where the horizontal axis shows the epoch, and the vertical axis shows the absolute value of the mean error. The real and dashed lines show the errors in the test and training data, respectively. From these figures, it can be seen that the error decreases as the CNN becomes further trained. With the input image, the training advanced quickly. Because the training speed differs depending on the texture term, the termination condition should be defined based on the texture term. Figure 9, Figure 10 and Figure 11 show the estimation results using the and input images and the conventional methods based on SGLDM [21], respectively. These figures show the relationships between the value of the sensory evaluation and the estimated value after the training for the four texture terms. The accuracy of the texture estimation can be evaluated based on the coefficient of determination . From Figure 9 and Figure 10, we can confirm that the proposed method can accurately estimate both the geometrical and mechanical texture terms. Figure 12 summarizes the coefficient of determination for the four texture terms under the three conditions. In both input images, the average value of achieved by the proposed method was . Particularly for the texture terms, smoothness () and stickiness (), for the conventional method was extremely low. In contrast, was sufficiently high for the proposed method even with these two texture terms. This result strongly supports the advantage of the proposed method and indicates its potential to treat various texture terms adaptively.
In this experiment, the accuracy of the estimation using the image showed no significant difference from the accuracy when using the image. This result may imply that the pressure image frames at the moment of fracture and the final compression state of the food contain sufficient information to evaluate the various textures. If we use these frames, at most two pressure frames will be sufficient to accurately estimate the texture of gel-like food.
6. Conclusions
This paper presented a robotic sensing system that evaluates the texture of gel-like food. The proposed method applies a pressure distribution measurement during artificial mastication and texture estimation processing using a CNN. The relationship between the pressure distribution image of a gel-like food during mastication and the human sensory evaluation of the texture was modeled using the CNN. During the experiments, the values from the sensory evaluation for not only mechanical characteristics, but also geometrical characteristics were accurately estimated. In addition, the experimental results suggest that at most, two pressure image frames (the frame at the moment of fracture of the gel-like food and the frame at the final compression state) are sufficient to accurately estimate the texture.
Humans use various motions of the tongue in eating. For a given target texture term, humans may change the velocity and direction of the tongue’s motion. In the future, we should examine the various motions of the tongue. In addition, we would like to train the CNN model by augmenting the number of types of gel-like food and total data for estimating the texture of completely unknown gel-like foods not included in the applied model. Other CNN models [24,25,26,27,29] should be examined to investigate which architecture is appropriate for modeling the relationship between the various textures and the pressure distribution image. Furthermore, depending on the texture terms, a single pressure image () may be sufficient to estimate the value from a sensory evaluation. Determining such a single image based on an understanding of the human sensory evaluation mechanism is an area of future interest.
Author Contributions
A.S. and M.H.conceived of and designed the model. A.S., A.I., and M.N. developed the system performed the experiments. A.S., A.I., M.N. and M.H. analyzed the data and wrote the paper.
Conflicts of Interest
The authors declare no conflict of interest.
References
- Lederman, S.J.; Jones, L.A. Tactile and Haptic Illusions. IEEE Trans. Haptics 2011, 4, 273–294. [Google Scholar] [CrossRef] [PubMed]
- Jimenez, M.C.; Fishel, J.A. Evaluation of force, vibration and thermal tactile feedback in prosthetic limbs. In Proceedings of the IEEE Haptics Symposium, Houston, TX, USA, 23–26 February 2014; pp. 437–441. [Google Scholar]
- Hoshi, T.; Takahashi, M.; Iwamoto, T.; Shinoda, H. Noncontact Tactile Display Based on Radiation Pressure of Airborne Ultrasound. IEEE Trans. Haptics 2010, 3, 155–165. [Google Scholar] [CrossRef] [PubMed]
- Nishinari, K. Texture and Rheology in Food and Health. Food Sci. Technol. Res. 2009, 15, 99–106. [Google Scholar] [CrossRef]
- Funami, T. Next Target for Food Hydrocolloid Studies: Texture Design of Foods Using Hydrocolloid Technology. Food Hydrocoll. 2011, 25, 1904–1914. [Google Scholar] [CrossRef]
- Nishinari, K. Rheology, Food Texture and Mastication. J. Texture Stud. 2004, 35, 113–124. [Google Scholar] [CrossRef]
- Nishinari, K.; Hayakawa, F.; Xia, C.-F.; Huang, L.; Meullenet, J.-F.; Sieffermann, J.-M. Comparative Study of Texture Terms: English, French, Japanese and Chinese. J. Texture Stud. 2008, 39, 530–568. [Google Scholar] [CrossRef]
- Szczesniak, A.S. Texture is a Sensory Property. Food Qual. Preference 2002, 13, 215–225. [Google Scholar] [CrossRef]
- Bourne, M.C. Food Texture and Viscosity, Second Edition: Concept and Measurement; Academic Press: Cambridge, MA, USA, 2002; ISBN 978-0-12-119062-0. [Google Scholar]
- Stable Micro Systems Ltd. Available online: http://www.stablemicrosystems.com/ (accessed on 24 November 2017).
- Illinois Tool Works Inc. Available online: http://www.instron.com/ (accessed on 24 November 2017).
- Iwata, H.; Yano, H.; Uemura, T.; Moriya, T. Food Texture Display. In Proceedings of the 12th International Symposium on Haptic Interfaces for Virtual Environment and Teleoperator Systems, Chicago, IL, USA, 27–28 March 2004; pp. 310–315. [Google Scholar]
- Sun, C.; Bronlund, J.E.; Huang, L.; Morgenstern, M.P.; Xu, W.L. A Linkage Chewing Machine for Food Texture Analysis. In Proceedings of the 15th International Conference on Mechatronics and Machine Vision in Practice, Auckland, New Zealand, 2–4 December 2008; pp. 299–304. [Google Scholar]
- Xu, W.L.; Torrance, J.D.; Chen, B.Q.; Potgieter, J.; Bronlund, J.E.; Pap, J.S. Kinematics and Experiments of a Life-Sized Masticatory Robot for Characterizing Food Texture. IEEE Trans. Ind. Electron. 2008, 55, 2121–2132. [Google Scholar] [CrossRef]
- Hoebler, C.; Karinthi, A.; Devaux, M.F.; Guillon, F.; Gallant, D.J.; Bouchet, B.; Melegari, C.; Barry, J.L. Physical and Chemical Transformations of Cereal Food During Oral Digestion in Human Subjects. Br. J. Nutr. 1998, 80, 429–436. [Google Scholar] [CrossRef] [PubMed]
- Haralick, R.M.; Shanmugam, K.; Dinstein, I. Textural Features for Image Classification. IEEE Trans. Syst. Man Cybern. 1973, SMC-3, 610–621. [Google Scholar] [CrossRef]
- Arvisenet, G.; Billy, L.; Poinot, P.; Vigneau, E.; Bertrand, D.; Prost, C. Effect of Apple Particle State on the Release of Volatile Compounds in a New Artificial Mouth Device. J. Agric. Food Chem. 2008, 56, 3245–3253. [Google Scholar] [CrossRef] [PubMed]
- Tournier, C.; Grass, M.; Zope, D.; Salles, C.; Bertrand, D. Characterization of Bread Breakdown During Mastication by Image Texture Analysis. J. Food Eng. 2012, 113, 615–622. [Google Scholar] [CrossRef]
- Kohyama, K.; Nishi, M.; Suzuki, T. Measuring Texture of Crackers with a Multiple-Point Sheet Sensor. J. Food Sci. 1997, 62, 922–925. [Google Scholar] [CrossRef]
- Dan, H.; Azuma, T.; Kohyama, K. Characterization of Spatiotemporal Stress Distribution During Food Fracture by Image Texture Analysis Methods. J. Food Eng. 2007, 81, 429–436. [Google Scholar] [CrossRef]
- Yamamoto, T.; Higashimori, M.; Nakauma, M.; Nakao, S.; Ikegami, A.; Ishihara, S. Pressure Distribution-Based Texture Sensing by Using a Simple Artificial Mastication System. In Proceedings of the 36th Annual International Conference of the IEEE Engineering in Medicine and Biology Society, Chicago, IL, USA, 27–31 August 2014; pp. 864–869. [Google Scholar]
- Johnson, M.K.; Adelson, E.H. Retrographic sensing for the measurement of surface texture and shape. In Proceedings of the IEEE Conference on Computer Vision and Pattern Recognition, Miami, FL, USA, 20–25 June 2009; pp. 1070–1077. [Google Scholar]
- Krizhevsky, A.; Sutskever, I.; Hinton, G.E. ImageNet Classification with Deep Convolutional Neural Networks. In Proceedings of the Advances in Neural Information Processing Systems 25 (NIPS 2012), Lake Tahoe, NV, USA, 3–6 December 2012; pp. 1097–1105. [Google Scholar]
- LeCun, Y.; Bottou, L.; Bengio, Y.; Haffner, P. Gradient-based learning applied to document recognition. Proc. IEEE 1998, 86, 2278–2324. [Google Scholar] [CrossRef]
- Simonyan, K.; Zisserman, A. Very Deep Convolutional Networks for Large-Scale Image Recognition. arXiv 2015, arXiv:1409.1556. [Google Scholar]
- Szegedy, C.; Liu, W.; Jia, Y.; Sermanet, P.; Reed, S.; Anguelov, D.; Erhan, D.; Vanhoucke, V.; Rabinovich, A. Going Deeper with Convolutions. In Proceedings of the CVPR2015, Boston, MA, USA, 7–12 June 2015. [Google Scholar]
- He, K.; Zhang, X.; Ren, S.; Sun, J. Deep Residual Learning for Image Recognition. In Proceedings of the CVPR2016, Las Vegas, NV, USA, 27–30 June 2016. [Google Scholar]
- I-Scan System. Available online: http://www.tekscan.com/products-solutions/systems/i-scan-system (accessed on 24 November 2017).
- Tran, D.; Bourdev, L.; Fergus, R.; Torresani, L.; Paluri, M. Learning Spatiotemporal Features With 3D Convolutional Networks. In Proceedings of the IEEE International Conference on Computer Vision (ICCV), Washington, DC, USA, 7–13 December 2015; pp. 4489–4497. [Google Scholar]
- Saitoh, T.; Zhou, Z.; Zhao, G.; Pietikainen, M. Concatenated Frame Image Based CNN for Visual Speech Recognition. In Proceedings of the Computer Vision – ACCV 2016 Workshops Part II, Taipei, Taiwan, 20–24 November 2016; pp. 277–289. [Google Scholar]
- Wewers, M.E.; Lowe, N.K. A Critical Review of Visual Analogue Scales in the Measurement of Clinical Phenomena. Res. Nurs. Health 1990, 13, 227–236. [Google Scholar] [CrossRef] [PubMed]
- Arlot, S. A Survey of Cross-Validation Procedures for Model Selection. Stat. Surv. 2010, 4, 40–79. [Google Scholar] [CrossRef]
- Kingma, D.P.; Ba, J. Adam: A Method for Stochastic Optimization. In Proceedings of the 3rd International Conference on Learning Representations, San Diego, CA, USA, 7–9 May 2015. [Google Scholar]
Figure 1.
Outline of the proposed system for estimating the food texture. (a) Texture values of various gel-like foods are obtained by expert panelists through a sensory evaluation; (b) the pressure distributions of the gel-like foods are measured using artificial mastication; (c) an input image of the CNN is preprocessed. The CNN outputs an estimation of the texture through a sensory evaluation.
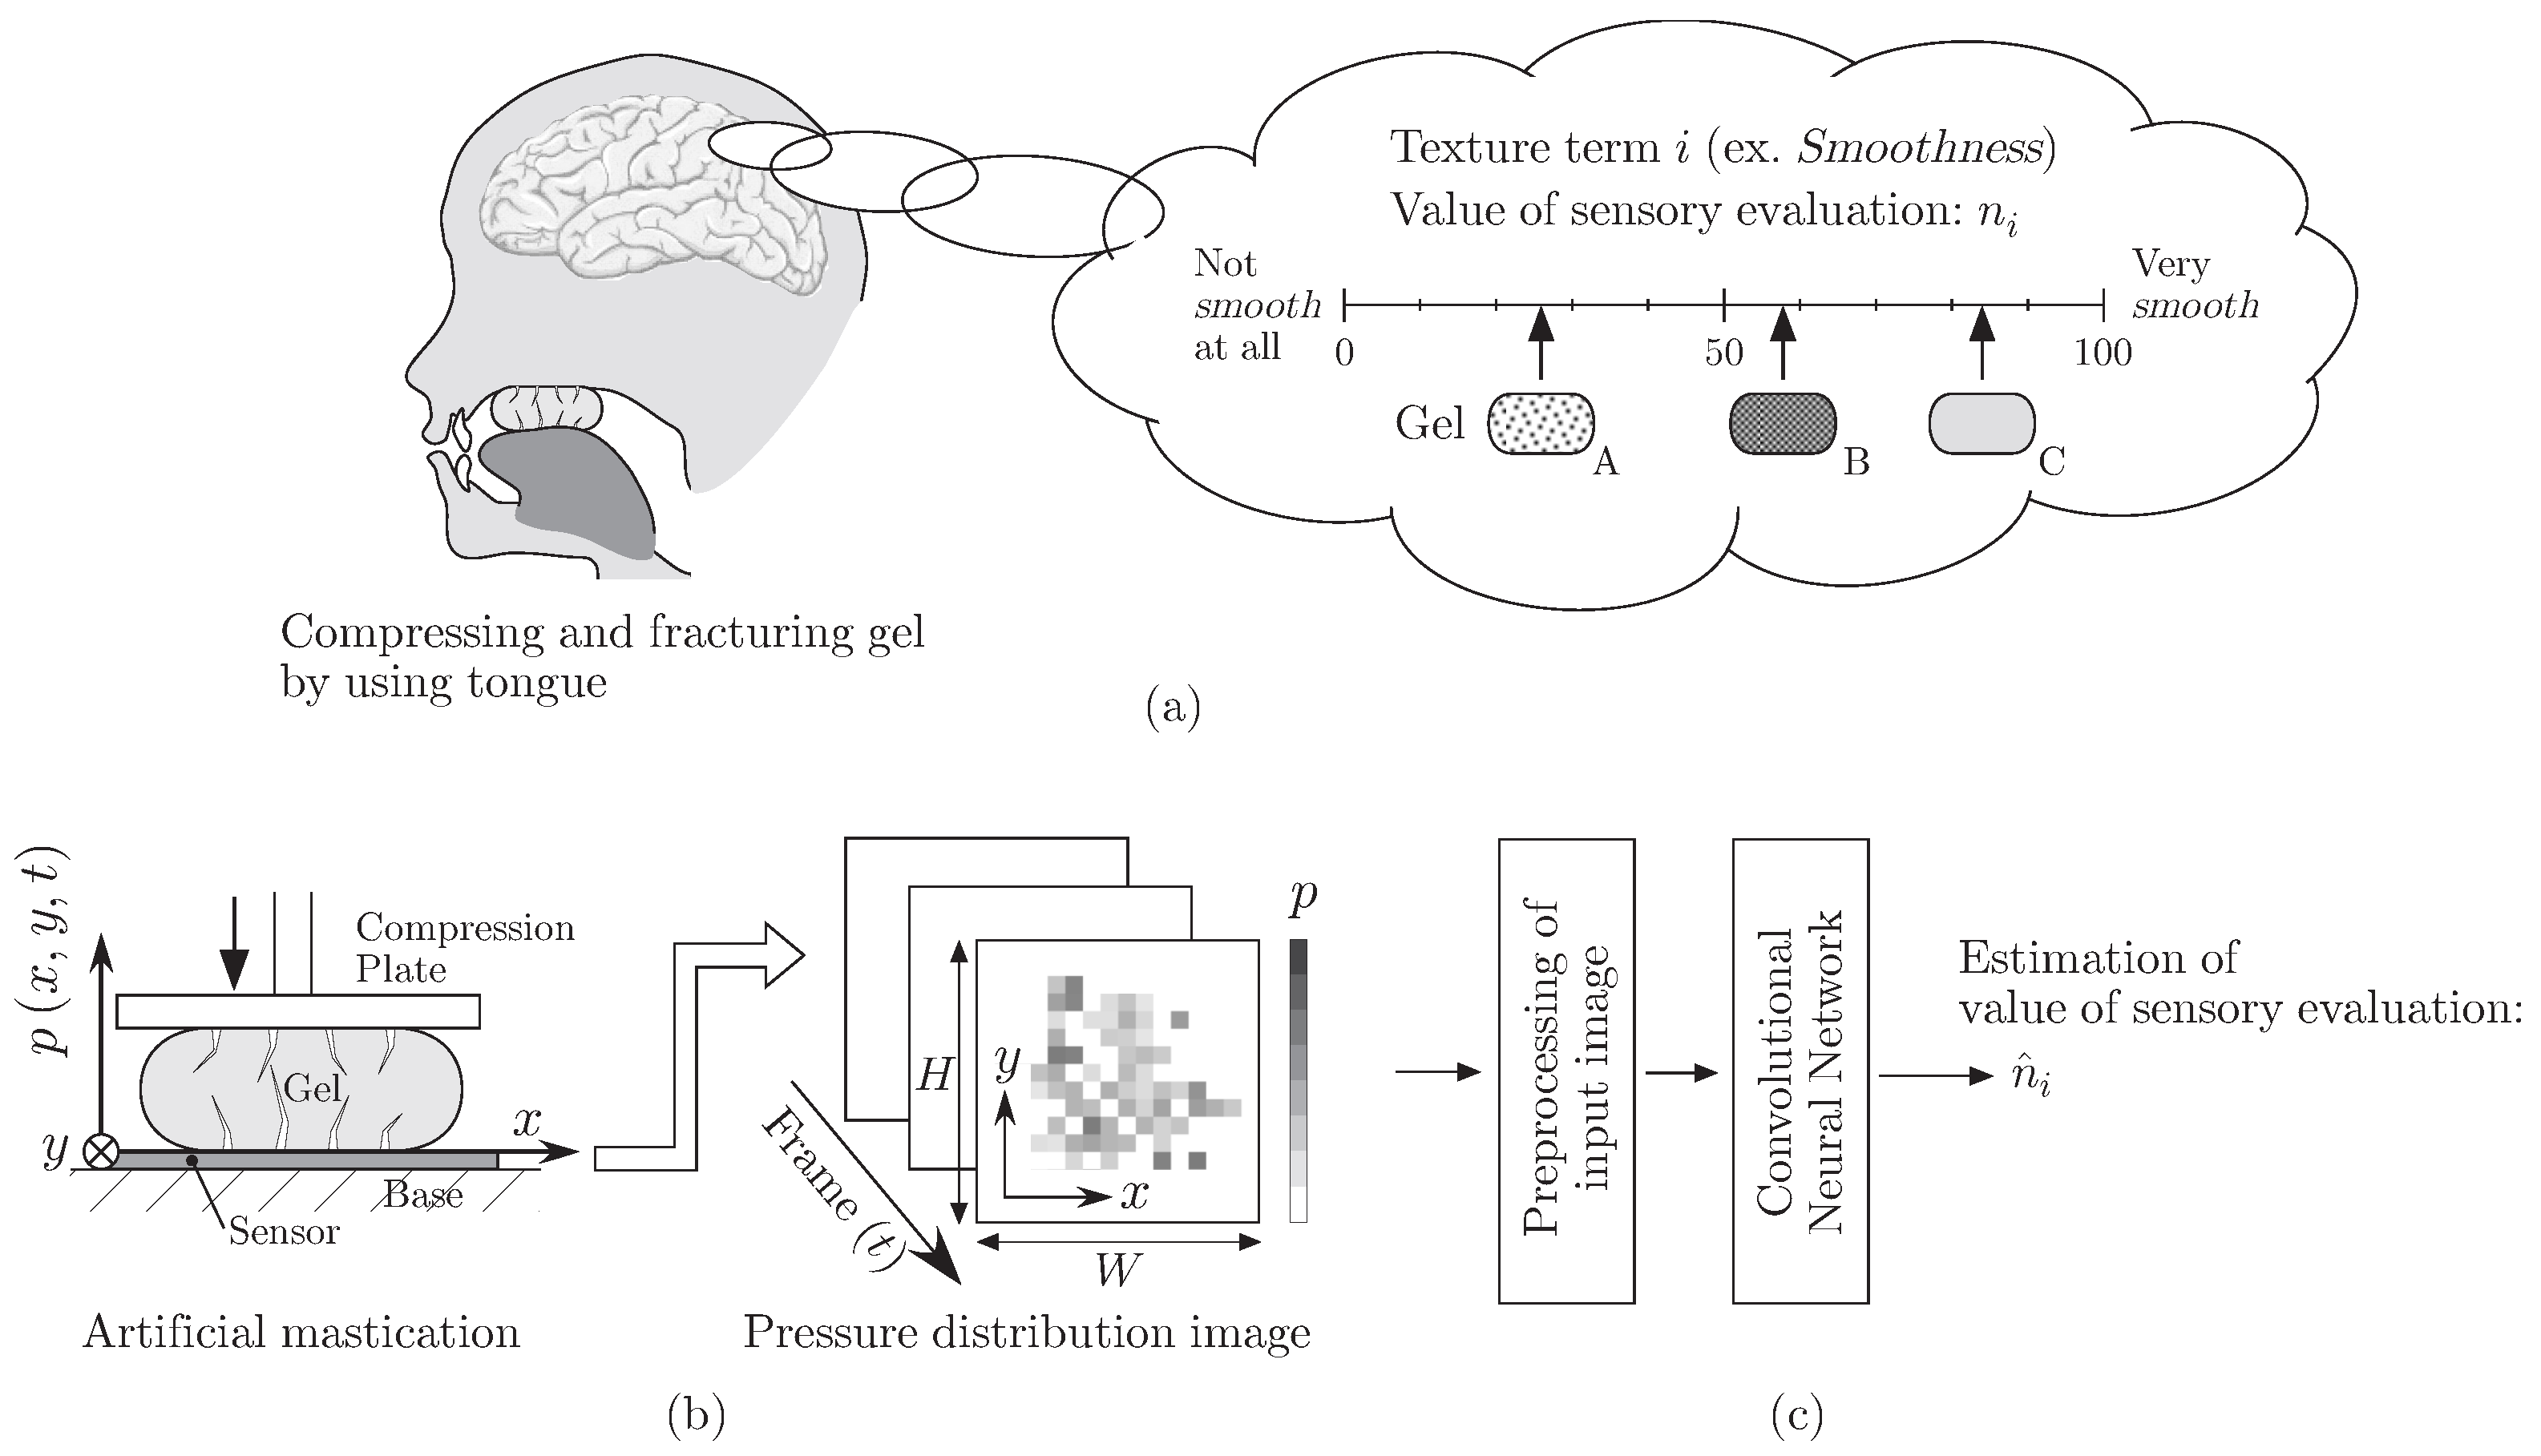
Figure 2.
(a) Experimental setup; (b) representative gel-like food.

Figure 3.
Compression and fracturing of a representative gel-like food.

Figure 4.
Selection of frames of the pressure distribution image.
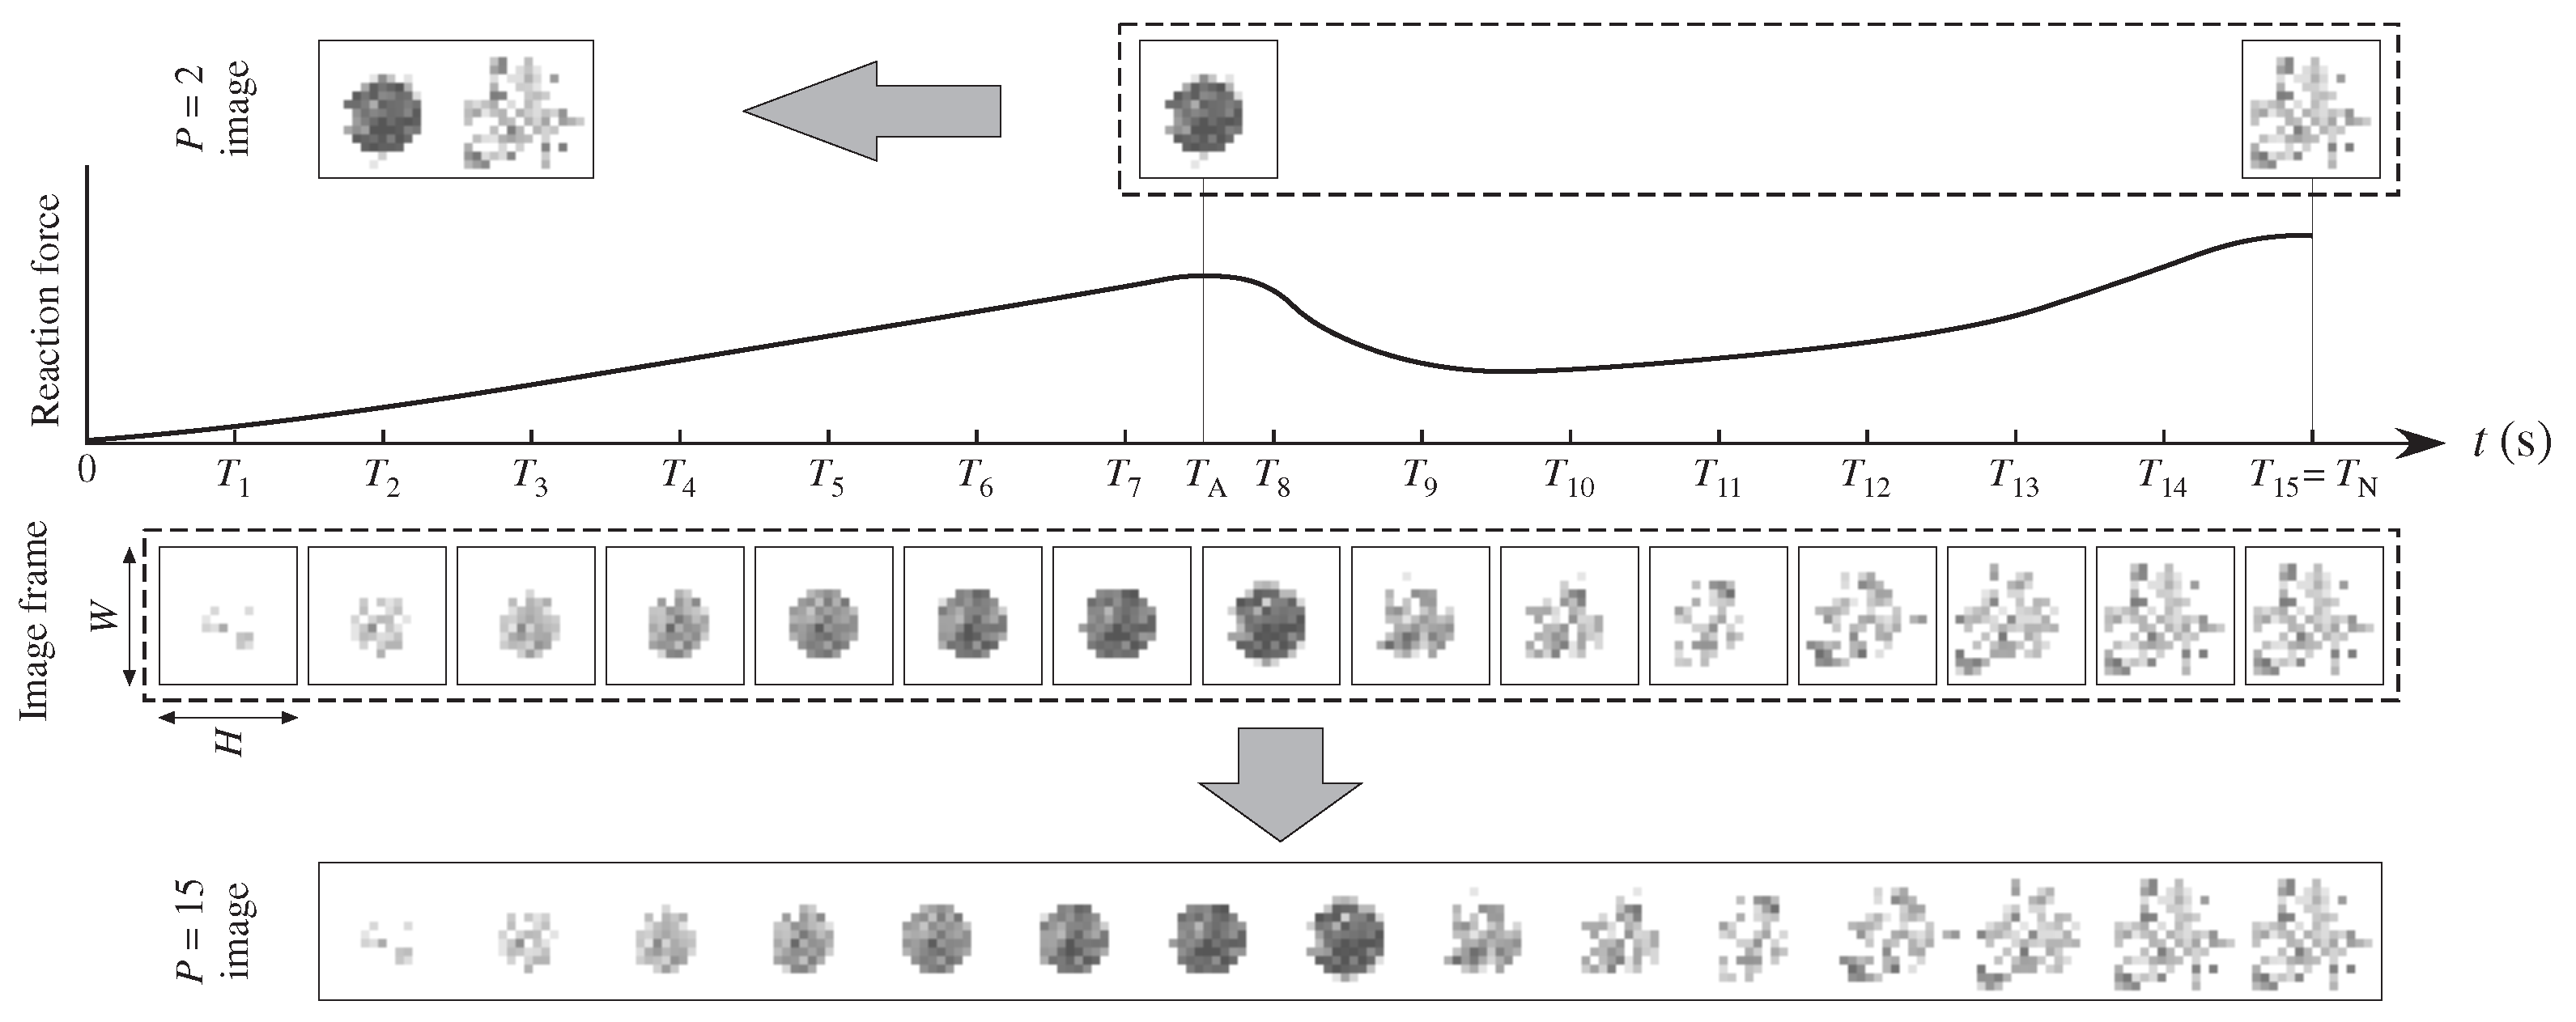
Figure 5.
CNN architecture.
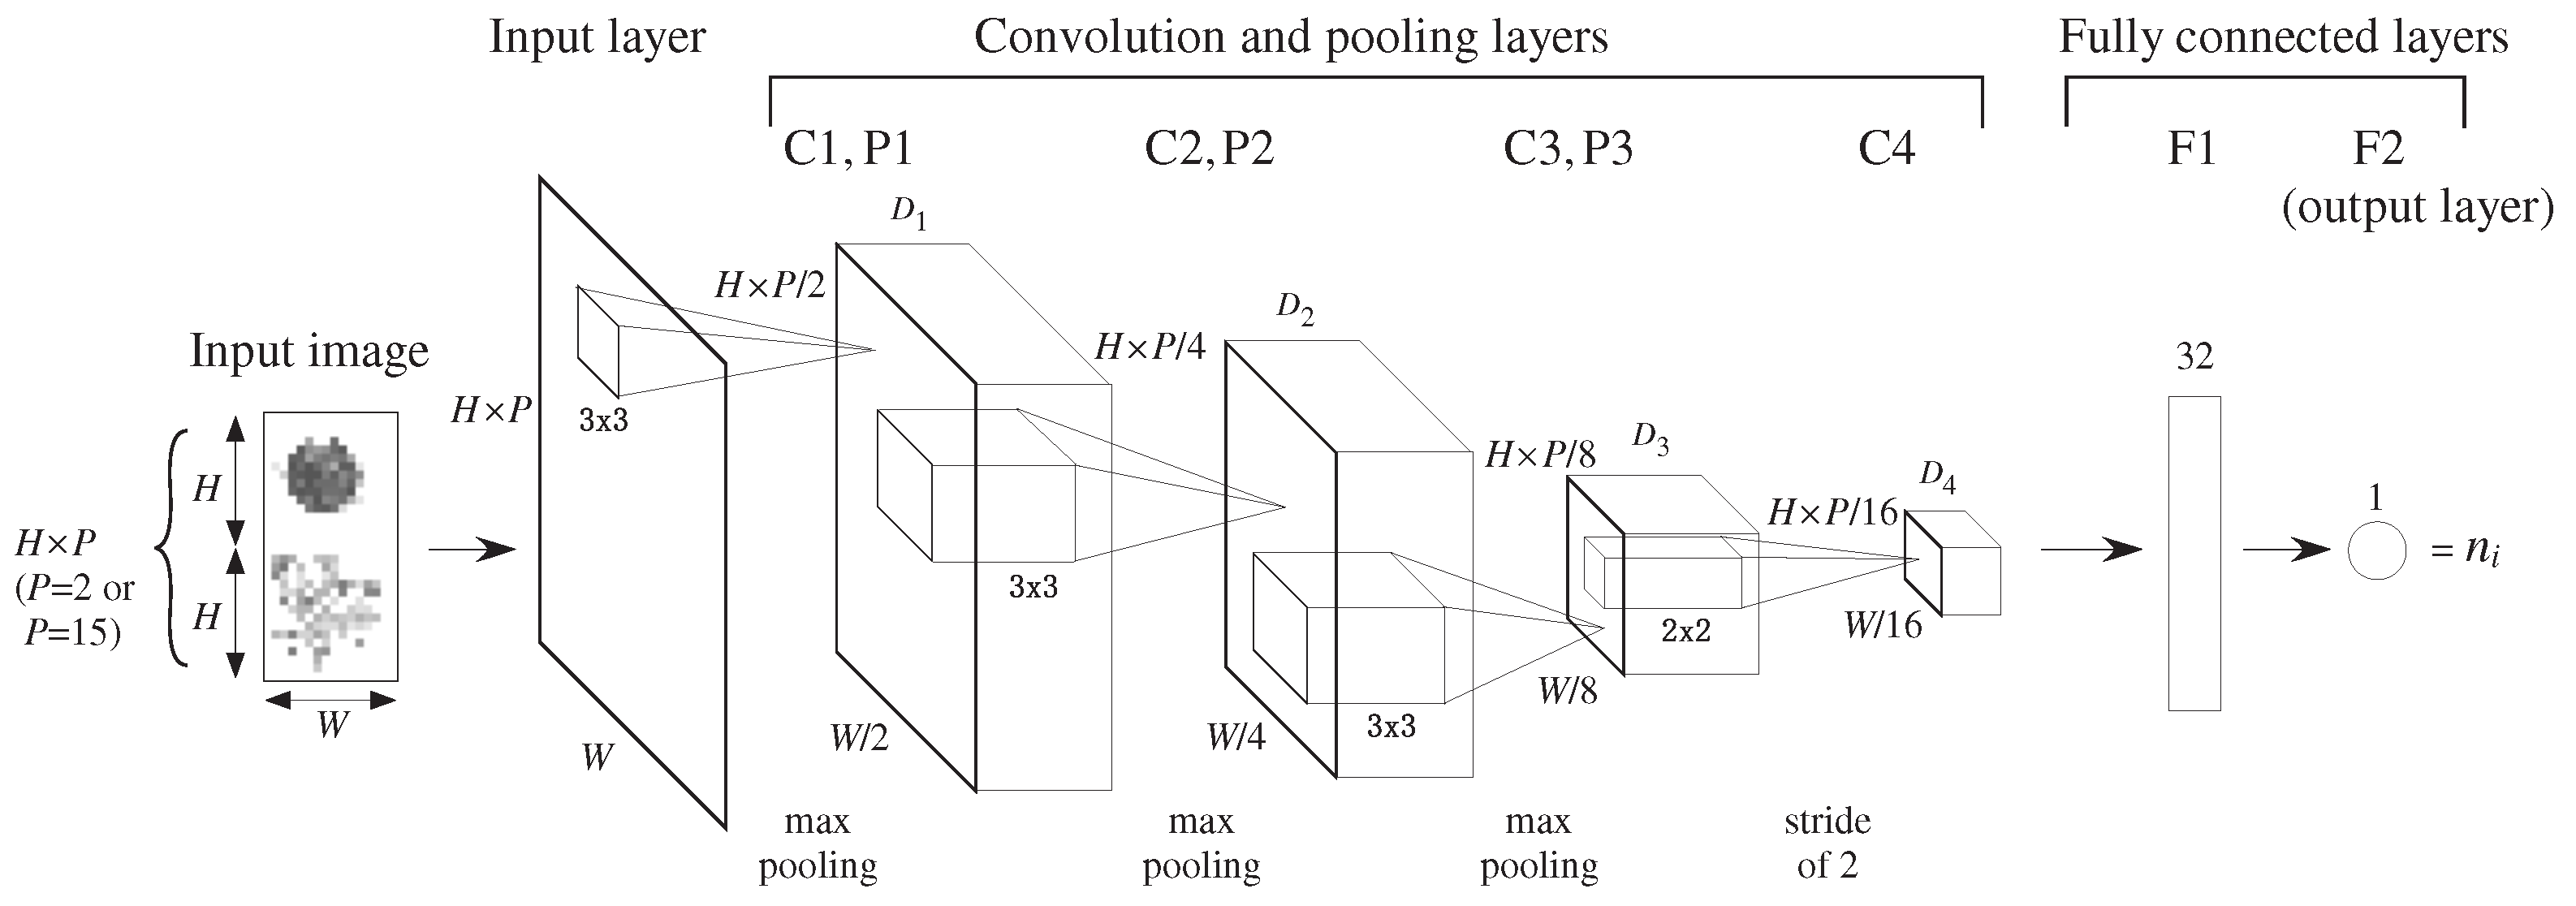
Figure 6.
Fracture characteristics of the tested gel-like foods.

Figure 7.
Example input image.

Figure 8.
Estimation error with respect to the epoch.
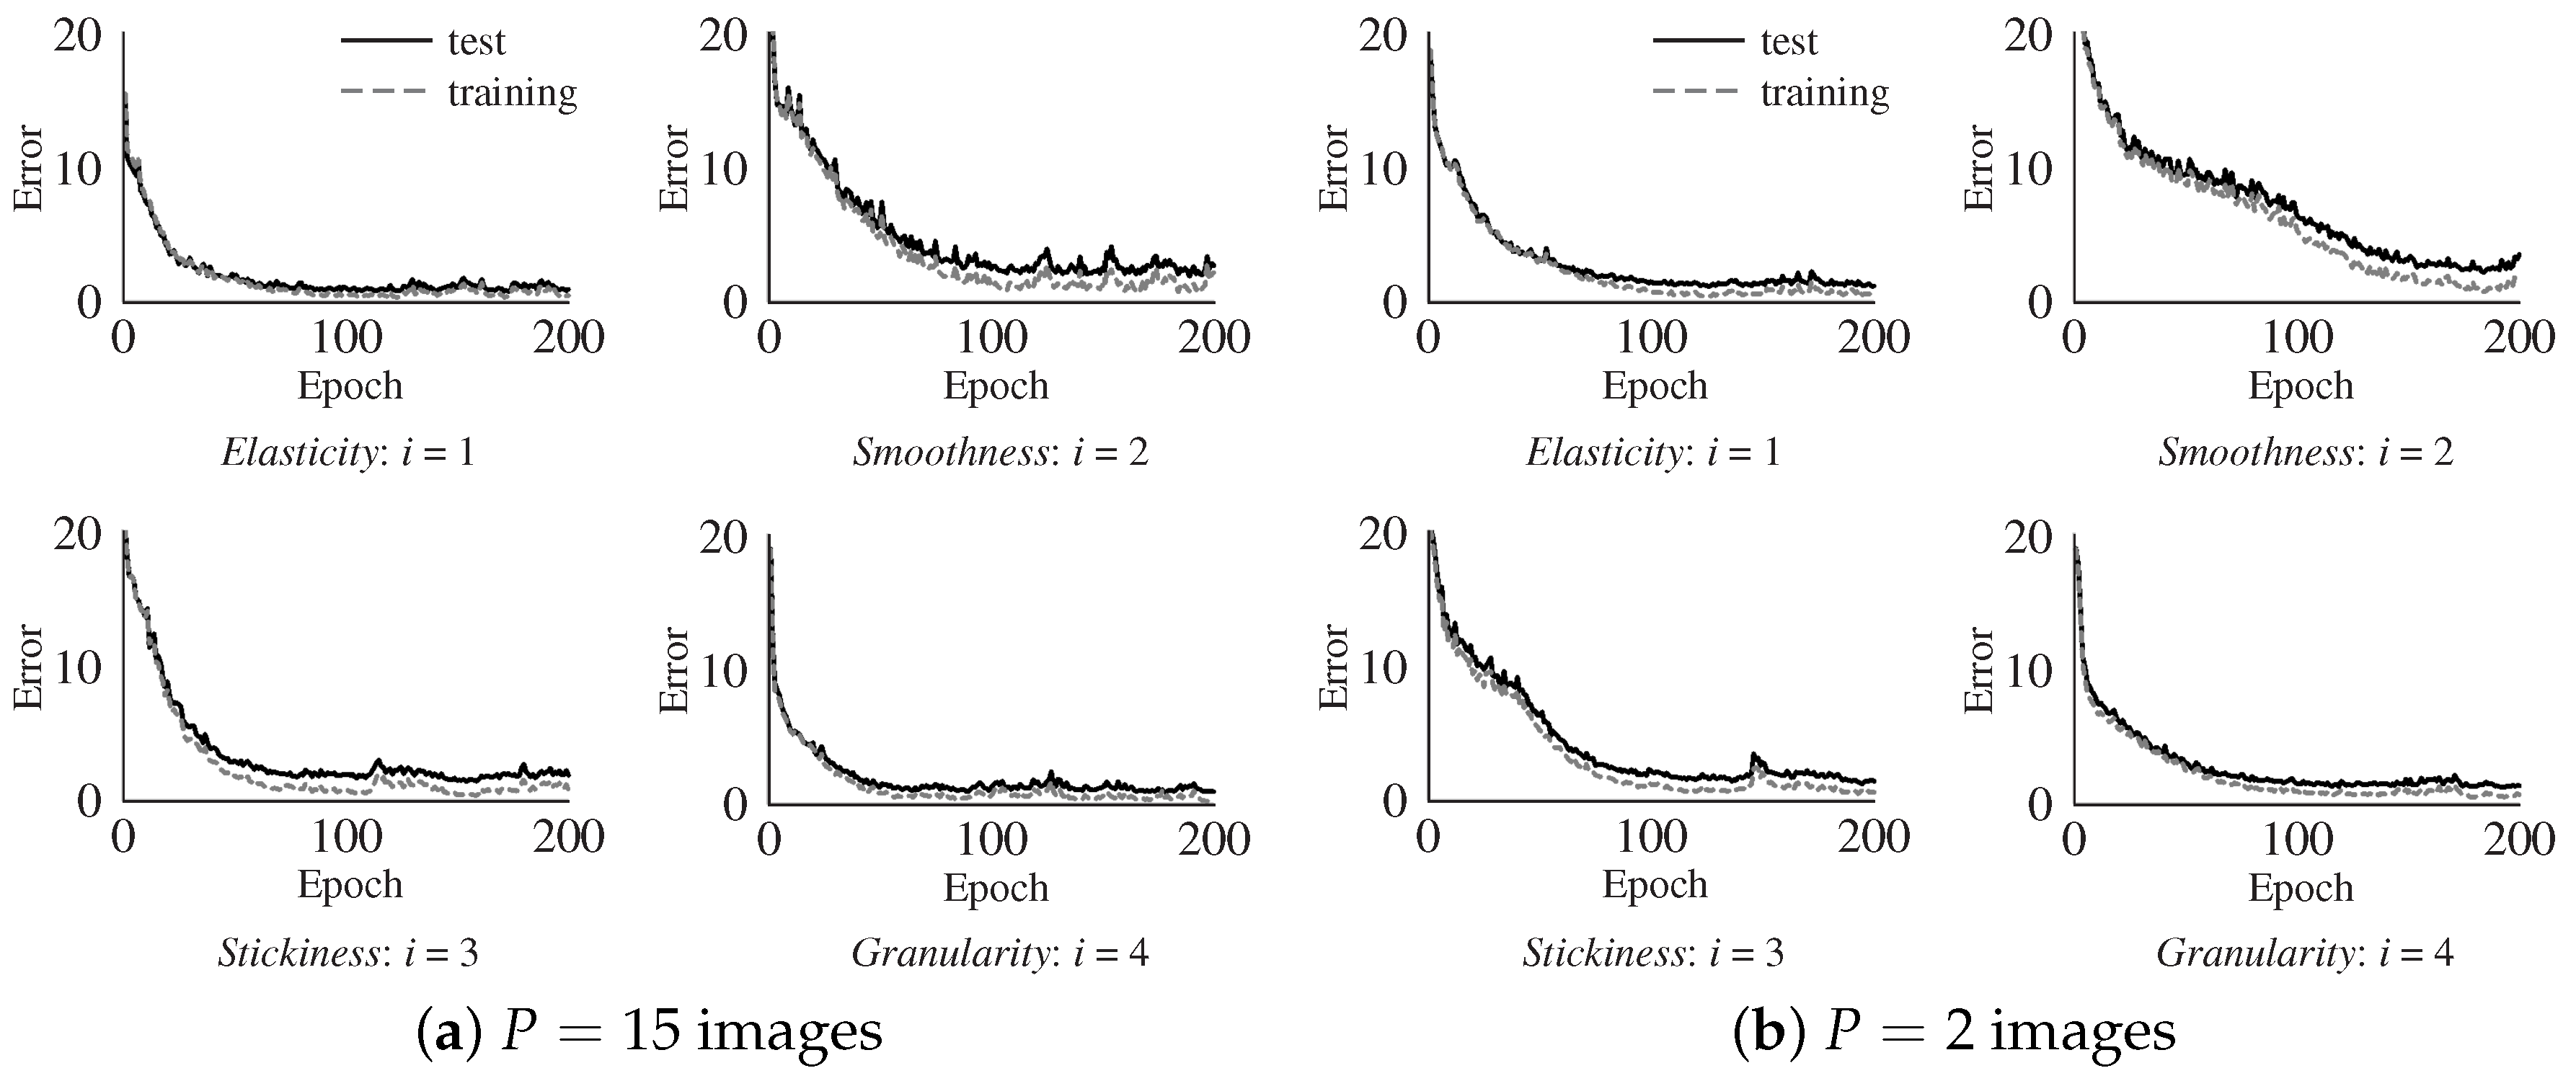
Figure 9.
Estimation result with images.
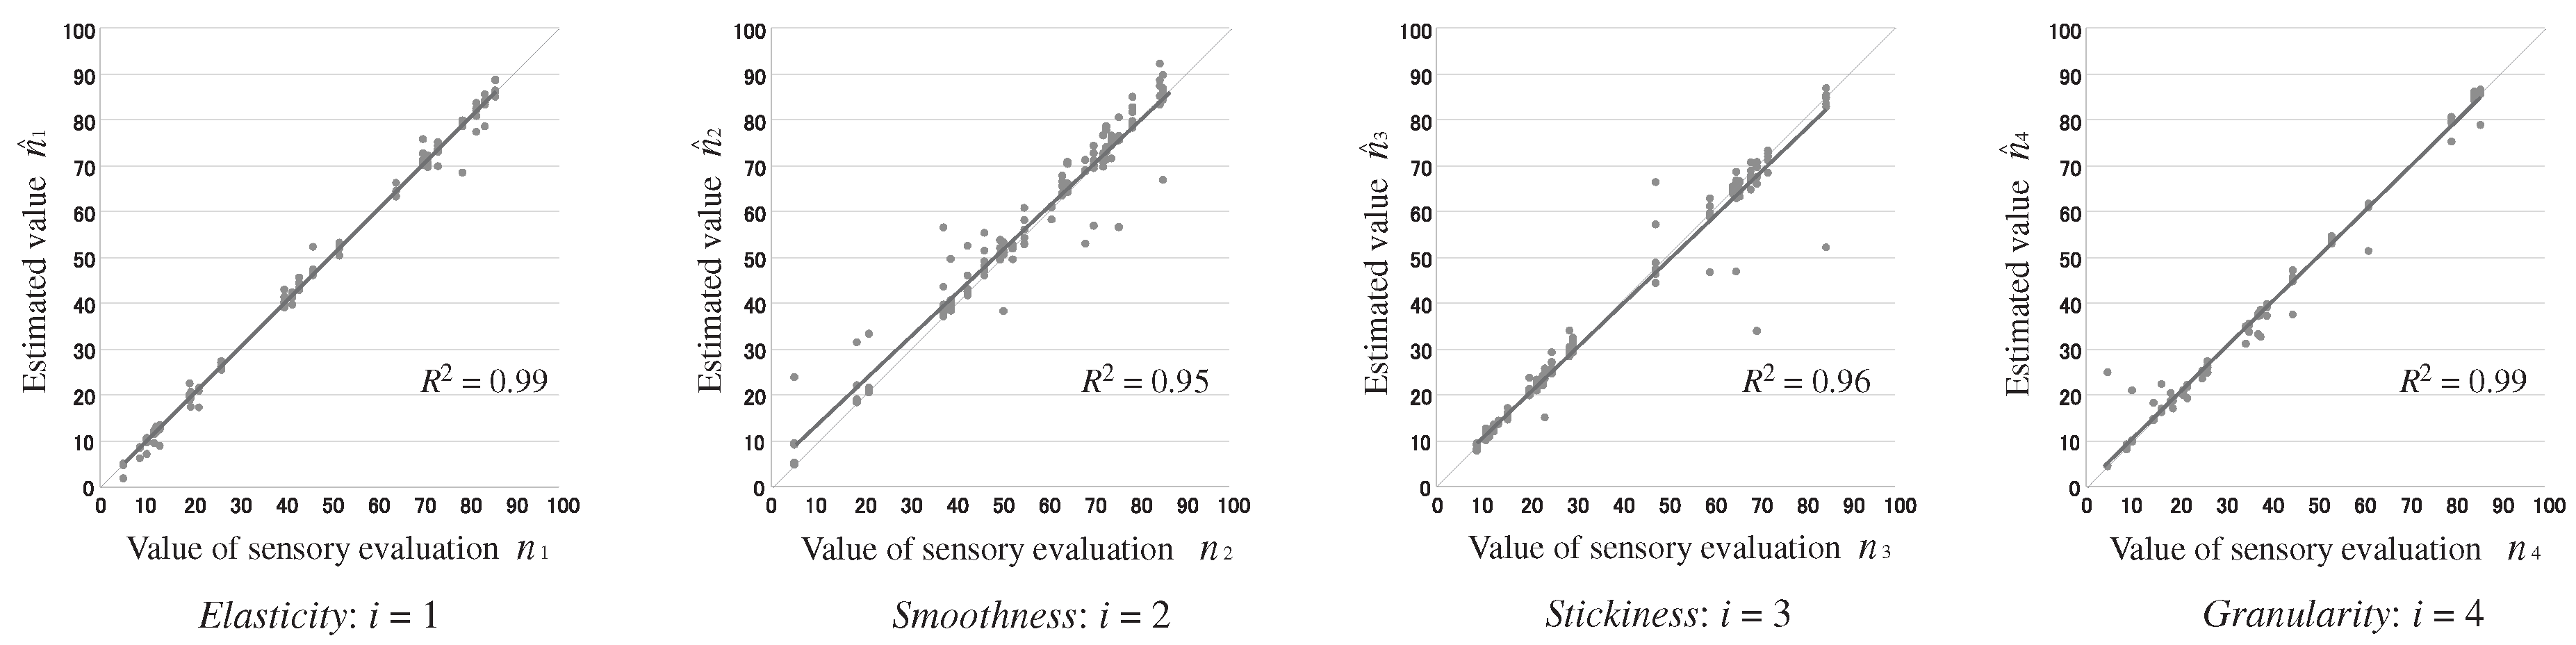
Figure 10.
Estimation result with images.

Figure 11.
Estimation result with the conventional method [21].
Figure 11.
Estimation result with the conventional method [21].

Figure 12.
Coefficients of determination.

Table 1.
Values of sensory evaluation.
| Gel-Like Food | Elasticity | Smoothness | Stickiness | Granularity |
|---|---|---|---|---|
| A | 11.8 | 70.3 | 11.5 | 61.5 |
| B | 82.0 | 61.2 | 21.9 | 45.0 |
| C | 19.5 | 84.8 | 12.5 | 86.0 |
| D | 13.0 | 73.1 | 10.9 | 53.5 |
| E | 83.9 | 21.2 | 85.0 | 34.8 |
| F | 19.8 | 78.9 | 13.5 | 45.0 |
| G | 26.4 | 85.5 | 15.5 | 79.6 |
| H | 10.1 | 74.3 | 8.8 | 84.6 |
| I | 73.6 | 52.7 | 64.6 | 25.3 |
| J | 52.1 | 75.9 | 29.0 | 22.0 |
| K | 70.4 | 42.8 | 72.3 | 16.4 |
| L | 79.0 | 49.9 | 66.1 | 18.4 |
| M | 5.0 | 4.9 | 10.8 | 38.0 |
| N | 43.4 | 39.1 | 65.4 | 14.6 |
| O | 86.1 | 72.4 | 23.1 | 26.4 |
| P | 46.4 | 37.5 | 29.8 | 21.1 |
| Q | 41.9 | 63.5 | 20.3 | 39.4 |
| R | 40.1 | 64.6 | 25.1 | 18.9 |
| S | 12.3 | 55.2 | 69.9 | 4.6 |
| T | 8.6 | 50.6 | 23.6 | 8.8 |
| U | 71.4 | 68.5 | 47.8 | 37.5 |
| V | 21.5 | 18.5 | 59.6 | 9.9 |
| W | 64.5 | 46.4 | 68.6 | 35.5 |
© 2017 by the authors. Licensee MDPI, Basel, Switzerland. This article is an open access article distributed under the terms and conditions of the Creative Commons Attribution (CC BY) license (http://creativecommons.org/licenses/by/4.0/).
Share and Cite
MDPI and ACS Style
Shibata, A.; Ikegami, A.; Nakauma, M.; Higashimori, M. Convolutional Neural Network based Estimation of Gel-like Food Texture by a Robotic Sensing System. Robotics 2017, 6, 37. https://doi.org/10.3390/robotics6040037
AMA Style
Shibata A, Ikegami A, Nakauma M, Higashimori M. Convolutional Neural Network based Estimation of Gel-like Food Texture by a Robotic Sensing System. Robotics. 2017; 6(4):37. https://doi.org/10.3390/robotics6040037
Chicago/Turabian StyleShibata, Akihide, Akira Ikegami, Makoto Nakauma, and Mitsuru Higashimori. 2017. "Convolutional Neural Network based Estimation of Gel-like Food Texture by a Robotic Sensing System" Robotics 6, no. 4: 37. https://doi.org/10.3390/robotics6040037
Note that from the first issue of 2016, this journal uses article numbers instead of page numbers. See further details here.