1. Introduction
Throughout the last 150 years, the American West has experienced dramatic hydrologic change from environmental factors and anthropogenic activities. Fluctuating rainfall patterns, unpredictable climate, high levels of evaporation, declining snow melt runoff and current water use patterns are factors that put a strain on water management resources [
1,
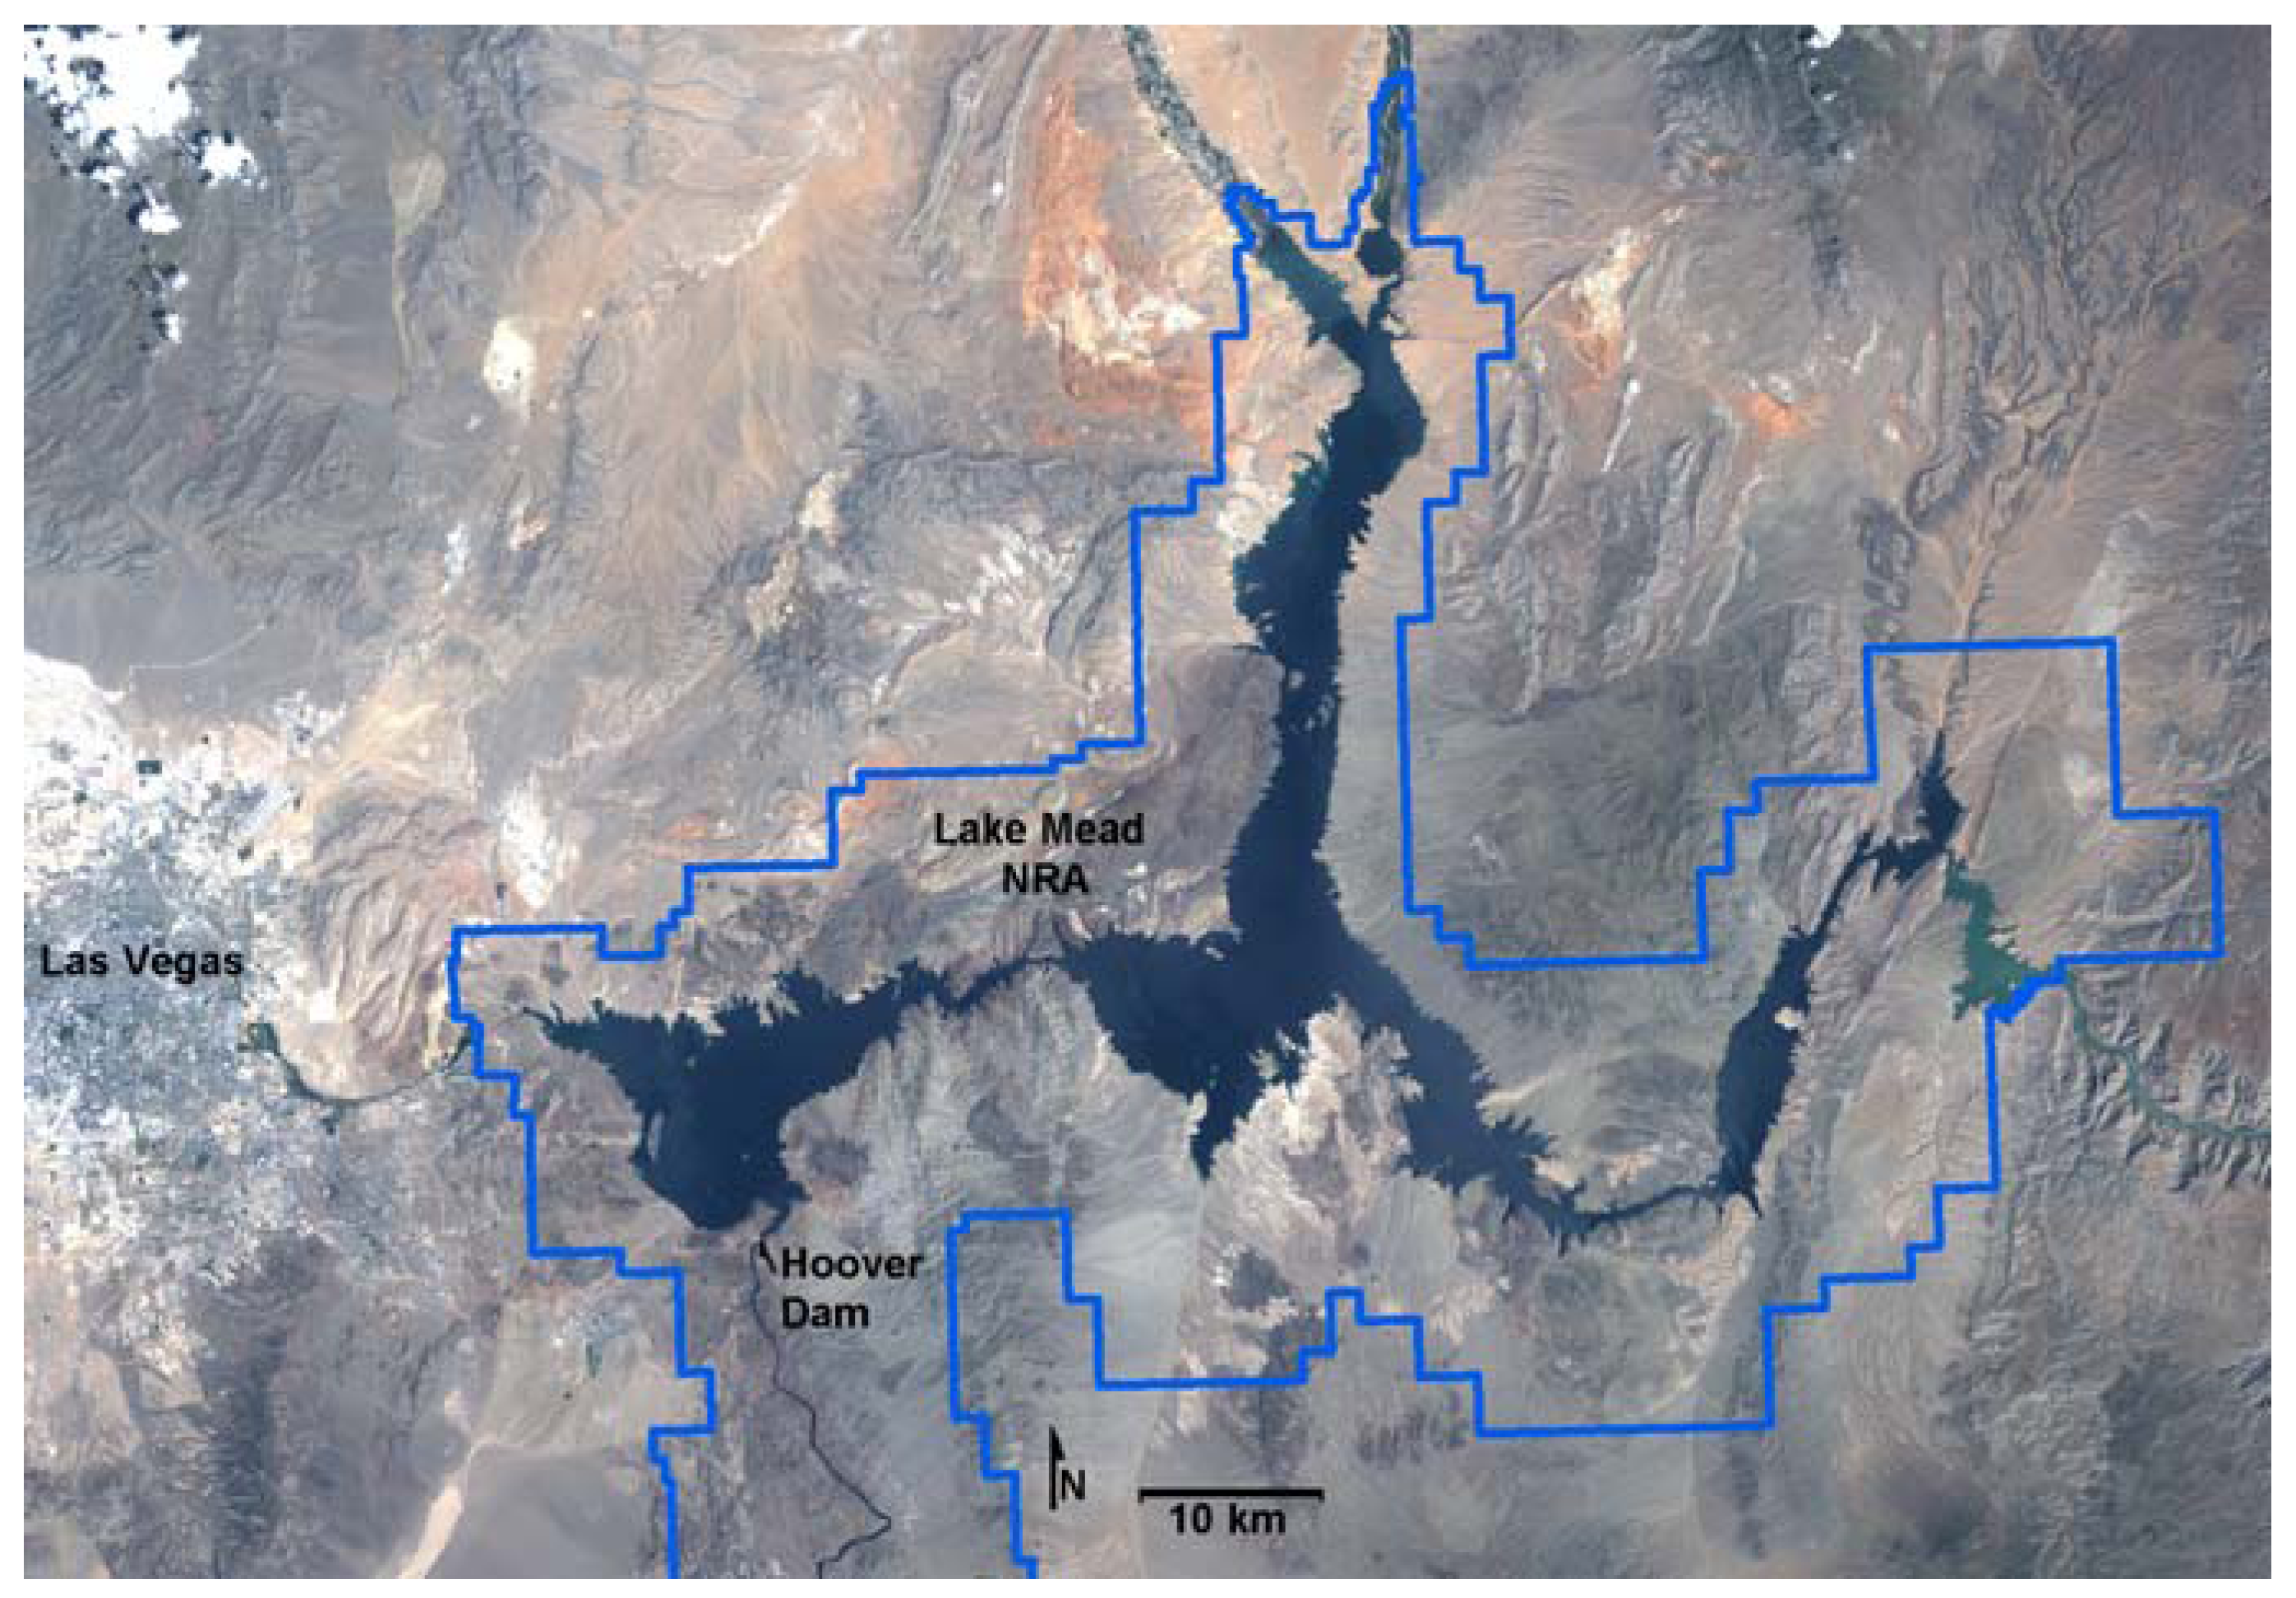
2]. At the same time, the dependence on Lake Mead for water and the production of electricity from the Hoover Dam by the surrounding population continues to increase. The dam functions to control floods and generate power, however most essentially, its capacity in a reservoir system prevents drought from negatively effecting agriculture in the southwest [
3]. Cities such as Las Vegas, Nevada located approximately 50 km west of Lake Mead are now under some restrictions pertaining to water limitations and modifying municipal park water use. These changes and hydrological trends in the American West are due to an extensive drought in this desert environment.
The drought is a result of many years of low precipitation and may have serious consequences for the region. This period of dry weather is important to consider because the western United States consists of large irrigation districts that may be threatened by an extended shortage of water [
4]. Moreover, factors of low water levels are coincident with rapid population growth in Las Vegas which puts pressure on water quantity. As a result of urban growth, water demands have risen greatly from states where Lake Mead water is utilized, including California, Nevada and Arizona [
1,
5]. Ironically, the Hoover Dam and its abundance of water and electrical power encouraged population growth and stimulated irrigation and water use for agriculture in the western states [
4].
The Hoover Dam was constructed in the early 1930s and over time confined water from the Upper Colorado River to form Lake Mead [
2,
5,
6]. The dam was built by the United States Federal Bureau of Reclamation to support (in part) California’s Imperial Valley vegetable farms [
7]. After the dam was built, a greater number of people started moving to the surrounding area because of the region’s growing water supply. In the 1920s, prior to the dam’s construction, there was a surplus of water, and the right to 18.5 billion m
3 (15 million acre-feet) of water was divided by two groups of states including the upper basin states of Wyoming, Colorado, New Mexico and Utah, and the lower basin states of California, Nevada and Arizona [
7]. This is important as it relates to water shortages in Lake Mead and Lake Powell (another reservoir further up-river) in the past five years. With these shortages new policies must be developed as reservoir holdings can no longer supply water according to previous entitlements [
7,
8]. The population of Nevada in 2008 was approximately two million and twenty-five percent of urban growth occurred during the recent drought years [
7]. Due to this growing population, a plan to build a third pipeline from Lake Mead is underway which will pump approximately 246.7 million m
3 (200,000 acre-feet) of water to the City of Las Vegas [
7]. Future water availability only seems to be declining which will cause additional problems for society and the environment of the region.
Regional water supply issues have come to the forefront. Since the completion of the Hoover Dam, declines in reservoir storage have encouraged water management models during extended droughts. Garrick
et al. [
9] state that when using modeling tools to manage water shortages, challenges arise due to the type of hydroclimatology, changing land patterns and policy making. In addition, to develop stronger management operations, the analysis of runoff, water use practices and early reservoir conditions are important factors to be analyzed. Further policy debates over effective water management are affected by the issue of climate change; therefore safe water systems and long-term planning are essential to water resources. Similarly, in examining water consumption in Las Vegas, Joyce’s [
8] study focused on civil and policy driven actions for the city to reduce its water usage. Thus, considering circumstances and patterns of the American West that affect water availability, regional management of water resources is essential for sustainable future predictions and prevention of greater declines in reservoirs [
1,
5,
6,
8].
Remotely sensed imagery, spatial technologies and computer processing are increasingly useful in the monitoring of environmental change and trends [
10]. The utilization of satellite-based technologies allows for the measurement of change over wide areas and the detection of patterns. Remote sensing is useful in lake studies due to the measurement of radiation wavelengths in the visible and infrared parts of the electromagnetic spectrum [
10]. Spatial variability in water reflectance is limited by water quality and climate [
11]. As these wavelengths are reflected, absorbed and transmitted, their characteristics are dependent on the environmental conditions in which the lake exists. The proportion of the reflected, absorbed and transmitted energy will vary in different wavelengths and can have an effect on the visual properties of the water within a lake [
10].
Shah [
12] examined lake extent on the Arctic coastal plain of Alaska using high-resolution Quickbird imagery. A combined approach using Landsat, Advanced Land Observing Satellite (ALOS) and Quickbird data was recommended for large and small lake monitoring in New Zealand [
13]. Crosman and Horel [
14] used Moderate Resolution Imaging Spectroradiometer (MODIS) data to examine the surface temperature of Great Salt Lake for the 2000–2007 period. Birkett and Mason [
15] describe research aimed at studying climatically sensitive large lakes using European Remote Sensing-1 (ERS-1) radar satellite data. Other analyses have used medium-resolution Landsat imagery for lake evaporation estimation [
16]. Time-series analysis is becoming more common in hydroclimatology studies [
17]. Clustering in time of certain events such as drought and predicting future water resources under climate change is crucial in time series methodology. Troch
et al. [
11] undertook a study in the Colorado River Basin during a 28-year period from 1979 to 2006 where a hydrological modeling method was used. In their study, the variable infiltration capacity model was used where a spatial resolution is specified for the water and energy balance equation. This is important because water capacity change was at its greatest after snowmelt and contributed to overall storage changes in Lake Mead.
The objective of this research is to use satellite imagery and Geographic Information Systems (GIS) to visualize changing water levels in Lake Mead. This will provide additional information that may be useful for reservoir management and drought analysis. It will also lead to a better understanding of where water level changes have the greatest impact on the landscape.
3. Data and Methodology
In this study, orthorectified Landsat satellite images available from the United States Geological Service (USGS) Earth Explorer archive were obtained for the 1972 to 2009 period. Images covering nearly 40 years were analyzed for water surface area in a time-series. A total of 30 images were examined consisting of: 8 Multispectral Scanner (MSS), 19 Thematic Mapper (TM), and 3 Enhanced Thematic Mapper Plus (ETM+) images (
Table 1). The majority of the images were acquired during the month of May (17 out of 30). If it was not possible to obtain an image from May (due to cloud cover conditions and availability from the archive), other images were substituted where necessary. The MSS images from Landsat 1 and 2 were the most challenging to acquire and process as the southeastern portion of the lake was just slightly outside of Path 41 Row 35 World Reference System-1 (WRS-1) which included most of the lake. This required the acquisition of the adjacent path image (where available). In addition, some of the MSS images were not orthorectified using the common projection (UTM Zone 11, WGS84) which resulted in reprojection being necessary to obtain the same degree of accuracy. The TM and ETM+ images were all acquired from Path 39 Row 35 (WRS-2).
Table 1.
Landsat image characteristics.
Table 1.
Landsat image characteristics.
| Acquisition Date | Satellite and Sensor | Cloud Cover | Scene Identifier |
|---|
| 13/09/1972 | Landsat 1 MSS | less than 10% | LM10420351972257AAA05 |
| 30/09/1972 | Landsat 1 MSS | less than 10% | LM10410351972274AAA04 |
| 22/05/1973 | Landsat 1 MSS | less than 10% | LM10410351973142AAA05 |
| 04/08/1976 | Landsat 1 MSS | less than 20% | LM10410351976217AAA04 |
| 03/06/1977 | Landsat 1 MSS | less than 10% | LM10410351977154AAA01 |
| 05/06/1979 | Landsat 2 MSS | less than 10% | LM20410351979156XXX02 |
| 24/06/1979 | Landsat 2 MSS | less than 10% | LM20420351979175AAA05 |
| 19/07/1981 | Landsat 2 MSS | less than 10% | LM20420351981200AAA04 |
| 02/05/1985 | Landsat 5 TM | less than 10% | LT50390351985122XXX03 |
| 05/05/1986 | Landsat 5 TM | less than 10% | LT50390351986125XXX03 |
| 10/05/1988 | Landsat 5 TM | less than 10% | LT50390351988131XXX03 |
| 16/05/1990 | Landsat 5 TM | less than 10% | LT50390351990136XXX03 |
| 03/05/1991 | Landsat 5 TM | less than 10% | LT50390351991123AAA03 |
| 05/05/1992 | Landsat 5 TM | less than 10% | LT50390351992126XXX02 |
| 24/05/1993 | Landsat 5 TM | less than 10% | LT50390351993144XXX02 |
| 12/06/1994 | Landsat 5 TM | less than 10% | LT50390351994163XXX02 |
| 30/05/1995 | Landsat 5 TM | less than 10% | LT50390351995150XXX02 |
| 01/06/1996 | Landsat 5 TM | less than 10% | LT50390351996153XXX02 |
| 06/07/1997 | Landsat 5 TM | less than 10% | LT50390351997187AAA01 |
| 22/05/1998 | Landsat 5 TM | less than 10% | LT50390351998142AAA02 |
| 26/06/1999 | Landsat 5 TM | less than 10% | LT50390351999177XXX01 |
| 03/05/2000 | Landsat 7 ETM+ | less than 10% | LE70390352000125EDC00 |
| 14/05/2001 | Landsat 5 TM | less than 10% | LT50390352001134AAA02 |
| 28/07/2002 | Landsat 7 ETM+ | less than 10% | LE70390352002209EDC00 |
| 28/05/2003 | Landsat 7 ETM+ | less than 10% | LE70390352003148EDC00 |
| 12/07/2005 | Landsat 5 TM | less than 10% | LT50390352005193EDC00 |
| 12/05/2006 | Landsat 5 TM | less than 10% | LT50390352006132EDC00 |
| 15/05/2007 | Landsat 5 TM | less than 10% | LT50390352007135EDC00 |
| 01/05/2008 | Landsat 5 TM | less than 10% | LT50390352008122EDC00 |
| 20/05/2009 | Landsat 5 TM | less than 10% | LT50390352009140EDC00 |
Each image was classified as either water or land using a K-means unsupervised approach using all of the available bands (with the exception of the thermal for TM images and thermal/panchromatic for ETM+ images). Post-classification processing was necessary in order to eliminate shadows that were erroneously classified as water. Accuracy assessment was performed and overall accuracy ranged from 96% to 100%. Two hundred random sample points were used to analyze the accuracy of each image. The classified maps were visually compared to the original images which were used as reference data. Ground observations were also undertaken in March 2009. The MSS accuracy statistics were generally slightly lower than the TM and ETM+ results. This can be attributed to the lower spatial, radiometric, and spectral resolution of the data and some image anomalies such as missing rows of pixels. Visual inspection for quality control and assessment of the classified images resulted in the elimination of all incorrectly classified areas. The image processing steps were performed using PCI Geomatica software, while the Geographic Information System (GIS) analysis was completed using ESRI ArcGIS. Lake surface extent was calculated in ArcGIS by multiplying the number of water pixels in each image by the spatial resolution of the original satellite imagery (79 m for MSS and 30 m for TM and ETM+). The possibility of mixed shoreline pixels was thought to be equal among images even though the coarser resolution MSS data may not resolve the shore/water interface as clearly as the TM or ETM+ data.
4. Results
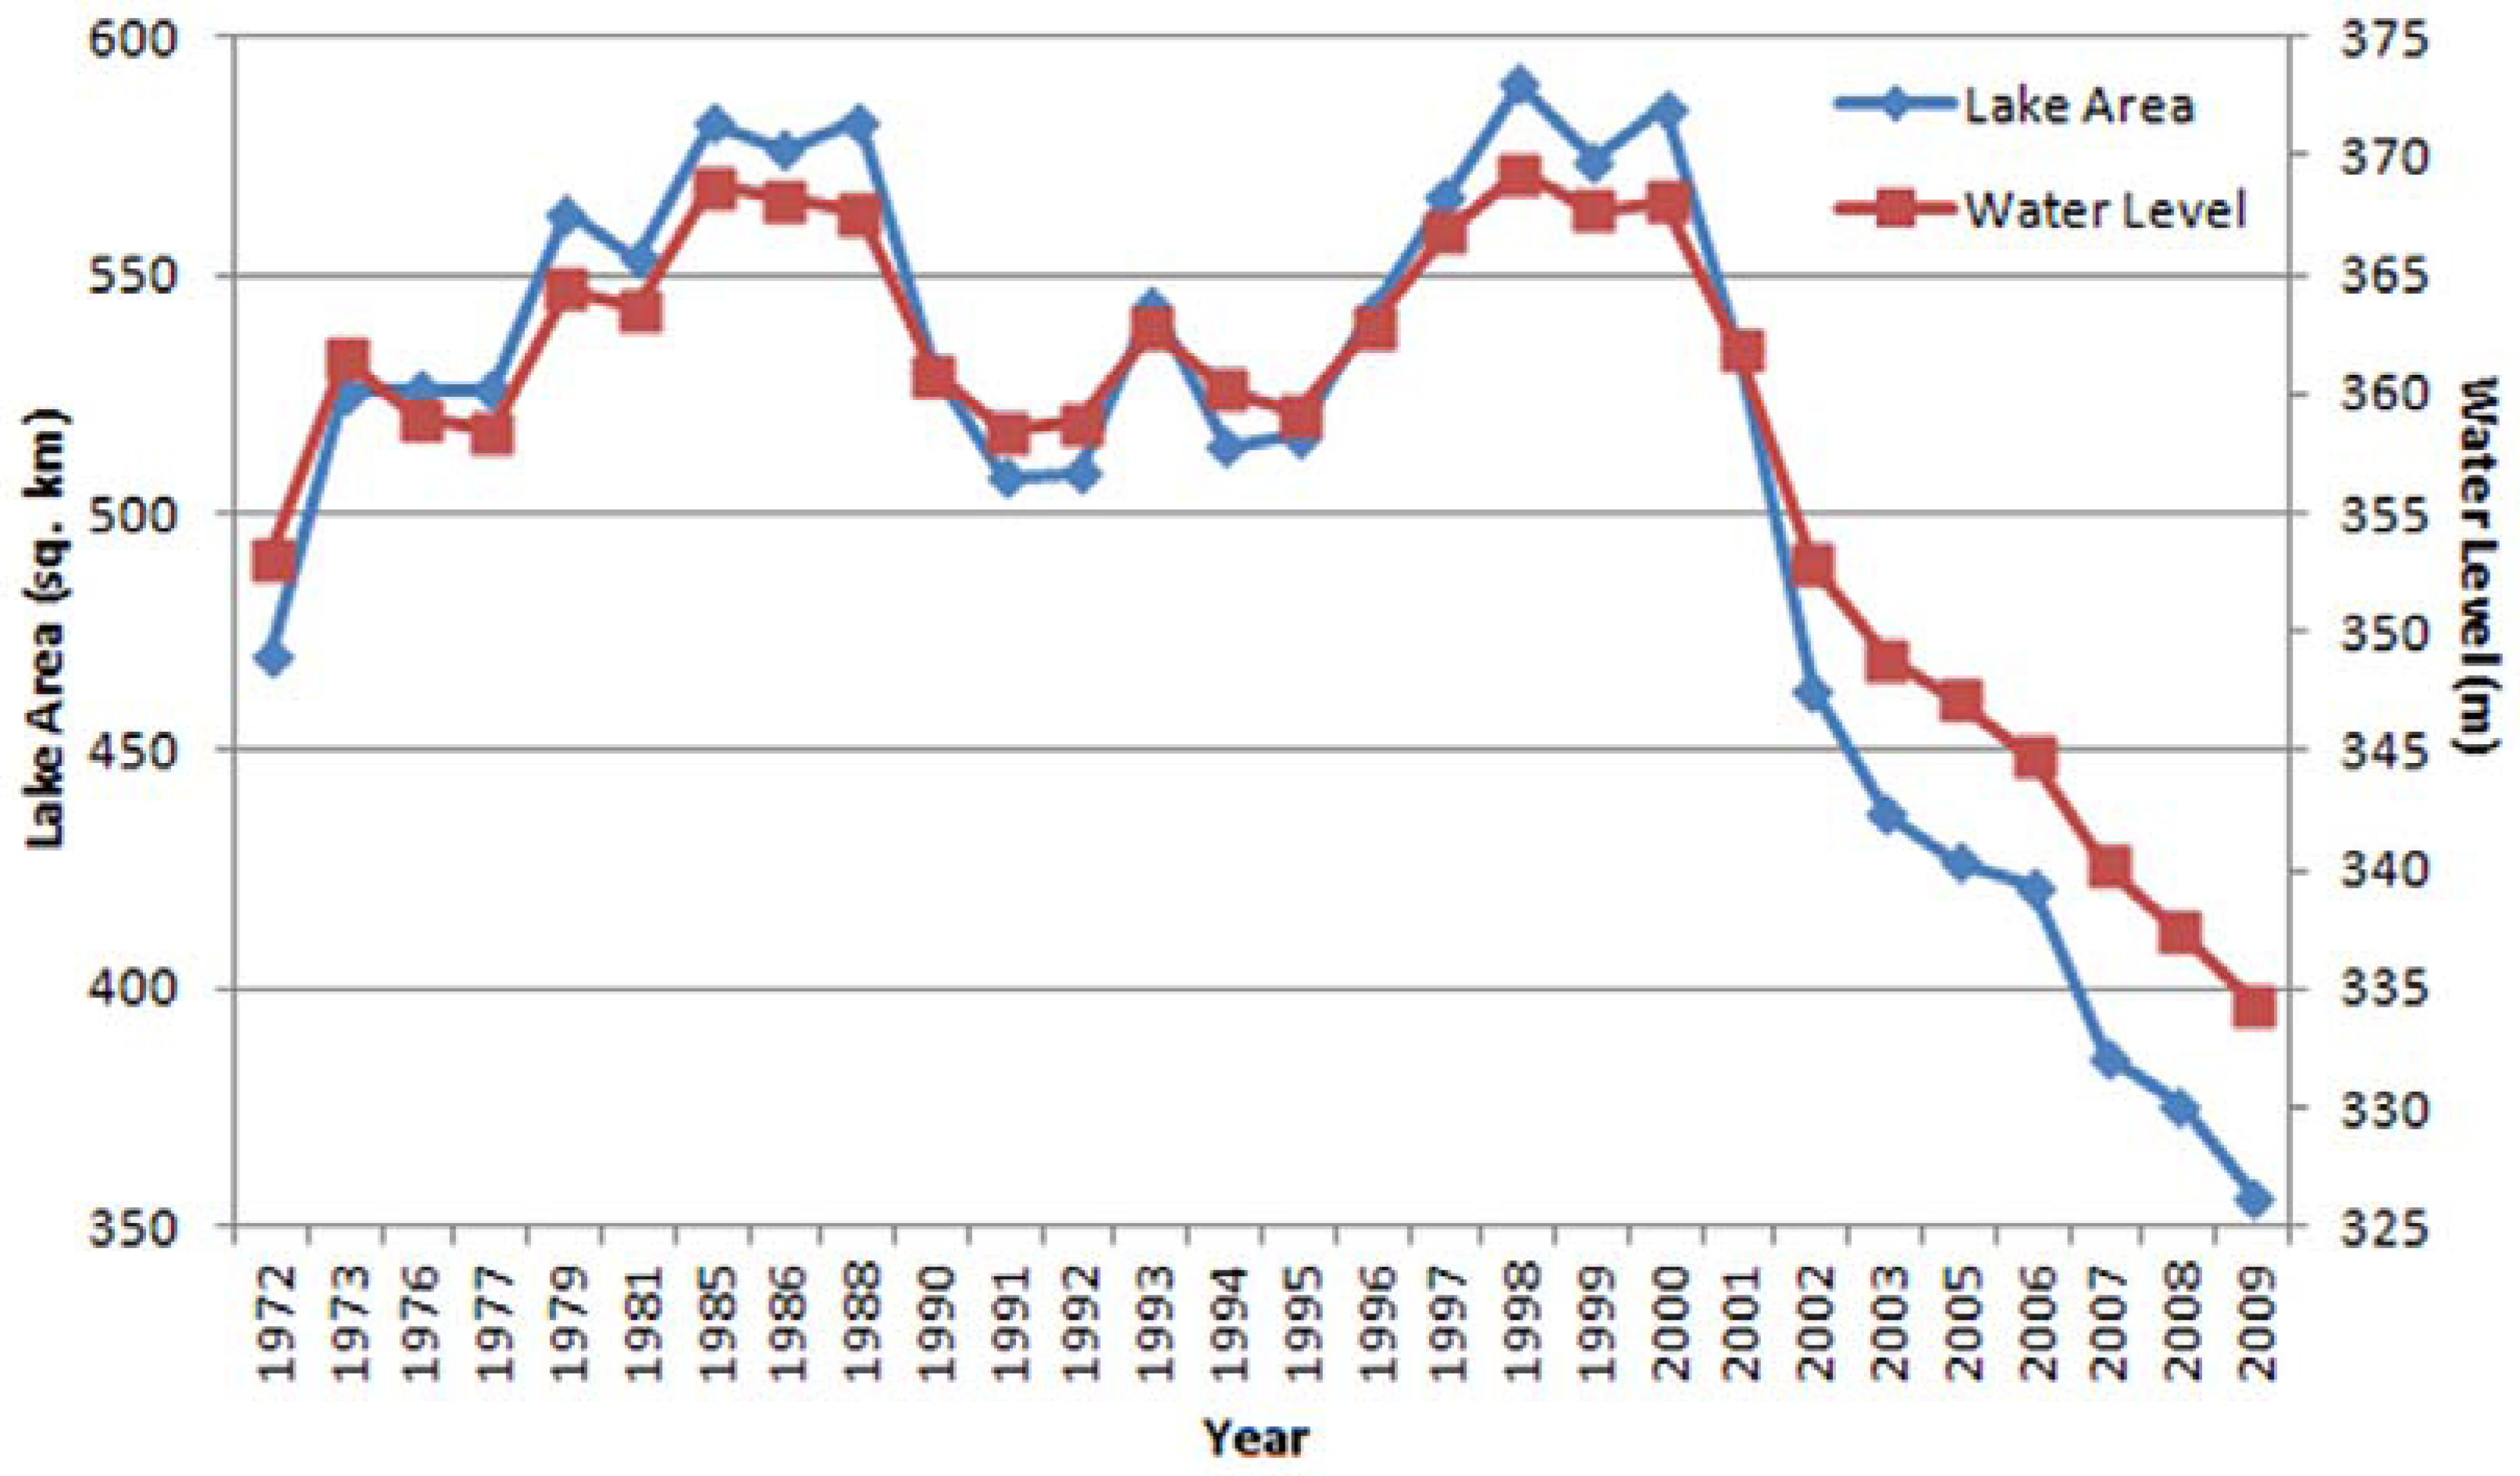
In this research, lake area extent fluctuated during the analysis period (
Figure 3). During the 1970s, there was an increasing trend; from the mid-1980s to the mid-1990s, water levels generally decreased; while from 1996 to 2000 there was again an increasing trend. There has been a consistent downward trend in lake area and water levels since 2000. McCabe and Wolock [
21] state that the long-term sustainability of the water-supply system in the Colorado River Basin will be affected by the future levels of natural flows that replenish the reservoirs.
Figure 3.
Lake Area and Water Levels (at the Hoover Dam) for the 1972–2009 Period. Source: Water Levels [
22].
Figure 3.
Lake Area and Water Levels (at the Hoover Dam) for the 1972–2009 Period. Source: Water Levels [
22].
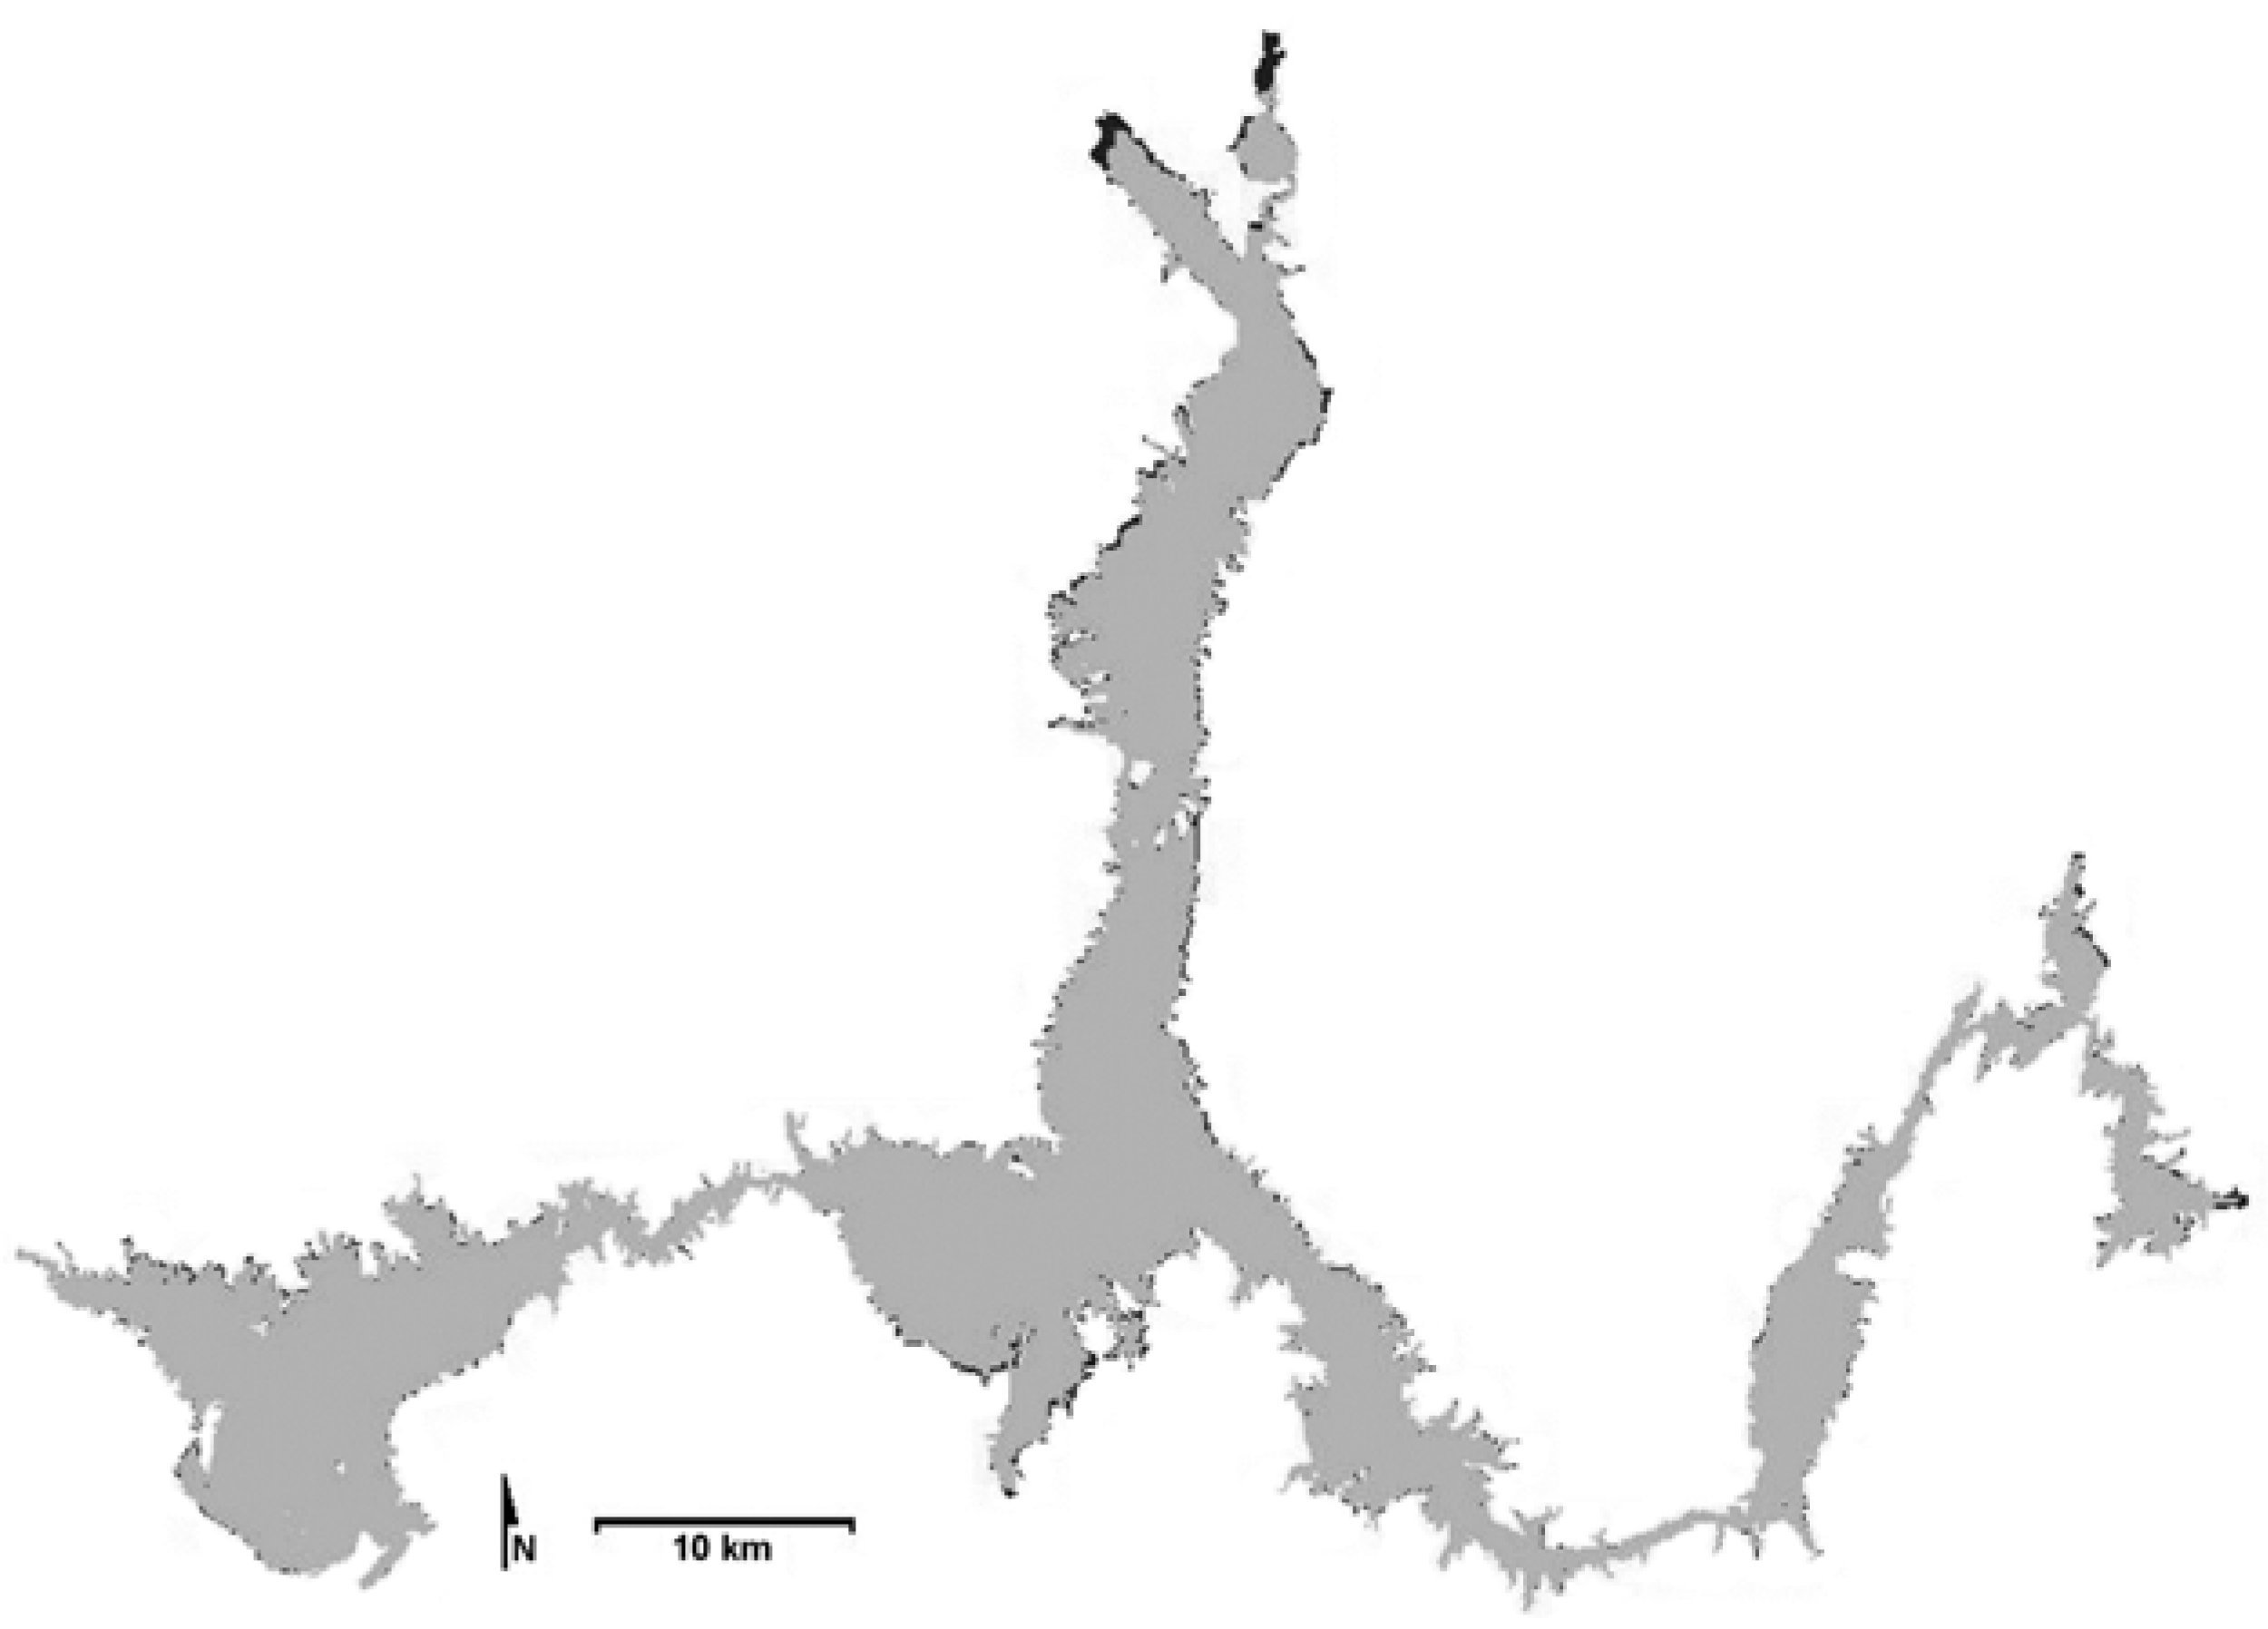
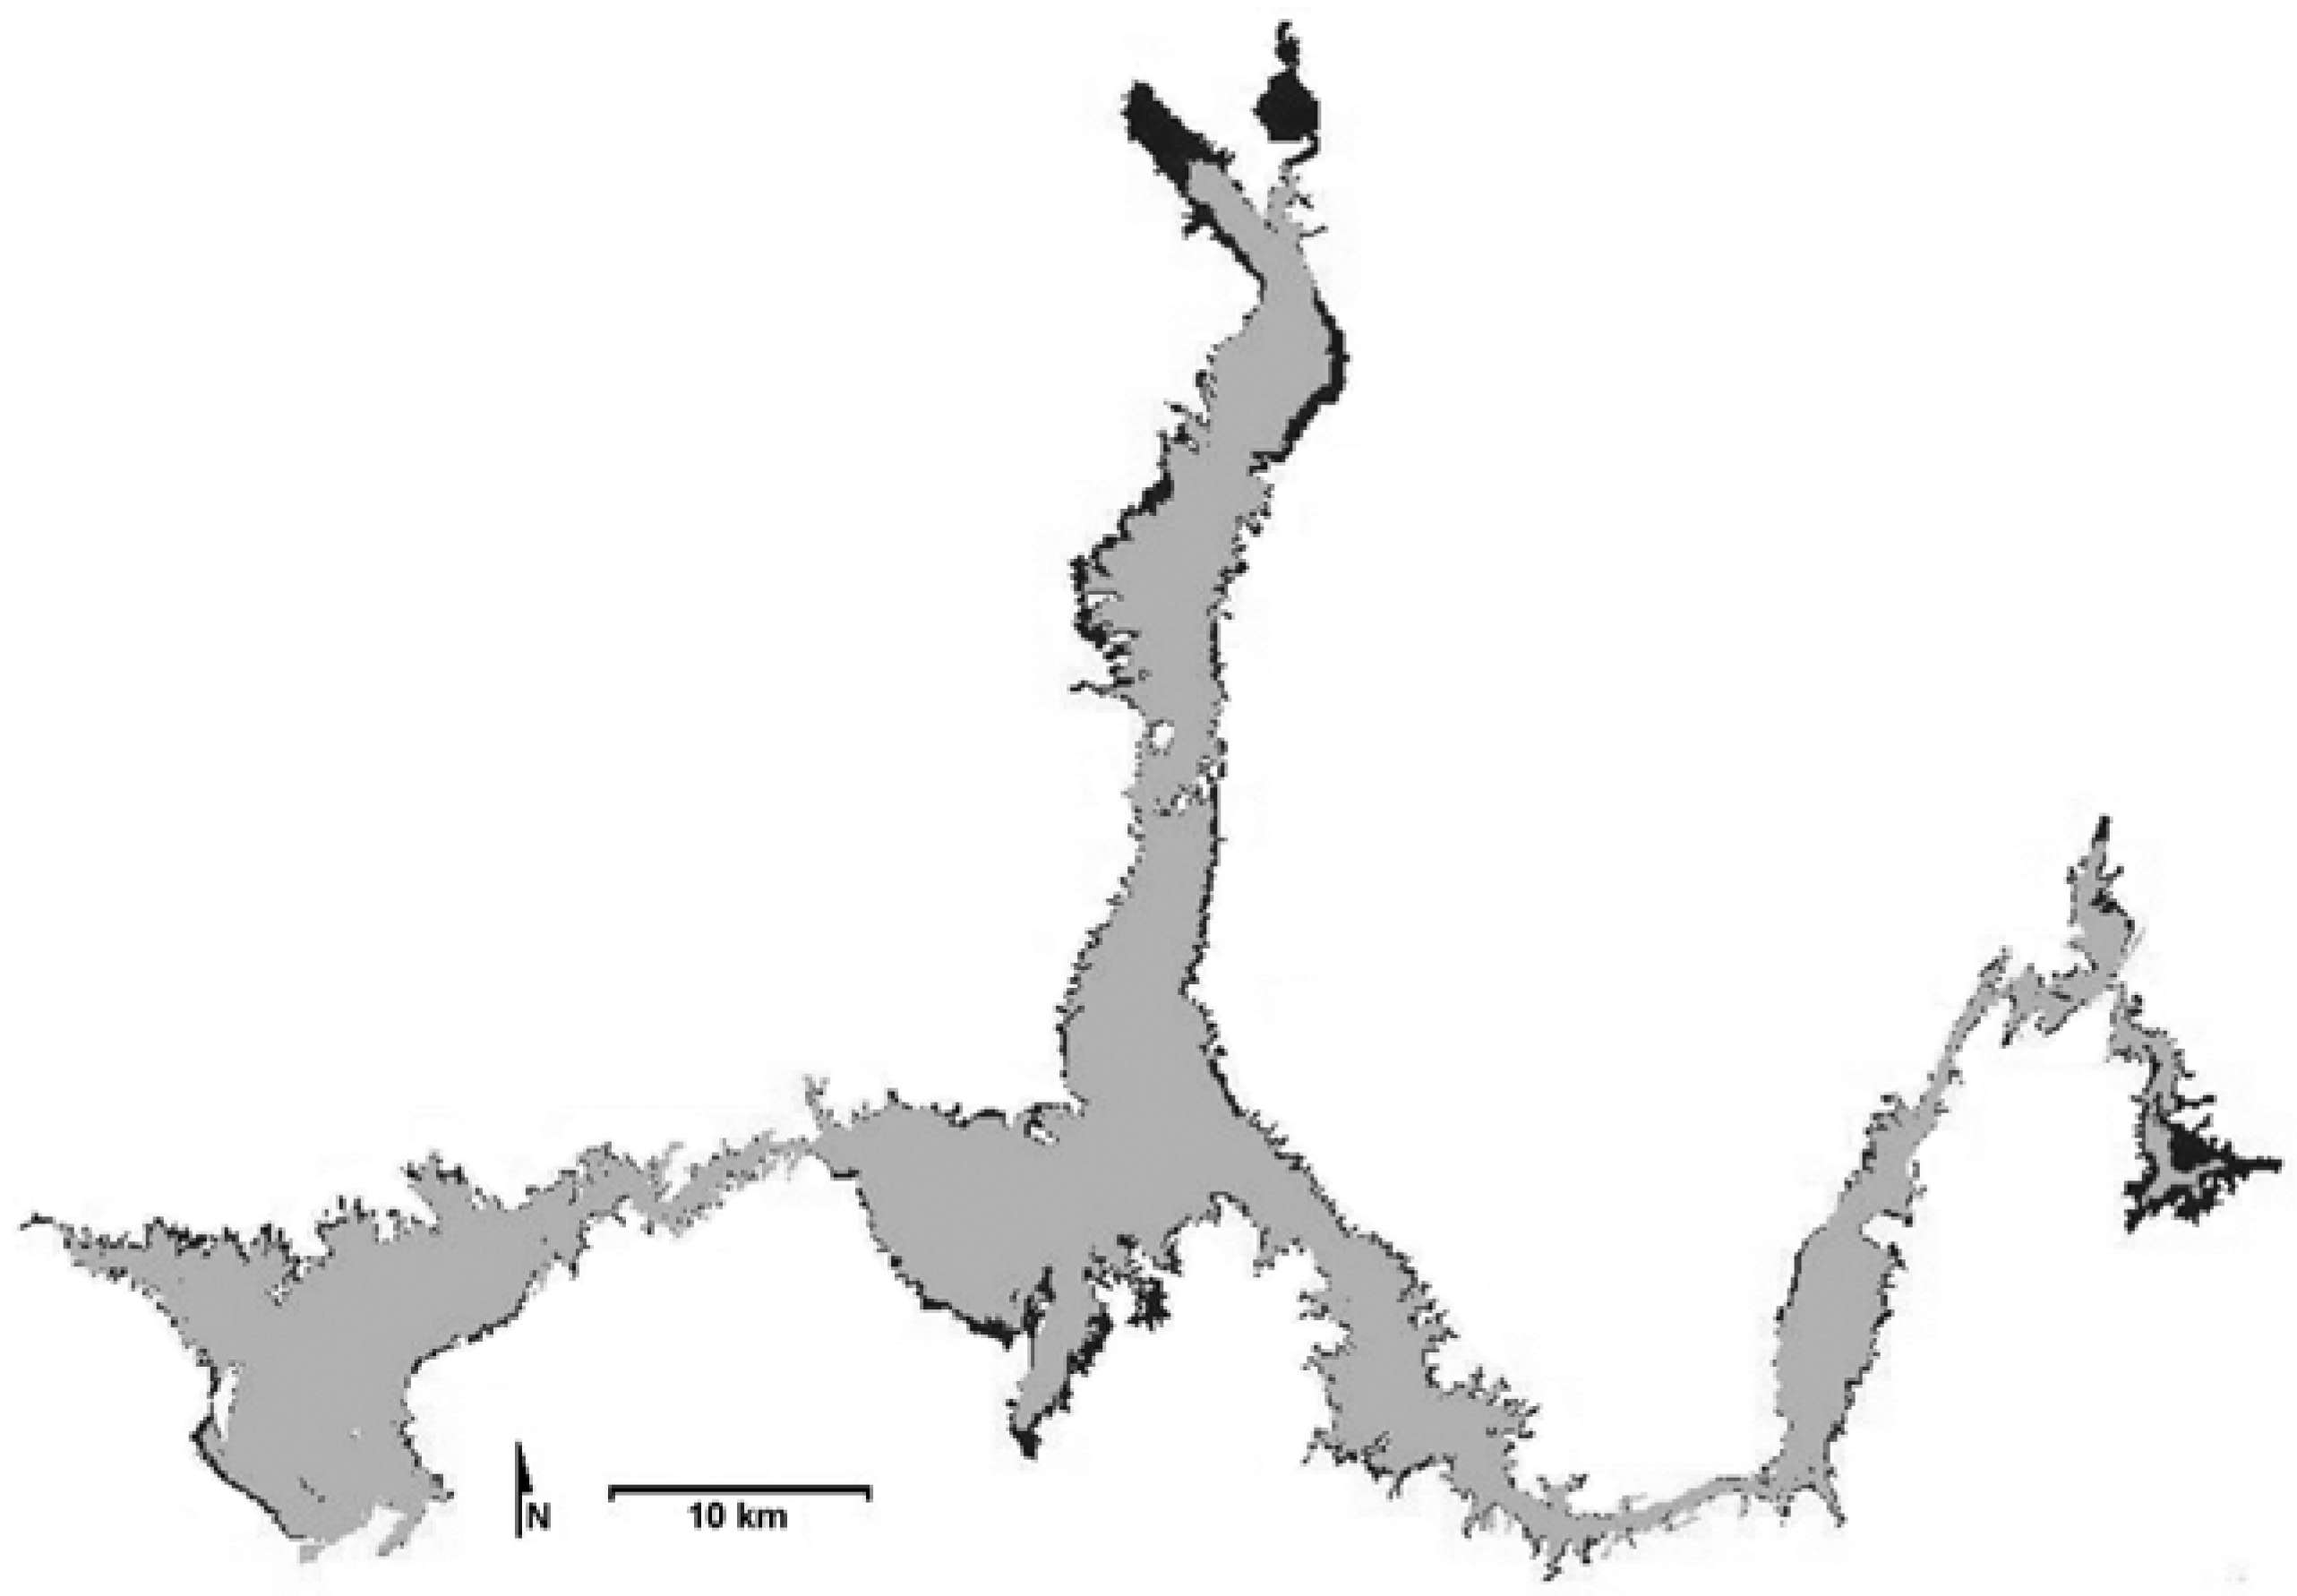
Due to space considerations, it was determined that decadal summaries of lake levels would be the most suitable method to visually present the results. These encompass the entire analysis period (from the beginning of Landsat data acquisition in 1972 to the last year of the assessment period). The lake area analysis showed that decadal minimums/maximums (
Figure 4–
Figure 7) were achieved in 1972/1979, 1981/1988, 1991/1998, and 2009/2000.
Figure 4 shows that the major differences in lake area during the 1970s were most noticeable in the northern, south central and eastern portions of Lake Mead.
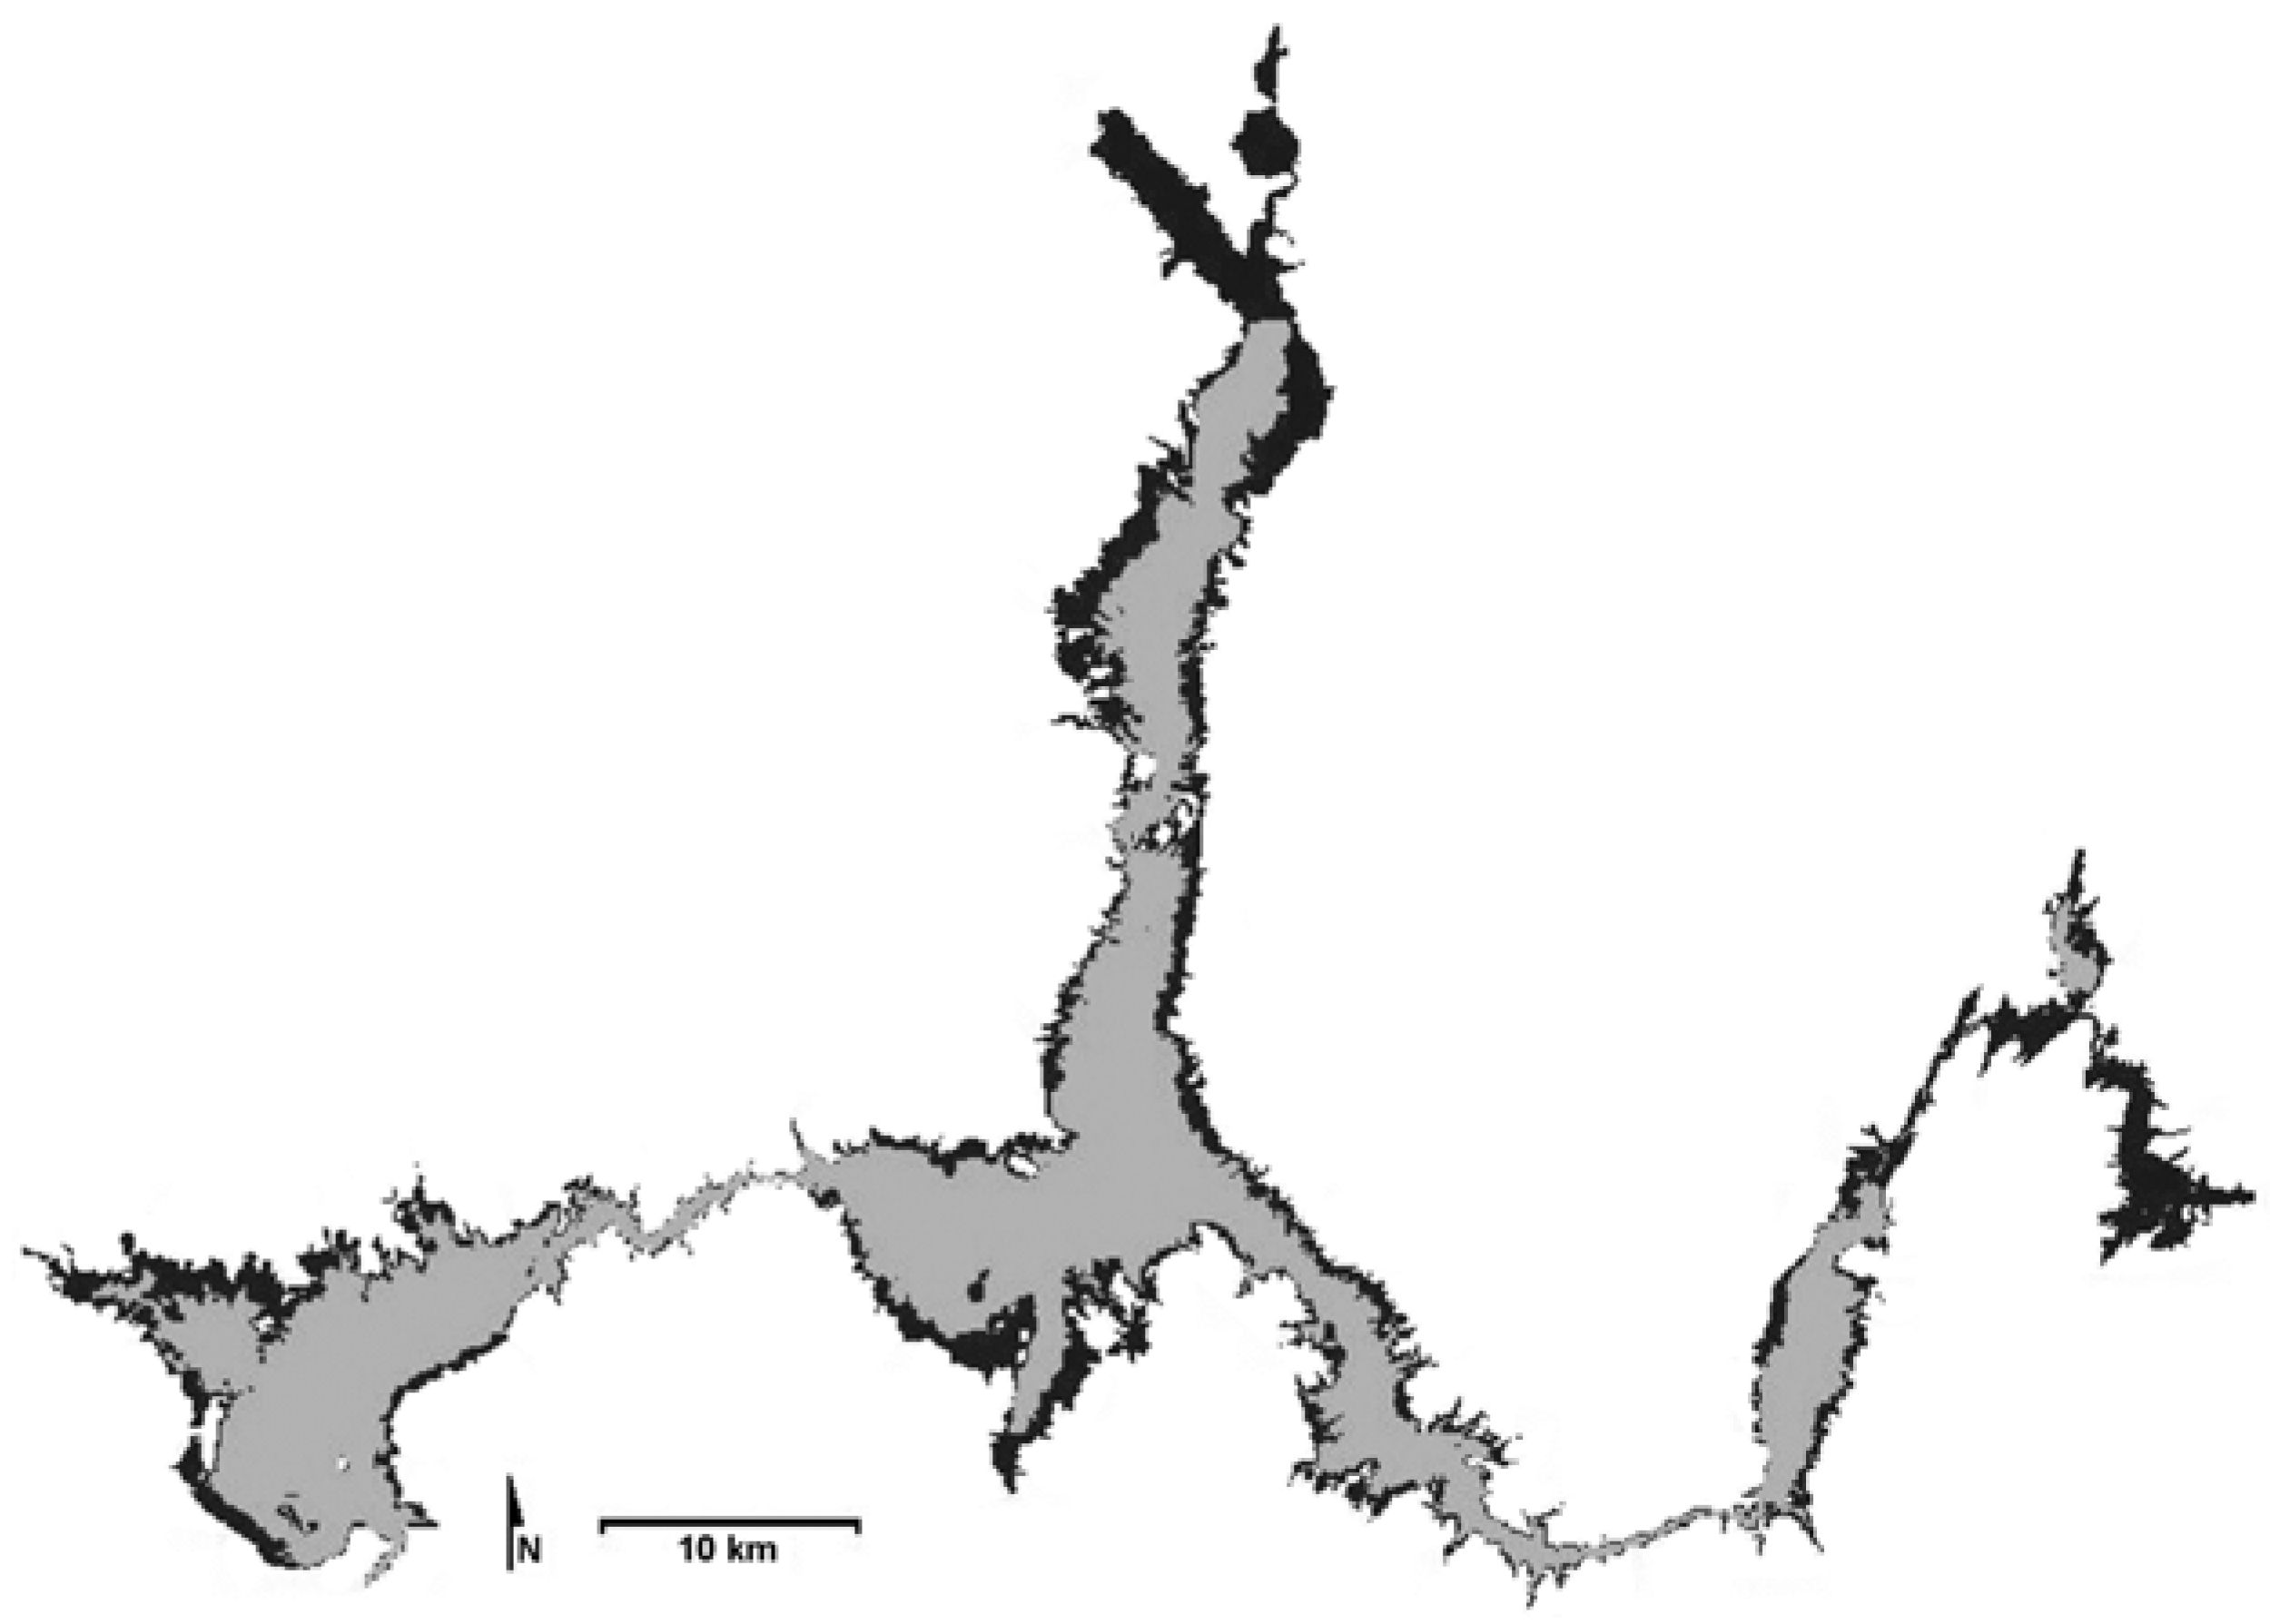
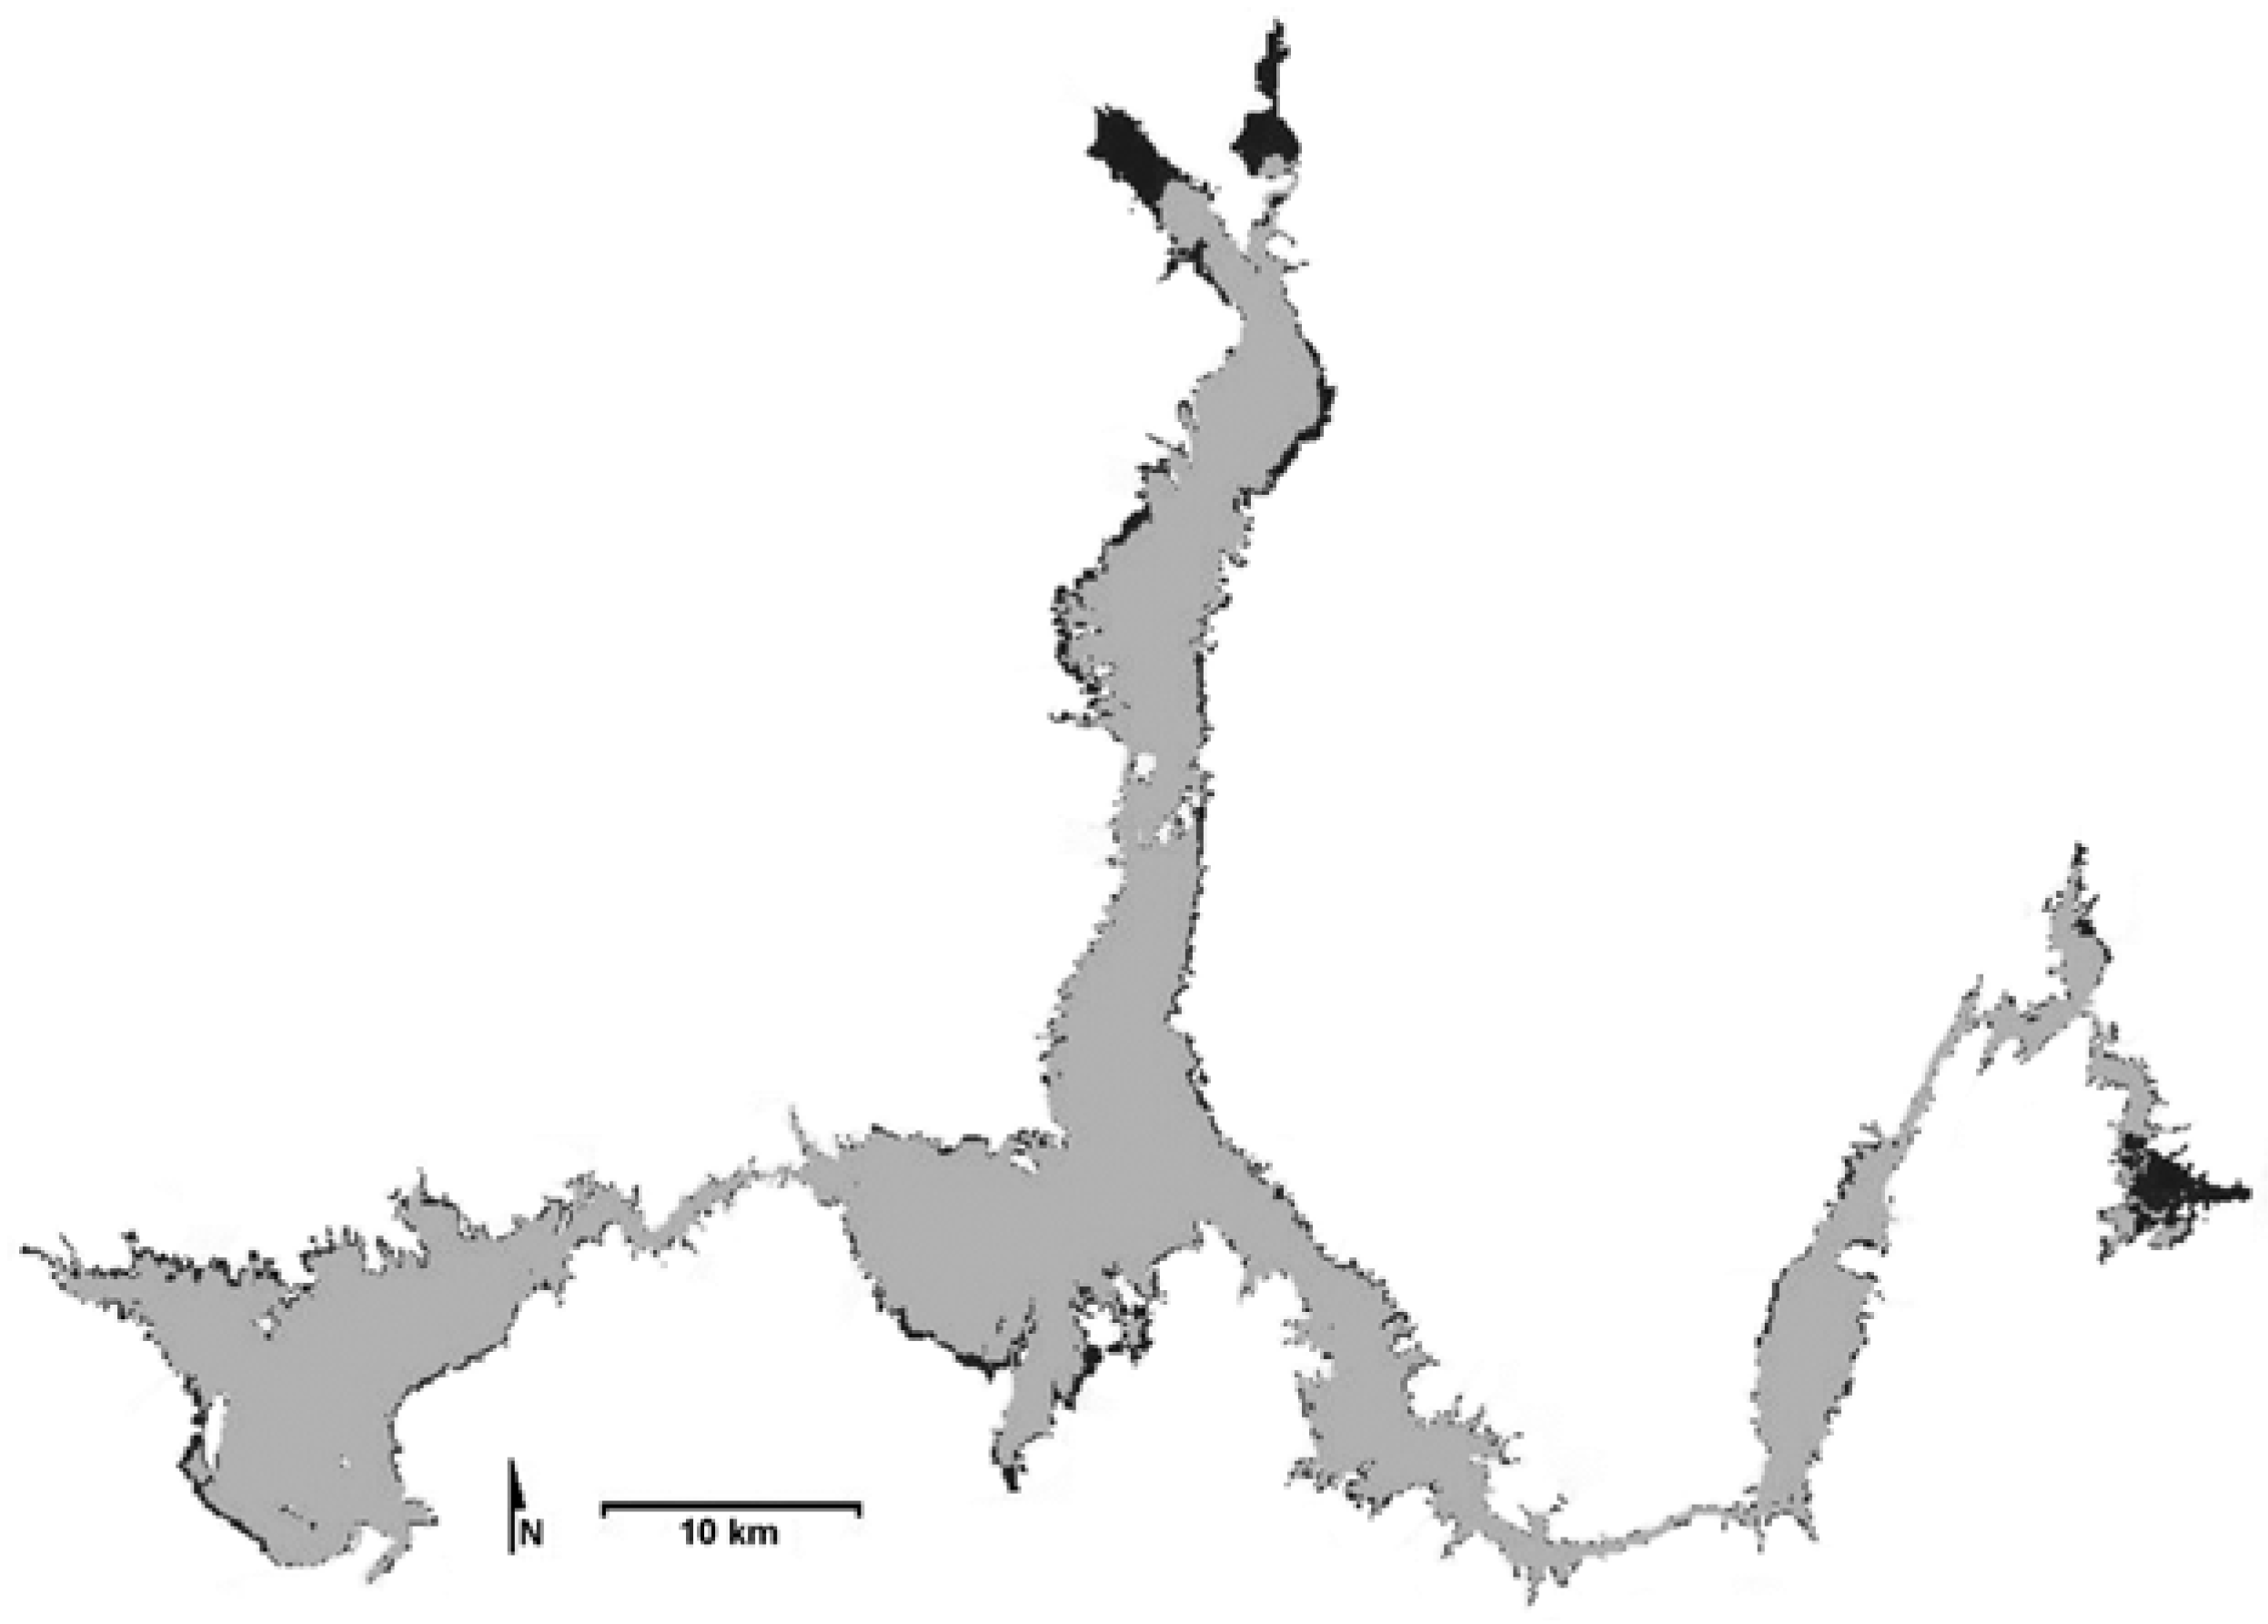
Figure 5 illustrates that the 1980s saw minimal overall differences in lake area with the most noticeable change in the northern reaches of the lake. The 1990s (
Figure 6) were similar in terms of water level change (although not quite as pronounced) as the 1970s. The 2000s (
Figure 7) saw pronounced water level changes that were very apparent in all parts of the lake.
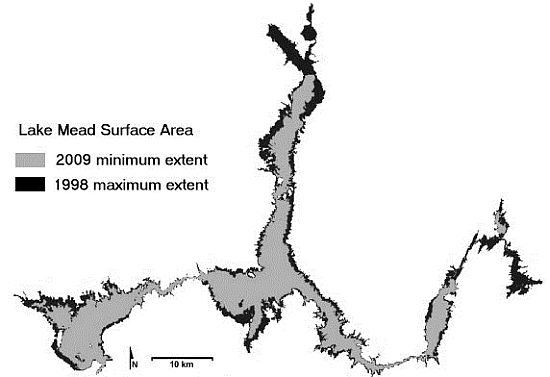
Figure 8 illustrates the minimum lake area extent (during the analysis period) which occurred in 2009 (356.4 km
2) and the maximum which occurred in 1998 (590.6 km
2). The long-term average lake area extent is 508.3 km
2 (125,600 acres) for the period from 1942 to 1995 [
10] and the full pool extent is 637 km
2 [
2].
Figure 7 and
Figure 8 are very similar as the maximum lake extents in 1998 and 2000 (585.2 km
2) are quite comparable. In addition, the water level at the Hoover Dam was only 1.2 m higher in 1998 than 2000.
Figure 4.
Minimum (grey)/ maximum (black) lake area extents for the 1972/1979 period.
Figure 4.
Minimum (grey)/ maximum (black) lake area extents for the 1972/1979 period.
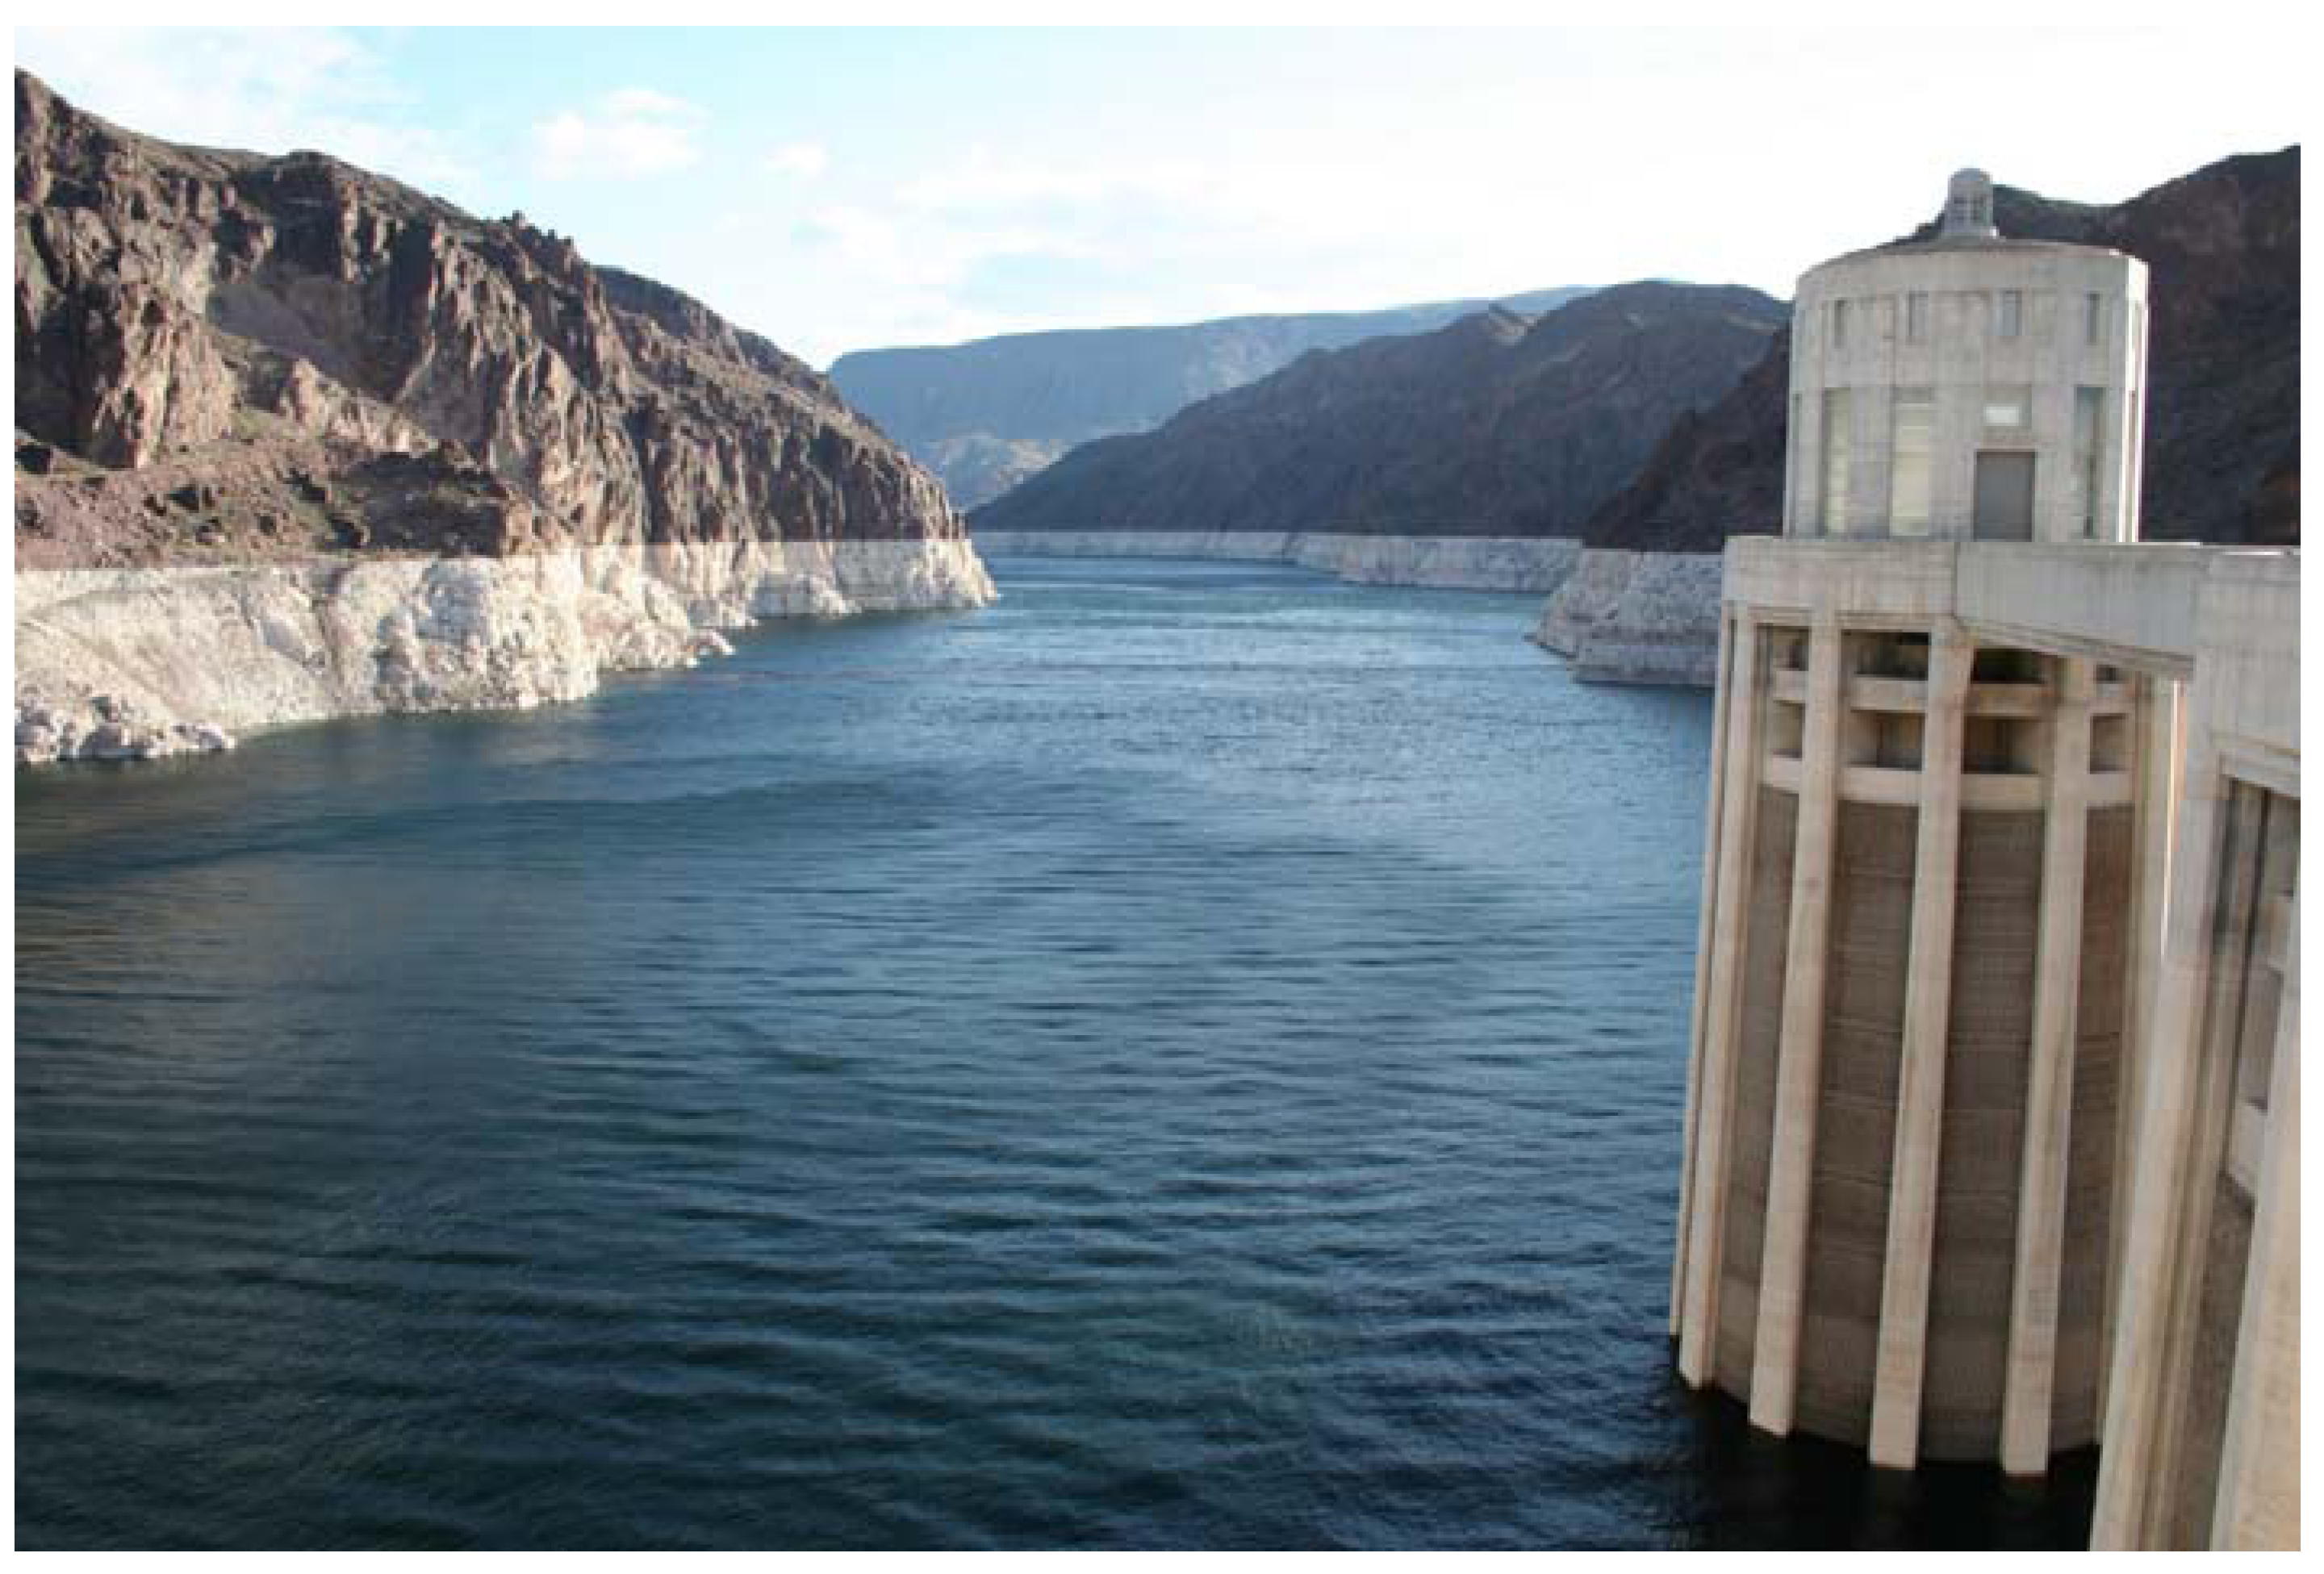
When the Landsat derived area estimates are compared with water levels measured at the Hoover Dam, there is a very strong relationship between the satellite estimates and actual measured water levels (simple linear regression reveals a R2 value of 0.99 (adjusted R2 = 0.989). Obtaining a complete (yearly) record of satellite images was not possible and this may have caused some of the slight deviations in the time series as yearly variations in water levels at the dam do not completely correspond with the satellite derived estimates. In addition, varying slopes around the lake can account for some of the variance that was observed in parts of the time series (i.e., depending on slope, more or less lakebed may be exposed depending on water levels). It was possible to classify the “bathtub ring” in many parts of the lake, however it was difficult in other areas due to vertical (cliff) rock formations.
Figure 5.
Minimum (gray)/maximum (black) lake area extents for the 1981/1988 period.
Figure 5.
Minimum (gray)/maximum (black) lake area extents for the 1981/1988 period.
Figure 6.
Minimum (grey)/maximum (black) lake area extents for the 1991/1998 period.
Figure 6.
Minimum (grey)/maximum (black) lake area extents for the 1991/1998 period.
5. Discussion
This research found that the area of Lake Mead has fluctuated over the last four decades in uneven cycles. The major concern is that a steady downward trend has been observed since 2000. Barnett and Pierce [
1] suggest that Lake Mead may go ‘dry’ if remedies to water shortage problems on the Colorado River are not found. They suggest that solutions must be time-dependent to match the time-varying, human-induced decreases in future river flow. Meko
et al. [
23] state that a hydrologic drought occurred in the mid-1100s in the Upper Colorado River Basin. However, in the long-term historical context, flow conditions that have occurred in the past, may occur in the future [
21]. This was certainly the case for the 1972–2000 portion of the analysis period (refer to
Figure 3) in this research.
Figure 7.
Minimum (grey)/maximum (black) lake area extents for the 2009/2000 period.
Figure 7.
Minimum (grey)/maximum (black) lake area extents for the 2009/2000 period.
There are many demands for water in the southwestern United States. These include irrigation uses for agriculture, hydroelectric power, and other human-related activities. Climatic factors also play a role in water loss. The average annual evaporation rate for Lake Mead is approximately 2.3 m (7.5 feet) [
24]. All of these factors lead to a depletion of the water contained within Lake Mead. Christensen
et al. [
25] state that future climate will reflect the fragile equilibrium that now exists in operation of the reservoir system, with system demands only slightly less than long-term mean annual inflow.
Figure 8.
Absolute minimum (grey–2009)/maximum (black–1998) lake area extents for the analysis period.
Figure 8.
Absolute minimum (grey–2009)/maximum (black–1998) lake area extents for the analysis period.
6. Conclusion
The Colorado River stores and provides water to approximately twenty-seven million people in seven states in the Southwestern part of the United States and in northwestern Mexico; approximately 12,140 km
2 (three million acres) of farmland is irrigated from this supply [
1]. Water availability is not always certain. In some years water management is complicated by factors such as decreased snowpack in the western mountains, a rise in temperature and stream flow progressively shifting to earlier in the season. Fluctuations in sustainable water availability, in general, contain substantial consequences for an economy and an ecosystem. Milly
et al. [
26] produced climate models predicting that by 2050, an approximate thirty percent decline in runoff for western North America will occur. In a similar study, human-induced climate change is argued to be a main factor that could lead to a decline in runoff in the Southwest region by ten to thirty percent in the next four decades [
1]. At the same time, temperatures are predicted to increase from 2 to 4 °C by 2050 [
1,
26]. Ultimately, changing climate could reduce the flow of the Colorado River system which may lead to lower reservoir storage. Lake Mead and Lake Powell function under the United States Bureau of Reclamation which is responsible for sustaining water deliveries to surrounding communities. To do this, the Bureau undertakes efforts to maintain Lake Mead’s elevation at just over 300 m a.s.l. which is the level necessary to just exceed water consumption [
1]. Future changes in the level of Lake Mead may be driven by climate change, the effects of natural climate variability, and the current operating status of the reservoir system [
1].
Smith and Pavelsky [
27] state that satellite remote sensing of surface water fluxes and storages in rivers, lakes, reservoirs and wetlands is an immature but rapidly growing field. This research showed that a combined remote sensing and geographic information system approach was very successful in visualizing the differences in lake area/level throughout the analysis period. In addition, Landsat data were found to be very suitable for this type of large lake analysis. There were some challenges with the lower resolution multispectral scanner data, however the area estimates that were derived from all of the images corresponded very well with recorded water level data. The observation of continuing downward trends in lake area and water levels within the last ten years of the analysis period may be part of a longer term trend or may be part of upward/downward trends that were observed throughout the 1970s, 1980s and 1990s. Landsat data have been utilized for many different types of remote sensing applications. The long record of images available (at no charge) through the USGS Landsat archive [
19] makes them ideal for historical time-series visualization projects. This research improves upon standard methods to monitor water levels such as tables and line graphs [
28,
29]. It shows that imagery can be used to effectively visualize water level fluctuations and display changes due to variations in climatic conditions on a decadal or longer term basis. This may be useful in creating public awareness of the problems caused by the continuing drought in this region as Lake Mead is very important in regional water supply management. Satellite derived lake surface area fluctuations can also potentially be used in reservoir management and to monitor the effects of drought.


