1. Introduction
Brazil has more than 6 million hectares of forest planted with species from the genera
Pinnus and
Eucalyptus [
1]. The primary purpose of these plantations is the production of cellulose pulp. The forests of the genus
Eucalyptus are present in different regions of the country at sites with different topography and rainfall. In the state of São Paulo, Brazil, these plantations are concentrated in the Ribeirão Preto, Botucatu, Vale do Paraíba and São Paulo regions, which, with the exception of Ribeirão Preto, are located close to the Serra do Mar and/or Serra da Mantiqueira.
The Serra do Mar and Serra da Mantiqueira are characterized tectonically by a fault block terrain, and their lithology is made up of crystalline and metamorphic rocks, such as gneiss and granite, associated with heavily decomposed intrusive rocks [
2]. These characteristics, along with the rainfall regimen of this region, with an average annual rainfall of 1200 mm, can result in large landslides. The disasters that occurred in Caraguatatuba (March 1967, 200 lives lost), Cubatão (February 1994, flood of RPBC and interruption in petroleum production with losses of 40 million dollars, according to Gramani [
3]) and Campos do Jordão (January 2000, with the destruction of many houses) are examples.
Vegetation cover can control and prevent natural disasters caused by mass movement such as landslides on the hillsides of mountainous areas. On the other hand, improper soil management linked with natural constraints accelerates the degradation process. Intense and concentrated rainfall, steep hillsides unprotected by vegetation, illegal settlements on steep hillsides and lithologic and pedogenic discontinuities are some of the conditions that can accelerate erosion processes and, consequently, mass movements [
4,
5,
6,
7].
Eucalyptus forests pass through different developmental stages, from deployment to harvest, which are characterized by different percentages of soil coverage and leaf biomass. During the harvesting period, the erosion rate and landslide frequency increase. Compared with a preserved forest area, the rate of erosion in a harvested area can increase by a factor of as much as four [
8]. There is concern about the increasing area of
Eucalyptus plantations in places with steep hillsides in the state of São Paulo, as there are no specific studies on the impact of reforestation on mass movement processes.
Parise [
9] highlights four types of landslide maps: maps of inventory, maps of the current movements of landslides, maps of susceptibility and maps of vulnerability. Geographic information systems (GIS) are an important analysis tool, allowing the mapping of areas that are susceptible to landslides using different modeling methods. There are two classifications of such methods in the literature: direct and indirect [
10]. The direct methods are based on a detailed geomorphological map, and the different degrees of susceptibility are mapped with the aid of field surveys. The primary disadvantage of these methods is the delay in mapping [
11]. The indirect methods are based on the mapping of places where landslides have already occurred in the past and the mapping of geological and geomorphological characteristics that are directly or indirectly related to hillside stability [
12].
Approaches to mapping can also be classified as either quantitative or qualitative. A quantitative approach uses mathematical tools to estimate susceptibility and includes multivariate statistical methods, discriminant analysis, linear regression and nonlinear methods, such as neural networks [
6,
13,
14]. Qualitative methods are based on the previous experience of an individual or a group of people and are therefore more subjective. Some examples are the WLC (Weighted Linear Combination) and AHP (Analytic Hierarchy Process) methods [
15]. Some techniques are classified as semi-quantitative, such as fuzzy logic [
16,
17,
18,
19,
20,
21].
Due to the uncertainties in the parameters used in the evaluation of landslides and the non-linearity that characterizes this phenomenon, fuzzy logic is considered an effective approach to mapping landslides, incorporating expert knowledge in the spatial inference technique and resulting in maps that are easy to understand, which are indicated for the analysis of large areas [
17]. In Brazil, the most common mass movements are shallow translational landslides induced by rainfall, and this work predicts this movement. Translational movement represents the most common form among the types of mass movement, showing a plane-like surface of rupture, which accompanies, in general, mechanical and/or hydrological discontinuities that exist inside the material [
18]. In Brazil, there are no ongoing studies evaluating the scars caused by mass movements for the purpose of map validation. However, susceptibility maps are of extreme importance because they are the basis for the generation of landslide hazard maps [
6].
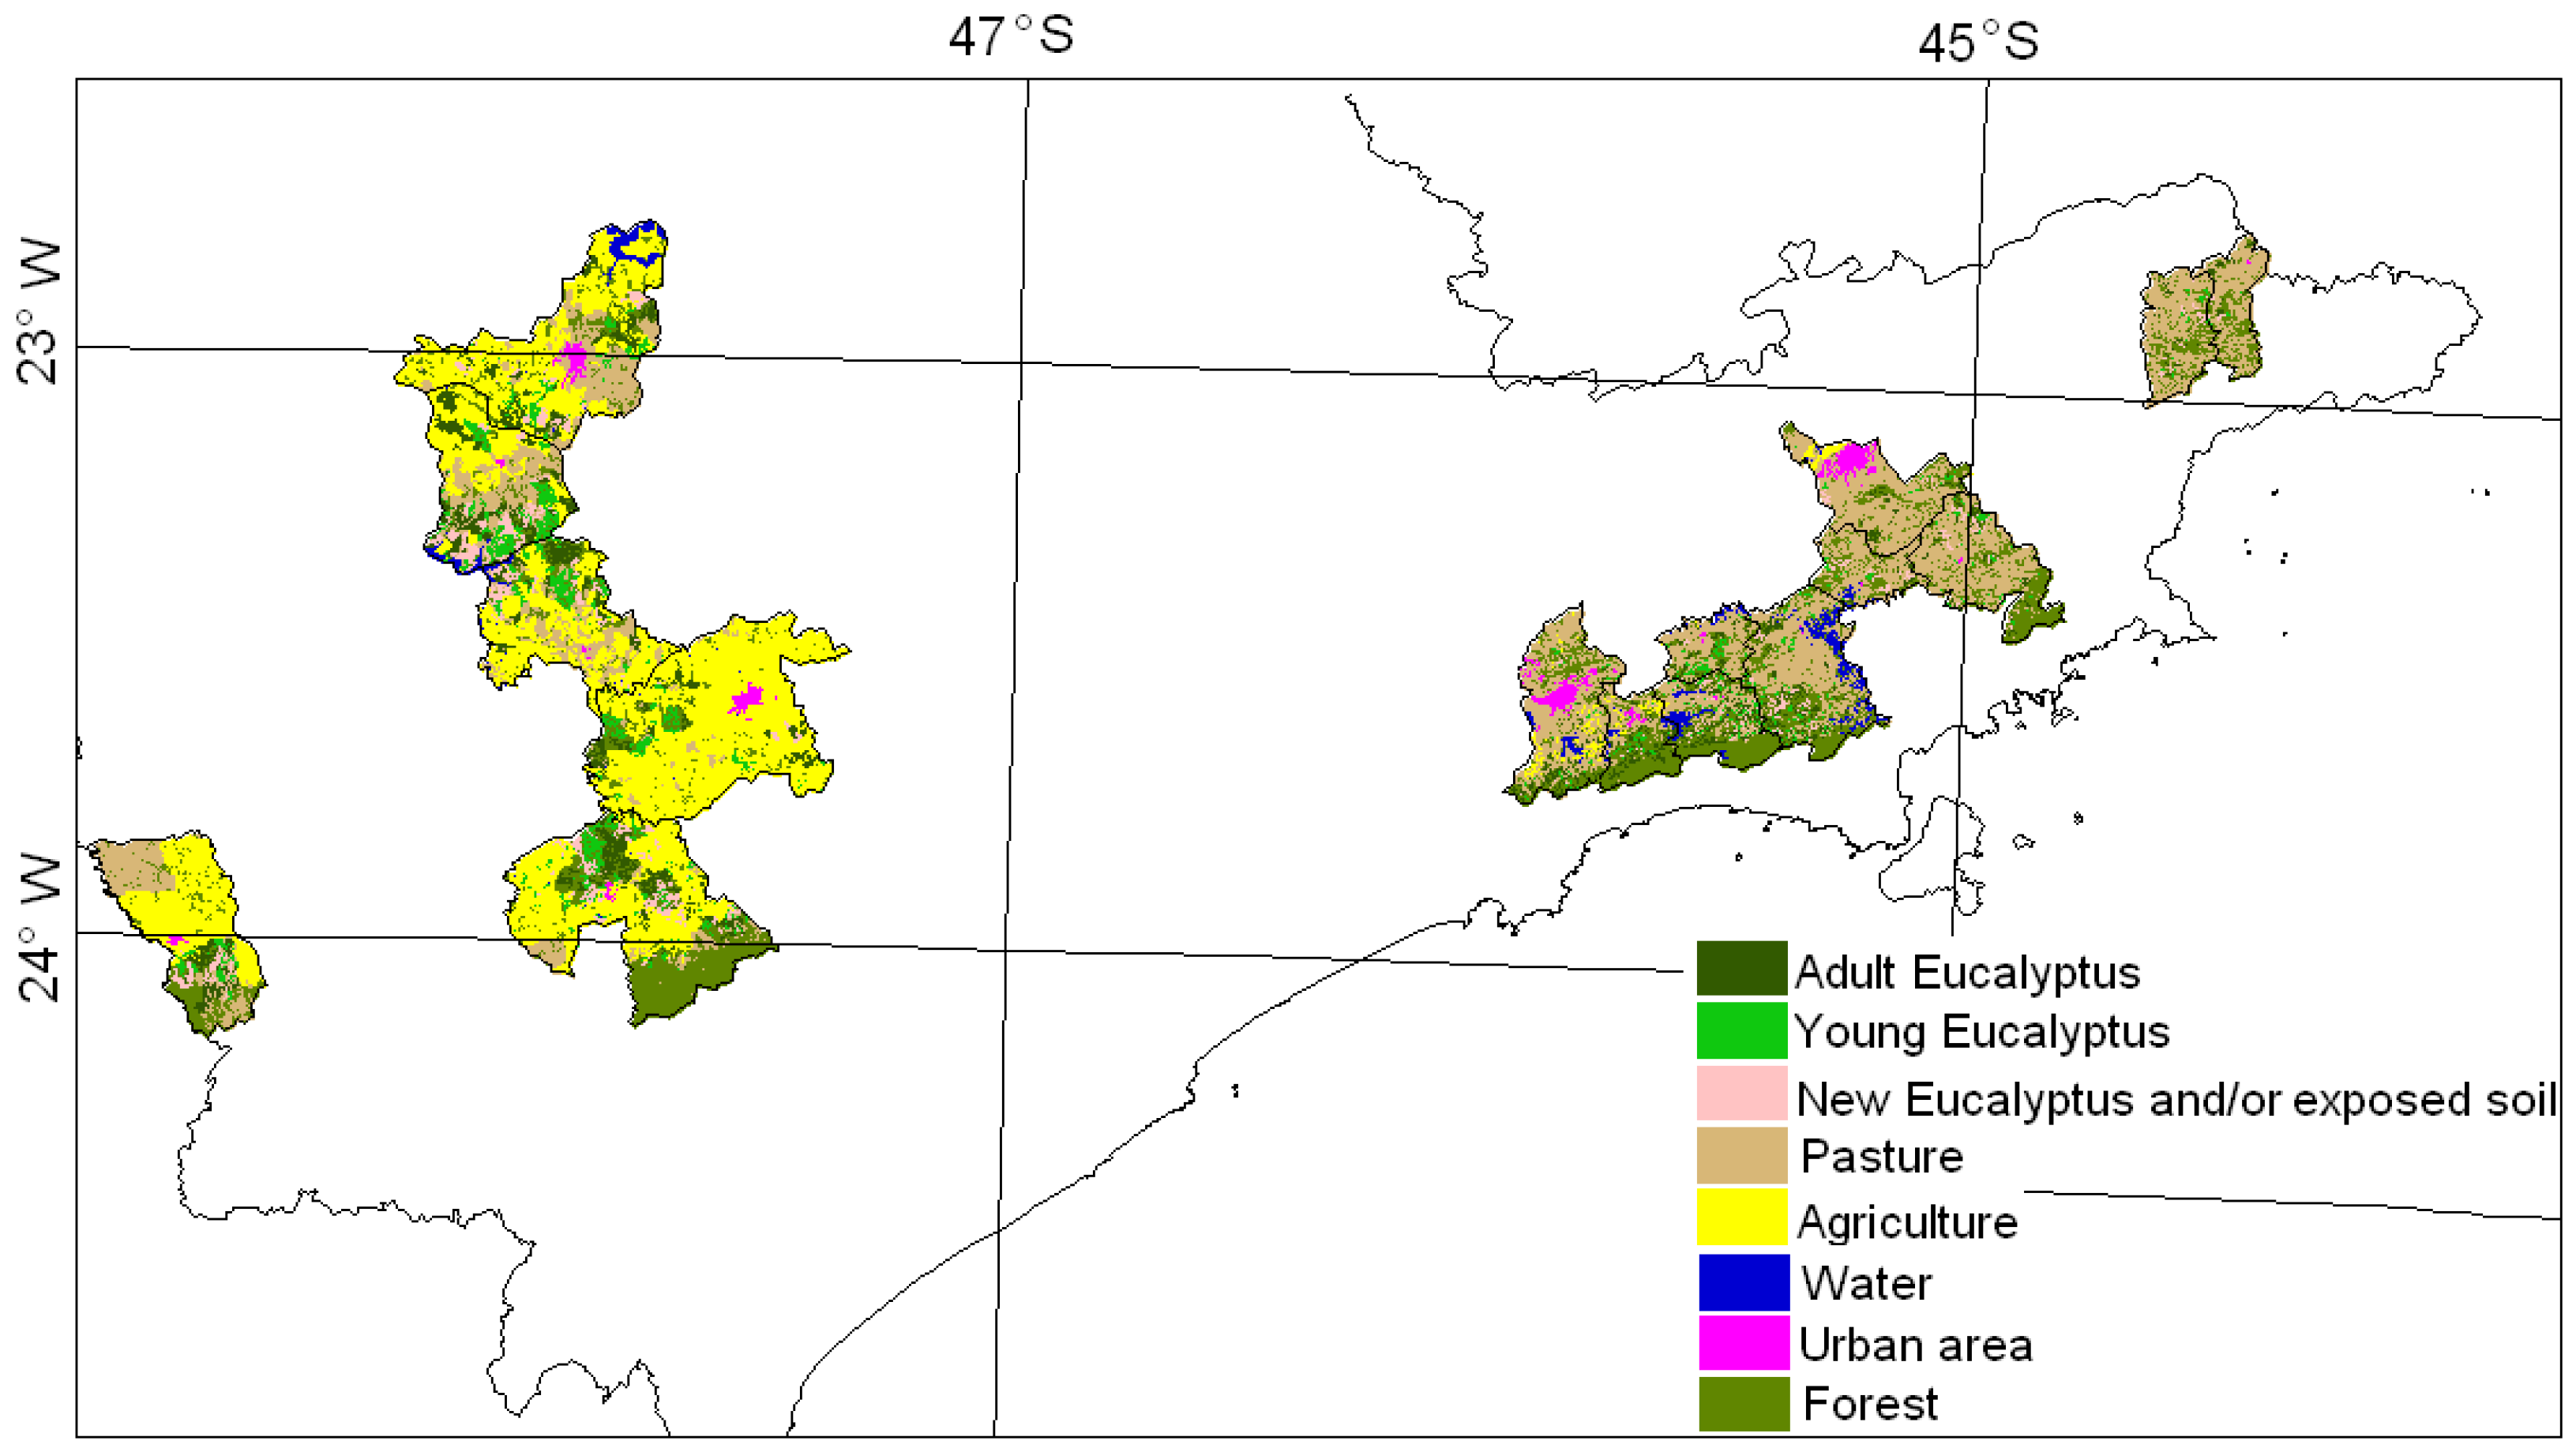
The present study aimed to map the areas that are susceptible to landslides in places occupied by Eucalyptus plantations in different developmental stages in the state of São Paulo using geographic information systems (GIS) and spatial inference techniques, and to compare these areas with the areas occupied by other land uses and land covers.
2. Materials and Methods
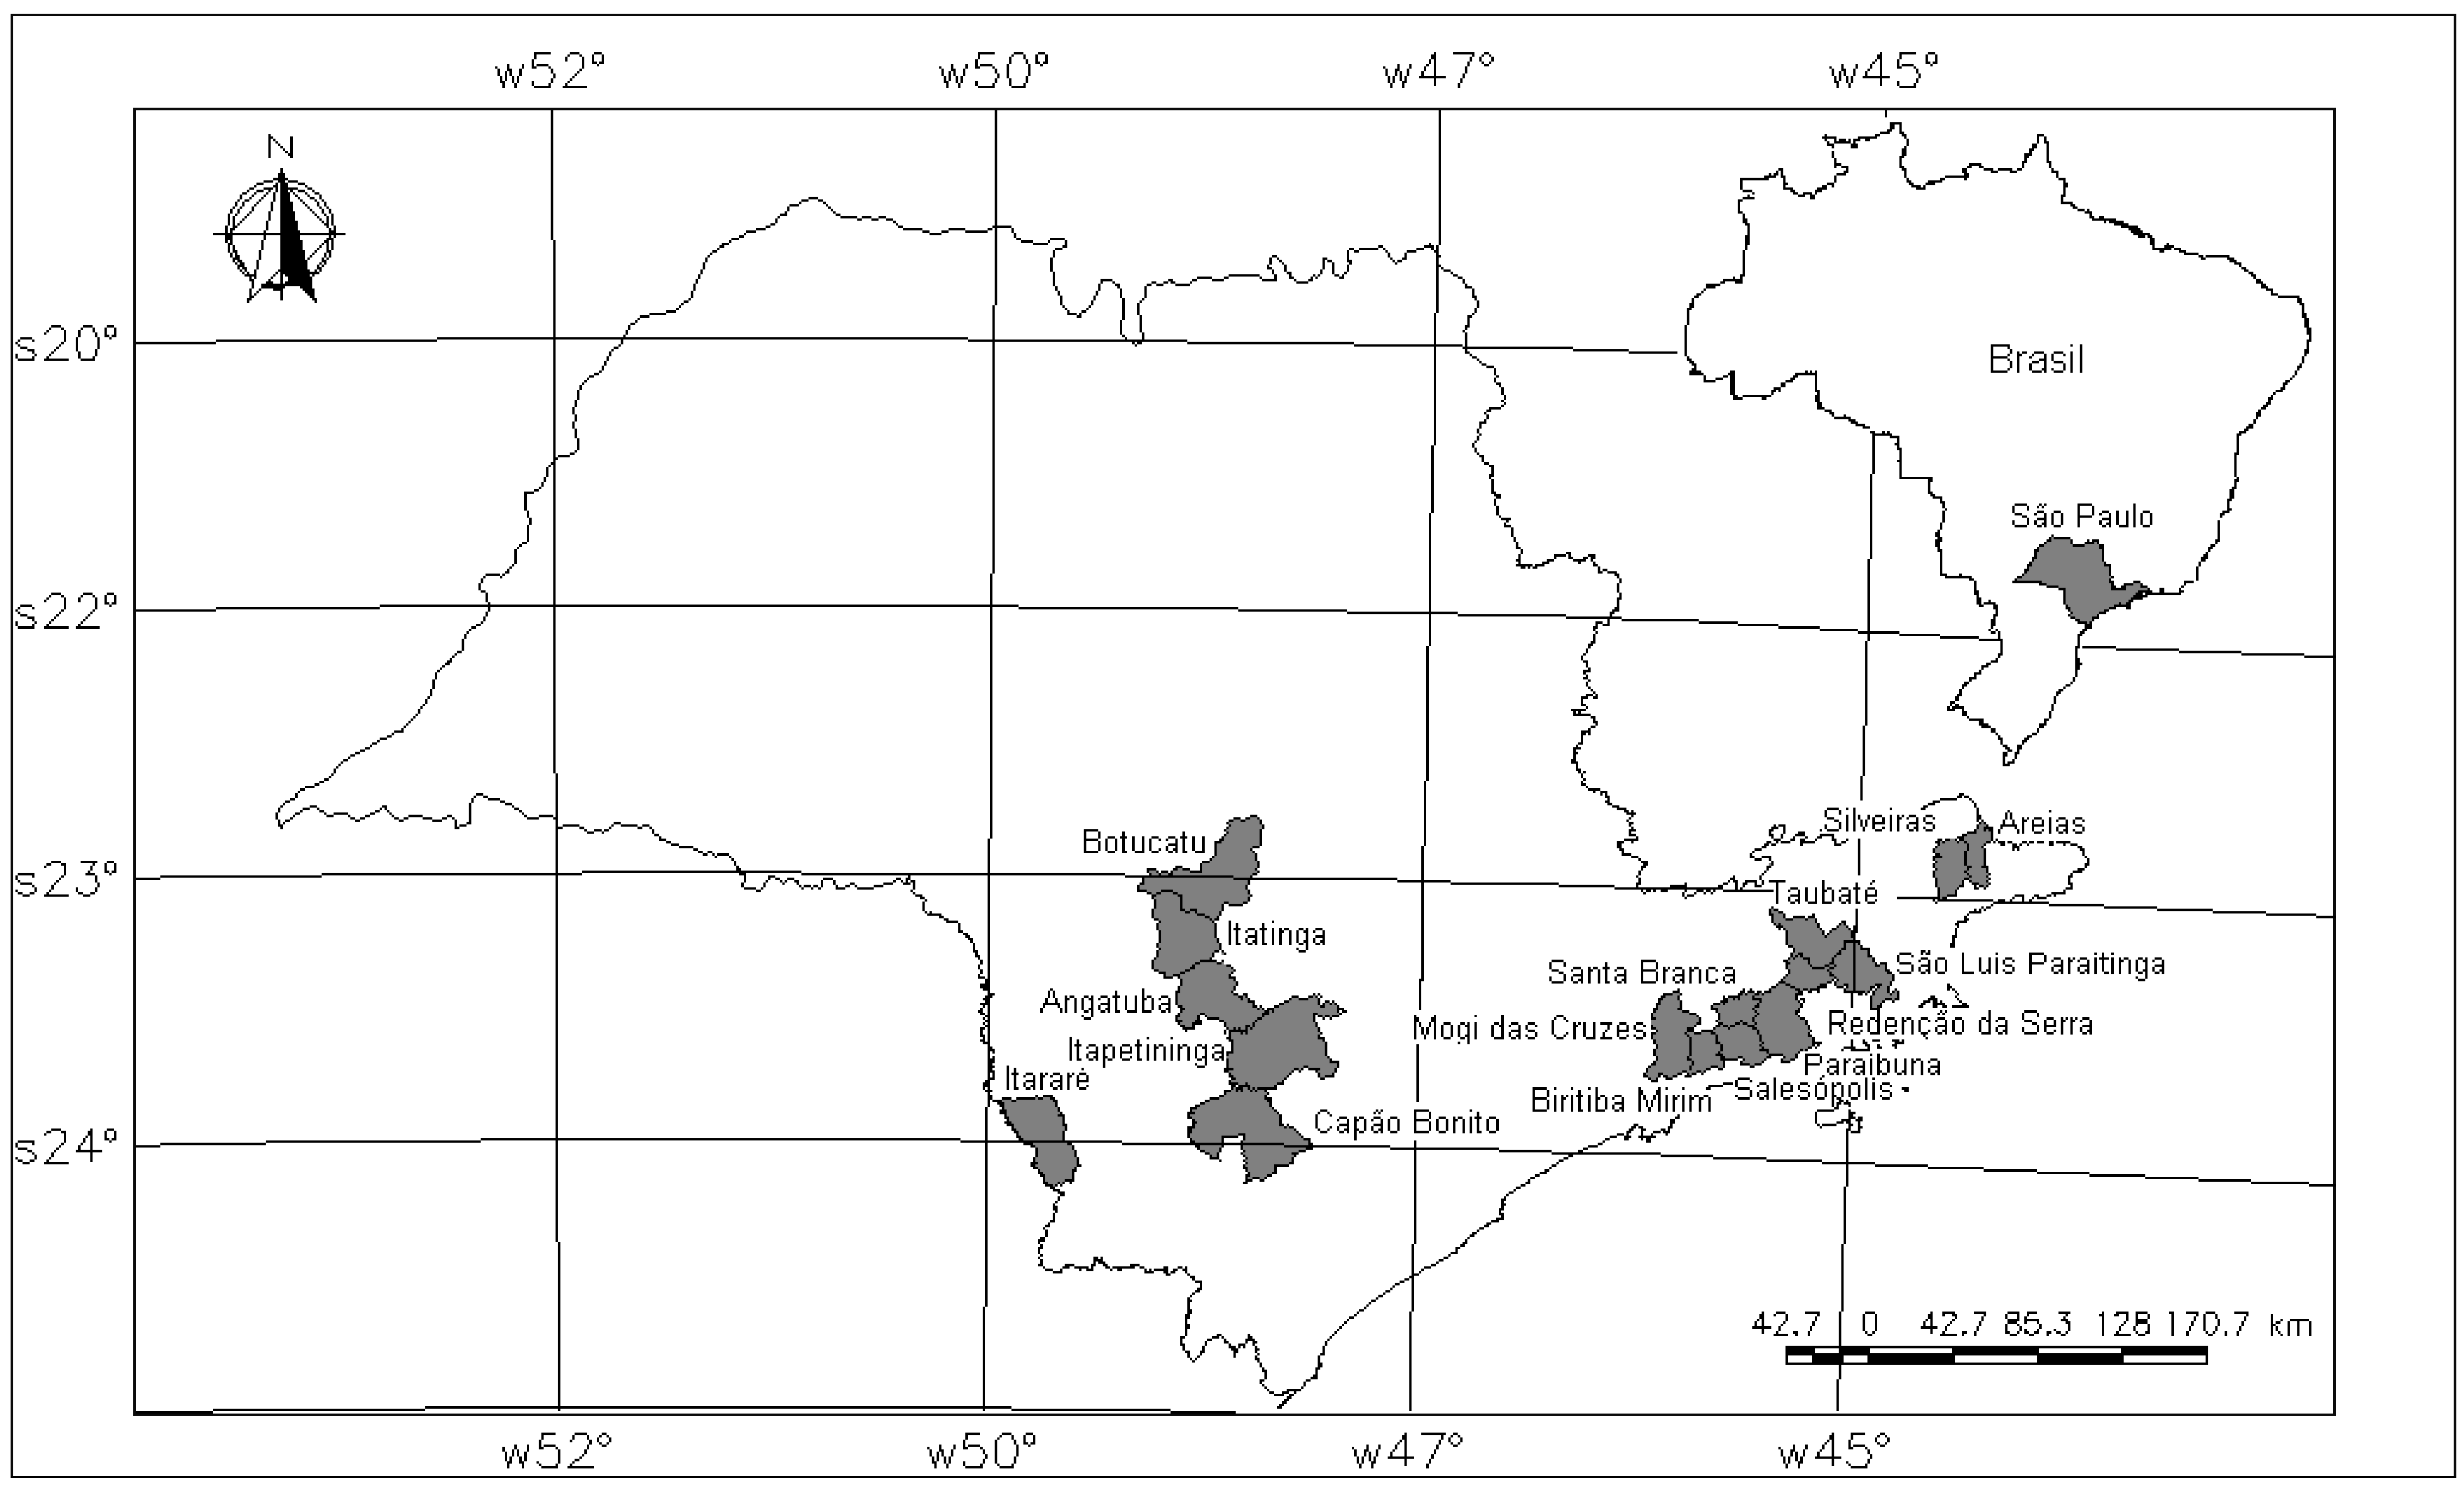
The state of São Paulo, located between 53°10′28″ and 43°52′0″W and 19°40′41″ and 25°07′42″S, has an area of 248,209 km
2. For the present study, the municipalities of the state that contained areas with
Eucalyptus plantations in terrain with undulating topography were selected (
Figure 1).
Figure 1.
Location of study areas in the state of São Paulo.
Figure 1.
Location of study areas in the state of São Paulo.
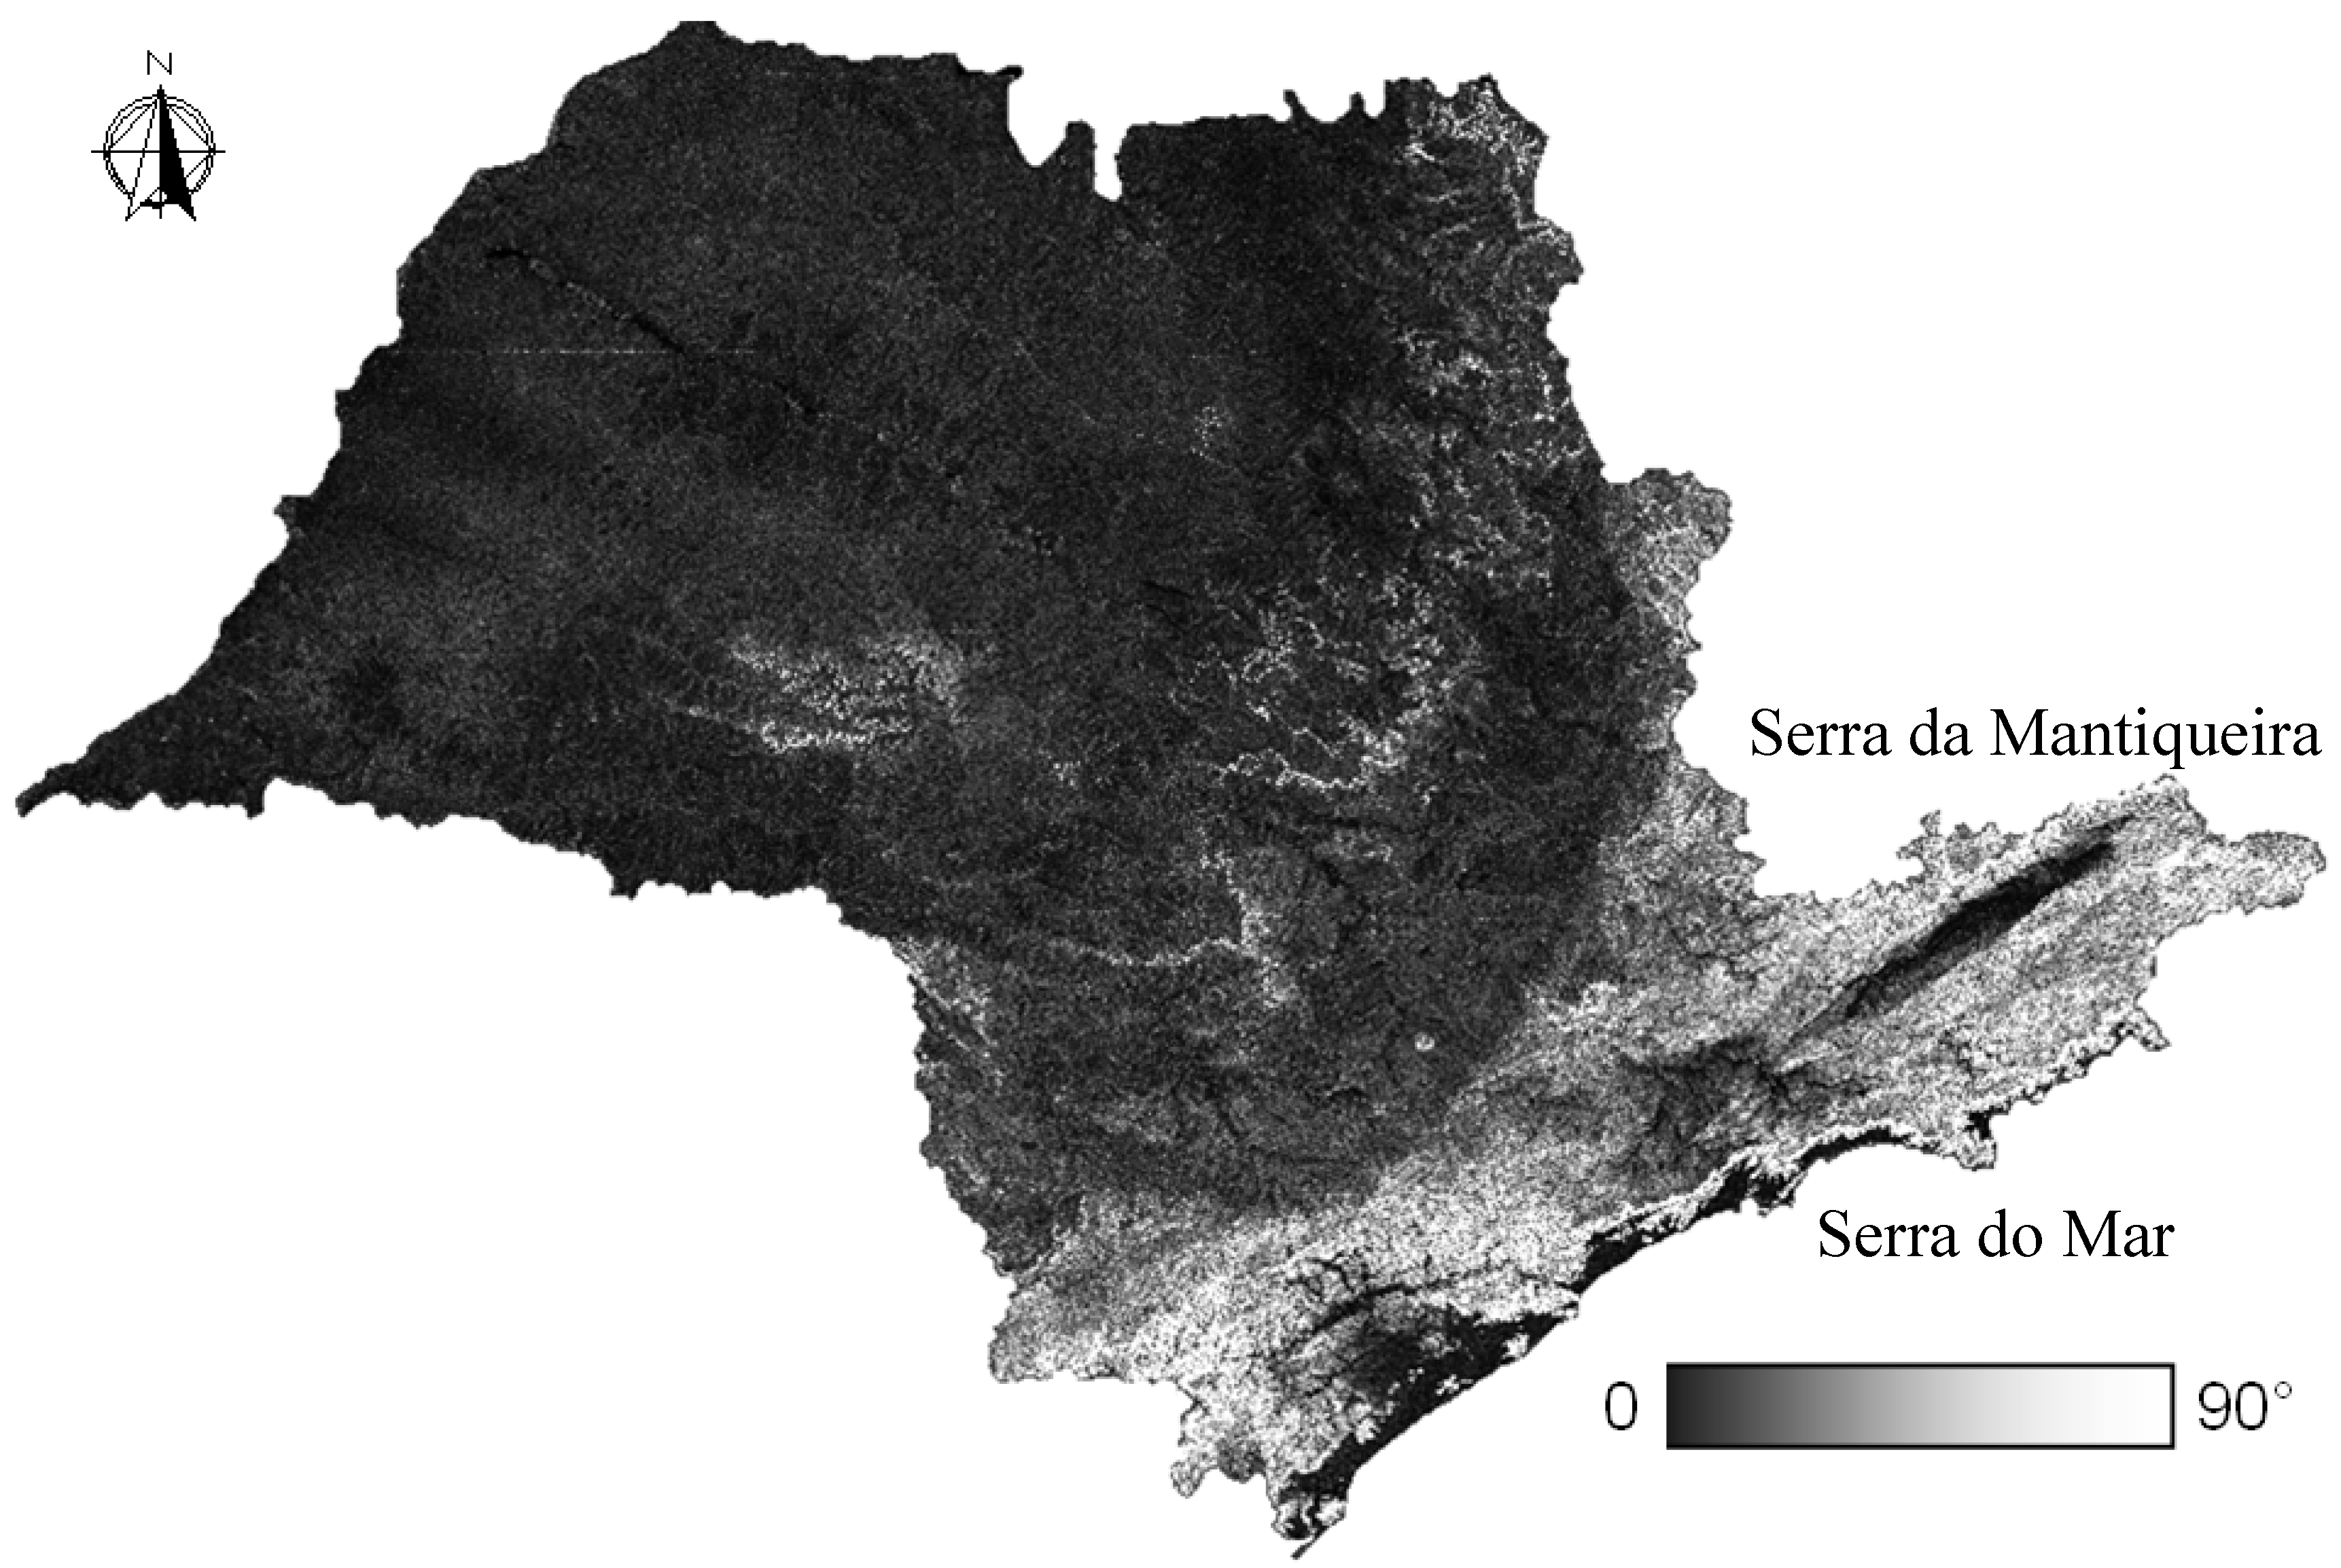
The western part of the state of São Paulo is located on a 600 km long plateau. The Serra do Mar, with abrupt scarps, is located between this plateau and the coastal plain. The Serra da Mantiqueira, also showing scarps in some places, is located in the northeastern part of the state, on the border with the state of Minas Gerais (
Figure 2). The climate is varied: tropical in the northern region, tropical with altitude near the Serra do Mar and Serra da Mantiqueira and sub-tropical in the south. The average annual temperature is approximately 20 °C, and the average rainfall is 1,500 mm/year.
Figure 2.
Slope of the state of São Paulo.
Figure 2.
Slope of the state of São Paulo.
2.1. Data Collection
Initially, a database incorporating all of the information relevant to the study was created, including geological, geomorphological, soil, topographic and climatic data as well as the satellite images used for mapping areas with Eucalyptus plantations. The data were collected for the entire state and, subsequently, only the selected areas were evaluated.
SPRING (Geo-Referenced Information Processing) software [
23] was used for this study because it offers a database option, a series of image processing functions, thematic data manipulation, numerical terrain modeling, storage and retrieval of spatial data with attribute tables, modeling and the use of networks and spatial analyses. SPRING, developed by the National Institute of Space Research, is public domain and can be acquired free of charge at
www.dpi.inpe.br/spring.
Geological data at a 1:750,000 scale were obtained from the Brazilian Geological Survey, available on the website of the CPRM (Research and Mineral Resources Company:
www.cprm.gov.br). A geomorphological map, at a 1:1,000,000 scale, was acquired from the IPT (Technology Research Institute) [
24]. A soil map at a 1:500,000 scale was acquired from the IAC (Agronomic Institute of Campinas) [
25]. Topographical data were obtained from the Topodata website (
www.dsr.inpe.br/topodata), where the original data from the SRTM (Shuttle Radar Topography Mission) were processed within the scope of Topodata [
26] for the derivation of geomorphometrical variables, including slope (zenith angle) and vertical and horizontal curvatures.
Historical climate data were obtained from the IAC (
www.ciiagro.sp.gov.br) and INMET (National Institute of Meteorology) [
27], which together have represented 103 sites in the state of São Paulo for a period of approximately 25 years. The monthly average rainfall data from all sites were entered into the database and, subsequently, two distinct periods were defined: a rainy season (December, January and February) and a dry season (June, July and August), and the average rainfall for each period was calculated. The individual data were spatialized for the whole state by means of interpolation (weighted average) and then were sliced into classes (every 50 mm), thereby generating two thematic maps: one for the rainy season and the other for the dry season.
To identify the different developmental stages of
Eucalyptus plantations, Landsat TM 5 satellite images [
28] for three years (2006, 2007 and 2008, one image per year) were used (
Table 1). The images were geo-referenced using the Geocover images available on the INPE Image Processing Division website (
www.dpi.inpe.br/geocover) as the basis and were then inserted into the database. The average image registration error was less than 1 pixel, that is, less than 30 m.
Table 1.
Path/row and dates of passage of the Landsat/TM5 satellite.
Table 1.
Path/row and dates of passage of the Landsat/TM5 satellite.
| Orbits/Points | Dates of Passage |
|---|
| 2006 | 2007 | 2008 |
|---|
| 218/76 | 21 July | 25 August | 12 September |
| 219/76 | 14 September | 16 August | 18 August |
| 220/76 | 9 May | 20 August | 10 September |
| 220/77 | 5 September | 20 June | 25 August |
| 221/77 | 12 September | 29 July | 28 May |
In Brazil, the majority of
Eucalyptus plantations are made from clones that have been genetically improved for the climate and edaphic conditions of the planting location. The
Eucalyptus cultivation cycle lasts an average of 7 years, and 3 rotations are possible with the same clone. The year 2008 was adopted as the mapping basis, whereas the other two years (2006 and 2007) were used for a temporal study of the plantations. Thus, it was possible to identify three development stages: adult
Eucalyptus, young
Eucalyptus and new
Eucalyptus and/or exposed soil (
Figure 3). These three stages were selected due to the limitations to the identification of targets via remote sensing. The map was generated through automatic image classification, and manual editing was used to correct some areas with mistakes in classification. The procedure adopted for this study was that adopted by Kronka
et al. [
29], where areas of reforestation throughout the state of São Paulo were mapped using satellite images. The areas occupied by
Eucalyptus plantations in 16 selected municipalities are presented in
Table 2 as well as their percentages of the municipalities’ areas.
The presence or absence of vegetation is one of the factors that define the stability of slopes. In general, the less vegetation cover that is present on a slope, the greater its susceptibility to mass movements. Vegetation protects the soil from factors that can accelerate landslides by intercepting rainwater, reducing its kinetic energy and promoting the infiltration of water into the soil. Soil without vegetation becomes more susceptible to soil compaction due to the impact of raindrops and the consequent increase in runoff, which also leads to erosion. The volume of material removed and transported by rainwater is related to the density of vegetation cover and the steepness of the hillside, so that with the removal of vegetation, these processes become more intense, especially in locations with steeper slopes [
30].
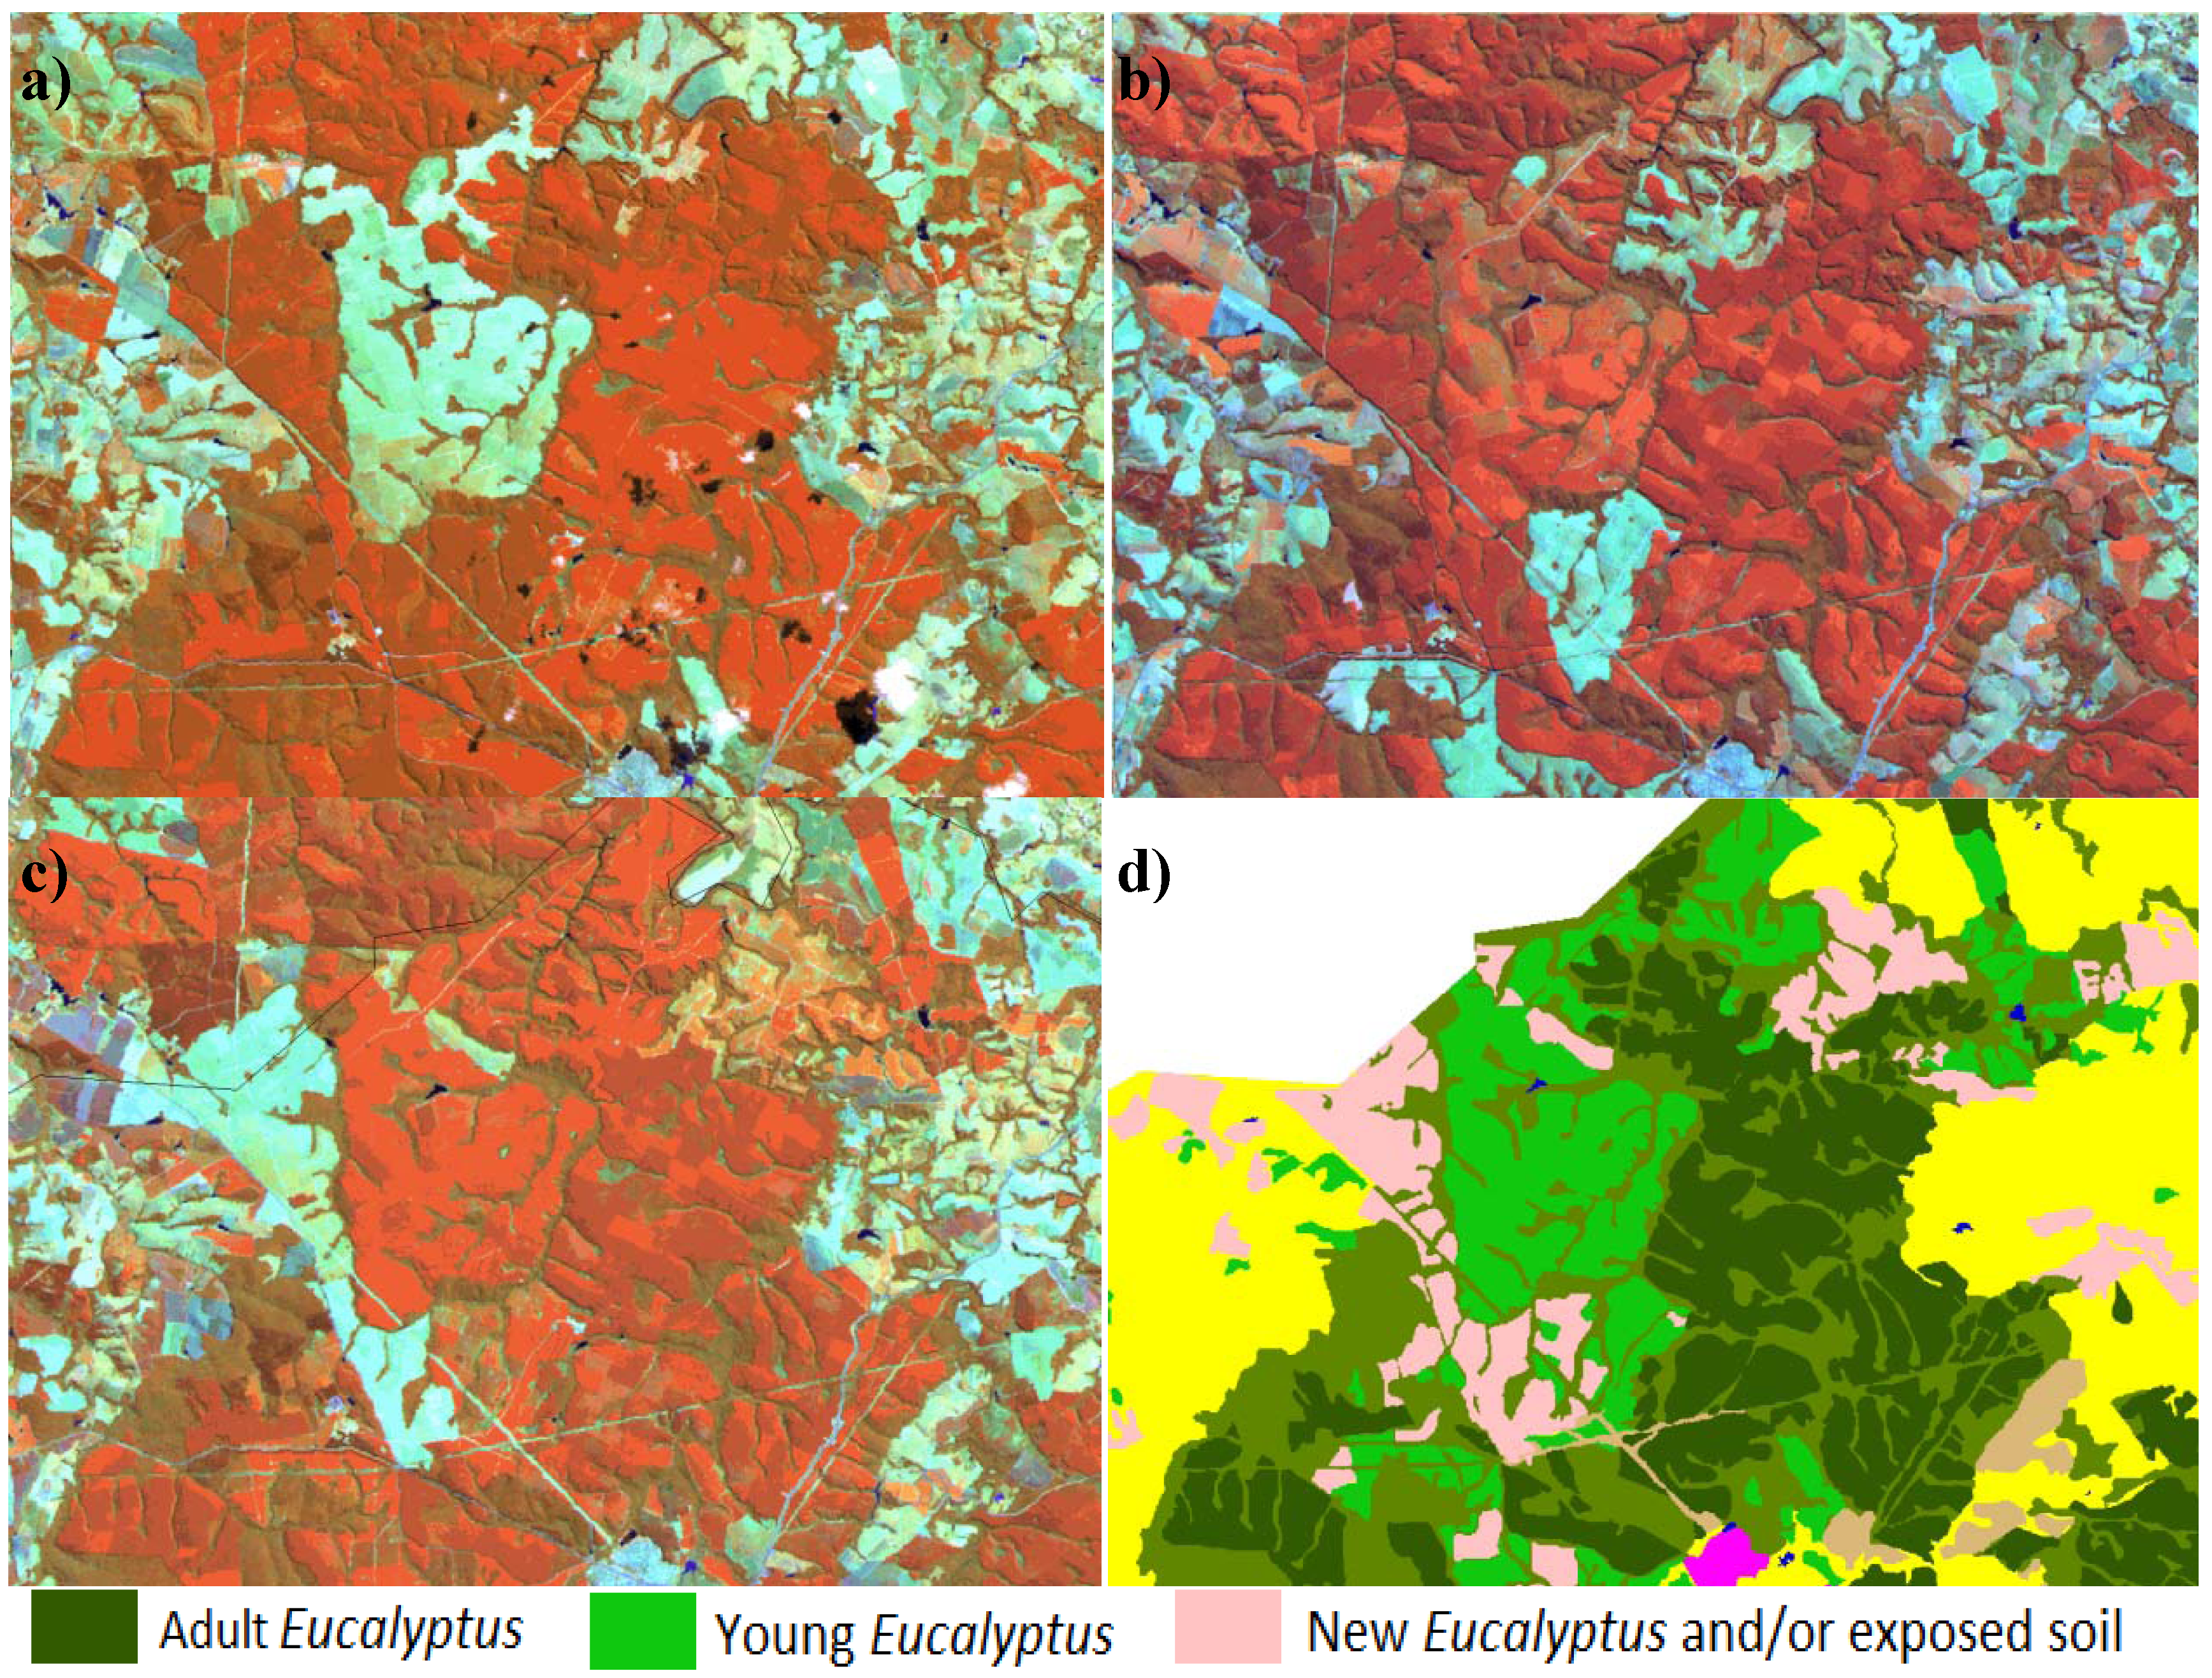
Figure 3.
The different stages of the Eucalyptus cycle in remote sensing images. (a) Color composition RGB 543 year 2006; (b) year 2007; (c) year 2008; (d) cycles of Eucalyptus mapped.
Figure 3.
The different stages of the Eucalyptus cycle in remote sensing images. (a) Color composition RGB 543 year 2006; (b) year 2007; (c) year 2008; (d) cycles of Eucalyptus mapped.
Table 2.
Quantification of areas with Eucalyptus in the studied municipalities.
Table 2.
Quantification of areas with Eucalyptus in the studied municipalities.
| Municipality | Area Occupied by
Eucalyptus (ha) | % of Municipality Area |
|---|
| Angatuba | 19,427 | 18.86 |
| Areias | 1,336 | 4.27 |
| Biritiba Mirim | 5,236 | 16.53 |
| Botucatu | 20,414 | 13.74 |
| Capão Bonito | 32,110 | 19.59 |
| Itapetininga | 15,034 | 8.38 |
| Itararé | 11,641 | 11.62 |
| Itatinga | 33,776 | 34.45 |
| Mogi das Cruzes | 6,841 | 9.36 |
| Paraibuna | 12,216 | 14.93 |
| Redenção da Serra | 3,393 | 10.92 |
| Salesópolis | 10,090 | 23.47 |
| Santa Branca | 5,014 | 18.06 |
| São Luís do Paraitinga | 5,988 | 9.55 |
| Silveiras | 3,300 | 7.89 |
| Taubaté | 3,694 | 5.89 |
| TOTAL | 188,795 | 14.75 |
In two of the successional stages of Eucalyptus, the early one observed in the plantations and the one at the stage called “young”, approximately 2 to 3 years of age, there is a large quantity of leaf biomass, but the soil is still vulnerable, due to the absence of understory or the complete blockage of sunlight. In the adult phase of Eucalyptus, the quantity of leaf biomass decreases, allowing sunlight to reach the ground and the understory to develop, which reduces the soil’s vulnerability.
For the other land uses and land cover classes present in the state, the map generated by Vieira
et al. [
31] was used. This map included other projects developed at INPE (National Institute for Space Research) such as the CANASAT (
www.dsr.inpe.br/mapdsr) for sugarcane mapping purposes (in this study, the sugarcane was reclassified as agriculture) and SOS Mata Atlântica (
www.sosmatatlantica.org.br), where all of the remnants of natural forest of the Mata Atlantica were mapped. Therefore, the final map of the state of São Paulo includes the following classes: forest, pasture, urban area, agriculture, adult
Eucalyptus, young
Eucalyptus and new
Eucalyptus and/or exposed soil.
Due to the different scales associated with the various datasets considered in this work, the results refer to a scale compatible with the smallest scale of the input data, i.e., 1:1,000,000 which is equivalent to a 500 m pixel.
2.2. Generation of Weighted Maps
Before producing the susceptibility maps, the thematic maps related to landslide susceptibility must be weighted. The weights vary from 0 to 1, where 0 indicates classes with no relationship to landslide occurrence and 1 indicates classes with a high relationship to landslides. This weighting transforms the thematic maps onto a numerical grid, in which each class of map receives a weight (from 0 to 1).
Table 3 displays the susceptibility values for all classes present in the different themes addressed in this study.
For the geological data, the work of Crepani
et al. [
32], which evaluated the relationships of different types of rock with landslides, was considered as the basis for the weighting. Igneous rocks had the lowest landslide probabilities, and intermediate metamorphic and sedimentary rocks had a lower resistance to weathering,
i.e., a greater landslide probability.
The geomorphological units presented in the study area were defined by Ponçano
et al. [
24], and the assigned weights were based on the terrain, dissection and slope shapes present for each geomorphological class. For the different soil types, the weights were based on the premise that soils with a higher amount of sand tend to be more susceptible than soils with more clay. These weights were also based on the study of Crepani
et al. [
32].
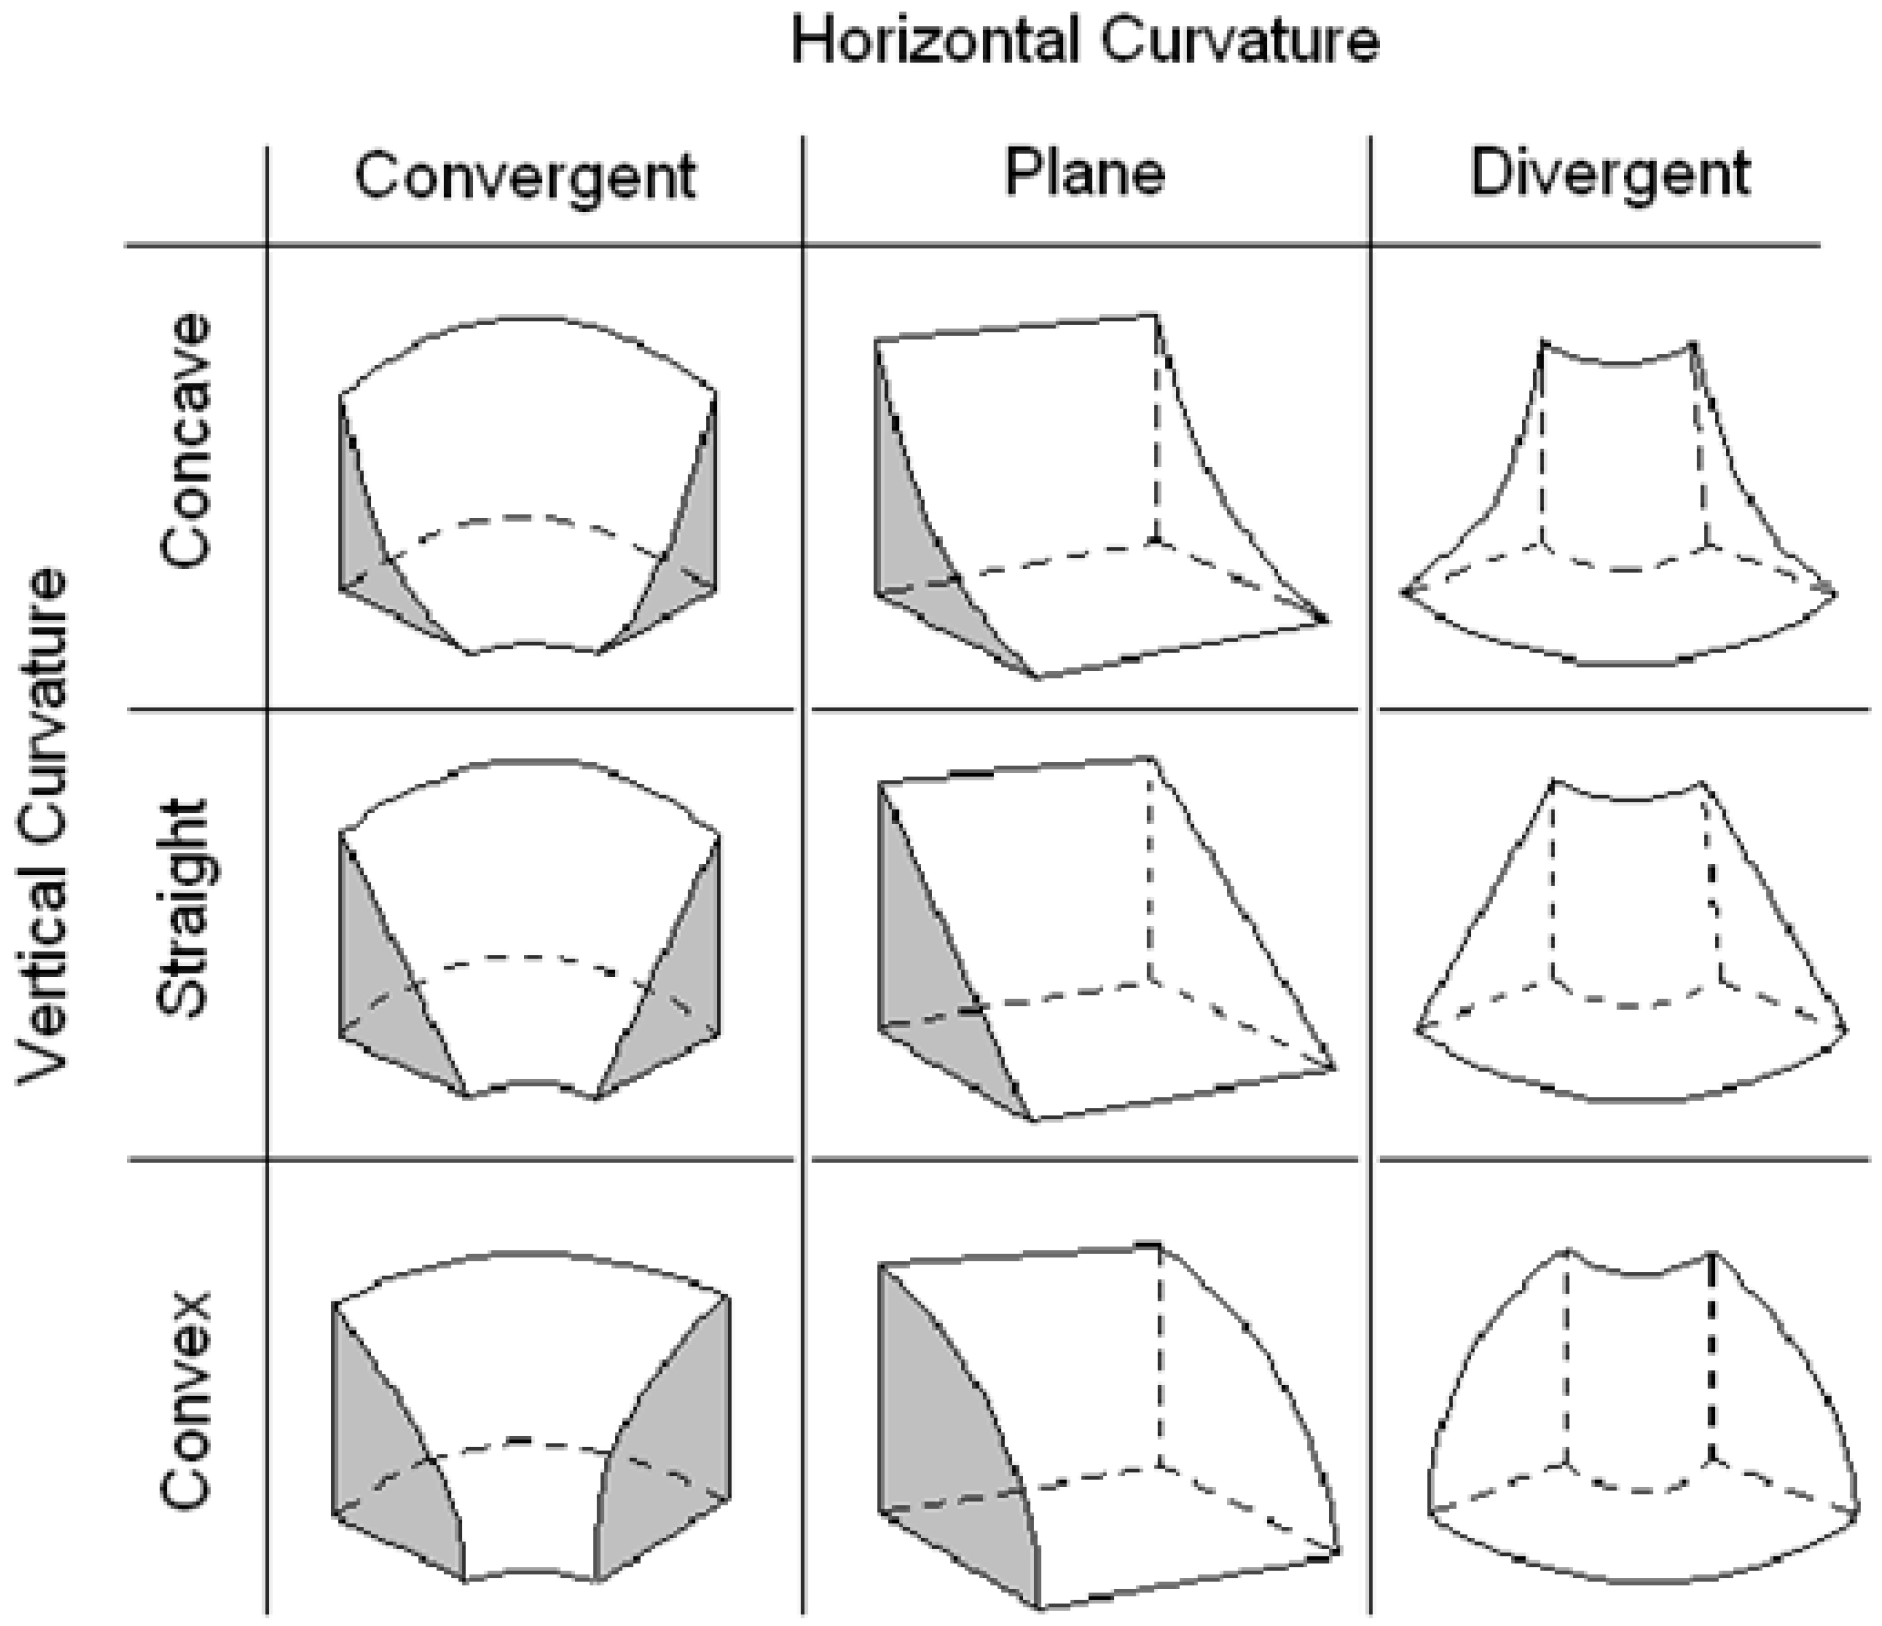
The topography was addressed through horizontal and vertical curvatures and the slope. The horizontal curvature refers to the divergent/convergent character of flows of matter on the ground when analyzed on a horizontal projection (
Figure 4). This curvature is related to the processes of migration and accumulation of water, minerals and organic matter in soil caused by gravity, and plays an important role in the resulting water balance and pedogenesis process [
33].
Concave areas are more susceptible to landslides than convex areas, receiving the highest weights in the susceptibility table. Terrain with convergent profiles presents a higher risk of sliding incidents than divergent profiles, thus receiving higher susceptibility weights [
7] (
Table 3). The slope map was divided into 5 classes in accordance with those suggested by Binda and Bertotti [
34] and Kanungo
et al. [
14], with weights attributed to each slope class.
Table 3.
.Collected data and their weights in relation to landslide susceptibility.
Table 3.
.Collected data and their weights in relation to landslide susceptibility.
| Theme | | Weight | Theme | | Weight |
|---|
| Geology | Typeofrocks | | SoilClass | Acronym | |
| Igneous | | Haplic Cambisols | CX | 0.8 |
| Rhyolite, granite, | 0.37 | Melanic Gleisol | GM | 1.0 |
| dacite | | | Yellow Latosol | LA | 0.4 |
| Granodiorite, quartz, | 0.40 | Red Latosol | LV | 0.4 |
| diorite | | | Red-yellow Latosol | LVA | 0.4 |
| Migmatite, gneiss | 0.43 | Red Nitosol | NV | 0.7 |
| Phonolite, syenite | 0.47 | Mesic Organosol | OU | 1.0 |
| Metamorphics | | Red-yellow Argisol | PVA | 0.7 |
| Mylonites, quartz | 0.57 | Lithic Neosol | RL | 1.0 |
| muscovite, biotite | | Quartzarenic Neosol | RQ | 1.0 |
| Staurolite schist, | 0.67 | Urban | URB | 1.0 |
| schists garnetiferous | | | | |
| Phyllite, metasiltstone | 0.70 | Slope | Class | |
| Marble | | 0.77 | Higher than | Mountainous | 1.0 |
| Quartz sandstone | 0.80 | 45° | | |
| Conglomerate | 0.83 | 20 to 45° | Heavy undulation | 0.8 |
| Siltstones, mudstones | 0.90 | 8 to 20° | Undulation | 0.5 |
| Shales | | 0.93 | 3 to 8° | Smooth undulation | 0.3 |
| Limestone, dolomite | 0.97 | 0 to 3° | Plane | 0.2 |
| Sedimentary | | | | |
| Sediments | | 1.0 | VerticalCurvature | |
| Unconsolidated: | | Very Convex | 0.5 |
| alluvium, colluvium | | Convex | | 0.3 |
| | | Flat | | 0.2 |
| RainfallIntensity (mm/month) | Concave | | 0.8 |
| 0–50 | | 0.37 | Very Concave | 1.0 |
| 50–75 | | 0.40 | | | |
| 75–100 | | 0.43 | HorizontalCurvature | |
| 100–125 | | 0.47 | Very Divergent | 0.5 |
| 125–150 | | 0.50 | Divergent | | 0.3 |
| 150–175 | | 0.53 | Flat | | 0.2 |
| 175–200 | | 0.57 | Convergent | | 0.8 |
| 200–225 | | 0.60 | Very Convergent | 1.0 |
| 225–250 | | 0.63 | | | |
| 250–275 | | 0.67 | Landuse | | |
| 275–300 | | 0.70 | Agriculture | | 0.8 |
| 300–325 | | 0.73 | Urban Area | | 1.0 |
| | | Adult Eucalyptus | 0.5 |
| | | Young Eucalyptus | 0.7 |
| | | New Eucalyptus /soil exposed | 1.0 |
| | | Forest | | 0.4 |
| | | | Pasture | | 0.7 |
| Geomorphology | Class | | | | |
| Reliefs of Aggradation/Continentals | Flood plain | 0.10 | | | |
| Relief of degradation in dissected plateaus/hill relief | Tabular Landforms | 0.31 | | | |
| Broad Hills | 0.32 | | | |
| Medium Hills | 0.36 | | | |
| Small Hills with Local Ridges | 0.34 | | | |
| Parallel Small Hills | 0.35 | | | |
| Small Isolated Hills | 0.33 | | | |
| Relief of degradation in dissected plateaus/Relief of hills with smoothed hillside | Elongated Hills | 0.42 | | | |
| Relief of degradation in dissected plateaus/Small hill relief | Low Small Hills | 0.51 | | | |
| Elongated Parallel Small Hills Alongados Paralelos | 0.54 | | | |
| Elongated Small Hills and Ridges | 0.53 | | | |
| Relief of degradation in dissected plateaus/hill relief | Side slopes | 0.64 | | | |
| Parallel hills | 0.65 | | | |
| Hills with Restricted Mountains | 0.66 | | | |
| Relief of degradation in dissected plateaus/Mountainous relief | Elongated Mountains | 0.71 | | | |
| Mountains with deep valleys | 0.73 | | | |
| Residual relief supported by individual lithologies/Sustained by massive basaltic plateaus | Basaltic tables | 0.81 | | | |
| Transitional relief/Scarp | Scarp | 1.00 | | | |
| | Scarp with Ridges | 1.00 | | | |
Figure 4.
Vertical and horizontal curvatures and their terrain combinations.
Figure 4.
Vertical and horizontal curvatures and their terrain combinations.
The volume of material removed and transported by rainwater is related to the density of vegetation cover and the slope declivity, and with vegetation removal, these processes become more intense, especially in areas with steep slopes [
30]. The weights assigned to each land use class depend on the type of vegetation coverage. The young stage of
Eucalyptus plantations, approximately 3 to 4 years old, has a large amount of leaf biomass, but the soil is still susceptible due to the absence of an understory resulting from the complete blocking of sunlight. However, in the adult stage, the amount of leaf biomass decreases, allowing sunlight to reach the soil and the understory to develop, which decreases the soil’s susceptibility.
The climatic thematic maps for the rainy and dry seasons were weighted using the criteria of Crepani
et al. [
32]. The landslide hazard increases substantially during the rainy season because rain is an erosive agent and a landside trigger. Thus, the greater the rainfall intensity, the higher the weight.
2.3. Generation of Susceptibility Maps
The eight themes of geology, land use and land cover, geomorphology, soil, slope, vertical and horizontal curvatures and rainfall intensity, were combined to generate a final susceptibility map using the fuzzy gamma operator.
The fuzzy operator was introduced by Zadeh [
35] and allows a more realistic treatment of imprecise and subjective data that are part of analyses of physical environments. Fuzzy logic is able to model real problems where uncertainties and inaccuracies are present [
36].
Inaccuracy limits, called fuzzy sets, admit partial pertinence and are mathematically defined, as if Z denoted an object space; however, the set A in Z is the set of ordered pairs (Equation (1)) [
36].
The pertinence function
![Ijgi 01 00209 i003]()
(z) is known as “the degree of membership of Z in A”. The fuzzy membership value must lie in the range from 0 to 1 and reflects the degree of certainty of membership. The fuzzy theory employs the idea of member functions and expresses the degree of membership with respect to some attribute, in this case landslide susceptibility.
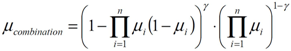
The fuzzy gamma operator consists of the product of the fuzzy algebraic sum and the fuzzy product. Equation (2) represents this operator.
where γ is a parameter within the range (0,1). The first term of the equation is named the fuzzy sum and the second term is the fuzzy product. When γ = 0, the fuzzy combination is equal to the product and when γ = 1, it is equal to the sum.
For Bonham-Carter [
37], the values in the range from 0 to 0.35 show a “diminutive” character,
i.e., they are always less than or equal to the smallest input fuzzy member; the values in the range from 0.8 to 1.0 have an “increasing” character, in which the output value will be equal to or greater than the value of the largest fuzzy member input values, and the range from 0.35 to 0.8 does not have an “increasing” or “diminutive” character.
Susceptibility maps were generated with values of gamma equal to 0.7 and 0.8 for each season (rainy and dry). These input values do not have a diminutive or increasing character and were used in works from Lee [
38], Pradhan
et al. [
39] and Pradhan [
40]. After the generation of maps, they were divided into susceptibility classes, as shown in
Table 4.
Table 4.
Ranges adopted in the slicing process.
Table 4.
Ranges adopted in the slicing process.
| Susceptibility Class | Range |
|---|
| Very Low | 0–0.2 |
| Low | 0.2–0.4 |
| Moderate | 0.4–0.6 |
| High | 0.6–0.8 |
| Very High | 0.8–1.0 |
Susceptibility maps were intersected with the land use map so that areas of
Eucalyptus could be evaluated and compared with other uses. For comparison, uncertainty maps were generated both for the dry season and for the rainy season, highlighting areas that maintained the classes in the two maps (gamma values of 0.7 and 0.8) and the areas that switched classes between maps, generating areas of uncertainty, in accordance with the suggestion by Meirelles
et al. [
41].
3. Results and Discussion
The land use and land cover map of the studied municipalities is presented below (
Figure 5). Approximately 33.3% of the total area is occupied by agriculture (4,266 km
2), 28.2% by pasture (3,608 km
2), 19.9% by forest (2,554 km
2), 7% by adult
Eucalyptus (897 km
2), 4.4% by young
Eucalyptus (568 km
2), 3.3% by new
Eucalyptus and/or exposed soil (423 km
2), 2% by surface water (257 km
2) and 1.6% by urban areas (212 km
2). These results show that almost 50% of the studied municipalities have some type of cropland (including reforestation of
Eucalyptus for commercial purposes).
Figure 5.
Land use and land cover map for the studied municipalities.
Figure 5.
Land use and land cover map for the studied municipalities.
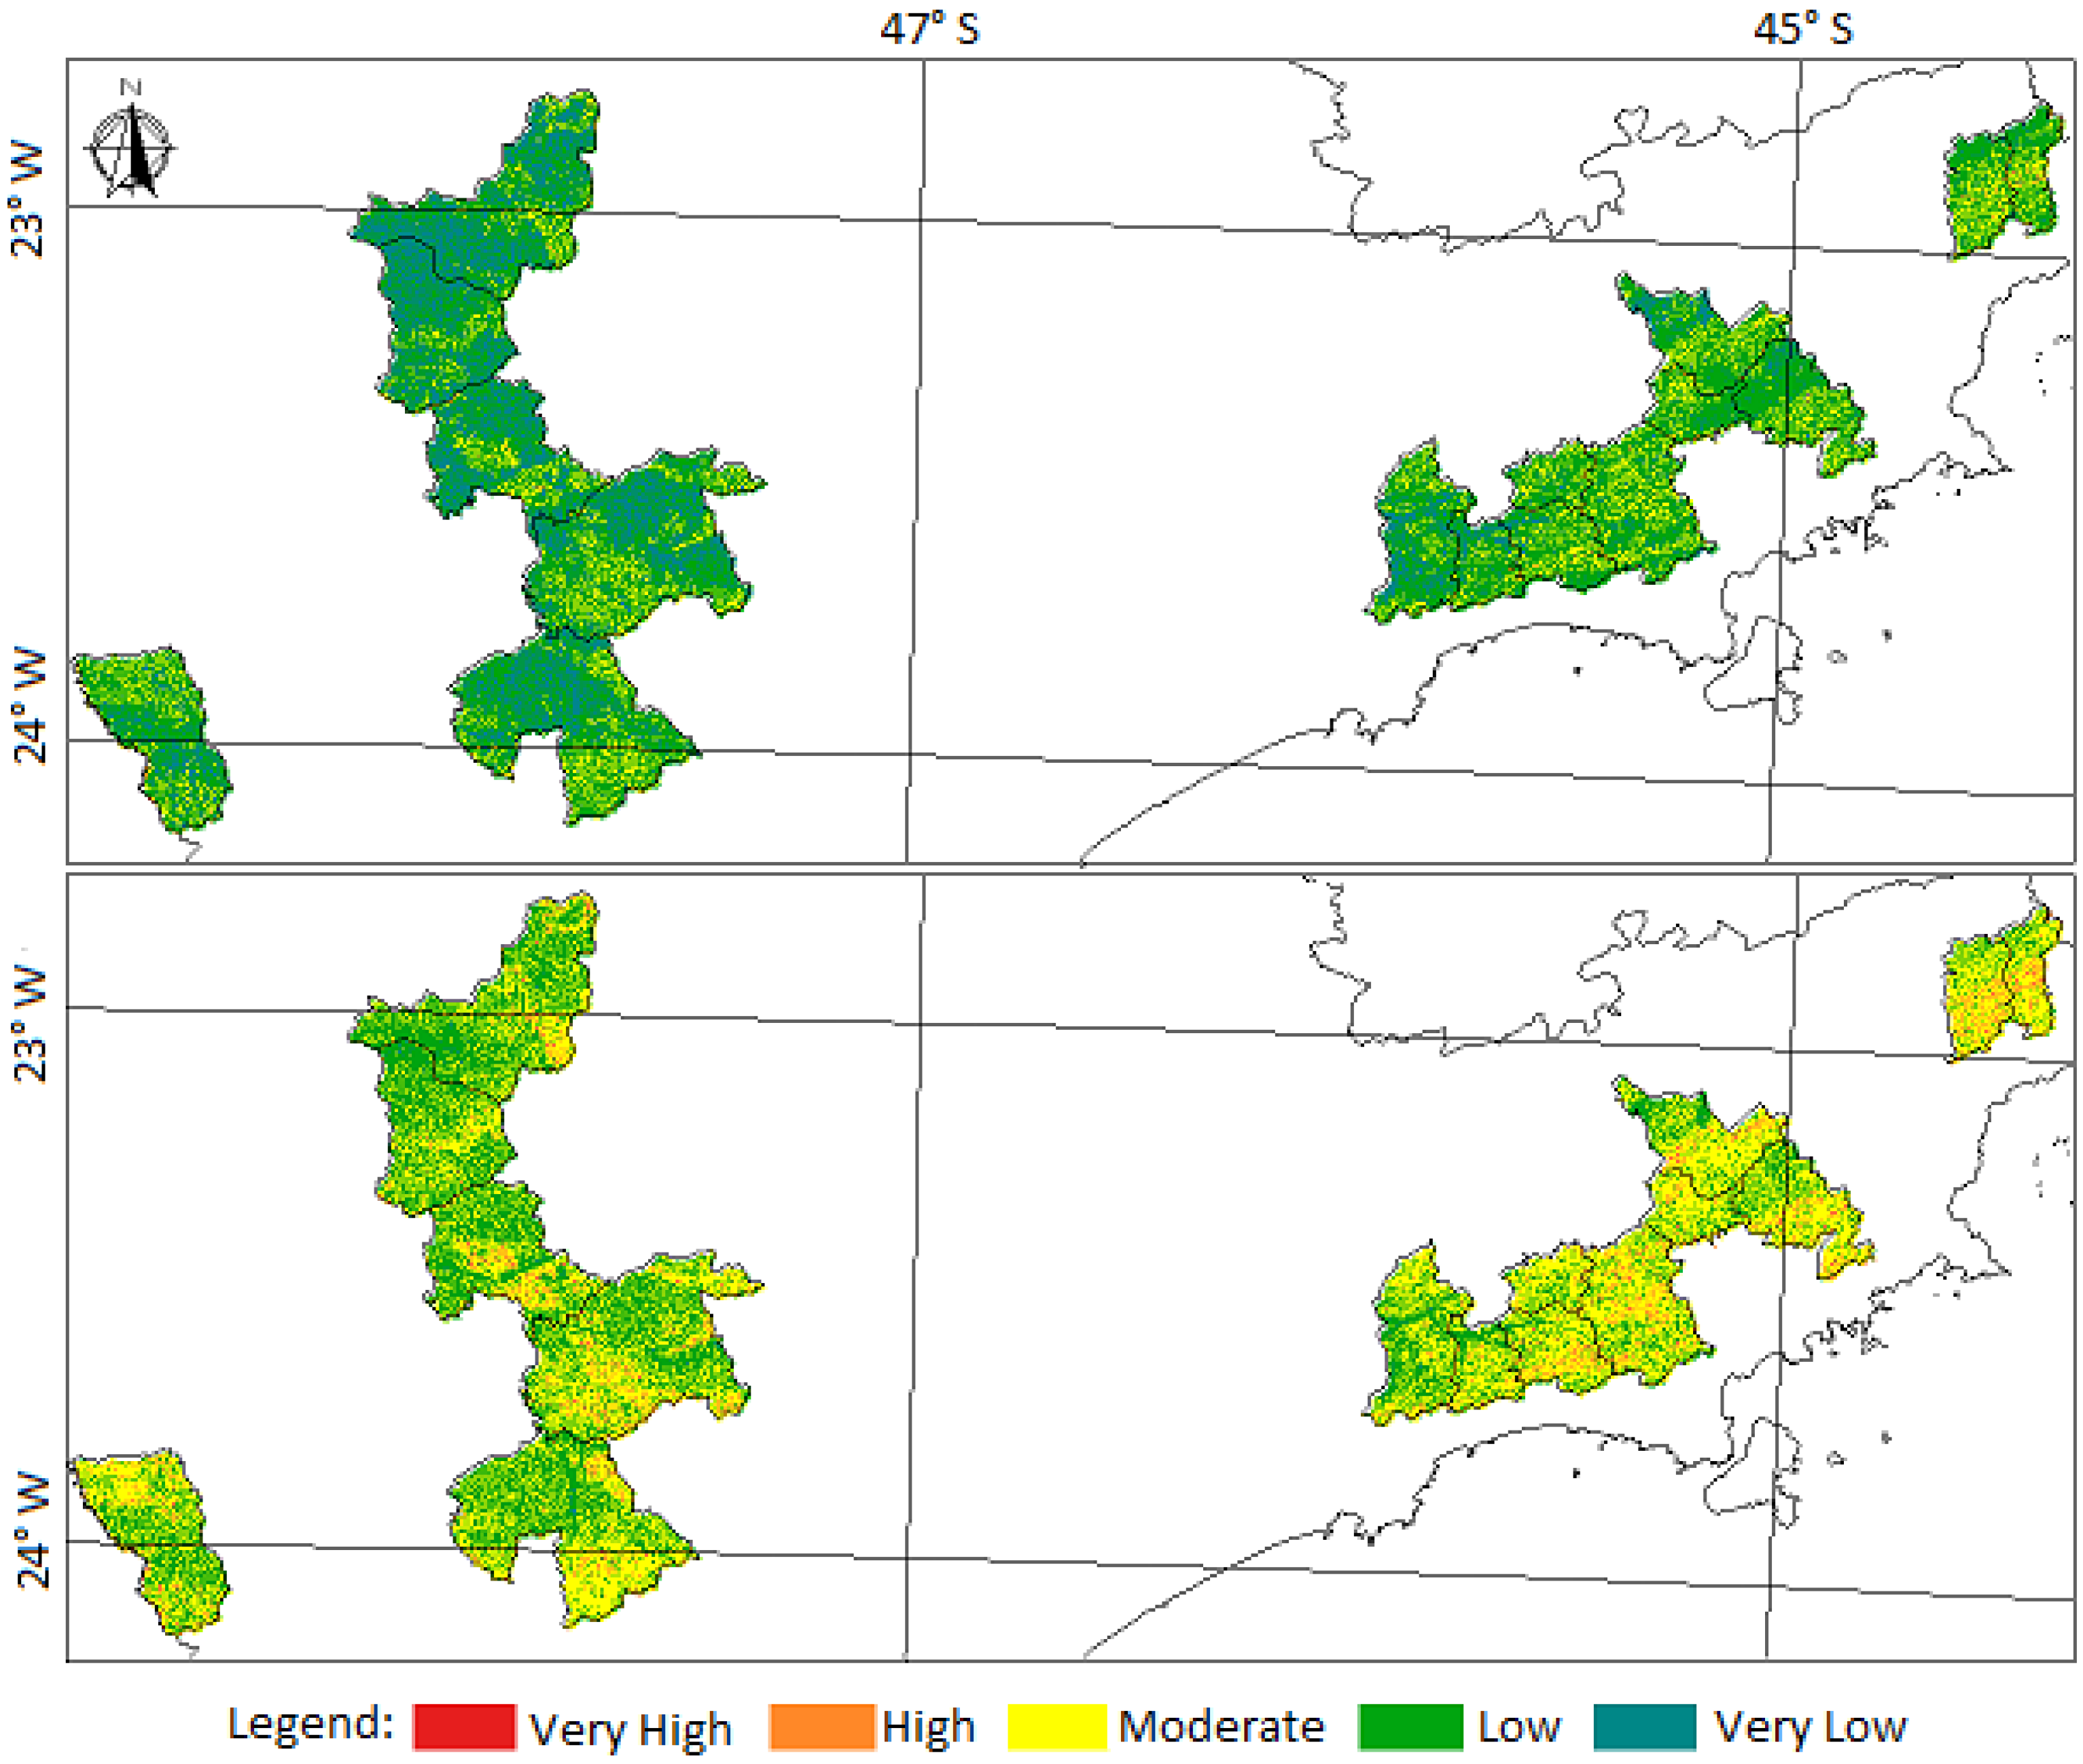
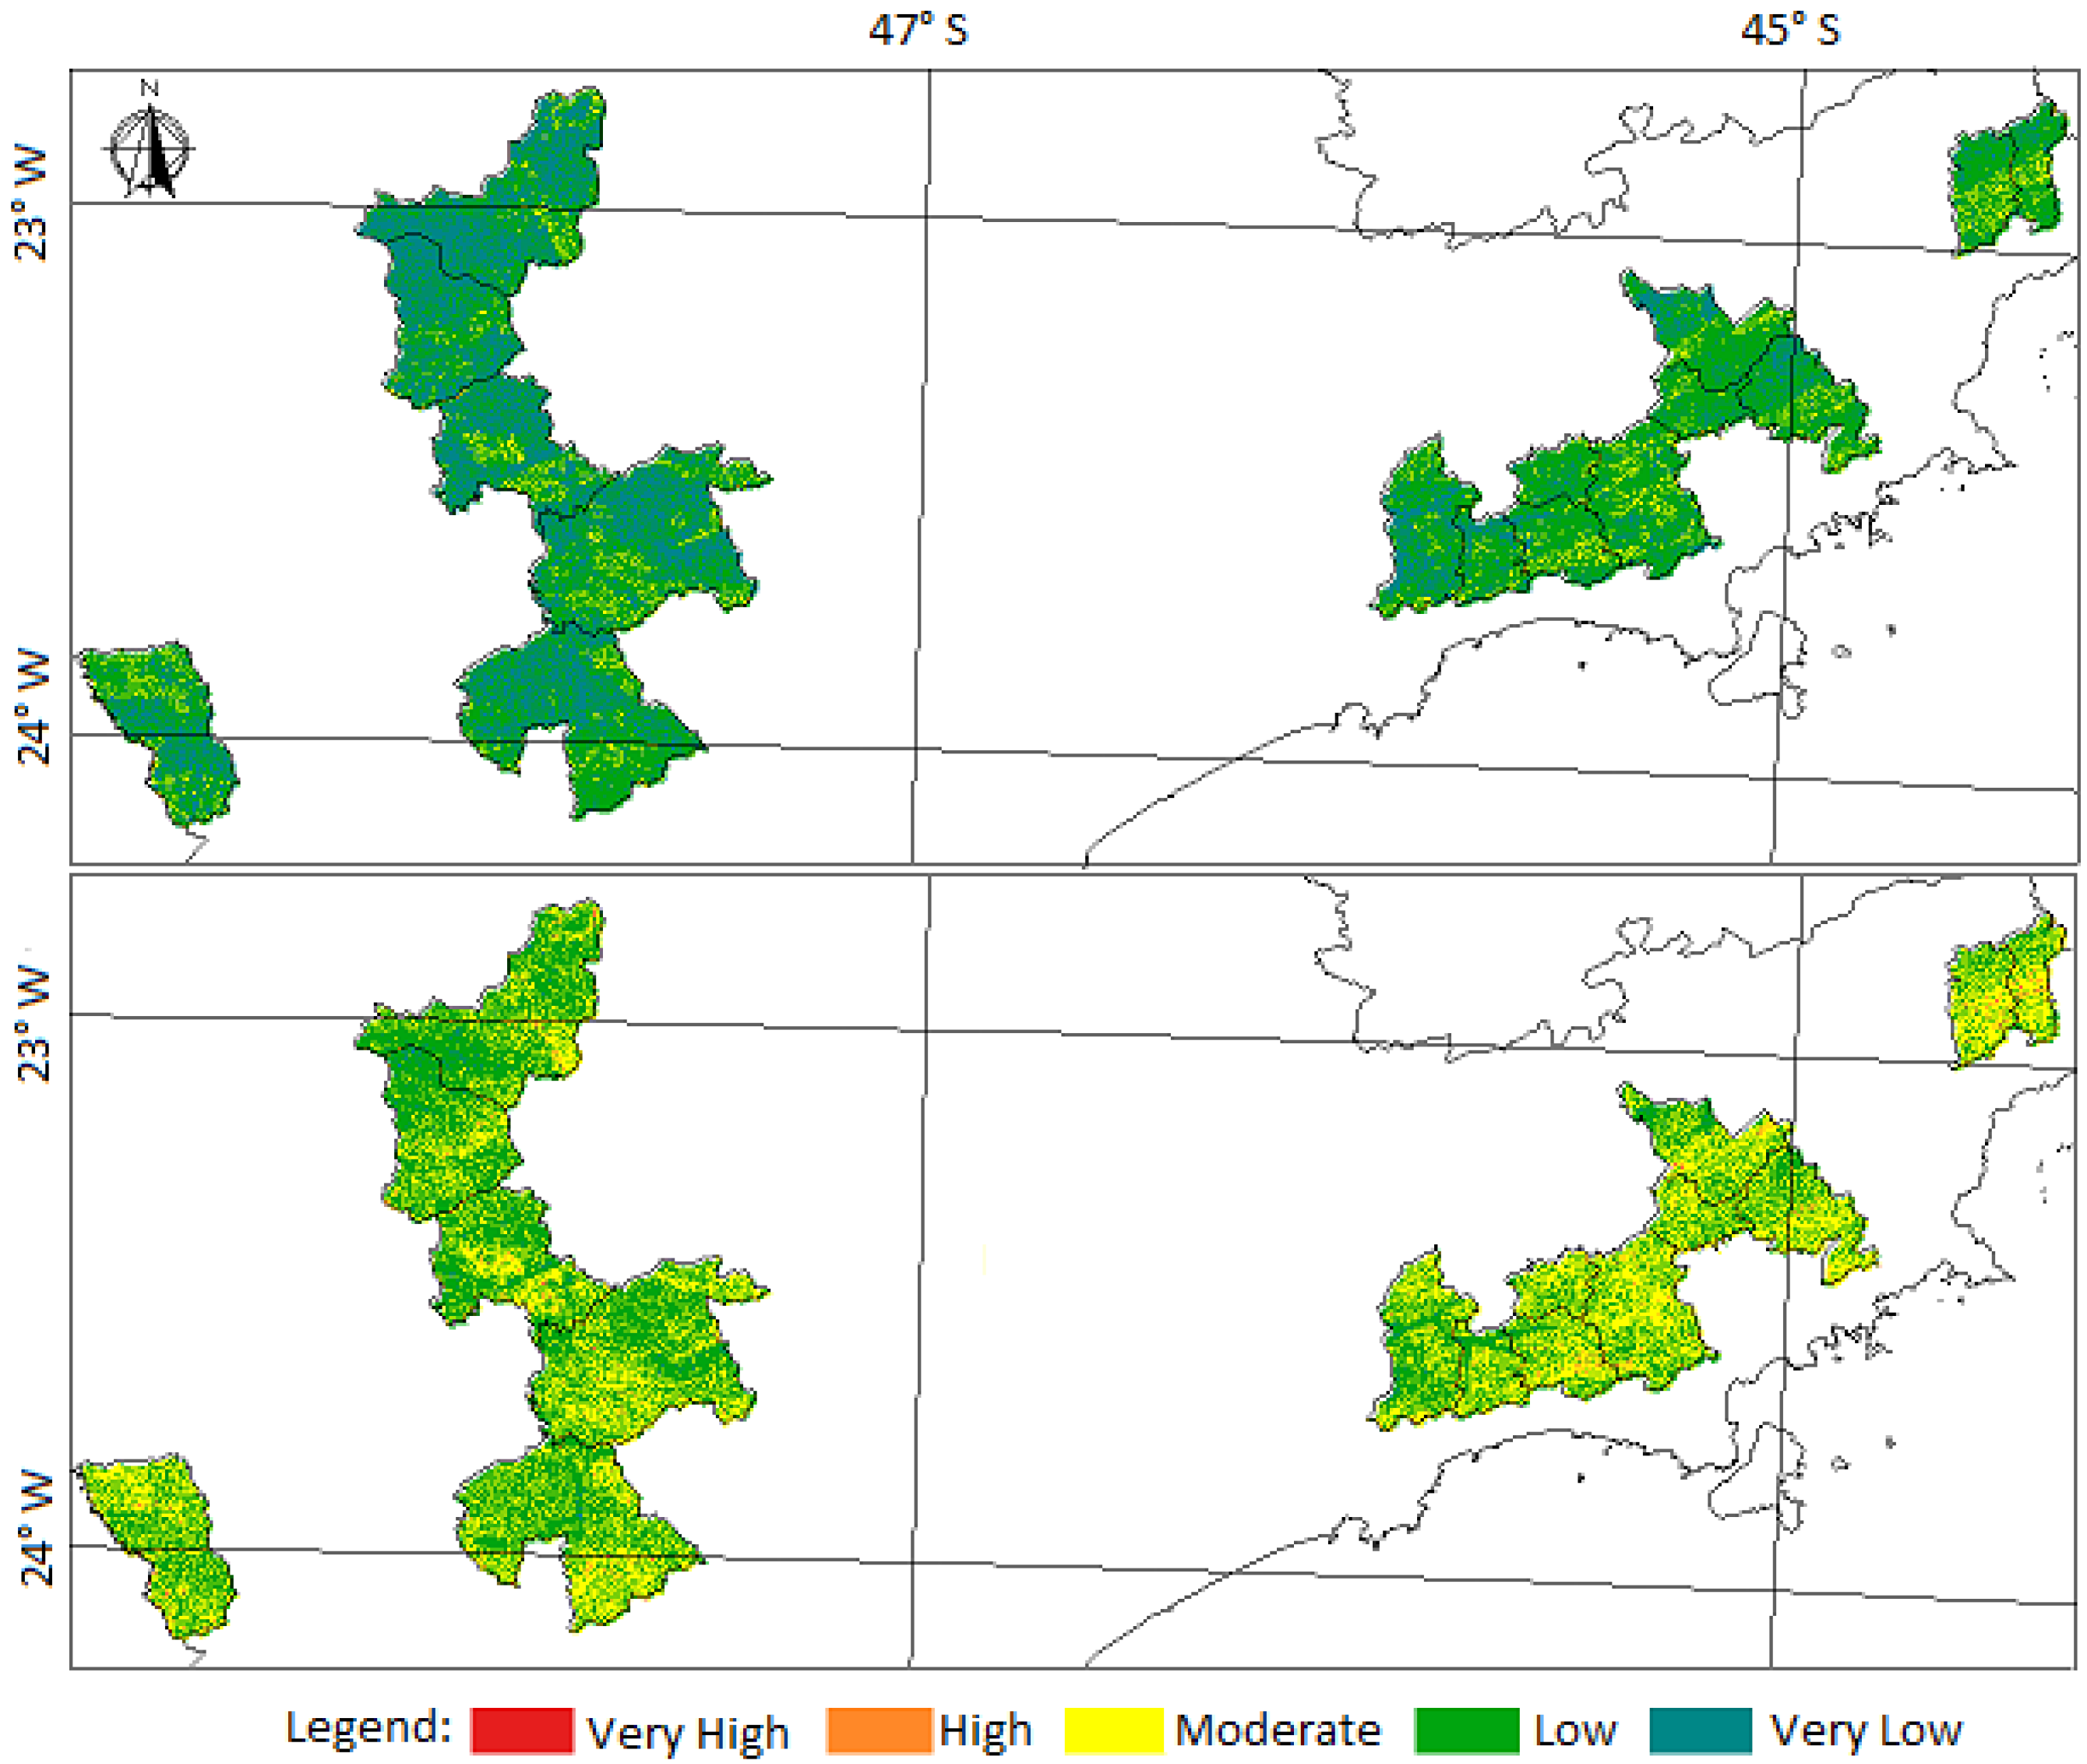
The maps generated for the dry period for gamma values equal to 0.7 and 0.8 are presented in
Figure 6. In the map generated with a gamma value equal to 0.7, the results show that 34% and 60% of the area was classified with very low and low susceptibility, respectively, whereas 5% of the study area had moderate susceptibility. In the map generated with a gamma value equal to 0.8, only 5% of the area was classified with very low susceptibility and 55% and 42% were classified as low and moderate susceptibility, respectively. The dry period, with lower values of precipitation, tends to exhibit a lower susceptibility to landslides.
Figure 6.
Landslide susceptibility map for the studied municipalities for the dry period with values of gamma = 0.7 (above) and 0.8 (below).
Figure 6.
Landslide susceptibility map for the studied municipalities for the dry period with values of gamma = 0.7 (above) and 0.8 (below).
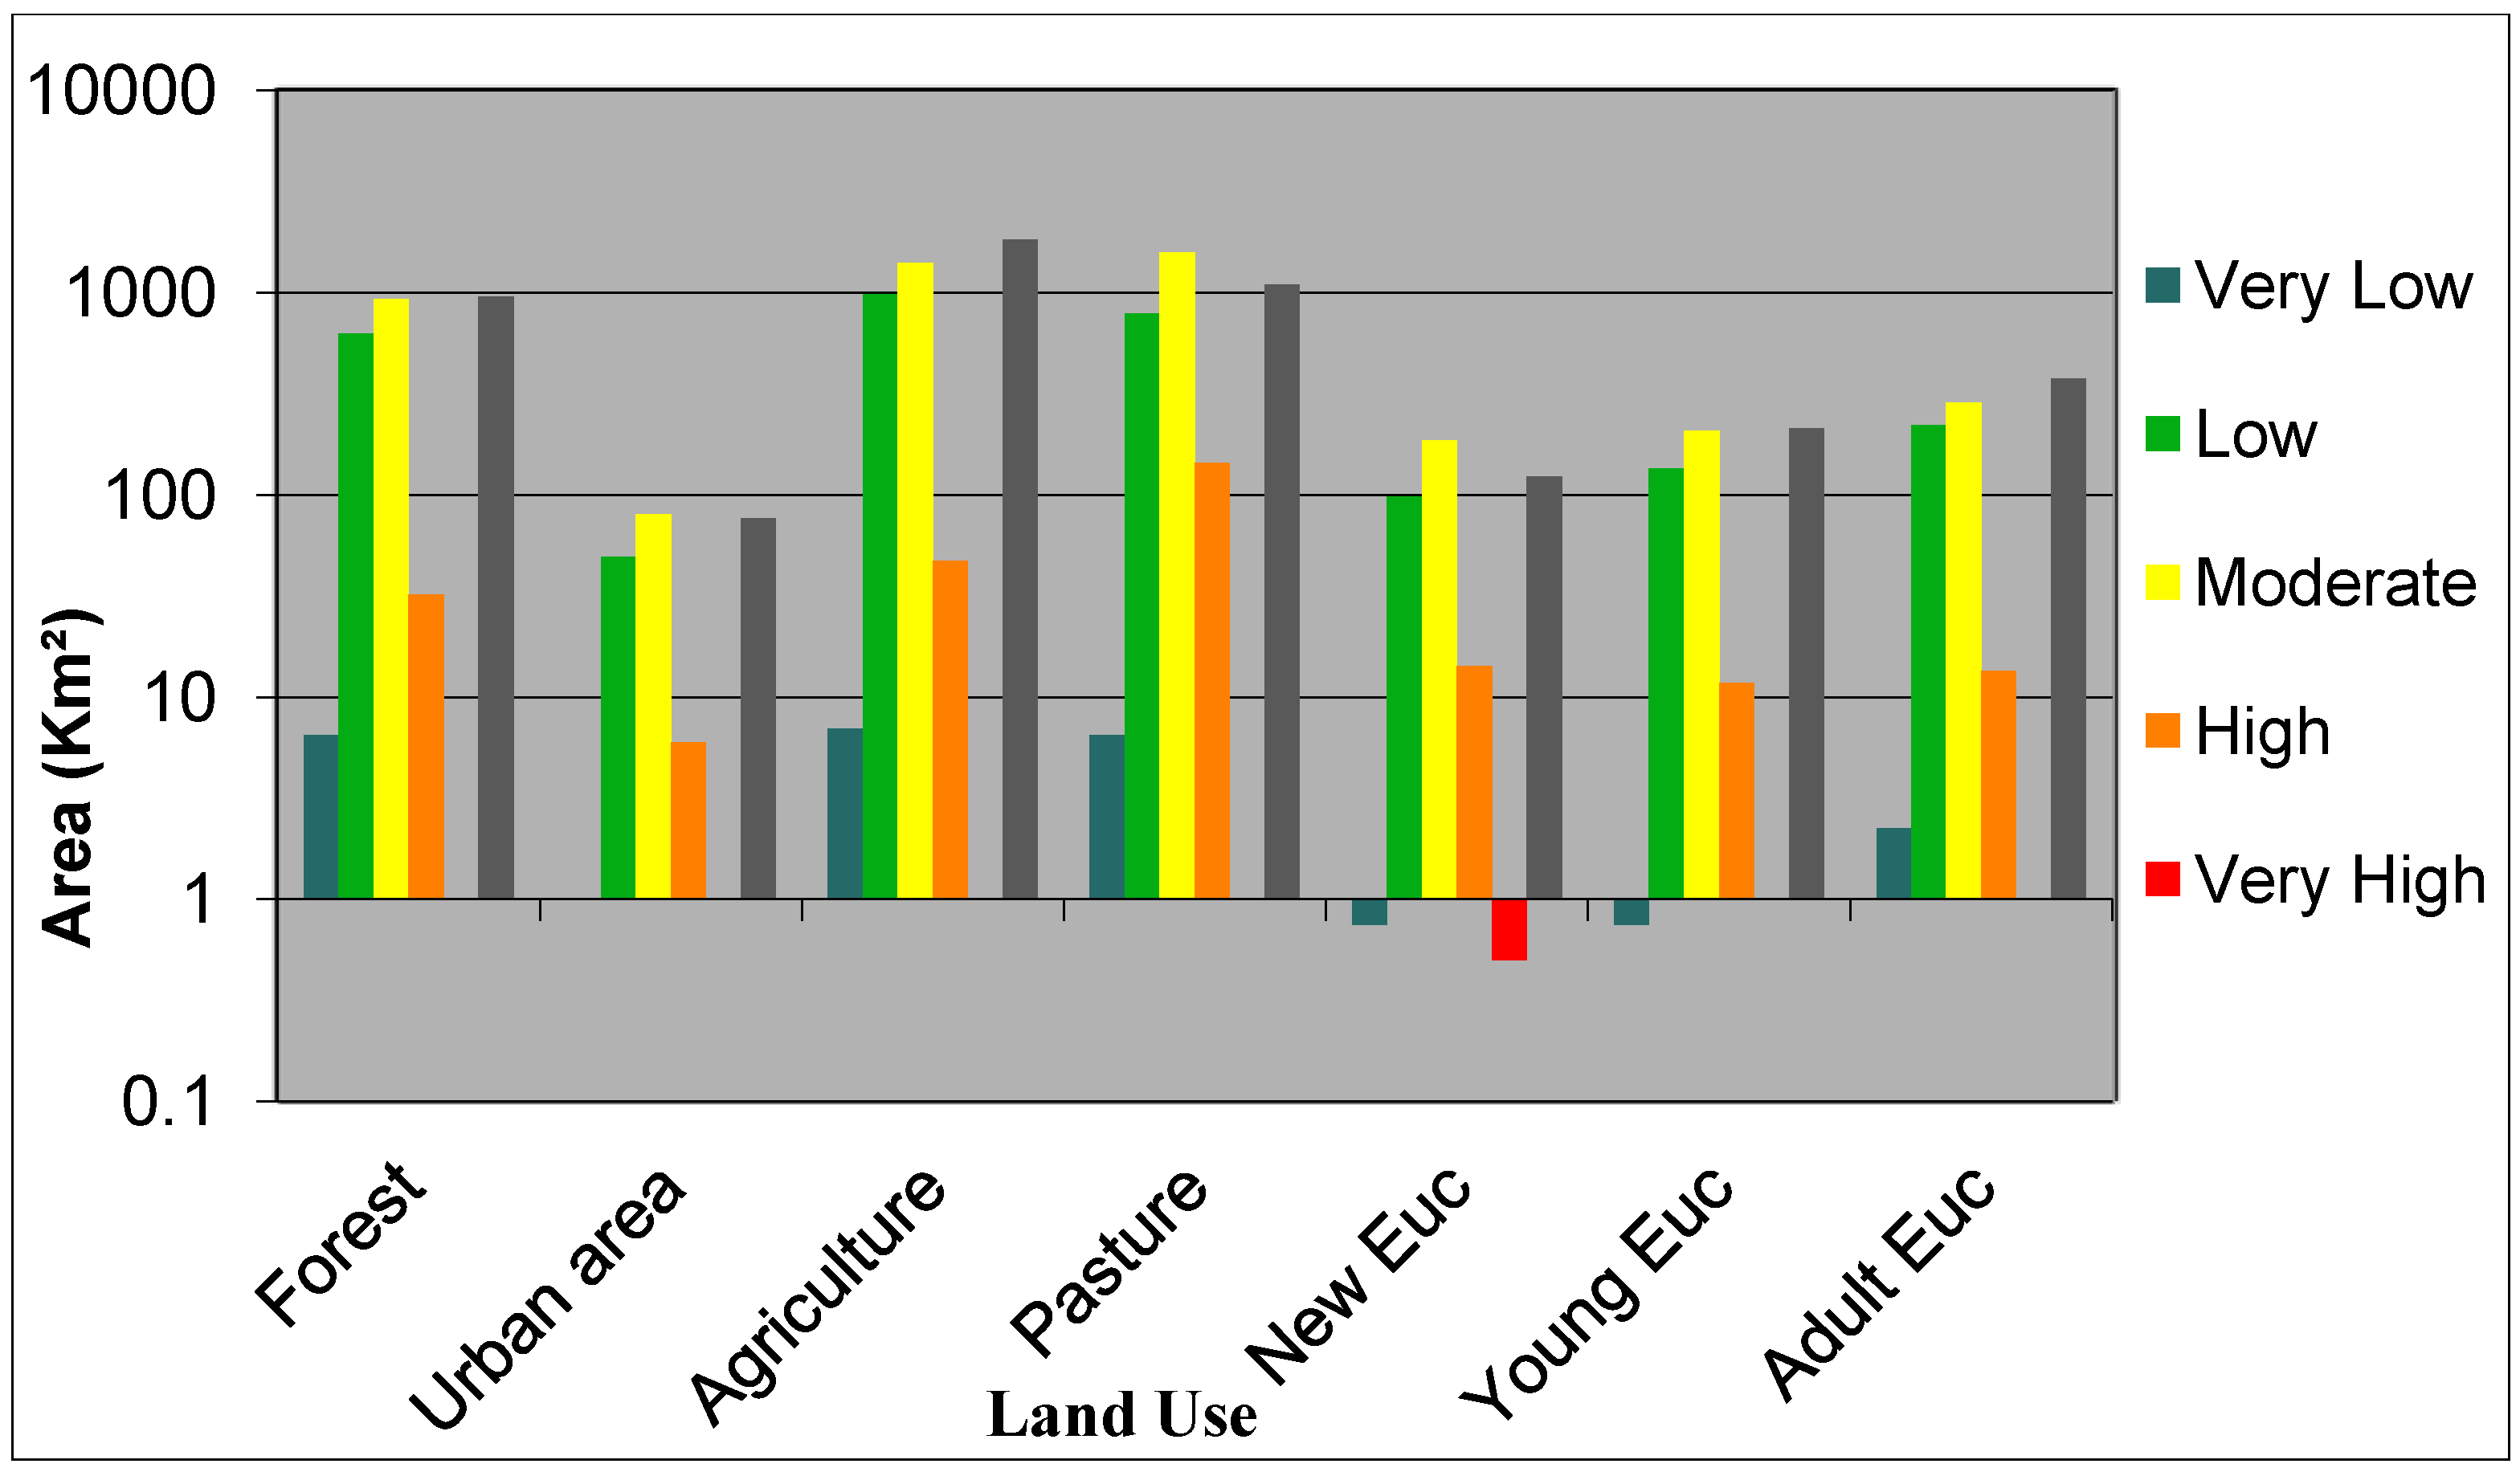
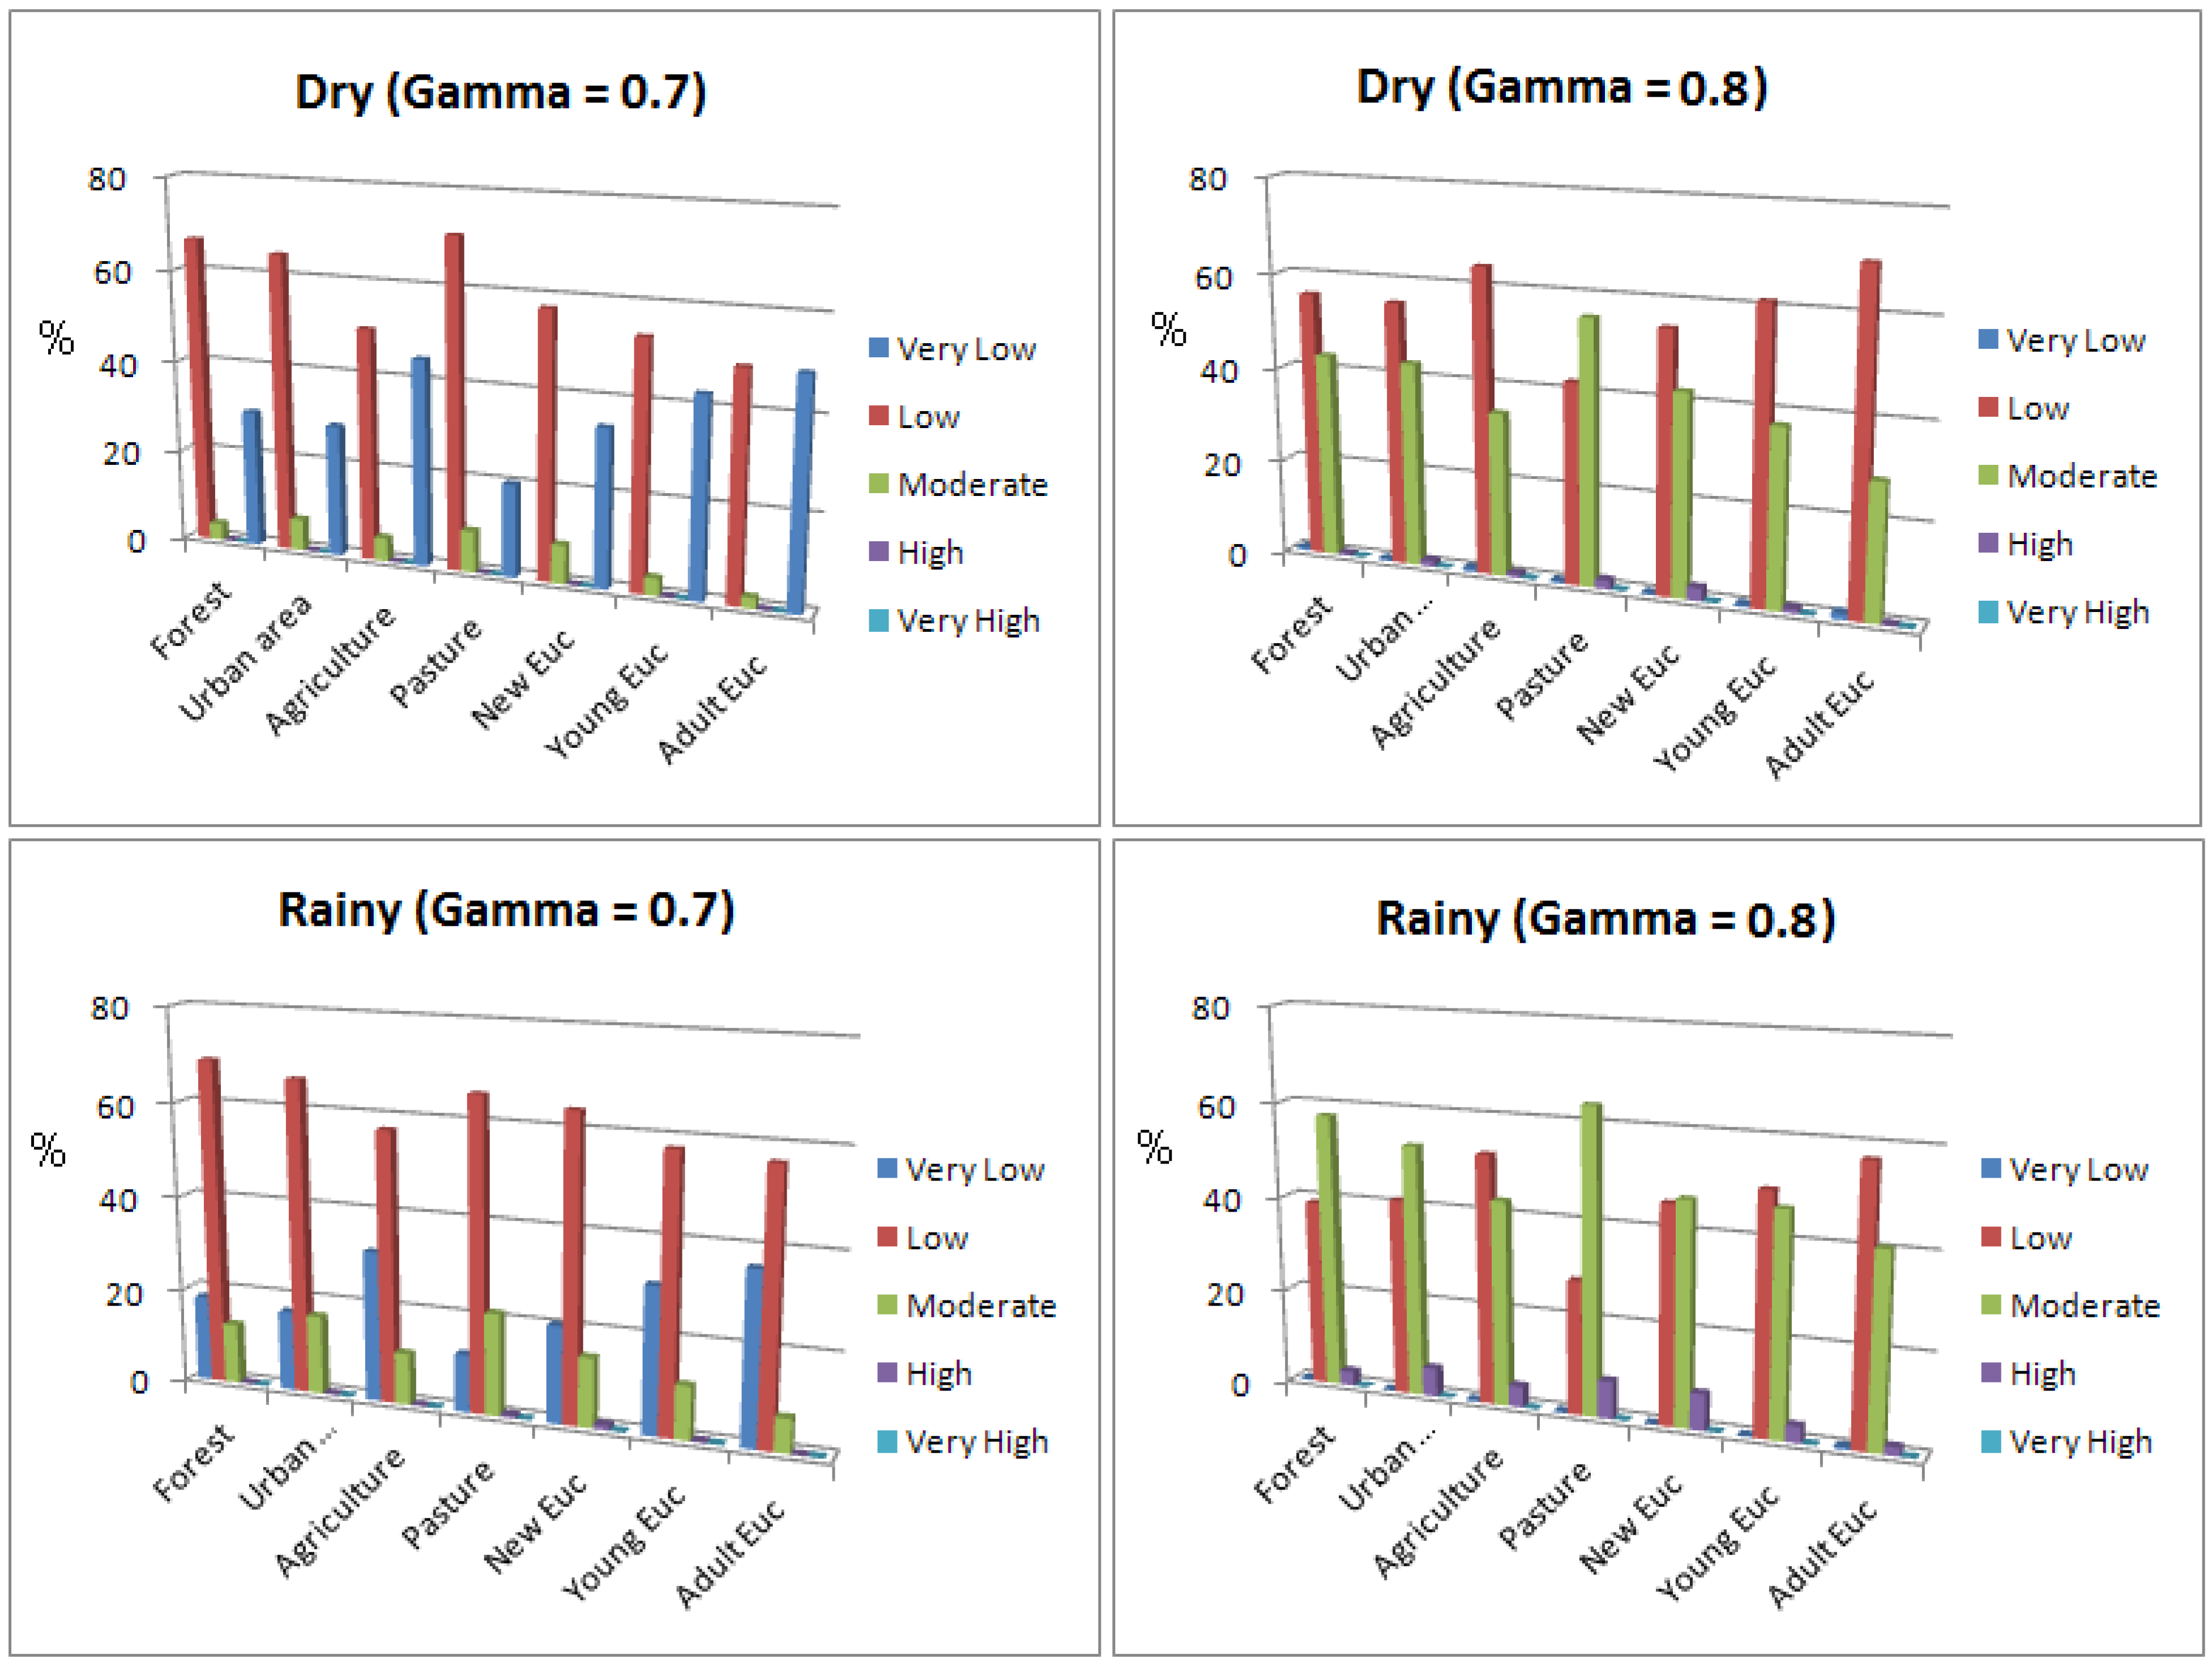
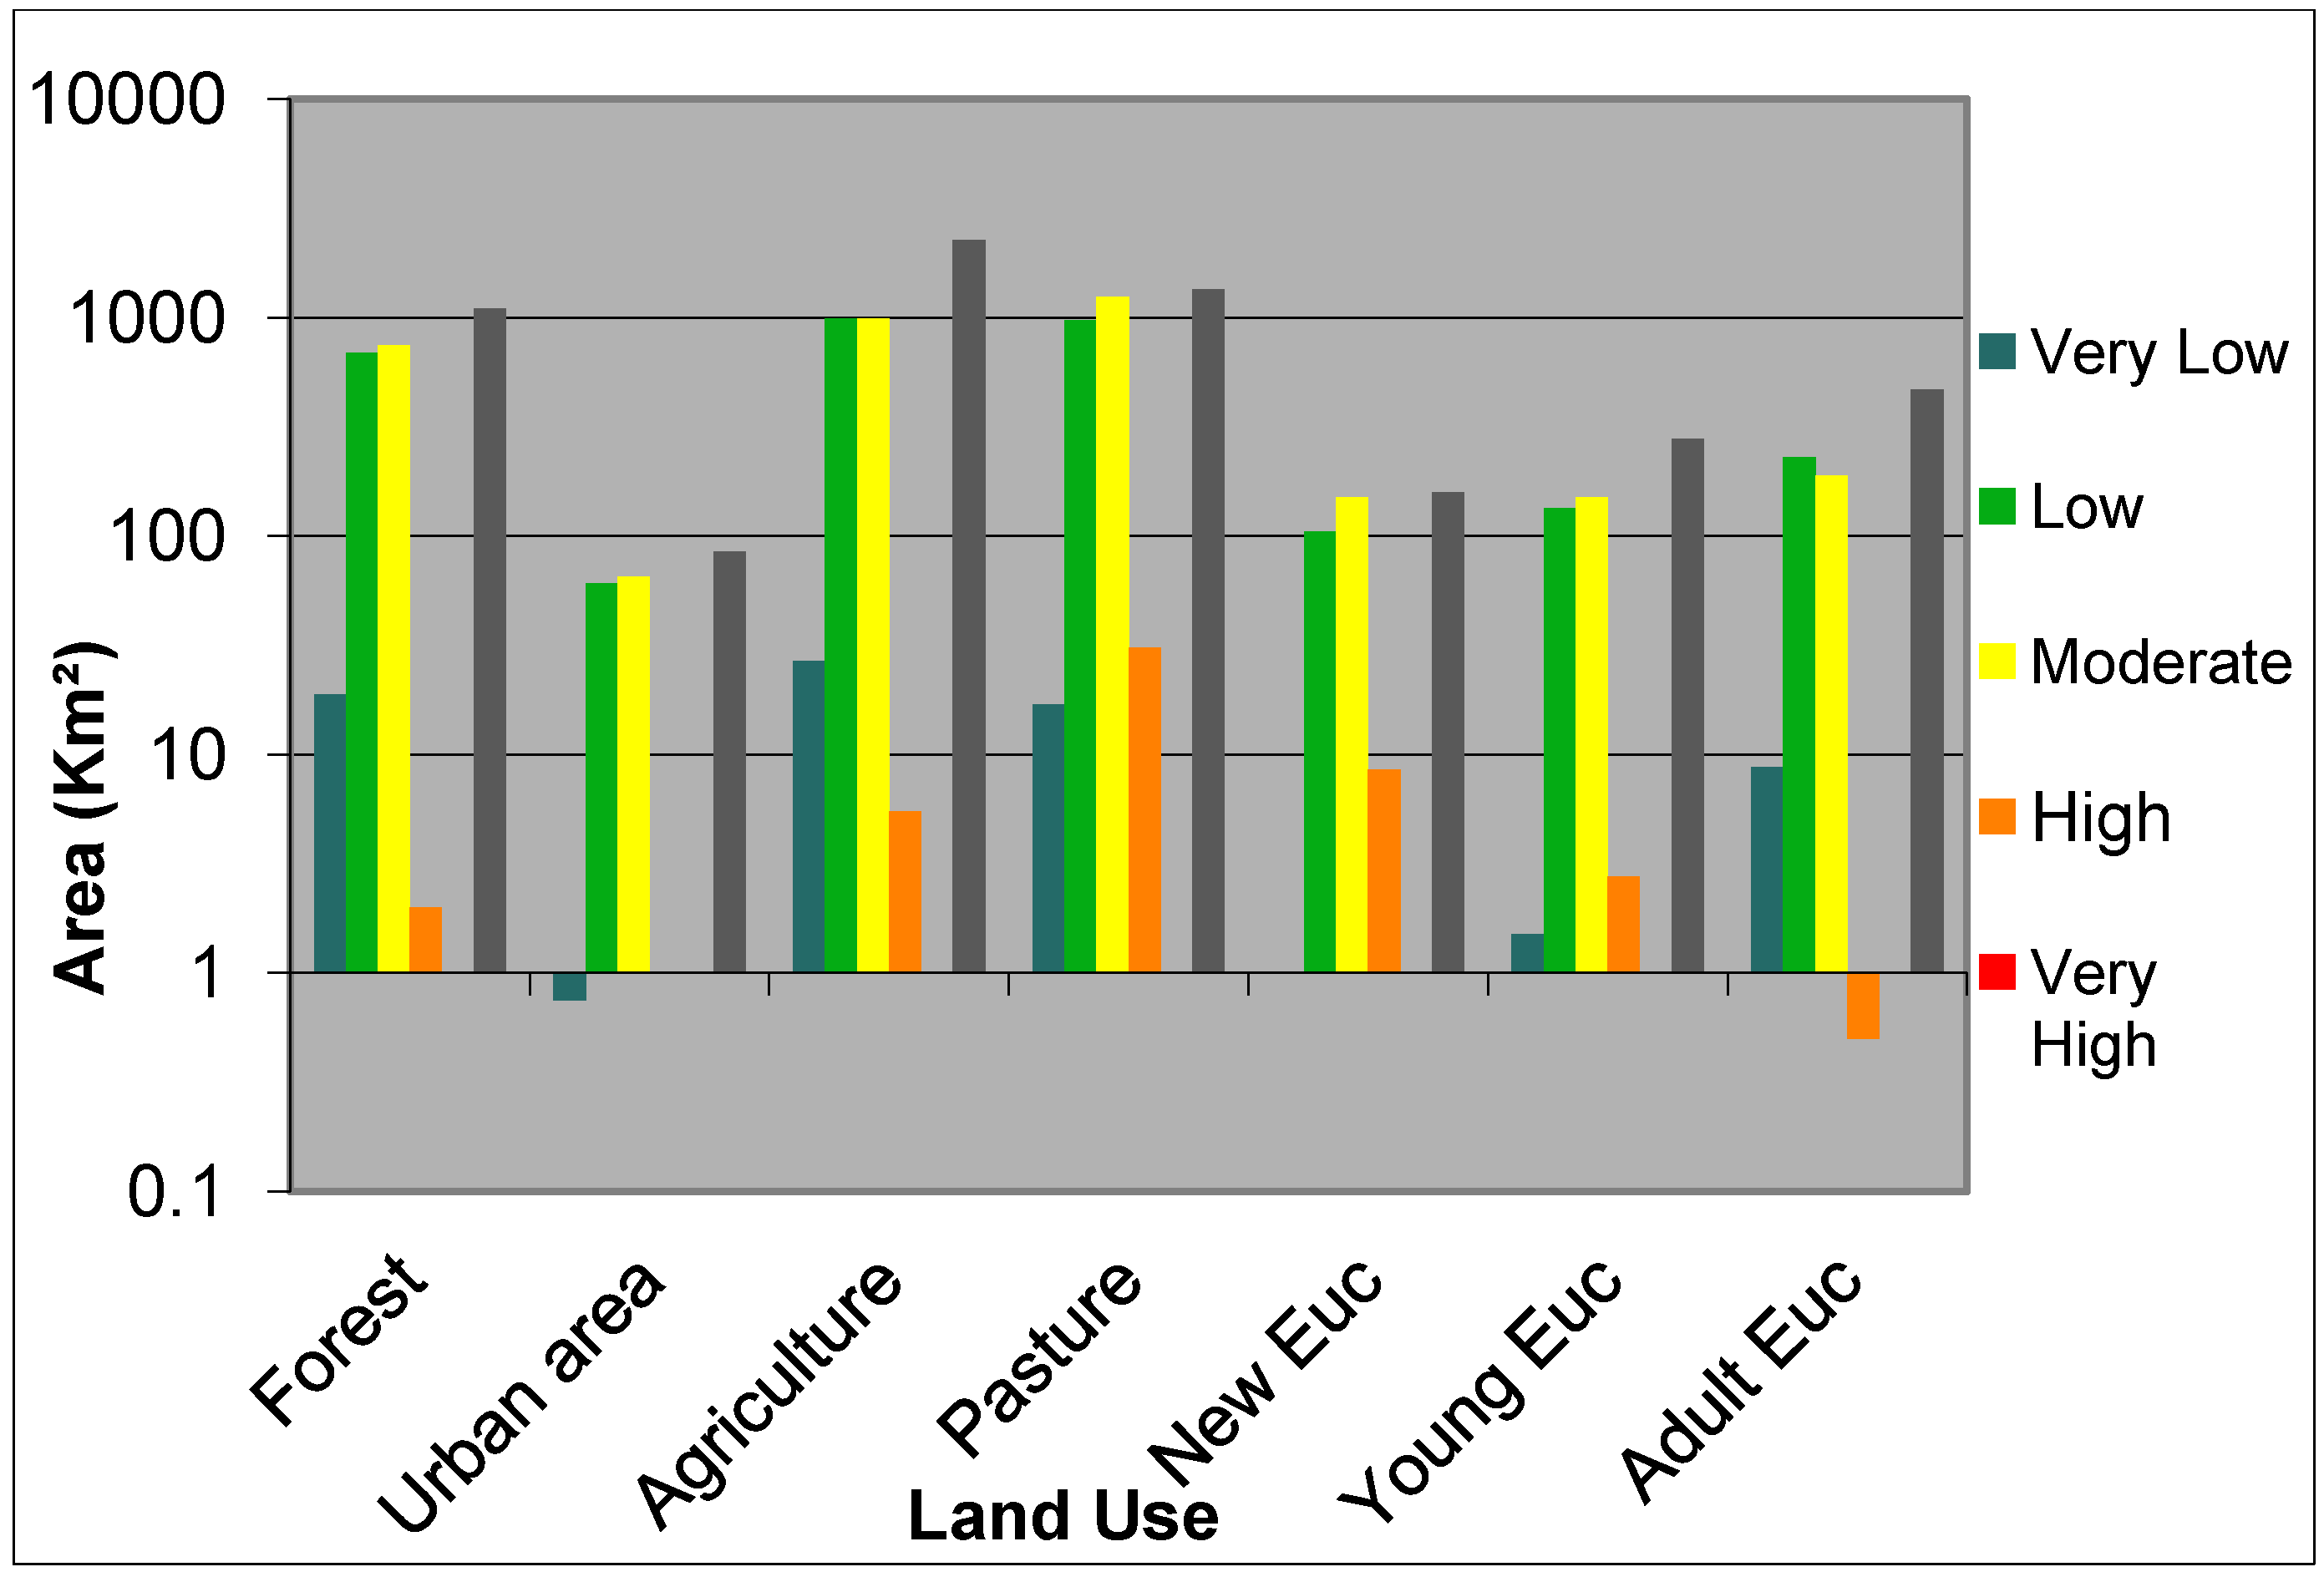
Figure 7.
Logarithmic scale of susceptibility for each land use and land cover class in the dry season.
Figure 7.
Logarithmic scale of susceptibility for each land use and land cover class in the dry season.
An uncertainty map was also prepared for the dry period and, by intersecting this map with the map of land use, it was possible to observe the distribution of sensitivity classes within each land use class (
Figure 7). Classes that require the greatest attention have moderate, high and very high susceptibility. The largest areas for the classes with moderate susceptibility are associated with pasture and agriculture, corresponding to 1,240 and 990 km
2, respectively; followed by the forest class, with an area equal to 745 km
2. For the high susceptibility class, the largest areas are associated with pasture (30 km
2),
Eucalyptus (8 km
2) and agriculture (5 km
2).
The areas covered by pasture and agriculture are examples of land uses that include different phenological stages that are dependent on the hydrological regimen. The pasture loses part of its green biomass in the dry season, leaving the soil more susceptible. The areas covered by agriculture, especially the areas cultivated for species that have annual cycles, undergo a harvesting period, a phase that also increases the susceptibility of the soil.
It is notable that the “forest” land use class is grouped with the other classes (pasture and agriculture) due to the location of forest remnants in the state of São Paulo, which are almost entirely located in the Serra do Mar where there is mountainous terrain. Although this land use class is associated with a low susceptibility weight, the region may have received a higher final weight due to other factors, such as slope and geology.
Although the uncertainty between the maps generated with the two gamma values (0.7 and 0.8) is high, the maps are useful for identifying which uses and land covers are contributing to increased landslide susceptibility.
Similarly, maps for the rainy season were also generated, considering gamma values equal to 0.7 and 0.8 (
Figure 8).
Figure 8.
Landslide susceptibility map for the studied municipalities in the rainy season with gamma values of 0.7 (above) and 0.8 (below).
Figure 8.
Landslide susceptibility map for the studied municipalities in the rainy season with gamma values of 0.7 (above) and 0.8 (below).
In the map generated with a gamma value equal to 0.7 (0.8), 23% (0.19%) and 62% (42%) of the study area were classified as having very low and low susceptibility, respectively, whereas 14% (52%) of the area was classified as having moderate susceptibility and 0.2% (5%) as high susceptibility. Therefore, it appears that a range equal to 0.8 increases the areas susceptible to landslides when compared with those observed in the map generated for the dry period.
An uncertainty map was also generated for the rainy season, and the distribution of sensitivity classes in each land use class is shown in
Figure 9. Again, the pasture, agriculture and forest land use classes had the largest areas associated with the moderate susceptibility class, 1,574, 1,407 and 931 km
2, respectively. For the high susceptibility class, the same three different land uses, pasture (144 km
2), agriculture (47 km
2) and forest (32 km
2), were again the largest areas. For the purpose of comparing the effects of different soil uses based on the generated maps (dry and rainy season and gamma equal to 0.7 and 0.8), the relative areas of susceptibility occupied by each land use were calculated, and the results are presented in
Figure 10.
Figure 9.
Logarithmic scale of susceptibility for each land use and land cover class in the rainy season.
Figure 9.
Logarithmic scale of susceptibility for each land use and land cover class in the rainy season.
With an increase in the gamma value from 0.7 to 0.8, there is a general increase in the susceptibility of all land use classes and in both periods (dry and rainy). Particularly in the areas occupied by Eucalyptus plantations, it was notable that areas with new Eucalyptus have the highest percentages of susceptibility because this stage of cultivation leaves the soil exposed and therefore more susceptible.
In the moderate and high susceptibility classes, the pasture is the land use type that presented the greatest susceptibility, followed by new Eucalyptus and urban areas.
The areas occupied by Eucalyptus in the evaluated sites are in mountainous terrain, with 22% in the soft undulating slope class, 42% in the undulating class and 28% in the strongly undulating class, which can lead to increased susceptibility.
Ternan
et al. [
42] concluded that the sites that presented good ground cover and tree establishment had approximately 3-fold lower soil losses than the sites with a degraded understory (in this case,
Pinus forest). Their study concluded that reforestation should be adopted for soil conservation purposes and that the early stages of forest establishment were the ones that have the greater risk of occurrence of overland flow and soil losses.
Figure 10.
Percentage of susceptibility for different land uses and land covers in the four generated maps.
Figure 10.
Percentage of susceptibility for different land uses and land covers in the four generated maps.
In other work, distinct differences in landslide density were found between forest cover classes in the landslide inventory, with the highest average density in recently disturbed areas (open class) and the lowest density in older forests (large class) [
43].
For some land uses, landslides are more prevalent due to the lack of protection that deep roots provide to the ground through to the slope stability achieved by the mechanical reinforcement provided by tree root systems, especially in terrain with steep slopes [
44].
4. Conclusions
The results indicate that, although the evaluated areas in the state of São Paulo had more pronounced terrain, the landslide susceptibility generally stayed between low and moderate. This occurred because many factors can contribute to the higher landslide susceptibility of a region, such as the slope and the geology. In this context, the areas occupied by forest in the state of São Paulo, which are located near the Serra do Mar and Serra da Mantiqueira, have a terrain with steep slopes and therefore higher susceptibility.
Agriculture and pasture were the land use types with more area susceptible to landslides, which was shown on all of the generated maps.
Eucalyptus in its initial stage or at harvest time (new Eucalyptus/exposed soil) is associated with the most exposed soil. Therefore, these areas are more susceptible to landslides, and this development stage presents the greatest susceptibility. Generally, the areas occupied by Eucalyptus plantations are associated with low values of susceptibility.
The fuzzy gamma technique map overlay proved satisfactory but requires prior user experience to assign weights to the different classes that are present within each of the used themes (geology, geomorphology, etc.). This technique is recommended for working with environmental data, where the information is imprecise and there are strict limits between one class and another. The variance of the values of gamma allows the user to work with the error in the data during the map overlay process, generating pessimistic (γ = 0.7) and optimistic (γ = 0.8) scenarios with lower and higher gamma values, respectively, and in the rainy season, increasing the area’s susceptibility to landslides.
The maps generated by this study could be used to assess which factor or set of factors contributes to an increased susceptibility to mass movements in the area of study.


 (z) is known as “the degree of membership of Z in A”. The fuzzy membership value must lie in the range from 0 to 1 and reflects the degree of certainty of membership. The fuzzy theory employs the idea of member functions and expresses the degree of membership with respect to some attribute, in this case landslide susceptibility.