Article

Visual Analysis for Nowcasting of Multidimensional Lightning Data

Department of Cartography, Technical University Munich, München 80333, Germany
*
Author to whom correspondence should be addressed.
ISPRS Int. J. Geo-Inf. 2013, 2(3), 817-836; https://doi.org/10.3390/ijgi2030817
Submission received: 17 June 2013 / Revised: 22 July 2013 / Accepted: 14 August 2013 / Published: 26 August 2013
(This article belongs to the Special Issue Geovisualization and Analysis of Dynamic Phenomena)

Abstract

:
Globally, most weather-related damages are caused by thunderstorms. Besides floods, strong wind, and hail, one of the major thunderstorm ground effects is lightning. Therefore, lightning investigations, including detection, cluster identification, tracking, and nowcasting are essential. To enable reliable decisions, current and predicted lightning cluster- and track features as well as analysis results have to be represented in the most appropriate way. Our paper introduces a framework which includes identification, tracking, nowcasting, and in particular visualization and statistical analysis of dynamic lightning data in three-dimensional space. The paper is specifically focused on enabling users to conduct the visual analysis of lightning data for the purpose of identification and interpretation of spatial-temporal patterns embedded in lightning data, and their dynamics. A graphic user interface (GUI) is developed, wherein lightning tracks and predicted lightning clusters, including their prediction certainty, can be investigated within a 3D view or within a Space-Time-Cube. In contrast to previous work, our approach provides insight into the dynamics of past and predicted 3D lightning clusters and cluster features over time. We conclude that an interactive visual exploration in combination with a statistical analysis can provide new knowledge within lightning investigations and, thus, support decision-making in weather forecast or lightning damage prevention.

1. Introduction

Visualization is an enabling mechanism that helps to understand and explore complex relationships in a spatial context. It does not necessarily improve information communication, but it aims to increase the probability of doing so. Maps are among the most popular visualization. They are typically used to represent geographic information in an abstract form that may facilitate the identification of spatial patterns at various levels and emphasize characteristic features belonging to the respective spatial phenomena. In today’s society, the amount of shared information and data is constantly increasing. Thus, there is a growing need for data abstraction [1]. A straightforward projection of digital data on a display surface does not make sense from cartographic perspective. Instead, maps are elaborately designed to reveal patterns that may not be immediately recognized in the real world [2]. The rapid increase of data amount and complexity that now requires both visual representation and analysis has given rise to the new scientific discipline of Visual Analytics [3] and conventional maps have been considerably extended and elaborated to embrace further graphic presentations. In this paper, maps are treated as a subset of visualizations.
Research in the area of interactive visual analysis draws on expertise in visual analytics, exploratory data analysis, interface design, and cognitive ergonomics. The theories of cognitive ergonomics can support the identification of constraints for visualizations and their interpretations [4]. From these constraints and viewers’ roles and characteristics, parameters for the visualization design can be derived. If the visualization is embedded in an interactive system, it will possess a two-fold added value—empower users and learn from user’s behavior. Previous studies of visual analysis and exploratory tools for point datasets can be found in [5,6,7,8,9,10,11]. Further theoretical foundations in geospatial and temporal visual analytics are provided in [2,3,12,13,14,15,16]. Investigations summarized in this paper support visual data analysis and visual analytics approaches that have been examined in a number of research projects. In 2004, for example, the National Visualization and Analytics Center (NVAC) was founded [17]. NVAC gathered experts from different disciplines and proposed a research agenda for visual analytics. The VisMaster—a European Coordination Action Project—is also focused on the research discipline of Visual Analytics [18]. Moreover, a working group of the MOVE project is focused on Visual Analytics for Movement and Cognitive Issues [19]. The main objective of MOVE (COST Action IC0903) is to develop improved methods for knowledge extraction from massive amounts of data about moving objects. The demand to make full use of technical progress that enables personalized illustration, multifaceted displays (dynamic, connected, multidimensional), combinations of reality and visualization, and benefits from non-visual perceptual channels was emphasized in [20]. According to the International Cartographic Association research agenda, an important issue in Geovisualization and Visual analytics is that “Geovisualization techniques have extended the map medium to embrace dynamic, three- and four-dimensional data representation” [21].
Furthermore, in [2] it is stated that efficient visual exploration might enable the possibility of analyzing data sets in time. As such, the need to incorporate large data commonly increases, but up to date methods might not be effective enough for a visual analysis. Considerable overplotting and visual disorder may lead to illegible data representation. In addition, it is not always easy to recognize, track and interpret abundant simultaneously changing visual components [2]. In [22], the challenges in extreme-scale visual analytics are described, whereby in particular two of these challenges are also dealt with in this work: the analytics of temporally evolved features; data summarization and triage for interactive query.
Investigations of dynamic patterns also aim to detect location based-events that appear over time and help to find time, location, and reasons of events. Events and their pattern behavior represent a higher level of knowledge in comparison to changes [23]. Therefore, they are more valuable for decision makers. An event can be understood as a significant change within a specific time period or which happens at a certain moment of time. Furthermore, pattern behaviors can be very complex and irregular. Nevertheless, they can be visually represented for further analysis [23].
Lightning is a very complex event. A flash is a lightning discharge in its totality; the average duration of a flash is 0.5 s. A stroke is a partial discharge consisting of a downward-moving leader streamer of low luminous intensity followed by an up-ward-moving return streamer of high luminous intensity. One flash may consist of one single stroke or a series of strokes in the same or adjacent channels [24]. In this work we only use the term lightning. The data used are detected lightning points, whereby every lightning point corresponds to an individual discharge (single stroke).
Within this study, “event” refers to the occurrence and prediction of thunderstorms represented by tracked and nowcasted lightning clusters. We investigate a concept for visual analytics of dynamic lightning clusters in 3D. We briefly describe how to detect lightning data and how to track and nowcast lightning clusters. The term lightning cluster is used to define lightning detections clustered in time and space to represent the part of a thunderstorm with lightning activities. The term “nowcasting” refers to lightning cluster predictions for time periods of less than a few hours.
The paper is focused on the visualization of experimental dynamic lightning position data. We do not intend to provide any analysis of the meteorological implications of thunderstorms. Furthermore, we do not consider the degree of applicability of the presented visualization to different types of storms. Our aim is to provide a computational framework for 3D lightning stroke visualization of given historical data in the form of a GUI tool, including its mathematically based geometrical extrapolation in space and time to the extent allowed by the data. The goal of this work is not to develop a perfect tracking and nowcasting solution. Instead, we aim to enable users to accomplish visual and statistical analysis of tracked and nowcasted lightning cluster features in an integrated system.

2. Methodological Framework—State of the Art

2.1. Lightning Data Detection and Position Accuracy

The 3D lightning test data are provided by lightning detection network (LINET) [25], a lightning detection network in Europe. LINET was established at the University of Munich (Department of Physics) and put into permanent operation by nowcast GmbH in 2006. The network currently contains 130 sensors distributed over 30 European countries. The acquisition of the emission altitude in-cloud (IC) lightning is unique. As stated in [26,27] the 2D-location accuracy amounts to about 150 m. The accuracy of in-cloud lightning point altitudes is about 10%; for example, an IC lightning at 10 km height has its accuracy of +/−1 km.

2.2. Thunderstorm and Lightning Cell Nowcasting

A main part of thunderstorm investigation is to detect, track and nowcast lightning cells. Thunderstorm nowcasting algorithms consist of three steps: cell identification, cell tracking, and cell prediction. Nowcasting comprises the detailed description of the current weather along with forecasts obtained by extrapolation for a period of up to six hours in advance [28].
Theories of crowd or herd movement analysis are only of limited utility for lightning cells. On the one hand, lightning points can be described as dynamic collectives within the same moving thunderstorm cell. On the other hand, lightning points are not discrete dual-aspect phenomena as crowd events [29].

2.2.1. Cell Identification and Tracking

Existing methods are based on satellite data, radar data, lightning data, microwave-based temperatures, or a combination of them. In [30], a comprehensive overview about existing thunderstorm nowcasting methods is provided. In [31,32,33,34], different methods based on satellite image data are described. In [35,36,37], solutions based on radar data are introduced. The methods in [38,39] provide a solution using both radar data and lightning data. In [26], a cell identification and tracking approach based only on lightning data derived from the LINET network was introduced.
Cell tracking techniques can be divided into overlapping techniques as reported in [34,37], pattern-oriented correlation techniques in [40], and cost functions techniques in [35,39]. Some of the tracking approaches consider the cell splitting and merging behavior.
To track lightning data, cells first have to be identified based on spatial-temporal clustering of the detected lightning point data. Usually, time intervals of 10–15 min are applied to divide lightning point data sets into temporal frames [27].
Spatial point clustering methods can be classified into three major types: density-based, hierarchical and partitioning methods. An overview of existing point clustering methods is provided by [41]. For spatial clustering of lightning data, usually, a simple partitioning method based on distances between lightning cells is used. Thereby, the basic idea is to expand the given cluster as long as the distance towards a neighborhood point does not exceed some threshold. Such a method can lead to arbitrarily shaped clusters and can also be used to filter out noise or outliers [42].
If lightning cells are identified within each time interval, connected cells can be allocated to enable cell tracking. Thus appearance, changes in size/shape/location/density, merging, splitting, and disappearing of each cell can be investigated [27].

2.2.2. Cell Nowcasting

Most nowcasting or extrapolation methods are applied on radar or satellite data. Some of them can be applied on the cells derived from lightning point data. Basically, two principal extrapolation techniques can be distinguished: area and cell trackers. Area trackers such as Tracking Radar Echoes by Correlation (TREC) [33] and continuity of TREC vectors (COTREC) [31] use cross correlations between temporally separated consecutive pattern maps to find motion fields. It is common for cell trackers to extrapolate the cell centroid into the future based on the centroids of the past cells.
The simplest method for cell trackers to generate a forecast is to predict future cells from past cell positions. Here it is common to extrapolate cell centroid positions. A “persistent nowcast” does not assume any route tendency, whereas a “trend nowcast” uses trend models in order to capture cell trends from the latest cell history; for example TITAN (thunderstorm identification, tracking, analysis, and nowcasting) [35]. GANDOLF (Generating Advanced Nowcasts for Deployment in Operational Land-based Flood forecasts) [43] and SWIRLII (Short-range Warning of Intense Rainstorms in Localized Systems) [44] employ a conceptual model to consider nowcast trends of lightning cell objects. Thereby, physical knowledge about cell evolution is taken into account.
With regard to cell tracking with lightning data, simple extrapolation based on three or four consecutive time-intervals of, say, five or ten minute intervals often produces useful results, especially when cells are not too short-lived [26].

2.3. Explorative Visualization of Lightning Data

Earlier works dealing with tracking and nowcasting of lightning data consider only simple 2D plots. Lightning clusters are either displayed as 2D convex hulls, with or without the underlying lightning point data. With the recent improvements in lightning data detection and accuracy, there is a growing demand for multidimensional and interactive visualization. In our previous work [27] a first approach for an interactive explorative 3D visualization of lightning data was introduced. This work aims to improve the approach of [27] and extend it with a visual and statistical analysis of nowcasted lightning clusters and cluster features for the predicted 10 to 60 min.
A similar work which focuses on precipitating clouds can be found in [45]. The initial data in [45] is a set of satellite images (2D) whereas the initial data in our work are lightning point coordinates in 3D. In [15], it is stated that one of the challenges for researchers within geovisualization and geovisual analytics is to deal with different spatio-temporal data and find appropriate solutions for the respective data. In [45], a Space-Time-Cube (STC) with icons is presented, whose radius is proportional to the size of the precipitating cloud region. With our work we want to provide not only a STC, but also a 3D view within an interactive exploring tool, which intends to offer different lightning cluster/track presentations to the user (see Section 4.4.1). While the concept of cloud cell tracking in [45] is similar to our lightning cluster tracking approach, we wanted to introduce a variety of visual and statistical representations of lightning clusters and tracks. Furthermore, we aimed to provide a lightning cluster prediction approach including visualization of future clusters and their uncertainties.

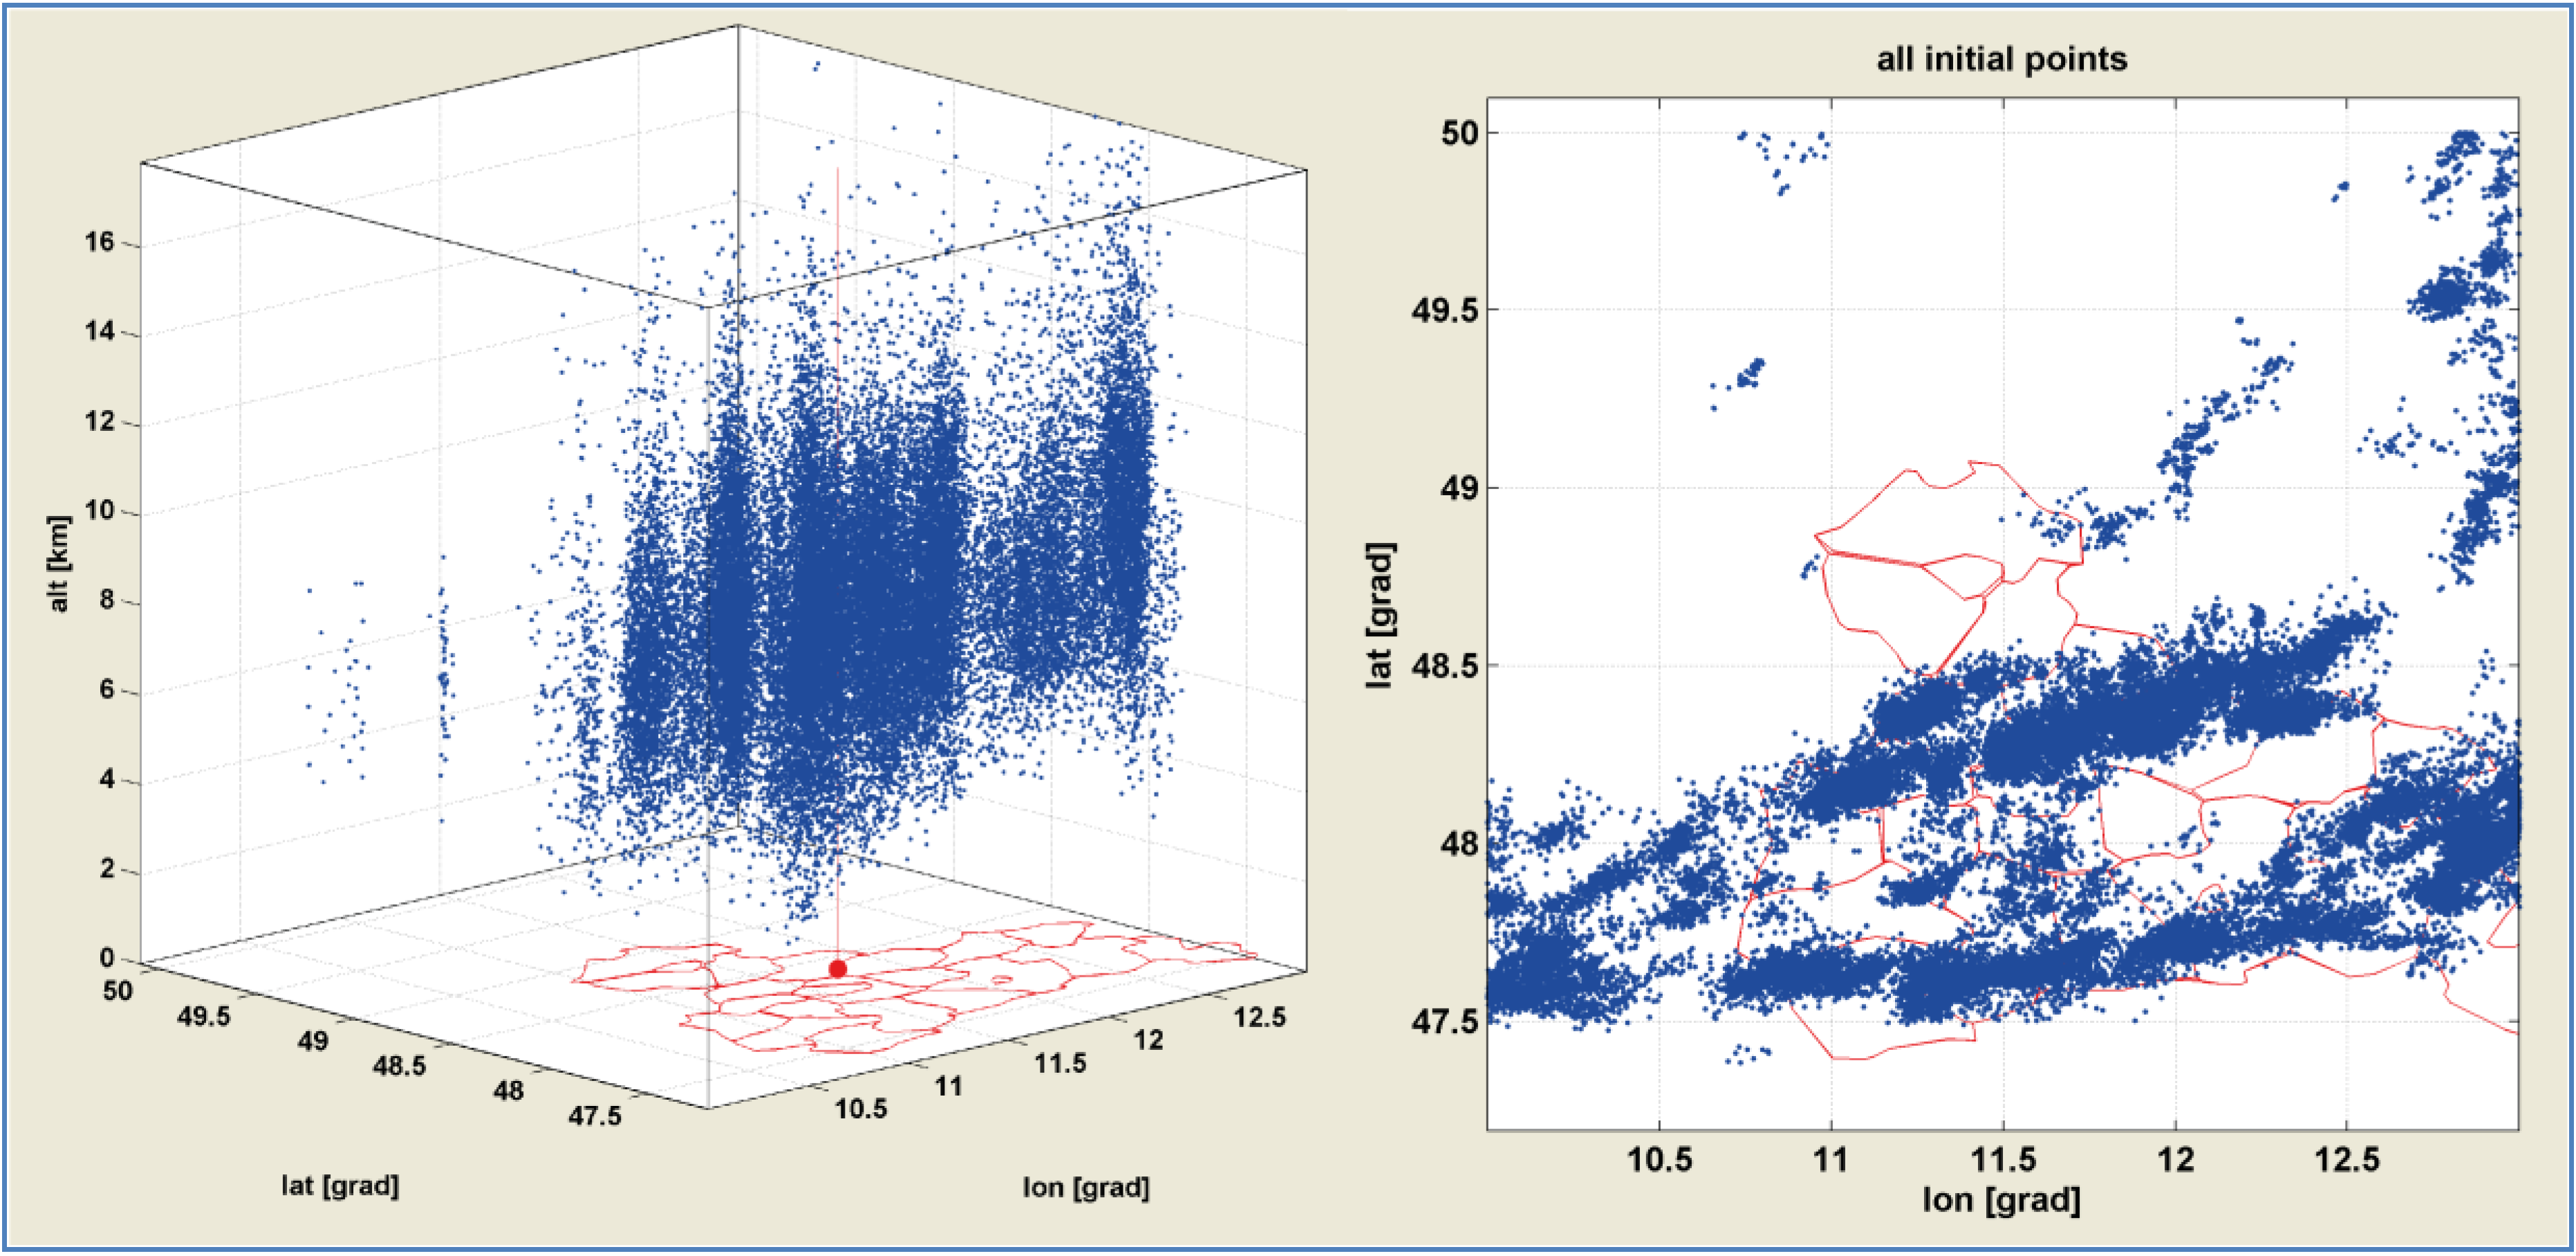
3. Lightning Points Test Dataset

We used lightning points detected by LINET on 22.07.2010 in the region of Upper Bavaria, Germany. The geographic range of our test data set includes the region of 47°N–50°N Latitude and 10°E–13°E Longitude. A large thunderstorm crossed Upper Bavaria between 1 pm and 12 pm. The investigated storm was a pre-frontal thunderstorm cluster with strong cell interactions. Within our work, we only used in-cloud (IC) lightning. Altogether, 35,087 IC lightning points were detected. In the area of Munich airport about 8,750 IC lightning were detected between 18:50 and 20:00. LINET provided the 3D position (Latitude, Longitude, and Altitude) and the exact lightning occurrence time (at the lightning peak radiation), shown with an example in Table 1.
Table 1. Example of the provided lightning data.
DateTimeLatitude (°)Longitude (°)Altitude (km)
2010072217:45:35.926680149.017712.85929.7
2010072218:13:12.801195250.435111.67750
The locations of the entire test data set (IC lightning) are presented as blue dots in Figure 1, in 3D and 2D. Base data (Upper Bavaria districts) are illustrated via red lines on the ground. Additionally, the location of Munich Airport is shown (red circle).
Figure 1. IC lightning data (Left: 3D plot; Right: 2D plot).
Ijgi 02 00817 g001
The static plot of lightning data as shown in Figure 1 is limited for the understanding of the dynamics in lightning data. To overcome this drawback and to answer questions about past and predicted lightning cluster and track features, we developed interactive visual and statistical explorative tools.

4. Development of an Interactive Tool for Lightning Data Analysis

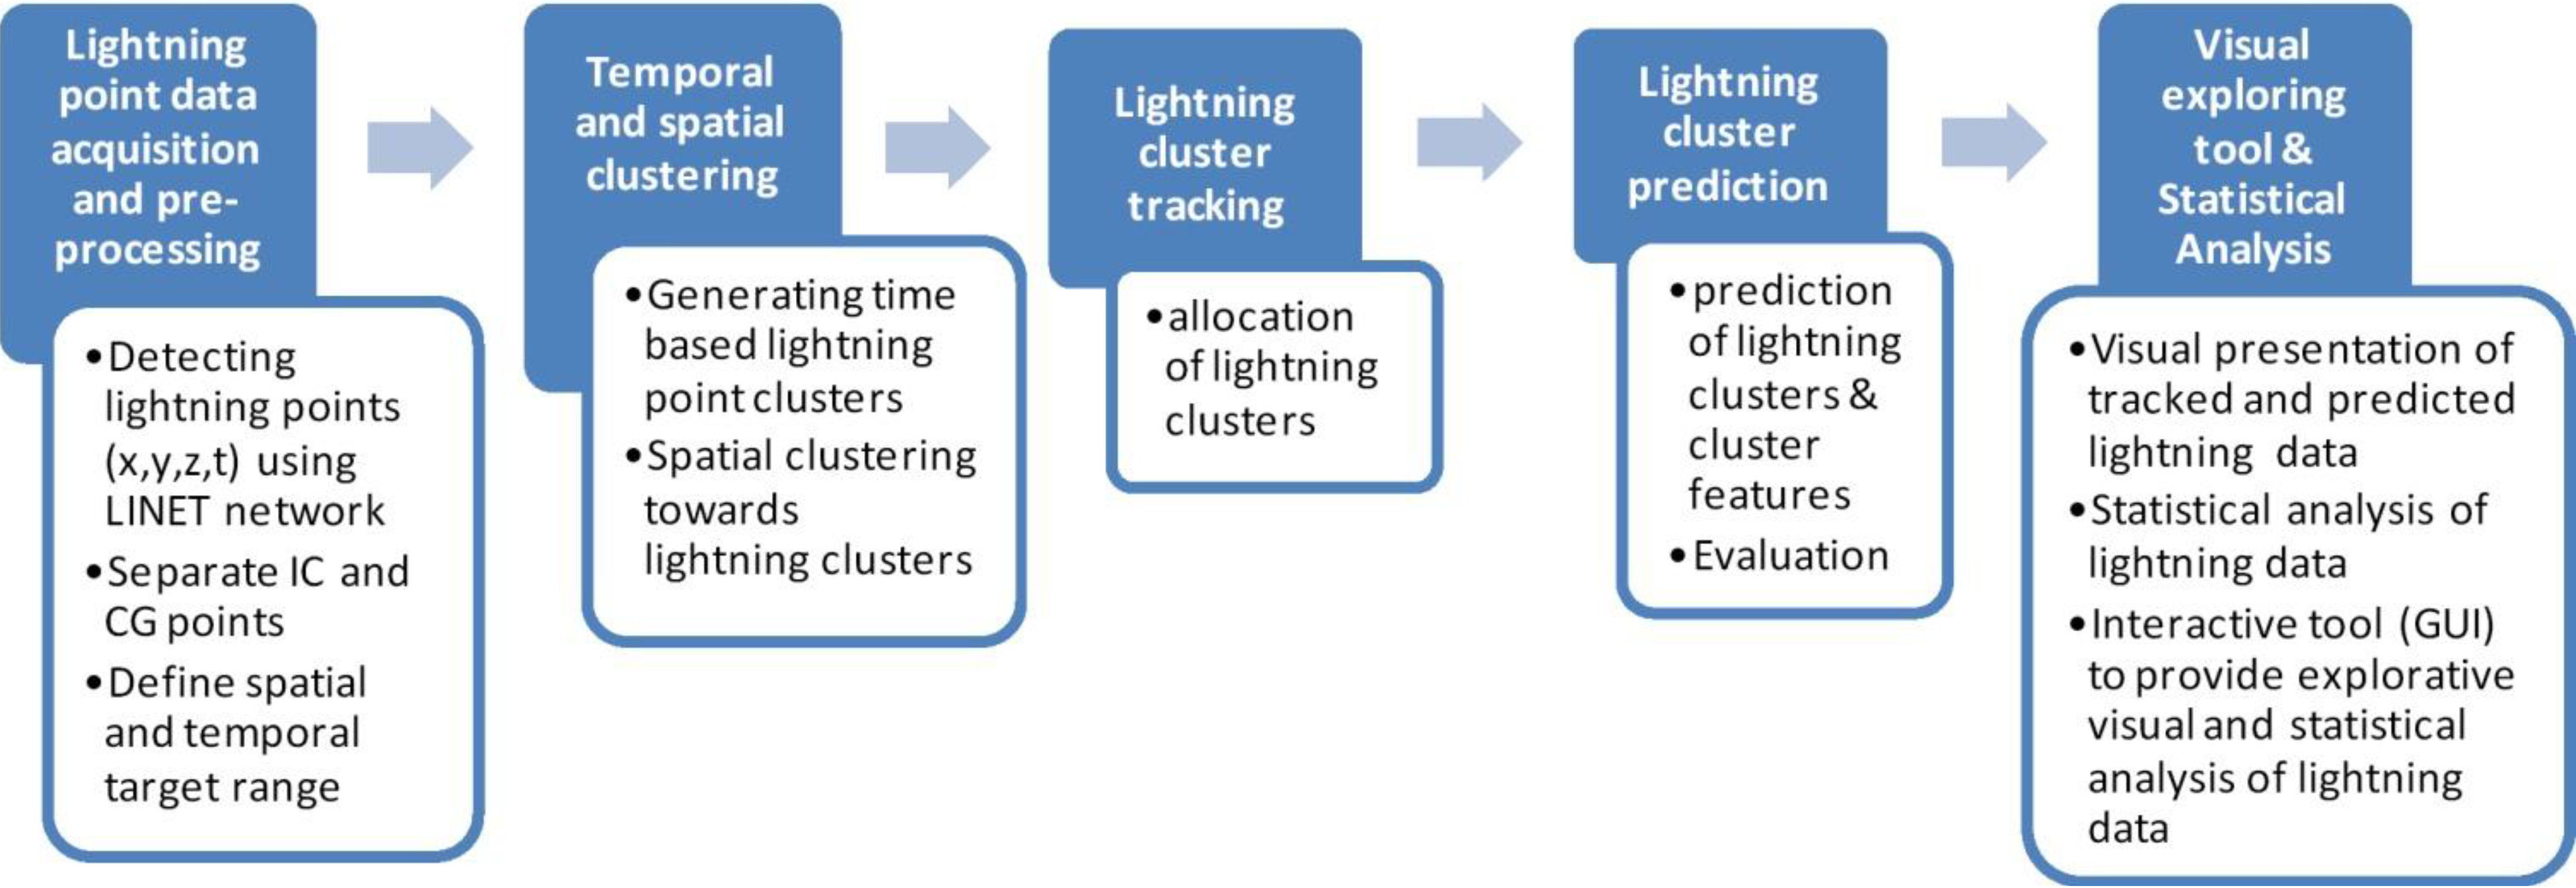
4.1. Workflow: Lightning Detection, Clustering, Tracking, Prediction, and Visualization

The test data set (lightning in Upper Bavaria during 22 July 2010, see Section 3) was pre-processed first. Following this, lightning clusters were identified, tracked, and nowcasted. Afterwards, a lightning GUI was established which enables the user to explore all results of cluster tracking and nowcasting together with results from the statistical analysis.
As illustrated in Figure 2, our approach can be divided into five main steps: (1) Lightning point data acquisition and pre-processing; (2) Temporal and spatial clustering towards lightning clusters; (3) Lightning cluster tracking; (4) Prediction of lightning clusters and cluster features; and (5) Visual and statistical analysis. Figure 3 provides an overview of all adjustable parameters within cluster identification, tracking and nowcasting. The parameter values used for the test data in this work are shown in red color.
Figure 2. Overall workflow: from data detection to visual analysis.
Ijgi 02 00817 g002
Figure 3. Adjustable parameters (in red).
Ijgi 02 00817 g003

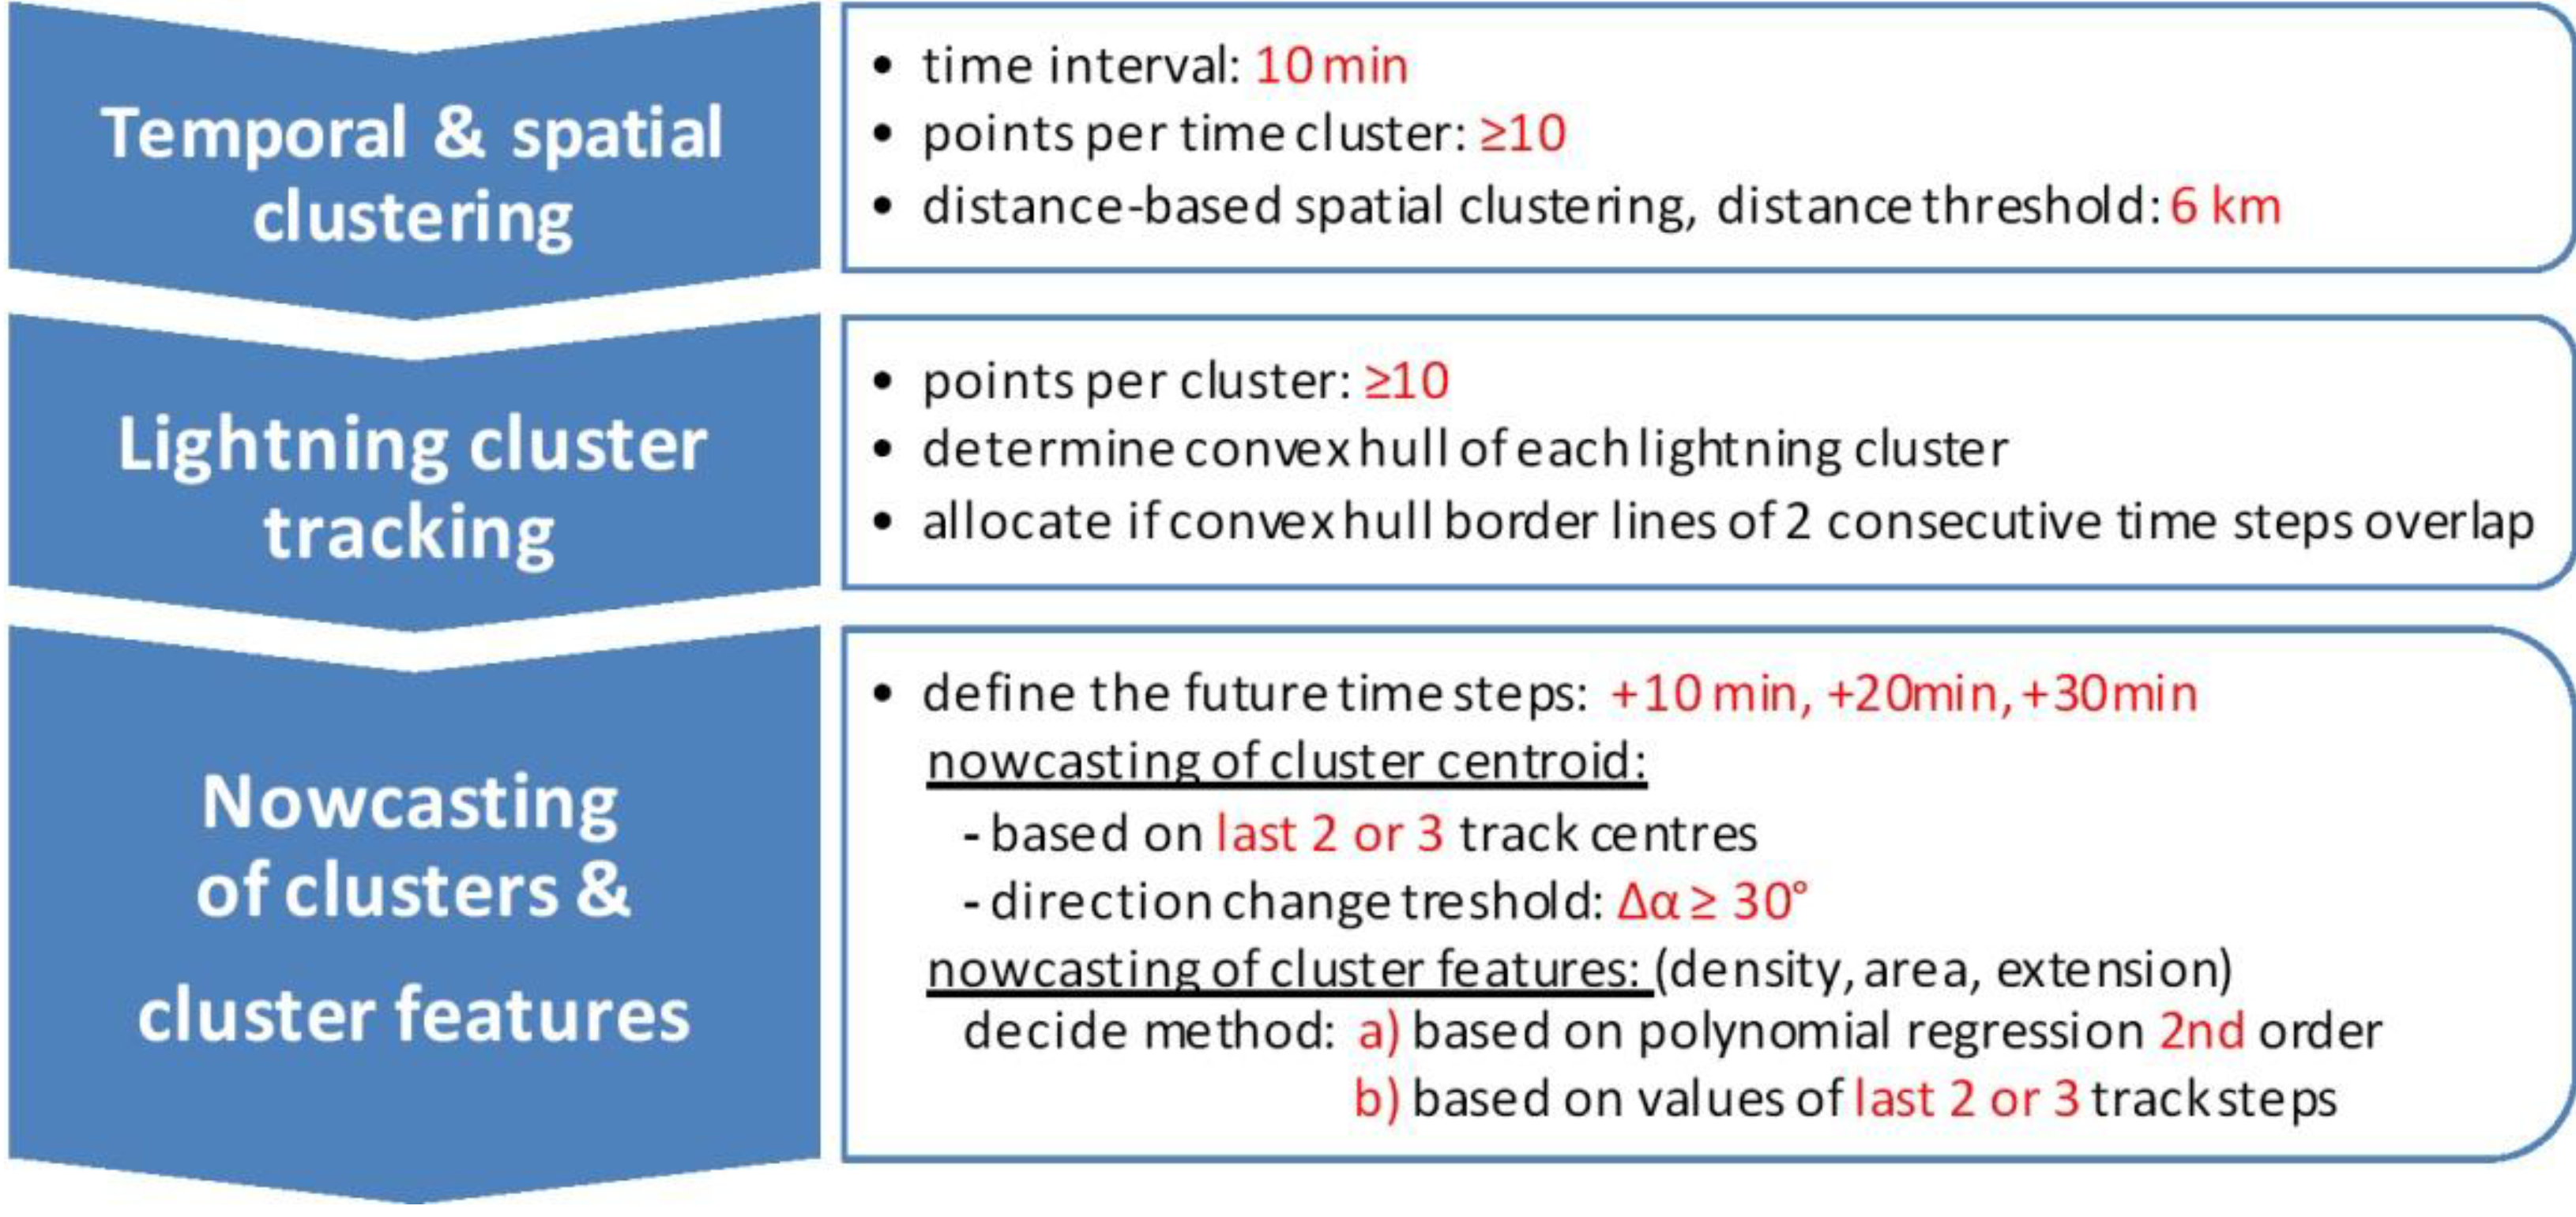
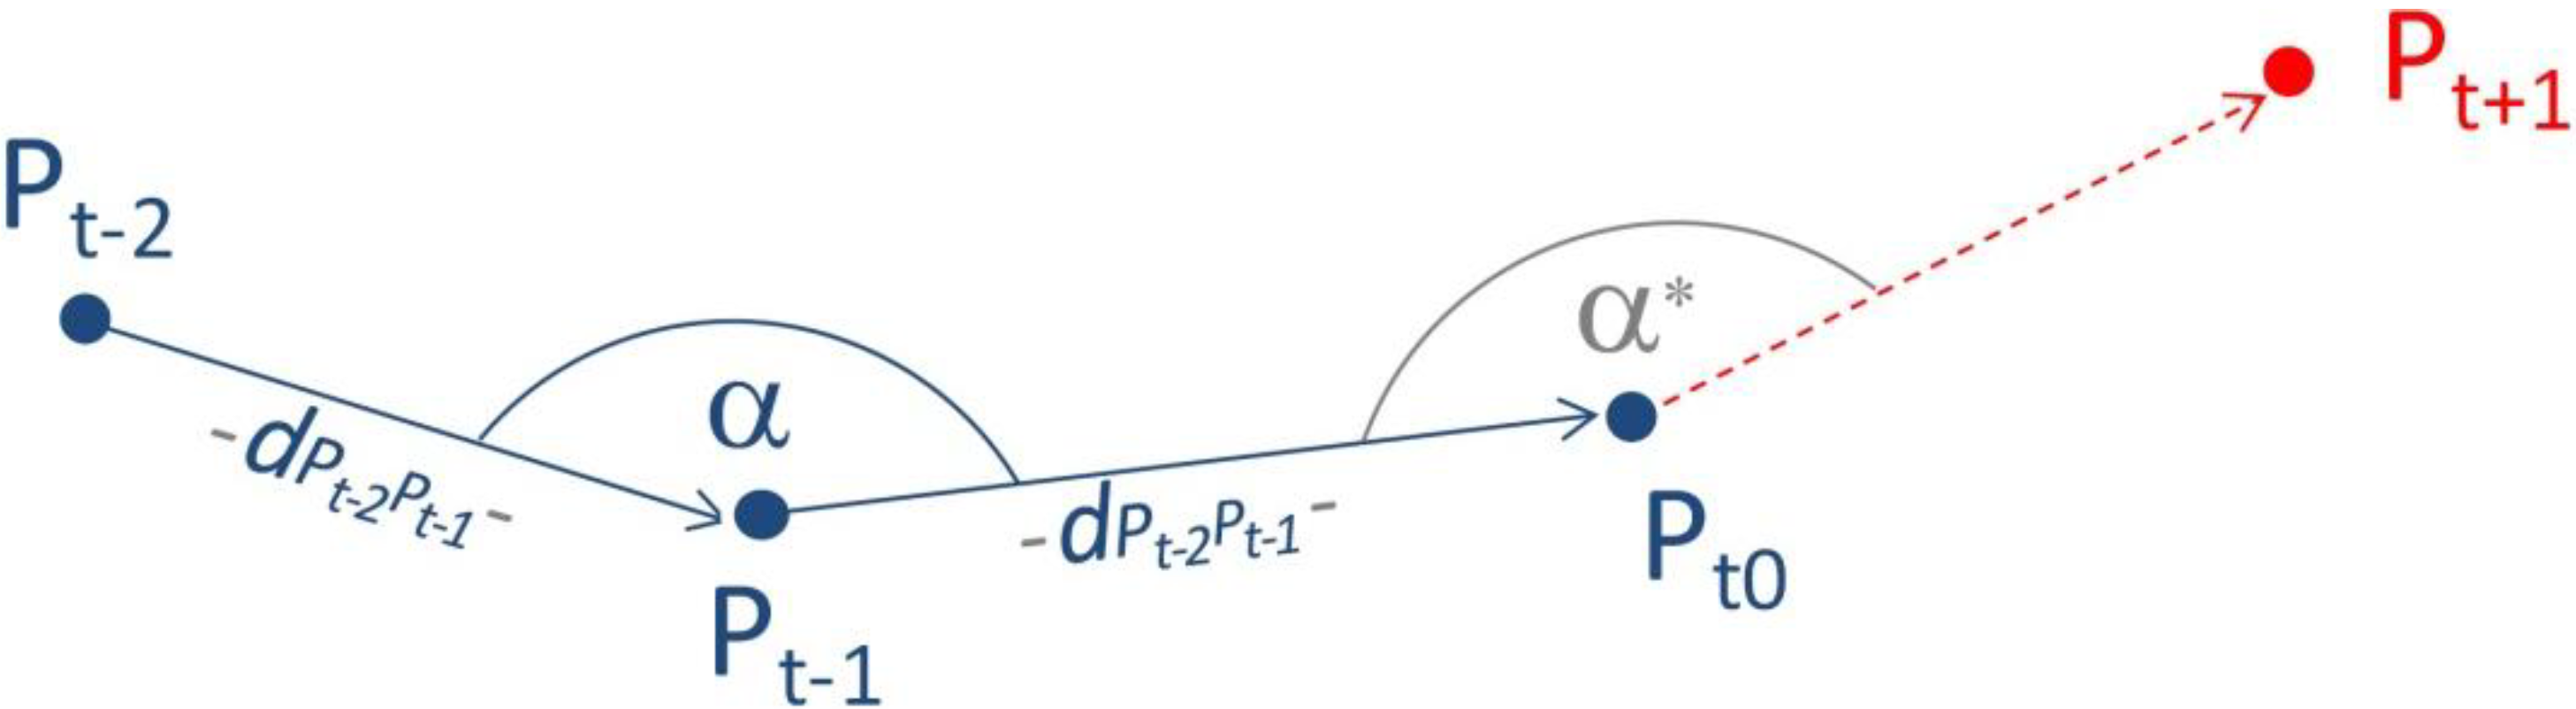
4.2. Lightning Cluster Identification and Tracking

First of all lightning point data, detected by LINET network, were separated into cloud-ground lightning (CG) and in-cloud-lightning data (IC). To eliminate outliers, only IC data with an altitude between 2 km and 18 km were used. If needed, the lightning point data set can be confined by temporal or spatial range limitations.
In the second step, lightning point data were separated into 10 min time intervals. Each time interval contained at least 10 points. Afterwards, all points within each time interval were grouped into lightning clusters, using the simple distance based clustering method as described in [46] with a distance-threshold of 6 km. Thus, a buffer with a radius of 6 km was applied to each point. All points within overlapping buffers were agglomerated towards the same group. The resulting groups represent lightning clusters within the according time interval.
In the third step, identified clusters were tracked. Clusters, which spatially overlap their 2D convex hulls within two time sequences, were detected and allocated. This tracking approach was based on the method of [34,37]. Cluster splitting and merging were considered as well. A minimum cluster number size of 10 points was defined. Increasing this threshold leads to the elimination of smaller clusters.
For cluster identification and cluster tracking we only took the IC points into account. The model might be improved by considering CG points as well. However, with our interactive tool CG point data can be visualized. We do not use the term “lightning cell”, because determined clusters differ from the term “cell” which refers to thunderstorm clouds in meteorology. Within a storm track several cells can appear and disappear in connection with strong and spatial narrow interactions. Thus, the cluster itself cannot always be seen as a group of lightning produced from the same cell due to the temporal sampling in the determination of a cluster.

4.3. Lightning Nowcasting and Evaluation

In the fourth step, clusters and cluster features were nowcasted. We decided to project the prospective situation of the clusters in 10, 20, and 30 min (Δt). Our approach is purely geometric for the demonstration purpose. The prediction of the future cluster location was based on the extrapolated cluster centroid as shown in Figure 4 and Equation (1). We established a simple method predicated on velocity and direction change. Thereby, we took the last three track centroids into account. Based on the positions of the previous cluster centroids (Pt k), we determined the velocity vector of the last two cluster centroids. We assume a current cluster speed calculated by the mean of the velocity (v) of the last two cluster centroids. Furthermore, direction changes (angle α) were considered. For the value of α, it is advisable to configure a threshold in order to avoid the tight curves of the nowcasted cluster track. Furthermore, α* (see Figure 4) correlates with the predicted future time Δt. In other words, the longer the nowcasted time the larger the α*. If only the last two centroids of a cluster track exist, the angle α* will be given a value of 180°. The method is explained for the 2D case, but it was established for the 3D scenario.
Figure 4. Cluster centroid nowcasting concept (2D example).
Ijgi 02 00817 g004
Ijgi 02 00817 i001
Nowcasting of cluster features, such as cluster density, cluster area, and cluster extension, can be performed based on the feature values (p) of the last two to four time steps. A possible extrapolation method for lightning cluster features might be polynomial regression (of the second order):
Ijgi 02 00817 i002
Equation (2) finds the coefficients of a polynomial function p(x) of degree n which matches the given data, p(xi) to yi, in a least squares sense. The outcome p is a row vector of length n + 1 containing the polynomial coefficients in descending powers. Disadvantages are resulting values which are unrealistically high or below zero.
We decided to establish a demonstrative rule based prediction method for cluster feature nowcasting, which is based on cluster feature values of the last three time steps. Thus, only the tendency of value change (increasing/decreasing of ca. 10/20/…%) is reflected in the predicted cluster feature values.
Extrapolated cluster centroids can be evaluated and improved by establishing a learning model. Such model compares predicted cluster centroid locations and cluster features with updated ones. After each update the model can adapt nowcast parameters (e.g., threshold for α*) in order to improve prediction accuracy. The mean differences of centroid positions and cluster features between predicted and updated data lead to an uncertainty for the prediction. Furthermore, measurement errors can be incorporated in the certainty model. We assume the same 2D-accuracy for cluster centroids as for detected lightning (acc = 150 m). It therefore follows that an uncertainty (u) for nowcasted centroids (Pt + k) can be achieved with a basic approach, considering the future time step (k), and the maximum inaccuracy between the last two cluster centroids as shown in Equation (3):
Ijgi 02 00817 i003
As a result, the 2D-uncertainty for nowcasted cluster centroids assumes a value of 450 m for a 10 min prediction (k = 1), 600 m for 20 m (k = 2), and so forth.
For the altitude average the same equation could be applied, whereby a centroid average of about 10 km leads to an altitude accuracy of 1 km (acc).
We applied our basic tracking and nowcasting approach (as described in Section 4.1, Section 4.2, Section 4.3) to the test data set. Altogether, 19 lightning tracks were detected. Nowcasting can be performed for any moment of time within the temporal range which is defined as “now”. To evaluate the results a past analysis was done whereby the test data were separated into 10 min steps and nowcasted centroids were determined. Subsequently, predicted cluster centroid locations and cluster features were compared with updated ones.

4.4. Interactive Visual and Statistical Analysis of Dynamic Lightning Cluster Features

In the fifth step of our workflow an analysis concept for visual and statistical exploration of past and nowcasted cluster features is established. It should be mentioned that the main focus of this work is not on achieving a perfect tracking and nowcasting solution but, rather, on enabling users to conduct visual and statistical analysis of tracked and nowcasted lightning cluster features in an integrated system.

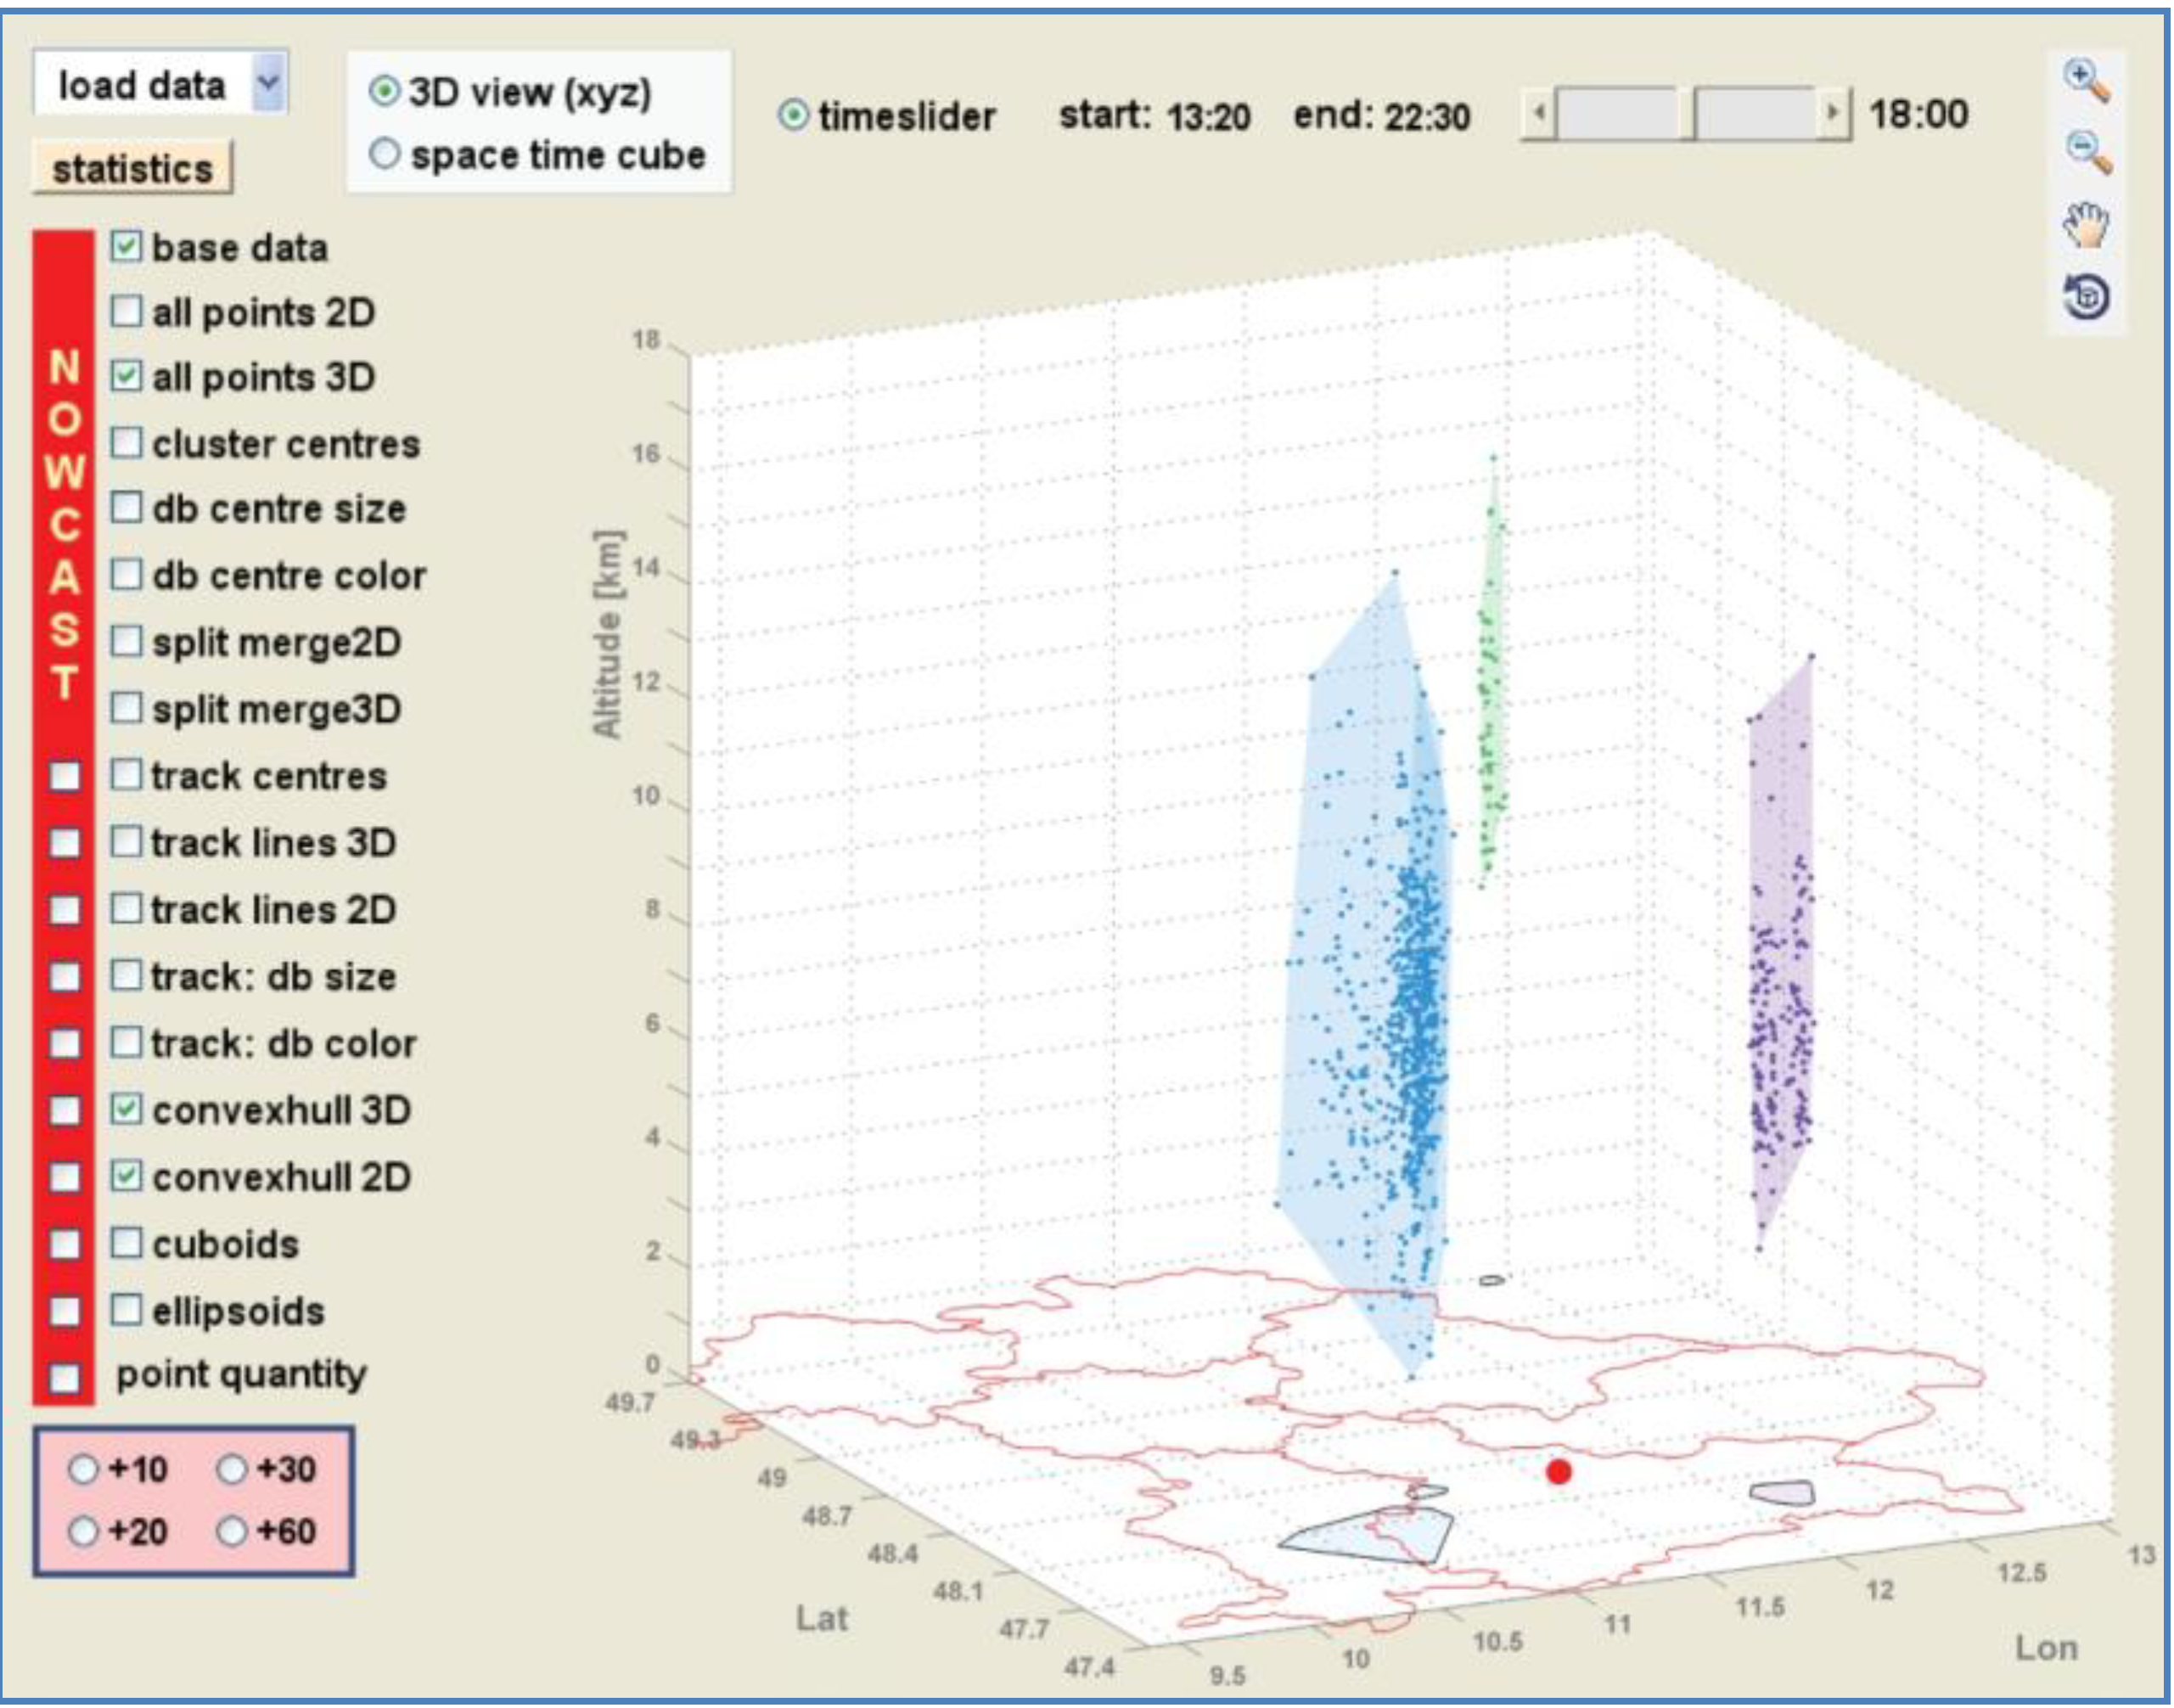
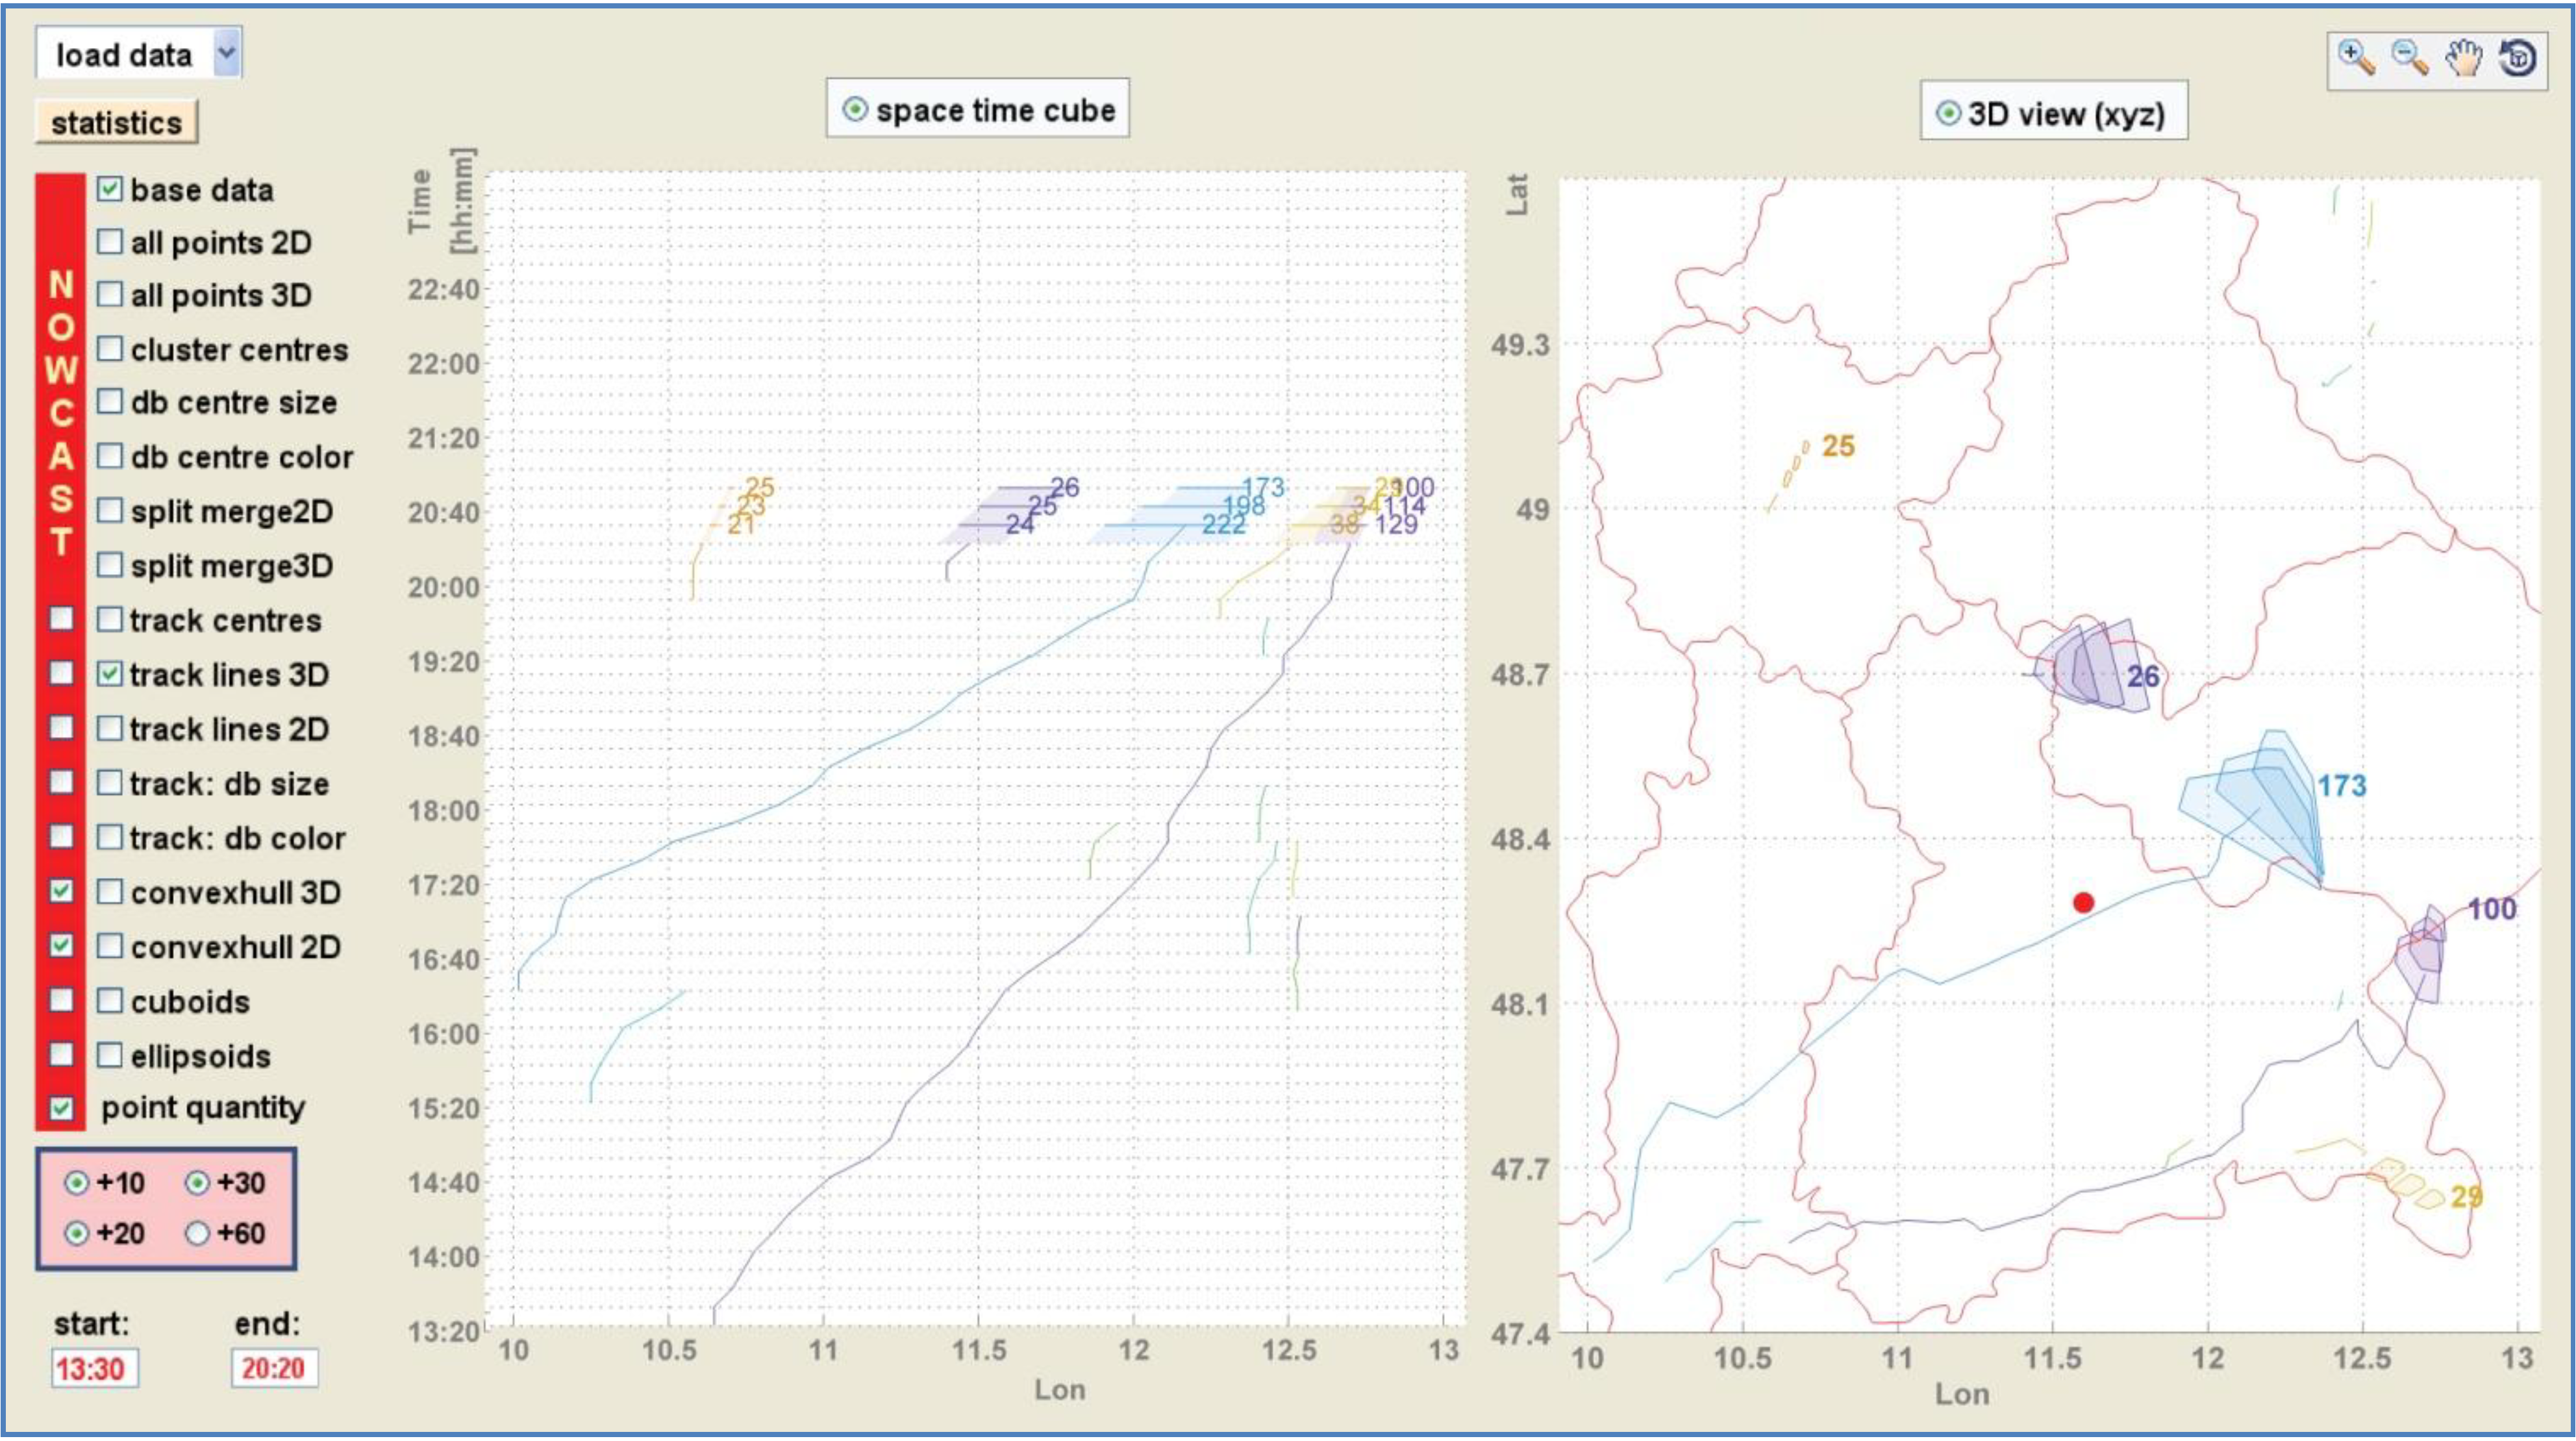
4.4.1. Lightning Graphic User Interface (GUI)

To provide an explorative analysis of the dynamic lightning cluster data, an interactive graphic user interface (GUI) was designed. The lightning-GUI including a 3D-view and a STC approach was first introduced in [27] and within this work the visualization of nowcasted cluster features was improved and extended.
A lightning or thunderstorm expert needs to have visual and statistical information about the dynamic of each lightning cluster and its features within a temporal and spatial range of interest. Relevant cluster and track features are listed in Table 2 together with information about 2D/3D appearance.
Table 2. Visual presentation of past and predicted lightning information.
2D3DSTC
visual presentationcluster featurespoint cloud
centroid point
extensionconvex hull
ellipse
ellipsoid
rectangle
cuboid
* uncertainty buffer
track featurestrack line
track lane
* uncertainty buffer
* only of nowcasted cluster/track.
Representative visualizations of a tracked and nowcasted lightning cluster in 3D space are the representation of the point cloud, the centroid, and the 3D cluster extension in the form of: convex hull, ellipsoid, and cluster cuboid. Additionally, an uncertainty buffer can be illustrated for the nowcasted clusters. The past and predicted 3D lightning tracks can be visualized by a line or a lane. Furthermore, different visual cluster features can be illustrated on the track. Likewise, a presentation of an uncertainty buffer can be applied for the nowcasted track.
Graphic variables to cover all possible graphic variations on a map have already been delineated in [47]. Bertin distinguished between seven visual variables: form, color, texture, size, position, orientation, and value. He combined these visual variables with a visual semantics in order to link data attributes to visual elements. Furthermore, in [12], geo analysis tasks and, therefore, specifies appropriate visual variables are described. Table 3 lists seven graphic variables based on [47] which can be adjusted for an appropriate visualization of lightning cluster and track features. For example, changeable graphic variables of the convex hull surface (which represents a lightning cluster in form of a 2D polygon) are: color, texture, luminance, transparency, and saturation. These variables have to be carefully chosen to provide an appropriate presentation for the data viewer/analyzer. In this context, cartographic principles (readable, correct, complete, and esthetic visualization) have to be complied with as much as possible. It should be noted that the graphic variables of the cluster centroid can depend on the quantity/intensity of the cluster points.
Table 3. Graphic variables of cluster and track features.
cluster featurestrack features
point cloudcentroid (incl. cluster density information)convex hull surfaceconvex hull edgesellipse/ellipsoid interiorellipse/ellipsoid edgesrectangle/cuboid interiorrectangle/cuboid edges* uncertainty buffertrack linetrack lane edgestrack lane interior*uncertainty buffer
Form
Color
Texture
Luminance
Size
Sharpness
Transparency
Saturation
* only for nowcasted cell/track
An interactive GUI enables the user to explore and analyze data. Within our GUI-concept for lightning clusters the user should be able to:
  • load in lightning point data (x,y,z,t)
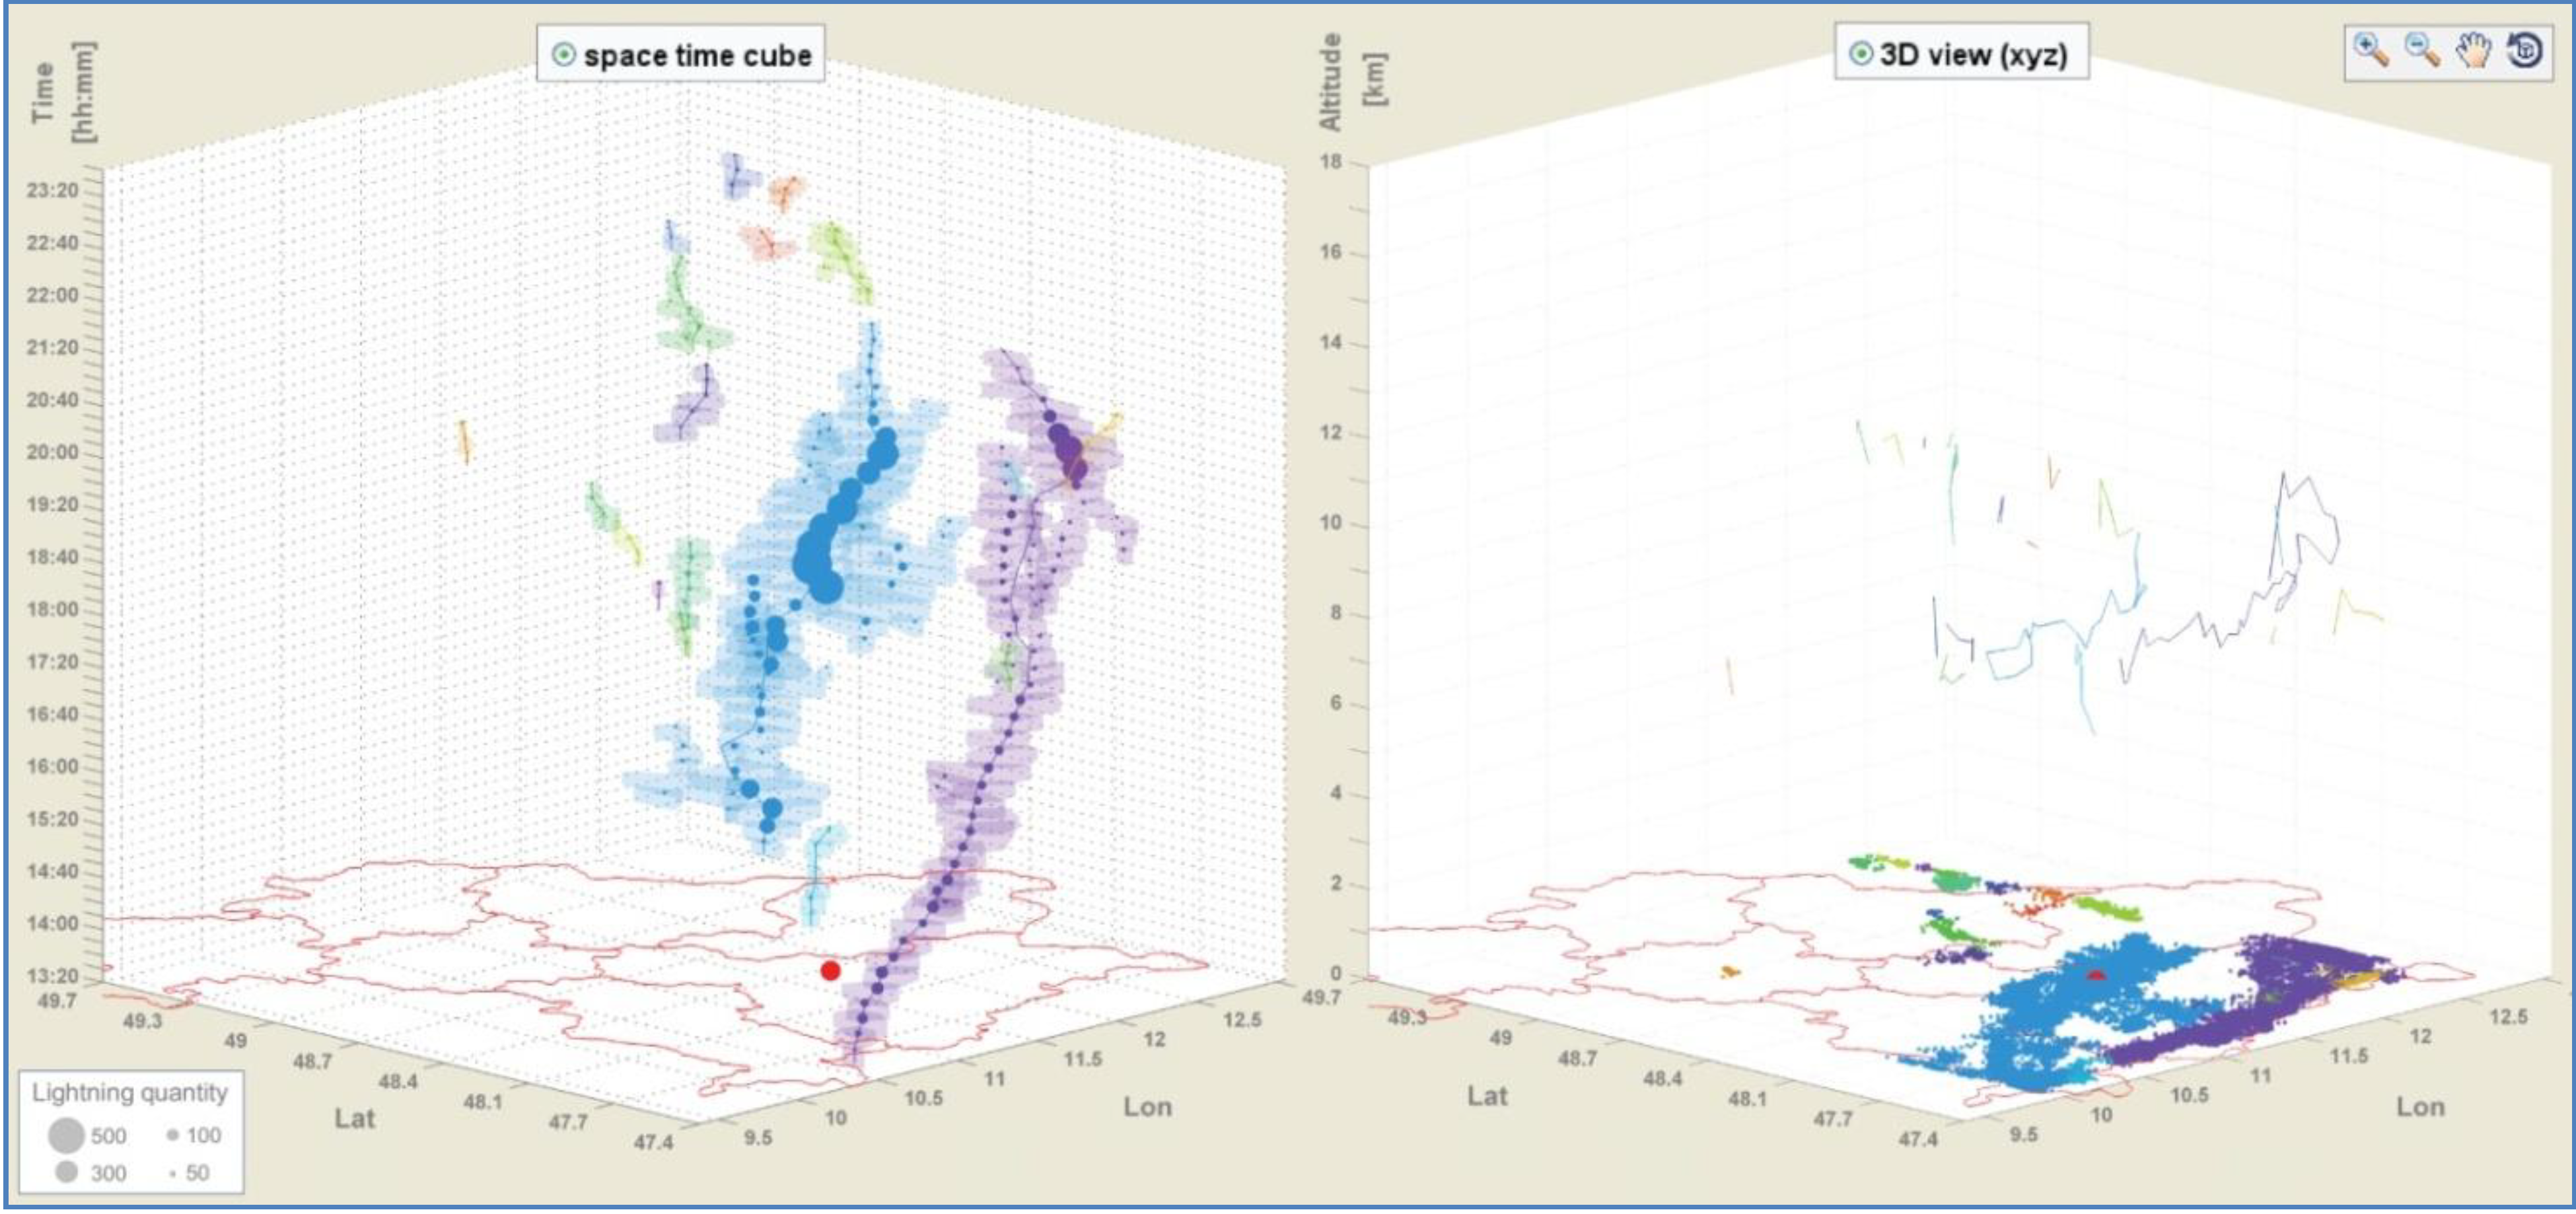
  • choose between 3D-view (x-y-z) and STC (x-y-t)
  • choose/combine between different cluster and track feature visualizations, see Table 2
  • enable nowcasting for the next 10, 20, 30, …, 60 min
  • adapt graphic variables
  • set limits for temporal and spatial range
  • explore plotted data via zoom, pan, rotate, animate
To provide the best performance, all graphic features should be preprocessed before using the GUI.
Two main visualization concepts are implemented: the 3D view and the STC. The 3D plot gives altitude information, while time information is missing. The advantage of the STC is that it provides the information which is missing in the 3D plot. Within the 3D plot, overlapping might arise when clusters occur at different moment of times at the same location. The STC solves this problem and provides the missing insight. While the altitude information is missing in the STC, the combination of both plots is complementary and provides, through its interactive user interface, a variety of information about the lightning cluster dynamics. By changing the view perspective within the STC, an observation from above (2D-view) enables the same view and information as the traditional 2D plot, as shown in Figure 1. The GUI enables the user to combine or switch between different visualization options for lightning cluster and cluster-track features, demonstrated in Figure 5, Figure 6, Figure 7, Figure 8.
Figure 5. Lightning GUI for explorative analysis of past and nowcasted data.
Ijgi 02 00817 g005
Figure 6. STC of lightning tracks (Left), 3D view of lightning tracks (Right).
Ijgi 02 00817 g006
Figure 7. Tendency of value change in nowcasted cluster features (extension and density).
Ijgi 02 00817 g007
Figure 8. Probability buffer for nowcasted cluster centroids and cluster convex hulls.
Ijgi 02 00817 g008

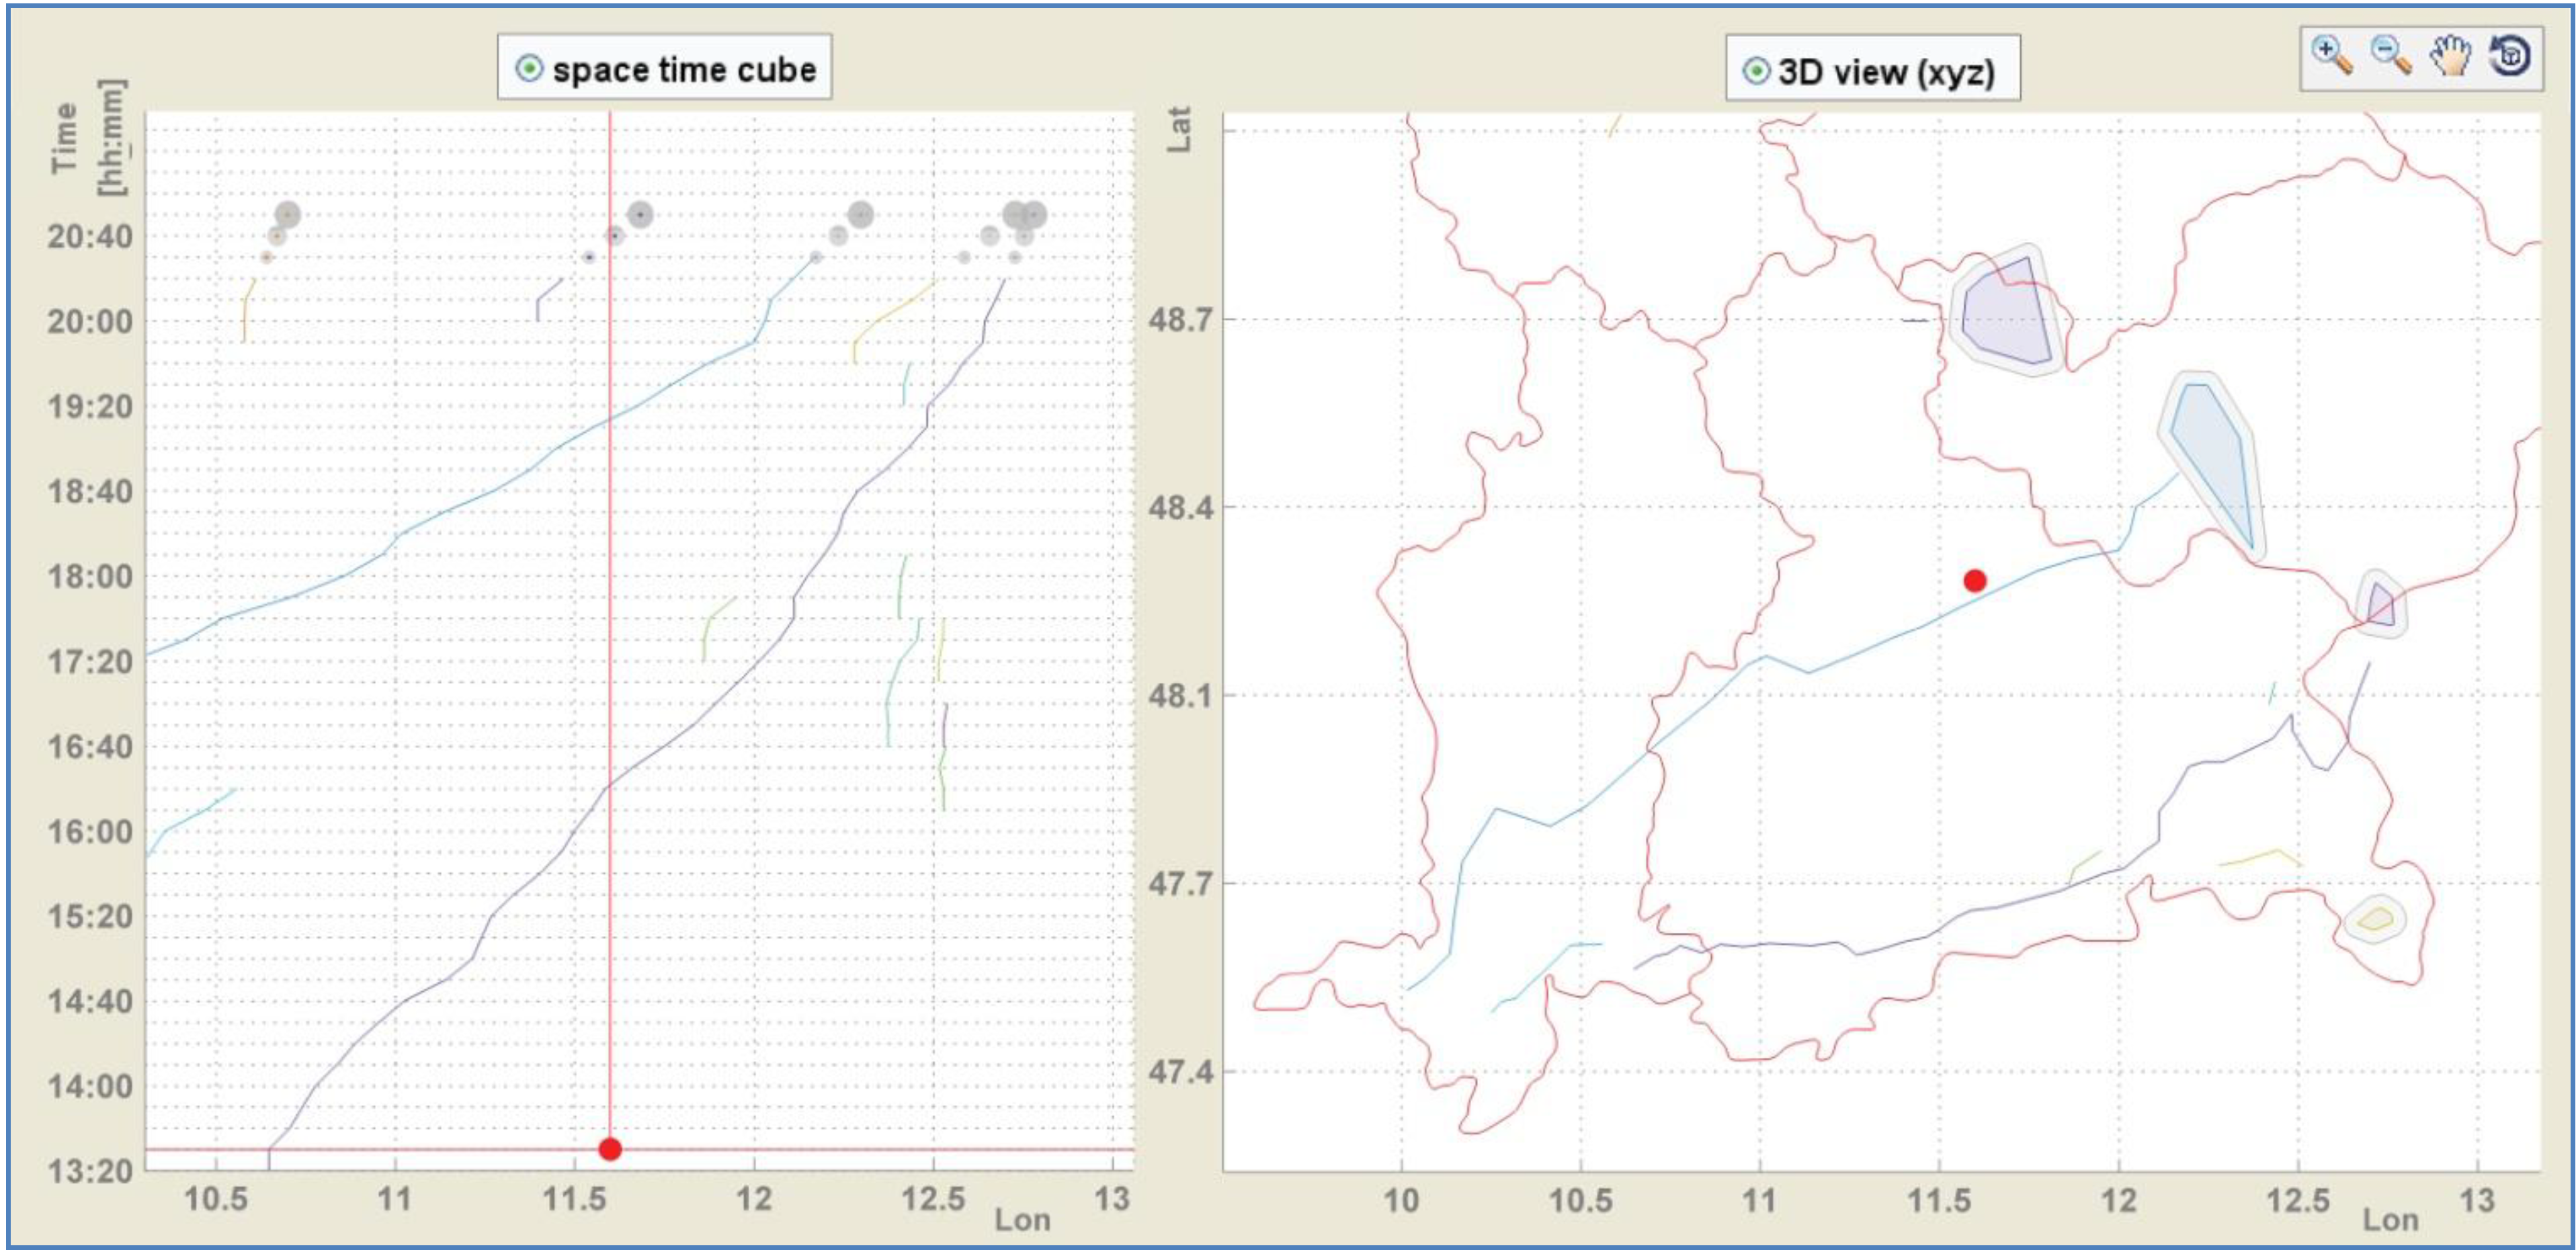
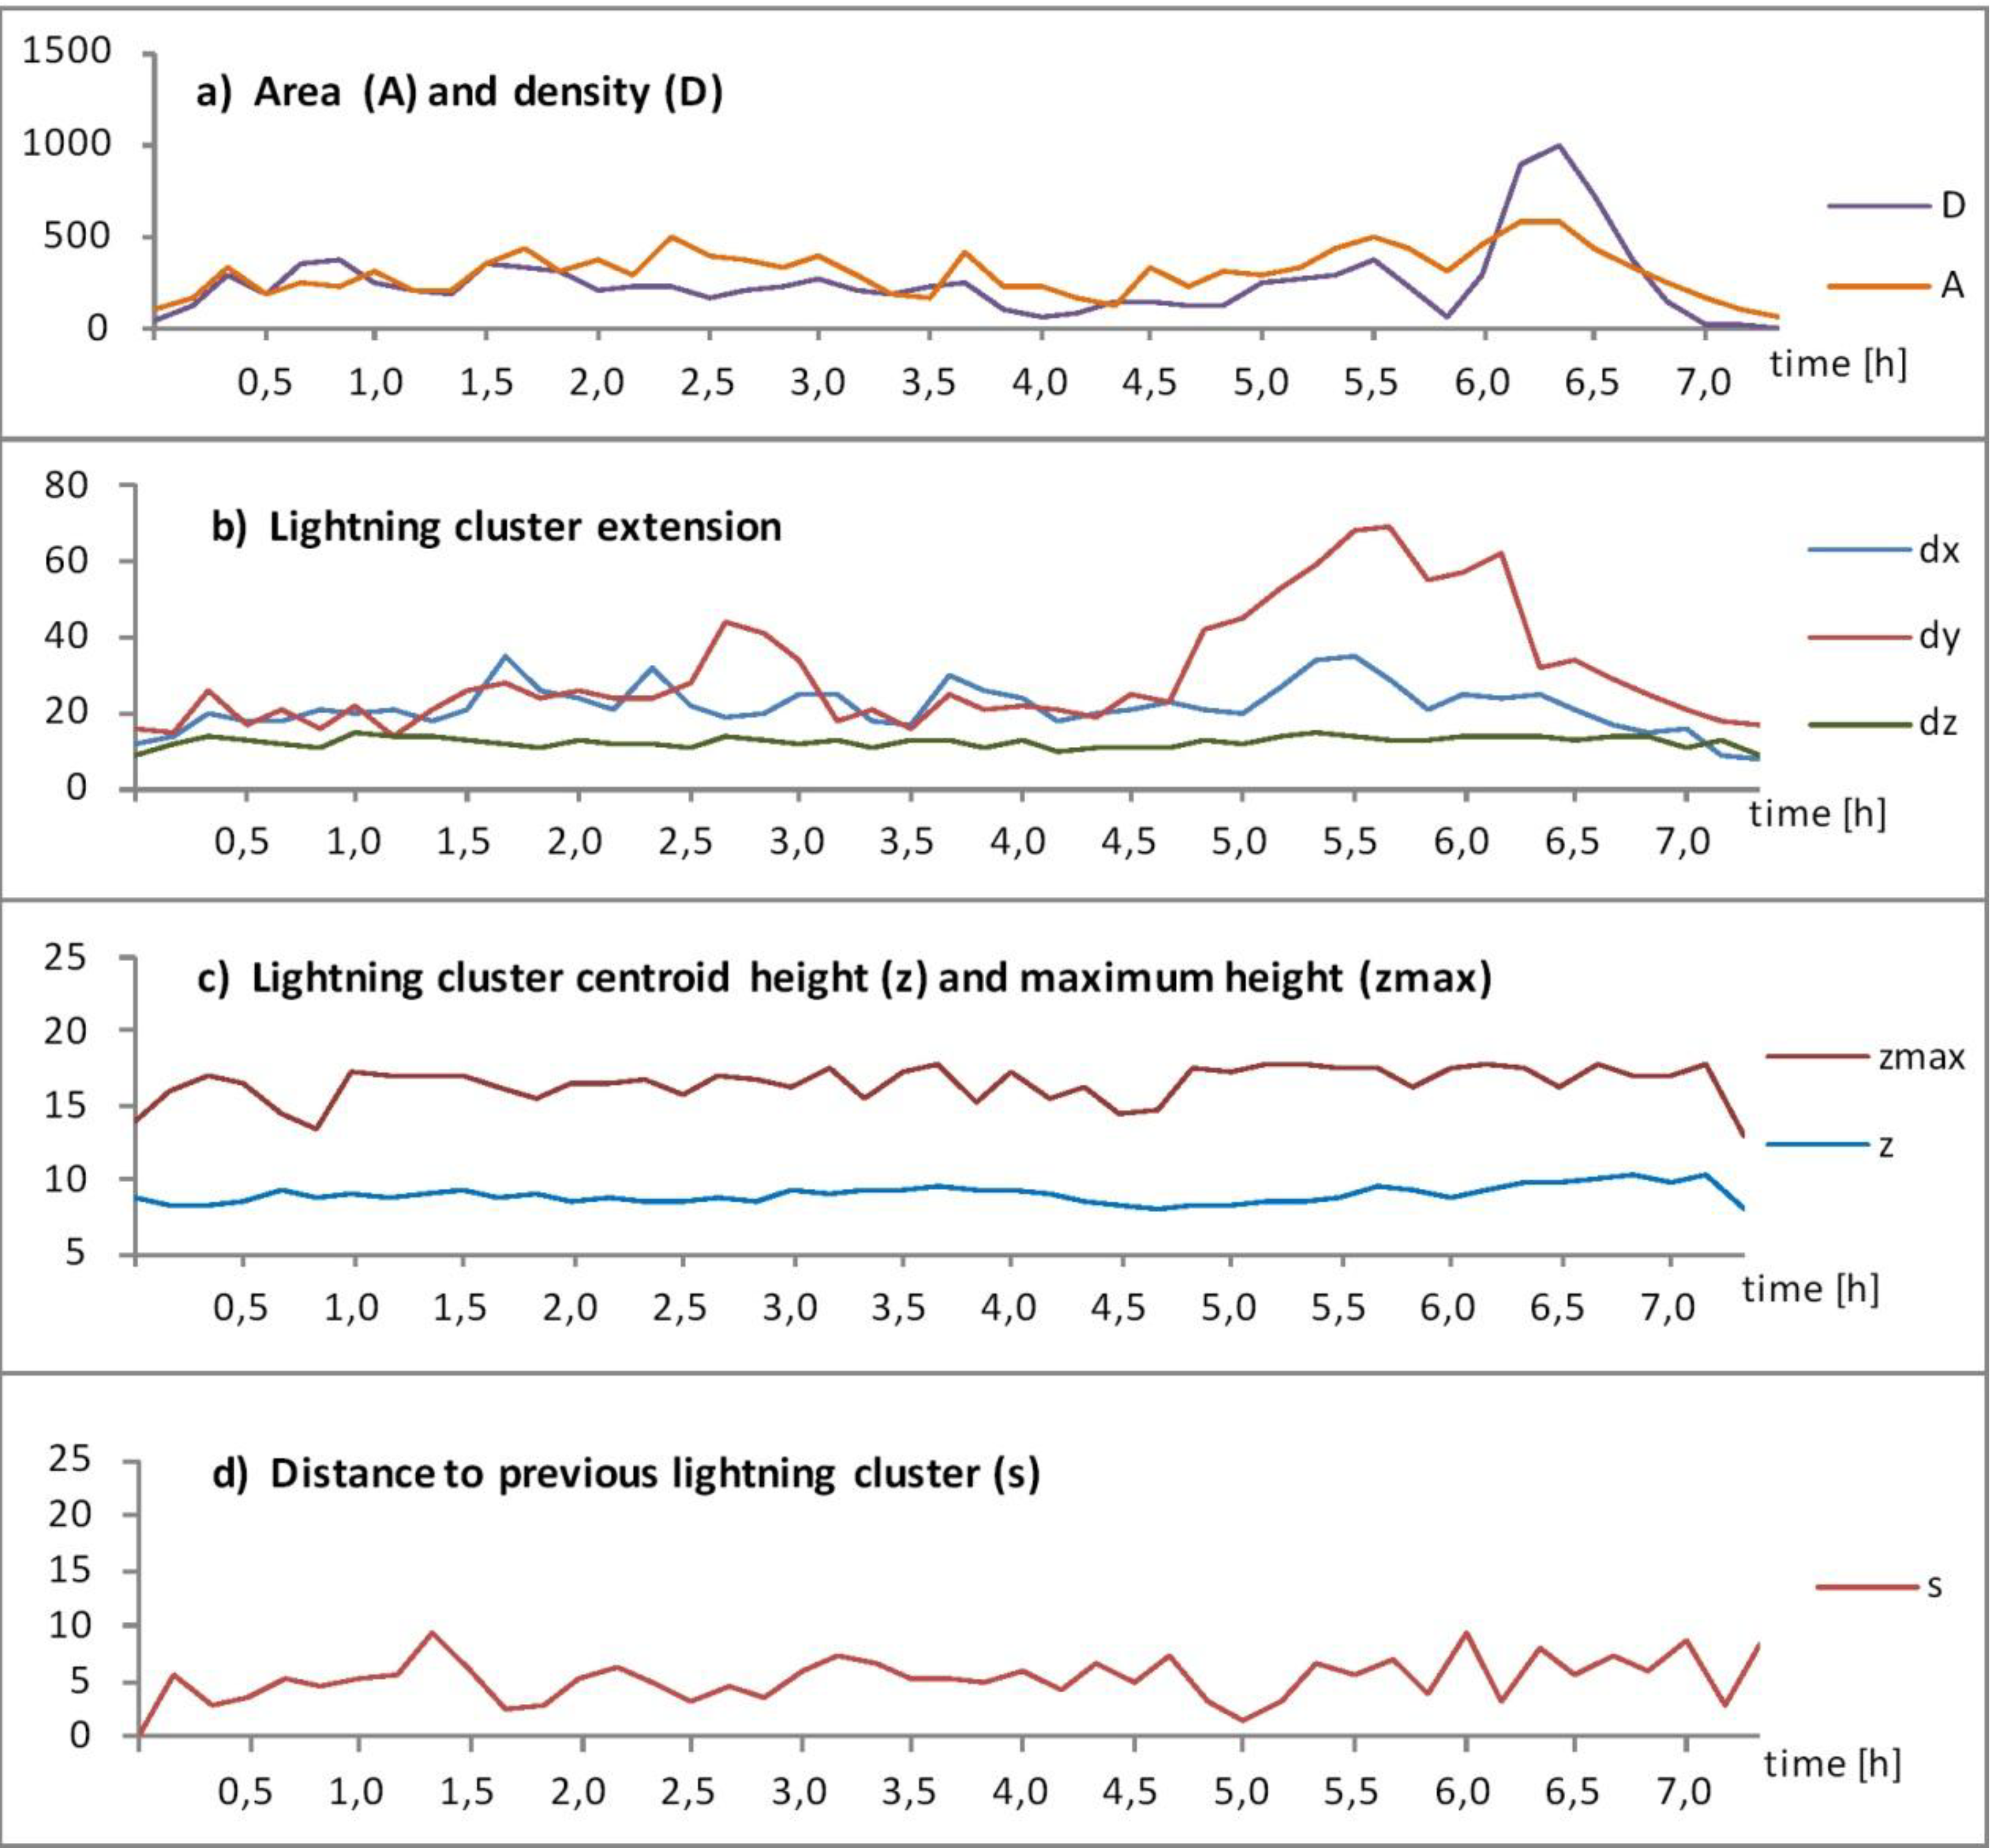
4.4.2. Statistical Analysis of Dynamic Lightning Cluster Features

In addition, essential for lightning cluster feature analysis are statistical data derived from the processed cluster tracking/nowcasting. Table 4 lists all important statistical data of lightning clusters and tracks. These statistical data could be included in the lightning GUI, thus, currently highlighted/selected data (clusters or tracks) could be illustrated and analyzed with the help of additional tools (e.g., by using diagrams).
Table 4. Statistical analysis of past and predicted lightning information.
statistical analysiscluster features point coordinates
 centroid coordinates
 max/min of altitude
 quantity/intensity, area, volume
 spatial extension
 velocity, acceleration
 distance to last cluster centroid
 uncertainty of nowcasted cluster centroids and cluster features
track features length (distance) and duration
 variations of cluster features (max, min)
track size sum of clusters
 sum of points
 sum of area/volume

5. Results and Discussion

5.1. Lightning Cluster Tracking and Nowcasting

About 65% of the nowcasted cluster centroids could be predicted with an accuracy (distance towards the updated location) of less than 10 km. About 25% of the nowcasted cluster centroids could be predicted with a precision between 10 and 20 km. Cluster features nowcasting bears on our rule based cluster feature prediction method (as described in Section 4.3). As only aggregated data are considered within the prediction model, the prediction calculation time is indeed much faster than considering all initial points.

5.2. Visual and Statistical Analysis Using a Lightning GUI

The established visualization concept for past and nowcasted dynamic lightning clusters and cluster features was implemented in an interactive GUI. The spatial and temporal data frame can be limited to concentrate on specific areas of interest. Furthermore, pan, zoom, and rotation tools enable interactive discover. By activating the time slider, specific time intervals can be investigated through plots or animations.
Figure 5 provides an overview of all functions of the implemented GUI. On the left, all features of past and nowcasted clusters and tracks can be selected. Nowcasting is provided for plus 10/20/30/60 min. The “statistics button” enables the statistical analysis. Either 3D view or the STC can be selected for the current settings of the loaded data. The use of the time slider leads to temporal range restriction. Currently, lightning points and clusters which occurred between 5.50 pm and 6 pm (on 22.07.2010) are illustrated in 3D. Additionally, cluster convex hulls are shown in 3D and also in 2D (projected to an altitude of zero and combined with the base data of upper Bavaria districts and Munich airport—red dot).
A direct visual comparison of STC and 3D is possible, as shown in Figure 6. All clusters allocated to the same track are distinguished by semi-transparent colors. Two larger tracks can be identified (purple and blue cluster tracks). The STC includes cluster extensions/scopes with semi-transparent 3D convex hulls. Furthermore, track lines and cluster centroids are drawn with a spherical radius indicating each cluster point quantity/intensity. Another option to reflect cluster point densities is to define different cluster polygon luminances depending on each cluster density. The 3D view comprises 3D track lines and all 2D lightning points are colored based on the associated track.
In Figure 7 also, nowcasted cluster features are shown. On the left, the STC and on the right an above-ground view. The track lines are the only information about the cluster history. Of course, other features can be added to the graphics. The current time (“now”) for the nowcast analysis was set to 8:20 pm, at which time altogether five cluster tracks were present. Cluster extensions and densities for the next 30 min (+10, +20, +30) were predicted. Applying our method (described in Section 4.1, Section 4.2, Section 4.3, the three nowcasted time steps include a feature tendency based on the last three time steps. Figure 7 clearly illustrates a change of cluster extensions (convex hulls) and cluster intensity (predicted number of lightning points). Another option to visualize cluster intensity would be through a density based cluster centroid size or color (abbreviated in the GUI: “db centre size/color”). Likewise, further statistical cluster and track values (as in Table 4) are nowcasted considering the feature tendency. The STC view was set to a side perspective viewed from the south, but it can be changed by interactive use of the GUI (via pan and rotate).
Figure 8 offers an exemplary illustration of the implemented concept for certainty/probability visualization of nowcasted cluster features. Using the same prediction settings as in Figure 7, the STC plot on the left represents nowcasted cluster centroids surrounded by spheres (buffers) which reflect the possible spatial range for the predicted centroids. A semitransparent grey color was used for the buffer. The probability buffer ratio correlates with the future time step (8:20 pm +10, +20, +30 min). Furthermore, geographic base data are shown, and the red dot illustrates the Munich Airport. The vertical red line clearly indicates when and in what concentration lightning clusters are located above the airport. The inclusion of additional visual features (e.g., cluster quantities as in Figure 7), supports the analysis of potential dangers caused by lightning. On the right hand side, nowcasted cluster convex hulls with probability buffers are visualized only for one future step (+30 min). The buffer size was determined using our nowcasting evaluation concept, as described in Section 4.3
The GUI also enables an interactive statistical analysis of the current lightning data. All statistical values of cluster and track features listed in Table 4 are provided. Maximum values are highlighted. Furthermore, nowcasting evaluations are presented.
Figure 9 illustrates the estimated cluster feature predictions of the longest track of the test data set. Cluster area, density, extension, height, and movement distance were determined for every past time step. The X-axis represent the cluster life time, starting from time = 0, when the cluster first arises until it disappears. For this example, it is evident that cluster area and density correlate positively with each other.
Figure 9. Estimated lightning cluster features of an exemplary track during its entire lifetime: (a) cluster area A in (km2) and density D; (b) cluster 3D spatial extension dx, dy, dz in (km); (c) cluster centroid height z and maximum height zmax in (km); (d) cluster distance to previous cluster s in (km).
Ijgi 02 00817 g009

6. Conclusions and Outlook

This work has presented an interactive framework for visual and statistical analysis of tracked and nowcasted lightning data. A workflow was presented, incorporating identification, tracking, and nowcasting of lightning cluster. In particular, an interactive graphic user interface was developed in order to support investigation of the dynamics of lightning cluster and track features. A broad set of visual investigative methods (e.g., 3D view, Space-Time-Cube, time slider tool, nowcast-tool) was integrated and implemented. Furthermore, a statistical lightning data analysis was presented along with a concept to determine and visually present the uncertainty of the lightning cluster prediction. To further develop the idea of prediction will help to understand the importance of this work.
Our lightning GUI provides a set of functions to enable interactive visual analysis of the data, and in particular their change in time and space. Thus, users can explore lightning cluster and track features—their history and their evolution. Together with statistical information it may support decision making in cases when lightning is a potential hazard, for example in whether forecasting or flight scheduling.
Regarding meteorology, the proposed work can be extended towards two modules: (1) thunderstorm visualization and (2) thunderstorm nowcasting. For these modules, synchronized real-time information from radar, satellite images, and lightning data have to be considered. Including such data could lead to an improved prediction and evaluation of the nowcasted lightning cells. In particular, clouds with the potential of upcoming lightning activities could be detected and considered in the model.
Our goal was not to completely propose new visualization techniques; rather, we investigated the feasibility of existing visualization methods for new data scenarios and their integration in a user-friendly system. Our approach demonstrated the potential of interactive visual analysis using an exemplary dataset (lightning points), which was not chosen for a specific purpose. For future work, it is our responsibility to evaluate the proposed methods. In particular, tests with lightning experts and interested lay people will be implemented, possibly in a crowd-sourcing environment, to verify and improve the GUI usability. Furthermore, we are considering transforming the GUI into a web application. In doing so, we want to enable users (e.g., lightning experts) to upload their own data (lightning point data containing time information) and interactively analyze the cluster dynamics by providing different visual representations. A main challenge will be to provide a user friendly performance within the needed web processing task. It is also planned to set up a Bayesian Network for prediction parameter learning.

Acknowledgments

The authors gratefully acknowledge Nowcast Company for providing lightning test dataset and the support of the Graduate Center Civil Geo and Environmental Engineering at Technische Universität München, Germany.

Conflicts of Interest

The authors declare no conflict of interest.

References

  1. Generalisation of Geographic Information: Cartographic Modelling and Applications; Mackaness, W.A.; Ruas, A.; Sarjakoski, L.T. (Eds.) Elsevier: Amsterdam, The Netherlands, 2007; p. 386.
  2. Andrienko, G.; Andrienko, N.; Dykes, J.; Fabrikant, S.I.; Wachowicz, M. Geovisualization of dynamics, movement and change: Key issues and developing approaches in visualization research. Inf. Vis. 2008, 7, 173–180. [Google Scholar] [CrossRef]
  3. Keim, D.; Andrienko, G.; Fekete, J.-D.; Görg, C.; Kohlhammer, J.; Melançon, G. Visual Analytics: Definition, Process, and Challenges. In Information Visualization: Human-Centered Issues and Perspectives; Springer: Berlin, Germany, 2008. [Google Scholar]
  4. Turk, A. Designing Advanced GIS Visualisations Using Cognitive Ergonomics Theories, Models and Procedures. In Proceeding of the 16th International Cartographic Conference, Cologne, Germany, 3–9 May 1993.
  5. Krisp, J.M.; Peters, S.; Murphy, C.E.; Fan, H. Visual bandwidth selection for kernel density maps. Photogrammetrie Fernerkundung Geoinf. 2009, 2009, 445–454. [Google Scholar] [CrossRef]
  6. Krisp, J.M.; Peters, S. Visualizing Dynamic 3D Densities: A Lava-Lamp Approach. In Proceeding of the 13th AGILE International Conference on Geographic Information Science, Guimaraes, Portugal, 10–14 May 2010.
  7. risp, J.M.; Peters, S.; Burkert, F.; Butenuth, M. Visual Identification of Scattered Crowd Movement Patterns Using a Directed Kernel Density Estimation. In Proceedings of SPM2010 Mobile Tartu, Tartu, Estonia, 26–28 August 2010.
  8. Peters, S.; Krisp, J.M. Density Calculation for Moving Points. In Proceeding of the 13th AGILE International Conference on Geographic Information Science, Guimaraes, Portugal, 10–14 May 2010.
  9. Peters, S. Quadtree-and octree-based approach for point data selection in 2D or 3D. Ann. GIS 2013, 19, 37–44. [Google Scholar] [CrossRef]
  10. Krisp, J.M.; Peters, S. Directed kernel density estimation (DKDE) for time series visualization. Ann. GIS 2011, 17, 155–162. [Google Scholar] [CrossRef]
  11. Kraak, M.J. The Space-Time Cube Revisited from a Geovisualization Perspective. In Proceeding of the 21st International Cartographic Conference, Durban, South Africa, 10–16 August 2003; pp. 1988–1996.
  12. Andrienko, N.; Andrienko, G. Exploratory Analysis of Spatial and Temporal Data; Springer: Berlin, Germany, 2006. [Google Scholar]
  13. Andrienko, N.; Andrienko, G. A visual analytics framework for spatio-temporal analysis and modelling. Data Min. Knowl. Discov. 2012, 27, 55–83. [Google Scholar]
  14. Andrienko, G.; Andrienko, N.; Keim, D.; MacEachren, A.M.; Wrobel, S. Challenging problems of geospatial visual analytics. J. Vis. Lang. Comput. 2011, 22, 251–256. [Google Scholar] [CrossRef]
  15. Andrienko, G.; Andrienko, N.; Jankowski, P.; Keim, D.; Kraak, M.-J.; MacEachren, A.; Wrobel, S. Geovisual analytics for spatial decision support: Setting the research agenda. Int. J. Geogr. Inf. Sci. 2007, 21, 839–857. [Google Scholar] [CrossRef]
  16. Andrienko, G.; Andrienko, N.; Demsar, U.; Dransch, D.; Dykes, J.; Fabrikant, S.I.; Jern, M.; Kraak, M.-J.; Schumann, H.; Tominski, C. Space, time and visual analytics. Int. J. Geogr. Inf. Sci. 2010, 24, 1577–1600. [Google Scholar] [CrossRef]
  17. NVAC PNNL: Information Visualization and Visual Analytics. Available online: http://vis.pnnl.gov/ (accessed on 21 August 2013).
  18. VisMaster VisMaster»Visual Analytics—Mastering the Information Age. Available online: http://www.vismaster.eu/ (accessed on 21 August 2013).
  19. MOVE MOVE—WG 4: Visual Analytics for Movement and Cognitive Issues. Available online: http://www.move-cost.info/ (accessed on 21 August 2013).
  20. MacEachren, A.M.; Kraak, M.J. Research challenges in geovisualization. Cartogr. Geogr. Inf. Sci. 2001, 28, 3–12. [Google Scholar] [CrossRef]
  21. Virrantaus, K.; Fairbairn, D.; Kraak, M.-J. ICA research agenda on cartography and GI science. Cartogr. J. 2009, 46, 63–75. [Google Scholar] [CrossRef]
  22. Cook, K.; Grinstein, G.; Whiting, M.; Cooper, M.; Havig, P.; Liggett, K.; Nebesh, B.; Paul, C.L. VAST Challenge 2012: Visual Analytics for Big Data. In Proceedings of 2012 IEEE Conference on Visual Analytics Science and Technology (VAST), Seattle, WA, USA, 14–19 October 2012; pp. 251–255.
  23. Krisp, J.M.; Peters, S.; Polous, K.; Fan, H.; Meng, L. Getting in and out of a Taxi: Spatio-Temporal Hotspot Analysis for Floating Taxi Data in Shanghai. In Proceedings of Networks for Mobility 2012, Stuttgart, Germany, 27–28 September 2012.
  24. Kitagawa, N.; Brook, M.; Workman, E. Continuing currents in cloud-to-ground lightning discharges. J. Geophys. Res. 1962, 67, 637–647. [Google Scholar] [CrossRef]
  25. Betz, H.D.; Schmidt, K.; Oettinger, W.P. LINET—An International VLF/LF Lightning Detection Network in Europe. In Lightning: Principles, Instruments and Applications; Betz, H.D., Schumann, U., Laroche, P., Eds.; Springer: Holland, The Netherlands, 2009; pp. 115–140. [Google Scholar]
  26. Betz, H.D.; Schmidt, K.; Oettinger, W.P.; Montag, B. Cell-tracking with lightning data from LINET. Adv. Geosci. 2008, 17, 55–61. [Google Scholar] [CrossRef]
  27. Peters, S.; Meng, L.; Betz, H.D. Visual Analysis of Lightning Data Using Space-Time-Cube. In Proceeding of the 26th International Cartographic Conference (ICC), Dresden, Germany, 25–30 August 2013. in press.
  28. WMO Nowcasting. Available online: http://www.wmo.int/pages/prog/amp/pwsp/Nowcasting.htm (accessed on 21 August 2013).
  29. Galton, A. Dynamic collectives and their collective dynamics. Spat. Inf. Theory 2005, 3693, 300–315. [Google Scholar]
  30. Meyer, V. Thunderstorm Tracking and Monitoring on the Basis of Three-dimensional Lightning Data and Conventional and Polarimetric Radar Data. Ph.D. Thesis, Ludwig-Maximilians-Universität München, Munich, Germany, 2010. [Google Scholar]
  31. Li, L.; Schmid, W.; Joss, J. Nowcasting of motion and growth of precipitation with radar over a complex orography. J. Appl. Meteorol. 1995, 34, 1286–1300. [Google Scholar] [CrossRef]
  32. Johnson, J.; MacKeen, P.L.; Witt, A.; Mitchell, E.D.W.; Stumpf, G.J.; Eilts, M.D.; Thomas, K.W. The storm cell identification and tracking algorithm: An enhanced WSR-88D algorithm. Weather Forecast. 1998, 13, 263–276. [Google Scholar] [CrossRef]
  33. Rinehart, R.; Garvey, E. Three-dimensional storm motion detection by conventional weather radar. Nature 1978. [Google Scholar] [CrossRef]
  34. Zinner, T.; Mannstein, H.; Tafferner, A. Cb-TRAM: Tracking and monitoring severe convection from onset over rapid development to mature phase using multi-channel Meteosat-8 SEVIRI data. Meteorol. Atmos. Phys. 2008, 101, 191–210. [Google Scholar] [CrossRef]
  35. Dixon, M.; Wiener, G. TITAN: Thunderstorm identification, tracking, analysis, and nowcasting-A radar-based methodoloy. J. Atmos. Ocean. Technol. 1993, 10, 785–797. [Google Scholar] [CrossRef]
  36. Handwerker, J. Cell tracking with TRACE3D—A new algorithm. Atmos. Res. 2002, 61, 15–34. [Google Scholar] [CrossRef]
  37. Hering, A.; Morel, C.; Galli, G.; Sénési, S.; Ambrosetti, P.; Boscacci, M. Nowcasting Thunderstorms in the Alpine Region Using a Radar Based Adaptive Thresholding Scheme. In Proceedings of the Third ERAD Conference, Visby, Sweden, 6–10 September 2004; pp. 206–211.
  38. Steinacker, R.; Dorninger, M.; Wölfelmaier, F.; Krennert, T. Automatic tracking of convective cells and cell complexes from lightning and radar data. Meteorol. Atmos. Phys. 2000, 72, 101–110. [Google Scholar] [CrossRef]
  39. Bonelli, P.; Marcacci, P. Thunderstorm nowcasting by means of lightning and radar data: Algorithms and applications in northern Italy. Nat. Hazards Earth Syst. Sci. 2008, 8, 1187–1198. [Google Scholar] [CrossRef]
  40. Bolliger, M.; Binder, P.; Rossa, A. Tracking Cloud Patterns by Rapid Scan Imagery in the Alpine Region. In Proceedings of 10th AMS Conference on Moutain Meterology, Park City, UT, USA, 17–21 June 2002; Volume 12, pp. 73–80.
  41. Jain, A.K.; Dubes, R.C. Algorithms for Clustering Data; Prentice-Hall, Inc.: Upper Saddle River, NJ, USA, 1988. [Google Scholar]
  42. Han, J.; Kamber, M. Data Mining: Concepts and Techniques; Morgan Kaufmann: San Francisco, CA, USA, 2006. [Google Scholar]
  43. Soul, K.; Archibald, E.; Hardaker, P.; Hounsell, A. Using the GANDOLF system as a tool to aid the forecasting of lightning strikes. Meteorol. Appl. 2002, 9, 229–238. [Google Scholar] [CrossRef]
  44. Yeung, L.H.; Lai, E.S.; Chiu, S.K. Lightning Initiation and Intensity Nowcasting Based on Isothermal Radar Reflectivity—A Conceptual Model. In Proceeding of the 33rd International Conference on Radar Meteorology, Cairns, QLD, Australia, 6–10 August 2007; pp. 6–10.
  45. Turdukulov, U.D.; Kraak, M.-J.; Blok, C.A. Designing a visual environment for exploration of time series of remote sensing data: In search for convective clouds. Comput. Graph. 2007, 31, 370–379. [Google Scholar] [CrossRef]
  46. Jain, A.K.; Murty, M.N.; Flynn, P.J. Data clustering: A review. ACM Comput. Surv. (CSUR) 1999, 31, 264–323. [Google Scholar] [CrossRef]
  47. Bertin, J. Semiology of Graphics: Diagrams, Networks, Maps; The University of Wisconsin Press: Madison, WI, USA, 1983. [Google Scholar]

