A Dynamic GIS as an Efficient Tool for Integrated Coastal Zone Management

Abstract
:
1. Introduction
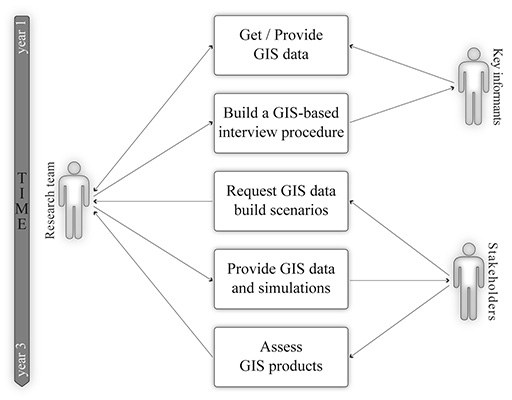
2. Study Area


| Activities (Level 1) | Sub-Activities (Level 2) | Number of Sub-Activities (Level 3) |
|---|---|---|
| Commercial fishing | Active gears | 4 (by example: dragged gears) |
| Passive gears | 13 (by example: nets gears) | |
| Maritime transportation | Transportation of goods | 1 |
| Transportation of passengers | 1 | |
| Nautical activities | Supervised nautical activities | 6 (by example: Sailing school) |
| Water sports events | 4 (by example: Windsurfing race) |
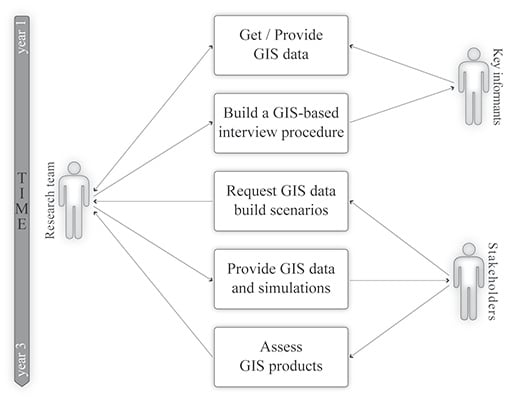
3. Methods
3.1. Data Collection
| Activity Type | Interviews (n) | Mapping Interviews (n) |
|---|---|---|
| Maritime transportation | 4 | 3 |
| Commercial fishing | 7 | 6 |
| Nautical activities | 22 | 19 |
| Total | 31 | 28 |
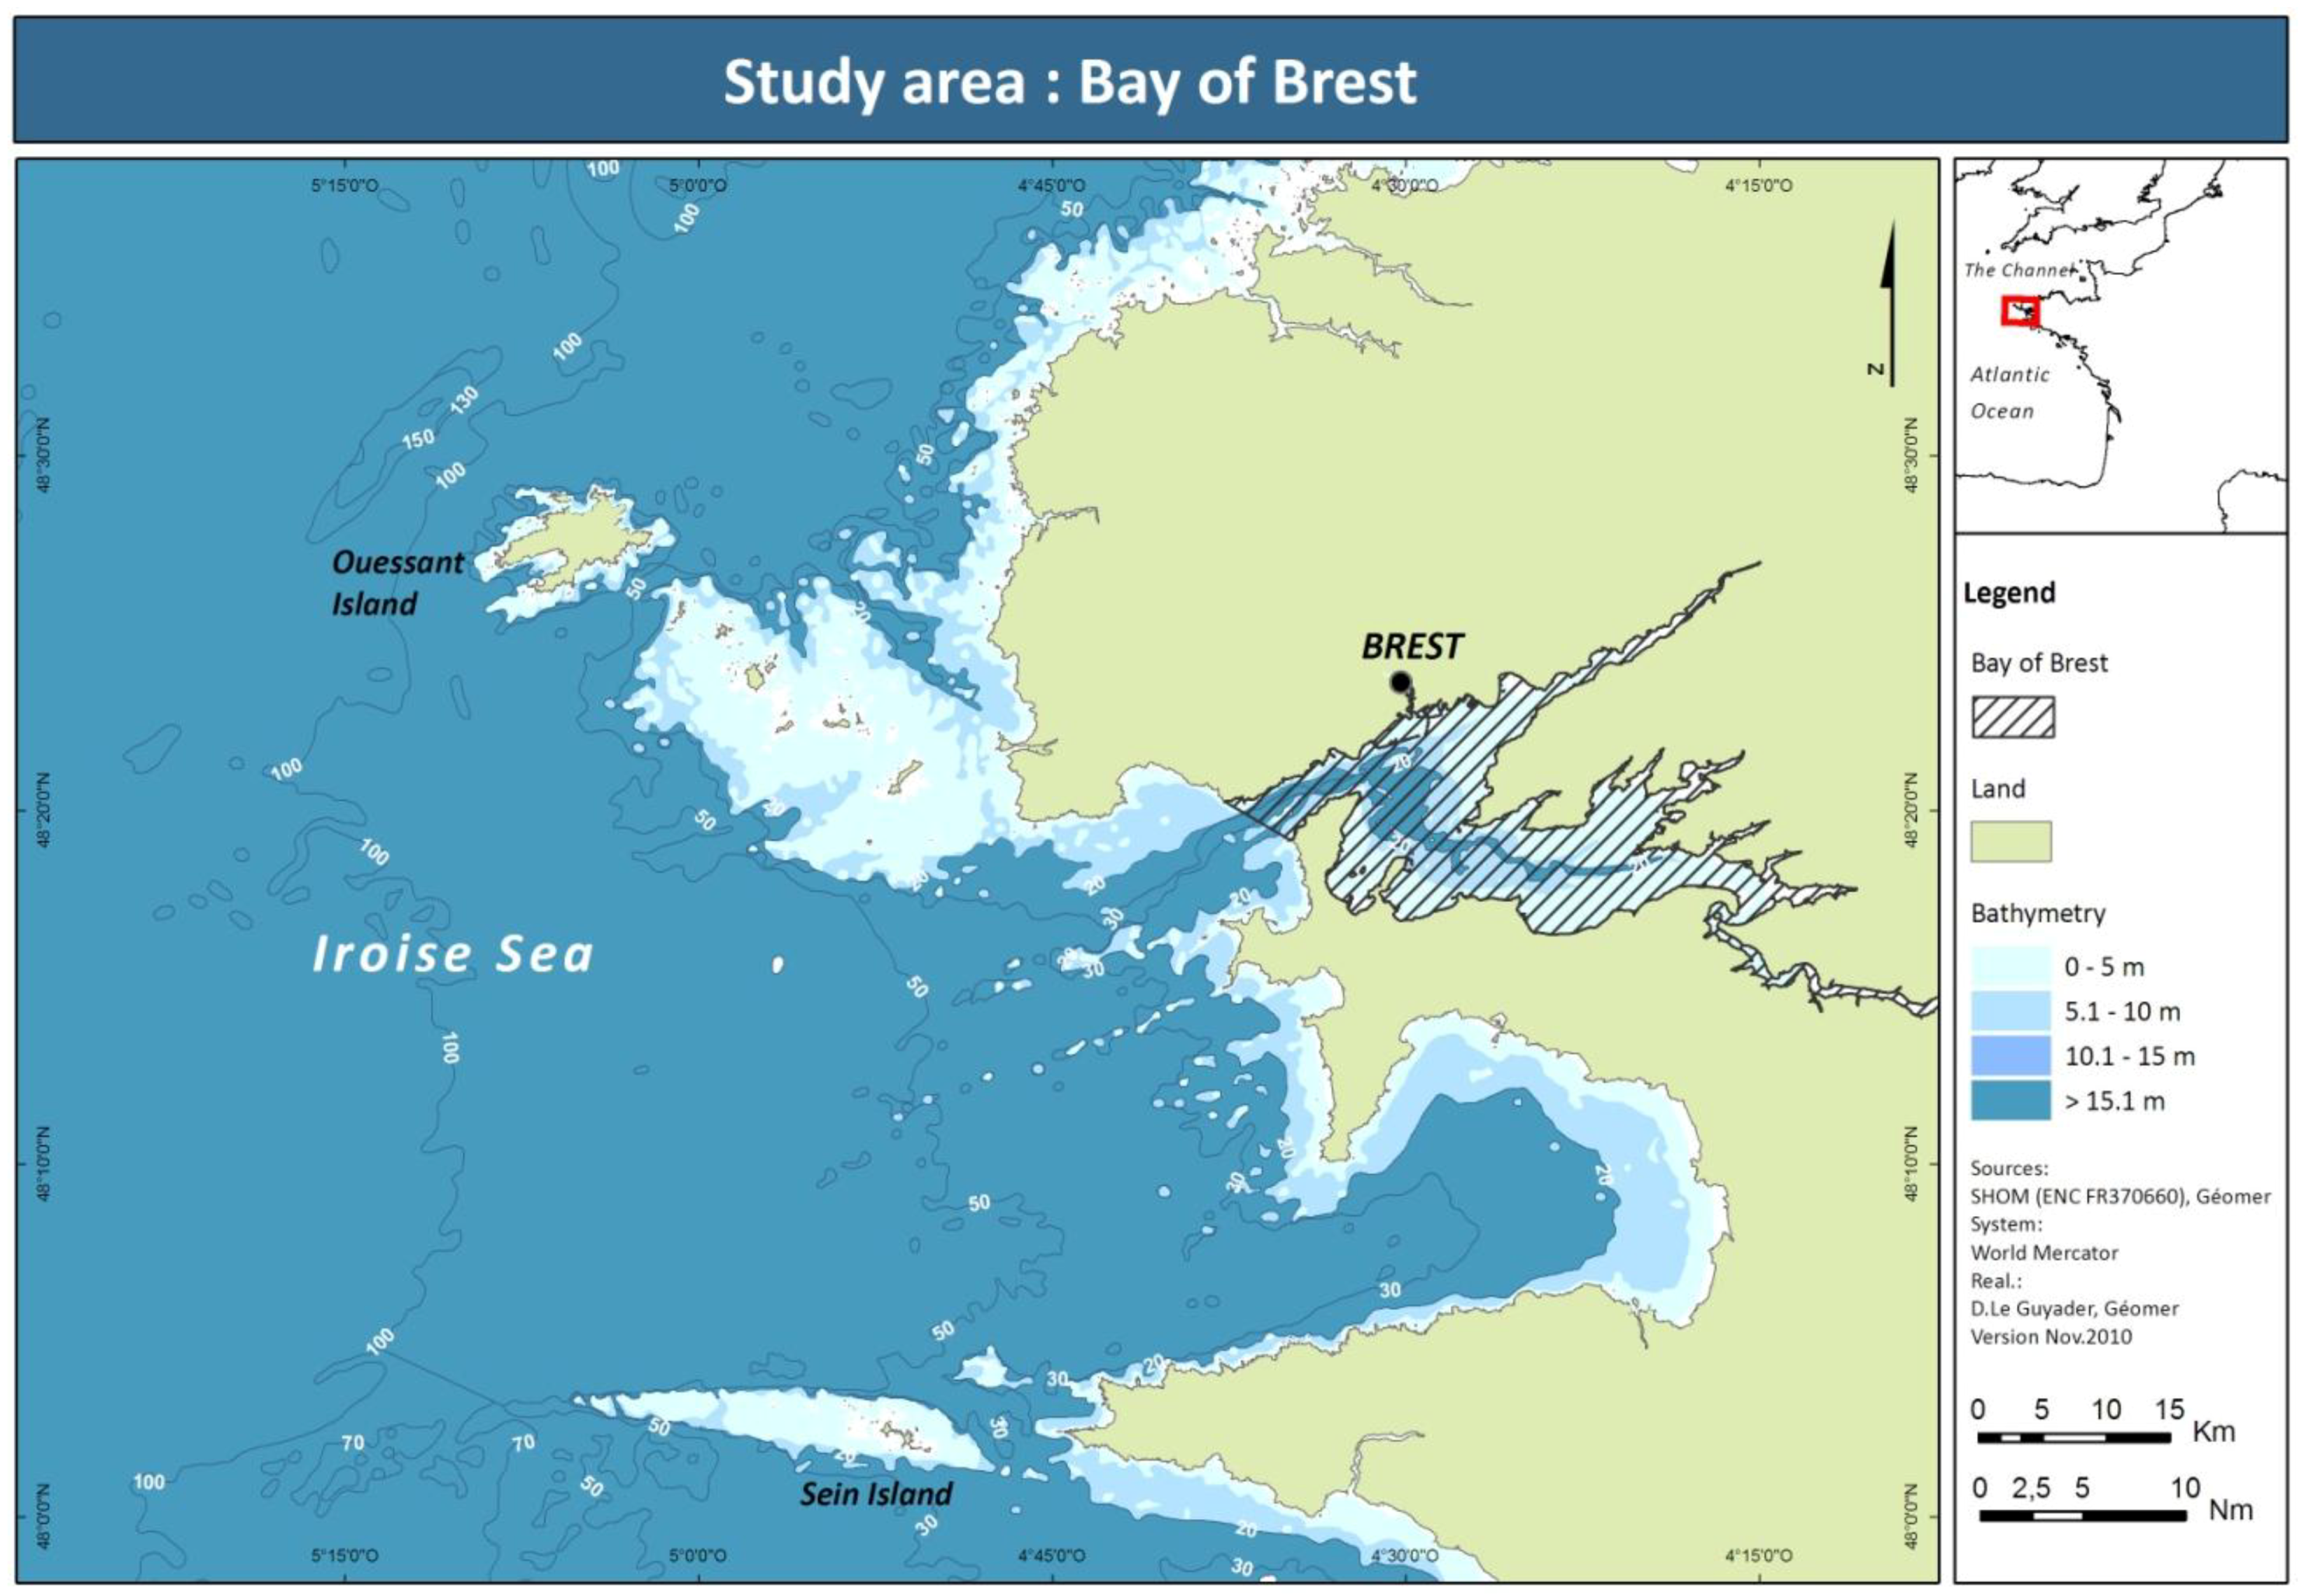
3.2. Spatio-Temporal Database (STDB)
3.3. Spatio-Temporal Conflict Analysis

3.4. Supporting Discussion and Building Collective Scenarios Phase
4. Results
4.1. Data Collection


4.2. Maritime Activities in a Spatio-Temporal Perspective
4.3. Spatio-Temporal Conflicts between Activities


4.4. Contribution to Knowledge, Discussion and Building of Collective Scenarios
5. Discussion and Conclusions

| Diagnosis | Planning | Concertation | |
|---|---|---|---|
| Non-spatial data classified according to the representation type | |||
| Matrix | *** | *** | *** |
| Network graphs | *** | ** | *** |
| Plots | *** | *** | *** |
| Spatial data classified according to the representation type and associated tools | |||
| Cartographic atlas | *** | *** | *** |
| Geographic Information Base | *** | ** | ** |
| Temporal Geographic Information Base | *** | *** | ** |
| GIS geo-processing tools | *** | *** | * |
| Spatial data classified according to their origins | |||
| Reference geographic information | *** | *** | ** |
| Volunteered geographic information | *** | *** | *** |
| Spatial data classified according to their thematic contents | |||
| Activity zones | *** | ** | *** |
| Activity calendars | *** | ** | *** |
| Cumulative boats density (per activity) | *** | *** | ** |
| Cumulative boats density (for all activities) | *** | *** | *** |
| Spatio-temporal intersections between activities | *** | *** | *** |
| Simulations | |||
| Backward simulation | *** | ** | ** |
| Forward simulation | ** | *** | *** |
| Workshop sessions | |||
| Feedback on the research work | ** | ||
| Collective Scenarios construction | *** | ||
| Stakeholders’ evaluation | ** | ||
| Label | If ≥50% of“useful” answers | If ≥75% of“useful” answers | If =100% of“useful” answers |
| Code | * | ** | *** |

Acknowledgments
Author Contributions
Conflicts of Interest
References
- Schwartz, M.L. Encyclopedia of Coastal Science; Springer: Dordrecht, The Netherlands, 2005; p. 1242. [Google Scholar]
- Katsanevakis, S.; Stelzenmüller, V.; South, A.; Sørensen, T.; Jones, P.; Kerr, S.; Badalamenti, F.; Anagnostou, C.; Breen, P.; Chust, G.; et al. Ecosystem-based marine spatial management: Review of concepts, policies, tools, and critical issues. Ocean Coast. Manag. 2011, 54, 807–820. [Google Scholar] [CrossRef]
- Young, O.R.; Osherenko, G.; Ekstrom, J.; Crowder, L.B.; Ogden, J.; Wilson, J.A.; Day, J.C.; Douvere, F.; Ehler, C.N.; McLeod, K.L.; et al. Solving the crisis in ocean governance: Place-based management of marine ecosystems. Environment 2007, 49, 20–32. [Google Scholar]
- Leslie, H.M.; McLeod, K.L. Confronting the challenges of implementing marine ecosystem-based management. Front. Ecol. Environ. 2007, 5, 540–548. [Google Scholar] [CrossRef]
- UNEP. Taking steps toward marine and coastal ecosystem-based management: An introductory guide. UNEP Reg. Seas Rep. Stud. 2011, 189, 1–68. [Google Scholar]
- Pittman, S.J.; Connor, D.W.; Radke, L.; Wright, D.J. Application of Estuarine and Coastal Classifications in Marine Spatial Management. In Treatise on Estuarine and Coastal Science Features; Wolanski, E., McLusky, D.S., Eds.; Elsevier Academic Press: Waltham, MA, USA, 2012; pp. 163–205. [Google Scholar]
- Halpern, B.S.; Walbridge, S.; Selkoe, K.A.; Kappel, C.V.; Micheli, F.; D’Agrosa, C.; Bruno, J.F.; Casey, K.S.; Ebert, C.; Fox, H.E.; et al. Global map of human impact on marine ecosystems. Science 2008, 319, 948–952. [Google Scholar] [CrossRef]
- Ban, N.C.; Alidina, H.M.; Ardron, J.A. Cumulative impact mapping: Advances, relevance and limitations to marine management and conservation, using Canada’s Pacific waters as a case study. Mar. Policy 2010, 34, 876–886. [Google Scholar] [CrossRef]
- Stelzenmüller, V.; Lee, J.; Garnacho, E.; Rogers, S.I. Assessment of a Bayesian belief network—GIS framework as a practical tool to support marine planning. Mar. Pollut. Bull. 2010, 60, 1743–1754. [Google Scholar] [CrossRef]
- Kappel, C.V.; Halpern, B.S.; Napoli, N. Mapping Cumulative Impacts of Human Activities on Marine Ecosystems; Sea Plan: Boston, MA, USA, 2012. [Google Scholar]
- Koehn, J.Z.; Reineman, D.R.; Kittinger, J.N. Progress and promise in spatial human dimensions research for ecosystem-based ocean planning. Mar. Policy 2013, 42, 31–38. [Google Scholar] [CrossRef]
- Le Tixerant, M.; Gourmelon, F.; Tissot, C.; Brosset, D. Modelling of human activity development in coastal sea areas. J. Coast. Conserv. 2010, 15, 407–416. [Google Scholar]
- Longdill, P.C.; Healy, T.R.; Black, K.P. An integrated GIS approach for sustainable aquaculture management area site selection. Ocean Coast. Manag. 2008, 51, 612–624. [Google Scholar] [CrossRef]
- Stelzenmüller, V.; Lee, J.; South, A.; Foden, J.; Rogers, S.I. Practical tools to support marine spatial planning: A review and some prototype tools. Mar. Policy 2013, 38, 214–227. [Google Scholar] [CrossRef]
- Brody, S.D.; Highfield, W.; Arlikatti, S.; Bierling, D.H.; Ismailova, R.M.; Lee, L.; Butzler, R. Conflict on the coast: Using geographic information systems to map potential environmental disputes in Matagorda Bay, Texas. Environ. Manag. 2004, 34, 597–617. [Google Scholar]
- Beck, M.; Ferdania, J.; Kachmar, K.; Morrison, P.; Taylor, P. Best Practices for Marine Spatial Planning; The Nature Conservancy: Arlington, VA, USA, 2009. [Google Scholar]
- Opdam, P. Learning science from practice. Landsc. Ecol. 2010, 35, 821–823. [Google Scholar] [CrossRef]
- Brown, M.E. Assessing natural resource management challenges in Senegal using data from participatory rural appraisals and remote sensing. World Dev. 2006, 34, 751–767. [Google Scholar] [CrossRef]
- Hessel, R.; van den Berg, J.; Kaboré, O.; van Kekem, A.; Verdandvoort, S.; Dipama, J.M.; Diallo, B. Linking participatory and GIS-based land use planning methods: A case study from Burkina Faso. Land Use Policy 2009, 26, 1162–1172. [Google Scholar] [CrossRef]
- Arciniegas, G.; Janssen, R.; Rietveld, P. Effectiveness of collaborative map-based decision support tools: Results of an experiment. Environ. Model. Softw. 2013, 39, 159–175. [Google Scholar] [CrossRef]
- Jude, S.R. Investing the potential role of visualization techniques in participatory coastal management. Coast. Manag. 2008, 36, 331–349. [Google Scholar] [CrossRef]
- Jude, S.R.; Jones, A.P.; Watkinson, A.R.; Brown, I.; Gill, J.A. The development of a visualization methodology for integrated coastal management. Coast. Manag. 2007, 35, 525–544. [Google Scholar] [CrossRef]
- Gourmelon, F.; Chlous-Ducharme, F.; Rouan, M.; Kerbiriou, C.; Bioret, F. Role-playing game developed from a modelling process: A relevant participatory tool for sustainable development? A co-construction experiment in an insular biosphere reserve. Land Use Policy 2013, 32, 96–107. [Google Scholar] [CrossRef]
- Smith, G.; Brennan, R.E. Losing our way with mapping: Thinking critically about marine spatial planning in Scotland. Ocean Coast. Manag. 2012, 69, 210–216. [Google Scholar] [CrossRef]
- Alexander, K.A.; Janssen, R.; Arciniegas, G.; O’Higgins, T.G.; Eikelboom, T.; Wilding, T.A. Interactive marine spatial planning: Siting tidal energy arrays around the Mull of Kintyre. PLoS One 2012, 7. [Google Scholar] [CrossRef]
- Eikelboom, T.; Janssen, R. Interactive spatial tools for the design of regional adaptation strategies. J. Environ. Manag. 2013, 127, S6–S14. [Google Scholar] [CrossRef]
- Buller, H. The «espace productif», the «théâtre de la nature» and the «territoires de développement local»: The opposing rationales of contemporary French rural development policy. Int. Plan. Stud. 2004, 9, 101–119. [Google Scholar] [CrossRef]
- McCauley, D. Sustainable development and the “governance challenge”: The French experience with Natura 2000. Eur. Environ. 2008, 18, 152–167. [Google Scholar] [CrossRef]
- St. Martin, K.; Hall-Arber, M. The missing layer: Geo-technologies, communities, and implications for marine spatial planning. Mar. Policy 2008, 32, 779–786. [Google Scholar] [CrossRef]
- Le Guyader, D.; Brosset, D.; Gourmelon, F. Exploitation de données AIS (Automatic Identification System) pour la cartographie du transport maritime. Mappemonde 2011, 104, 1–15. [Google Scholar]
- Tremblay, M.-A. The key informant technique: A non-ethnographic application. Am. Anthropol. 1957, 59, 688–701. [Google Scholar]
- Rubin, A.; Babbie, E.R. Program Evaluation. In Research Methods for Social Work; Wadsworth Publishing Company: Belmond, IA, USA, 2005; pp. 324–325. [Google Scholar]
- Couper, A.D. The Times Atlas of the Oceans; Van Nostrand Reinhold: New York, NY, USA, 1983. [Google Scholar]
- Vallega, A. Towards the sustainable management of the Mediterranean Sea. Mar. Policy 1995, 19, 47–64. [Google Scholar] [CrossRef]
- Ehler, C.; Douvere, F. Marine Spatial Planning: A Step-by-Step Approach toward EBM Ecosystem-Based Management; Intergovernmental Oceanographic Commission and Man and the Biosphere—UNESCO: Paris, France, 2009. [Google Scholar]
- Le Guyader, D. Modélisation des Activités Humaines en mer Côtière. Ph.D. Thesis, Université de Bretagne Occidentale, Brest, France, 2012. [Google Scholar]
- Anselin, L.; Syabri, I.; Kho, Y. GeoDa: An introduction to spatial data analysis. Geogr. Anal. 2006, 38, 5–22. [Google Scholar] [CrossRef]
- Barreteau, O.; Le Page, C. Using social simulation to explore the dynamics at Stake in participatory research. J. Artif. Soc. So. Simul. 2011, 14. Available online: http://jasss.soc.surrey.ac.uk/14/4/12.html (accessed on 14 August 2013).
- Irwing, A. Citizen Science: A Study of People, Expertise and Sustainable Development; Routledge: Oxford, UK, 1995; p. 202. [Google Scholar]
- Goodchild, M.F. Citizens as voluntary sensors: Spatial data infrastructure in the world of Web 2.0. Int. J. Spat. Data Infrastruct. Res. 2007, 2, 24–32. [Google Scholar]
- Becu, N.; Neef, A.; Schreinemachers, P.; Sangkapitux, C. Participatory computer simulation to support collective decision-making: Potential and limits of stakeholder involvement. Land Use Policy 2008, 25, 498–509. [Google Scholar] [CrossRef]
- Steyaert, P.; Barzman, M.; Billaud, J.P.; Brives, H.; Hubert, B.; Ollivier, G.; Roche, B. The role of knowledge and research in facilitating social learning among stakeholders in natural resources management in the French Atlantic coastal wetlands. Environ. Sci. Policy 2007, 10, 537–550. [Google Scholar] [CrossRef]
© 2014 by the authors; licensee MDPI, Basel, Switzerland. This article is an open access article distributed under the terms and conditions of the Creative Commons Attribution license (http://creativecommons.org/licenses/by/3.0/).
Share and Cite
Gourmelon, F.; Le Guyader, D.; Fontenelle, G. A Dynamic GIS as an Efficient Tool for Integrated Coastal Zone Management. ISPRS Int. J. Geo-Inf. 2014, 3, 391-407. https://doi.org/10.3390/ijgi3020391
Gourmelon F, Le Guyader D, Fontenelle G. A Dynamic GIS as an Efficient Tool for Integrated Coastal Zone Management. ISPRS International Journal of Geo-Information. 2014; 3(2):391-407. https://doi.org/10.3390/ijgi3020391
Chicago/Turabian StyleGourmelon, Françoise, Damien Le Guyader, and Guy Fontenelle. 2014. "A Dynamic GIS as an Efficient Tool for Integrated Coastal Zone Management" ISPRS International Journal of Geo-Information 3, no. 2: 391-407. https://doi.org/10.3390/ijgi3020391