Correlating Remote Sensing Data with the Abundance of Pupae of the Dengue Virus Mosquito Vector, Aedes aegypti, in Central Mexico

 ,
,
Abstract
:
1. Introduction
2. Methodology
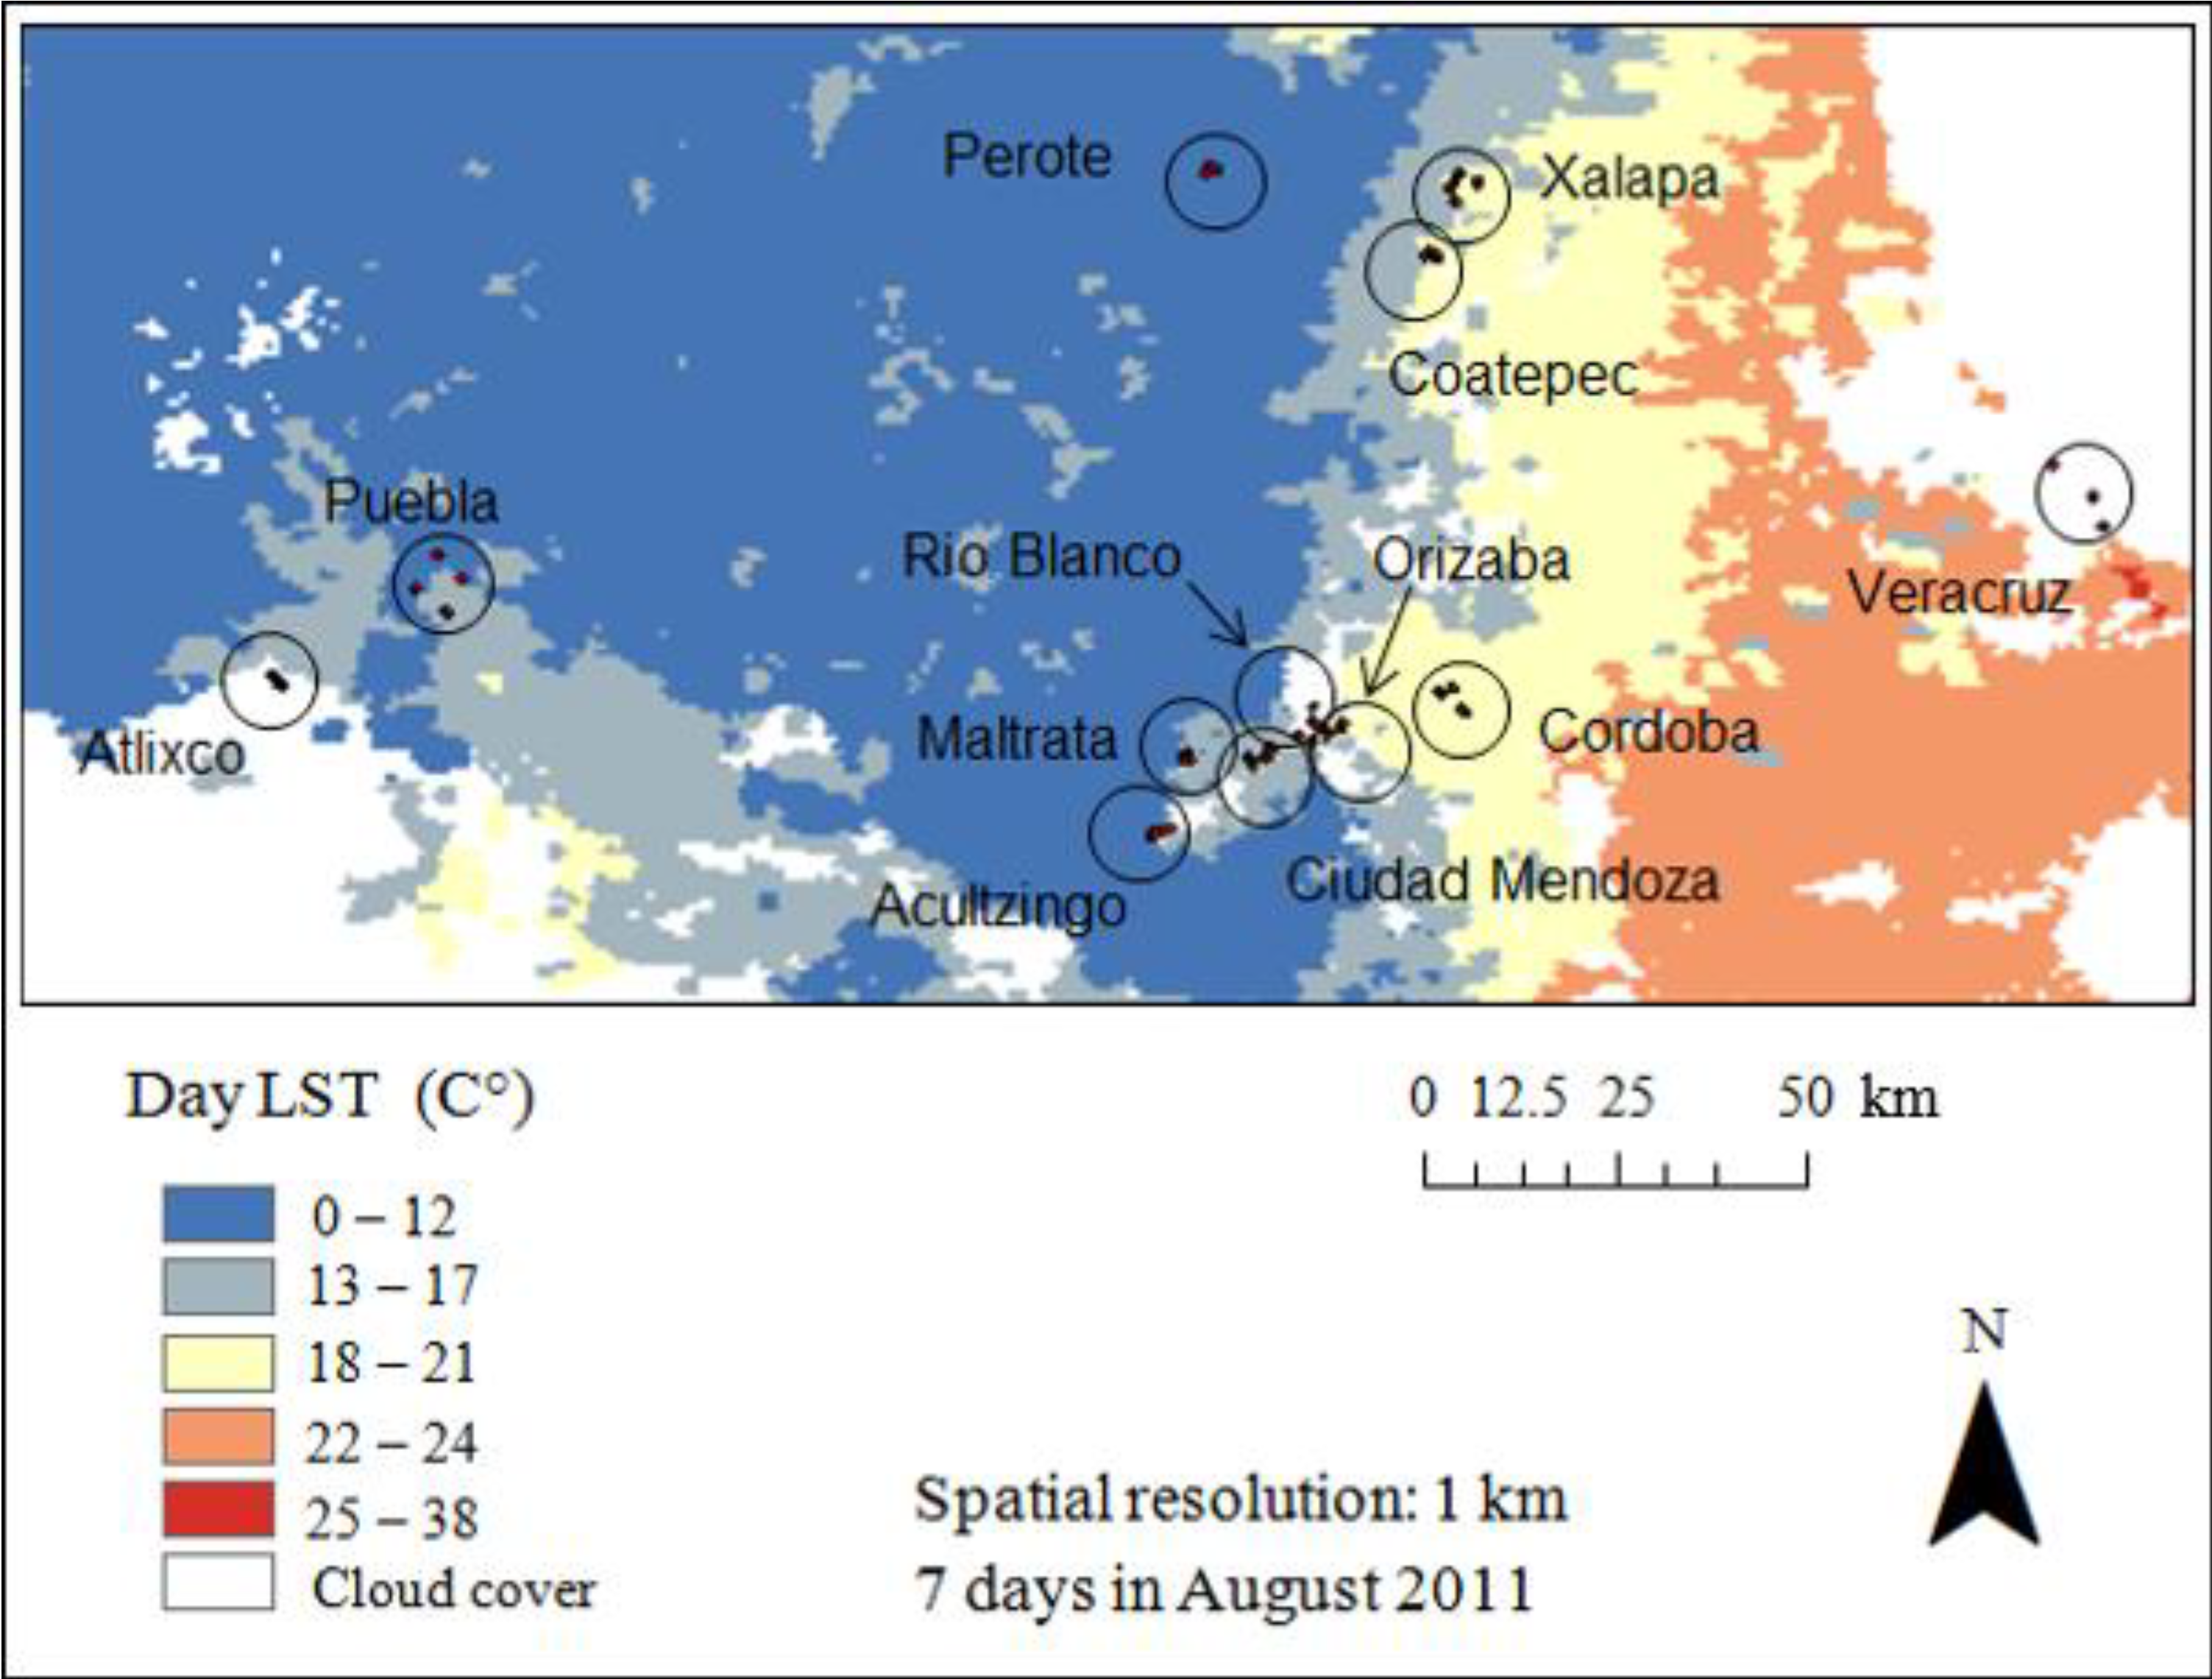
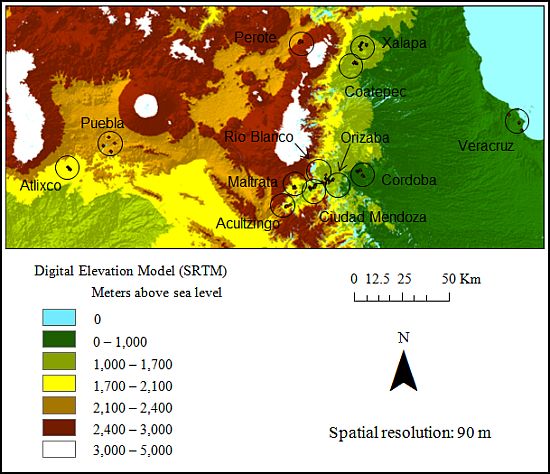
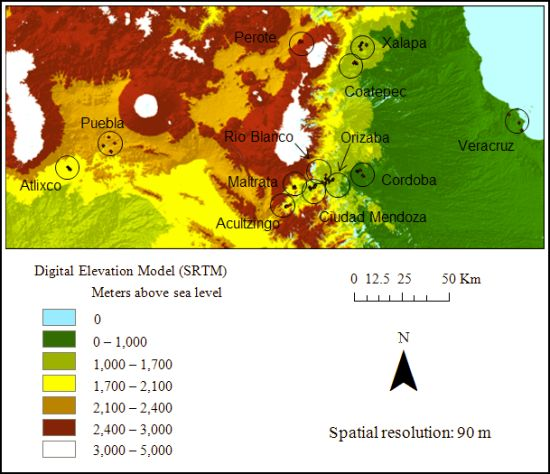
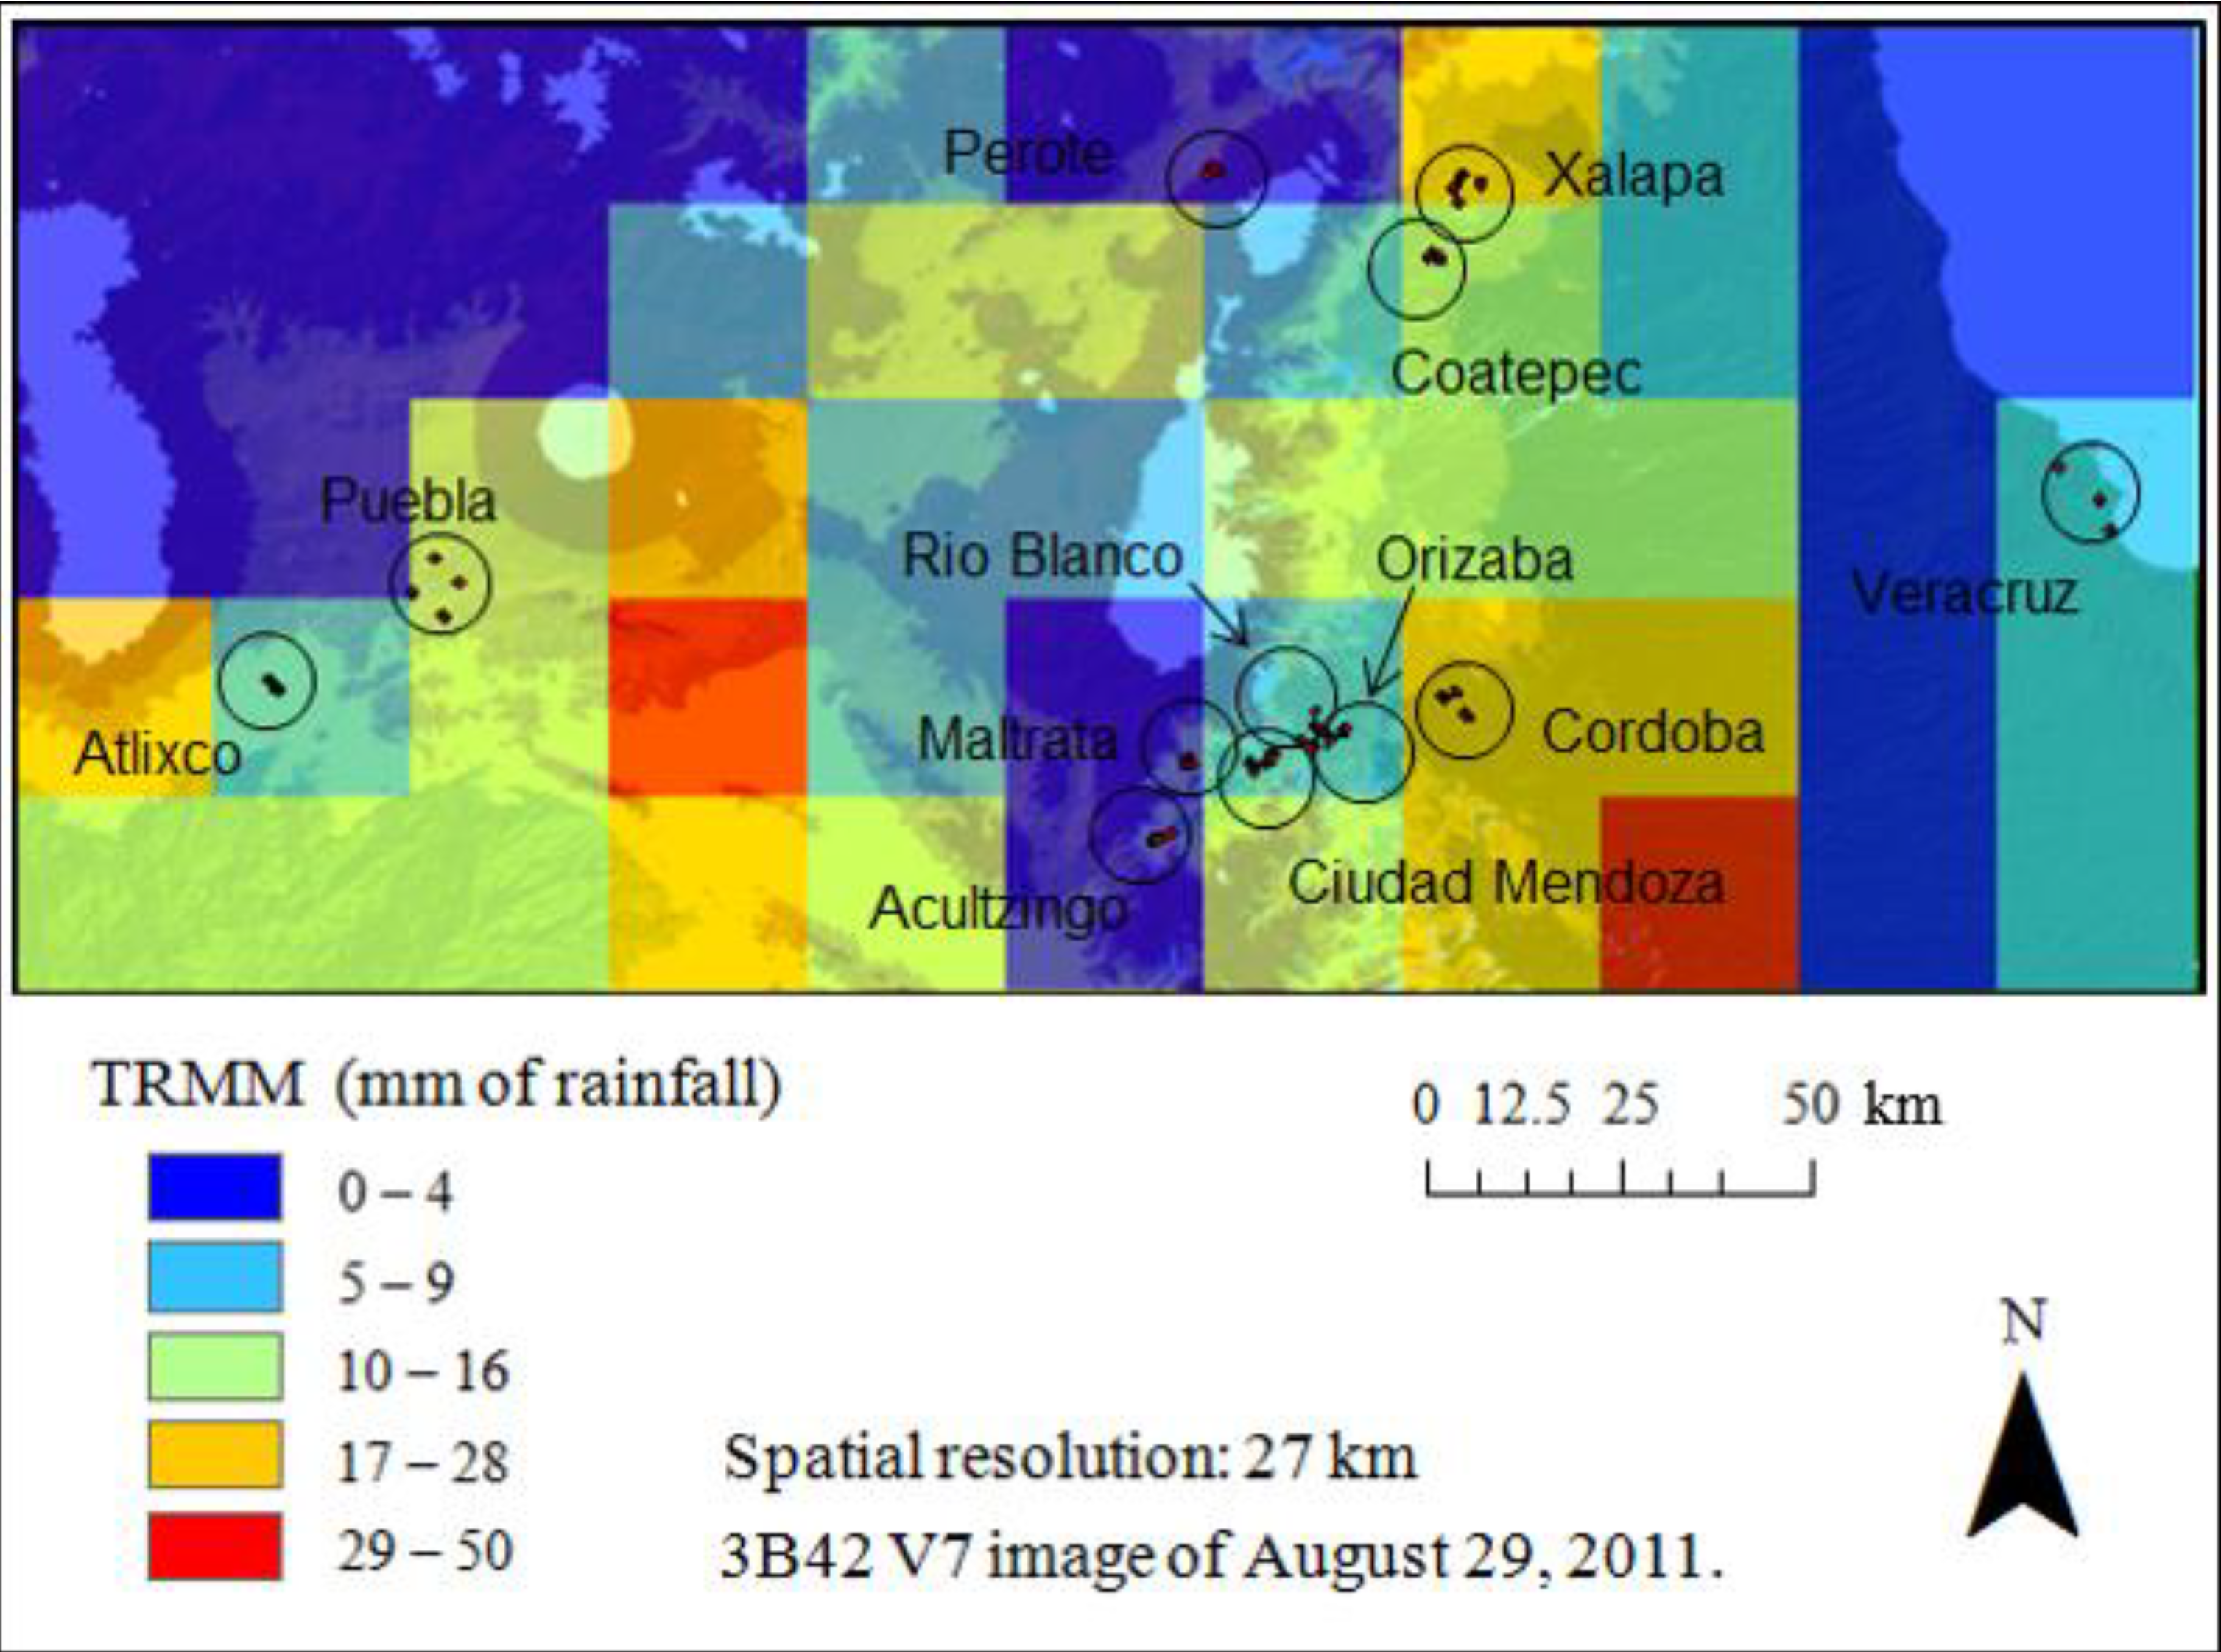
2.1. Study Site
2.2. Field Survey Mosquito Data

2.3. Remotely Sensed Data
2.3.1. Visible Infrared Scanner (VIRS)

2.3.2. Moderate Resolution Imaging Spectroradiometer (MODIS)
2.3.3. Shuttle Radar Topography Mission (SRTM)
2.4. Match-Up Data Procedure
3. Results

| Community | Percentage | Mean | Night LST (C°) | Day LST (C°) | Rainfall (mm) | Elevation (m) |
|---|---|---|---|---|---|---|
| Orizaba | 35 | 14.29 | 16.0 | 33.2 | 354 | 1236 |
| Rio Blanco | 41 | 10.43 | 15.0 | 30.9 | 334 | 1258 |
| Cordoba | 24 | 6.04 | 16.7 | 33.1 | 507 | 860 |
| Veracruz | 28 | 4.91 | 21.7 | 40.7 | 372 | 18 |
| Coatepec | 25 | 3.26 | 16.1 | 32.2 | 208 | 1203 |
| Ciud. Mendoza | 21 | 2.63 | 14.6 | 31.9 | 348 | 1338 |
| Acultzingo | 14 | 1.68 | 12.8 | 28.9 | 217 | 1695 |
| Xalapa | 24 | 0.98 | 15.4 | 31.8 | 209 | 1419 |
| Atlixco | 12 | 0.28 | 15.0 | 36.6 | 124 | 1831 |
| Maltrata | 4 | 0.06 | 10.9 | 29.9 | 210 | 1714 |
| Puebla | 4 | 0.04 | 11.4 | 35.2 | 112 | 2141 |
| Perote | 0 | 0.00 | 8.1 | 28.5 | 203 | 2417 |
3.1. Correlations among RS Estimated Climate Variables
| Climate Variables | Community | Cluster |
|---|---|---|
| N = 12 | N = 43 | |
| Elevation and night LST | −0.91 ** | −0.87 ** |
| Elevation and day LST | −0.39 | −0.29 |
| Elevation and rainfall | −0.80 ** | −0.80 ** |
| Night LST and day LST | 0.59 * | 0.55 ** |
| Rainfall and night LST | 0.60 * | 0.60 * |
| Rainfall and day LST | 0.11 | −0.008 |

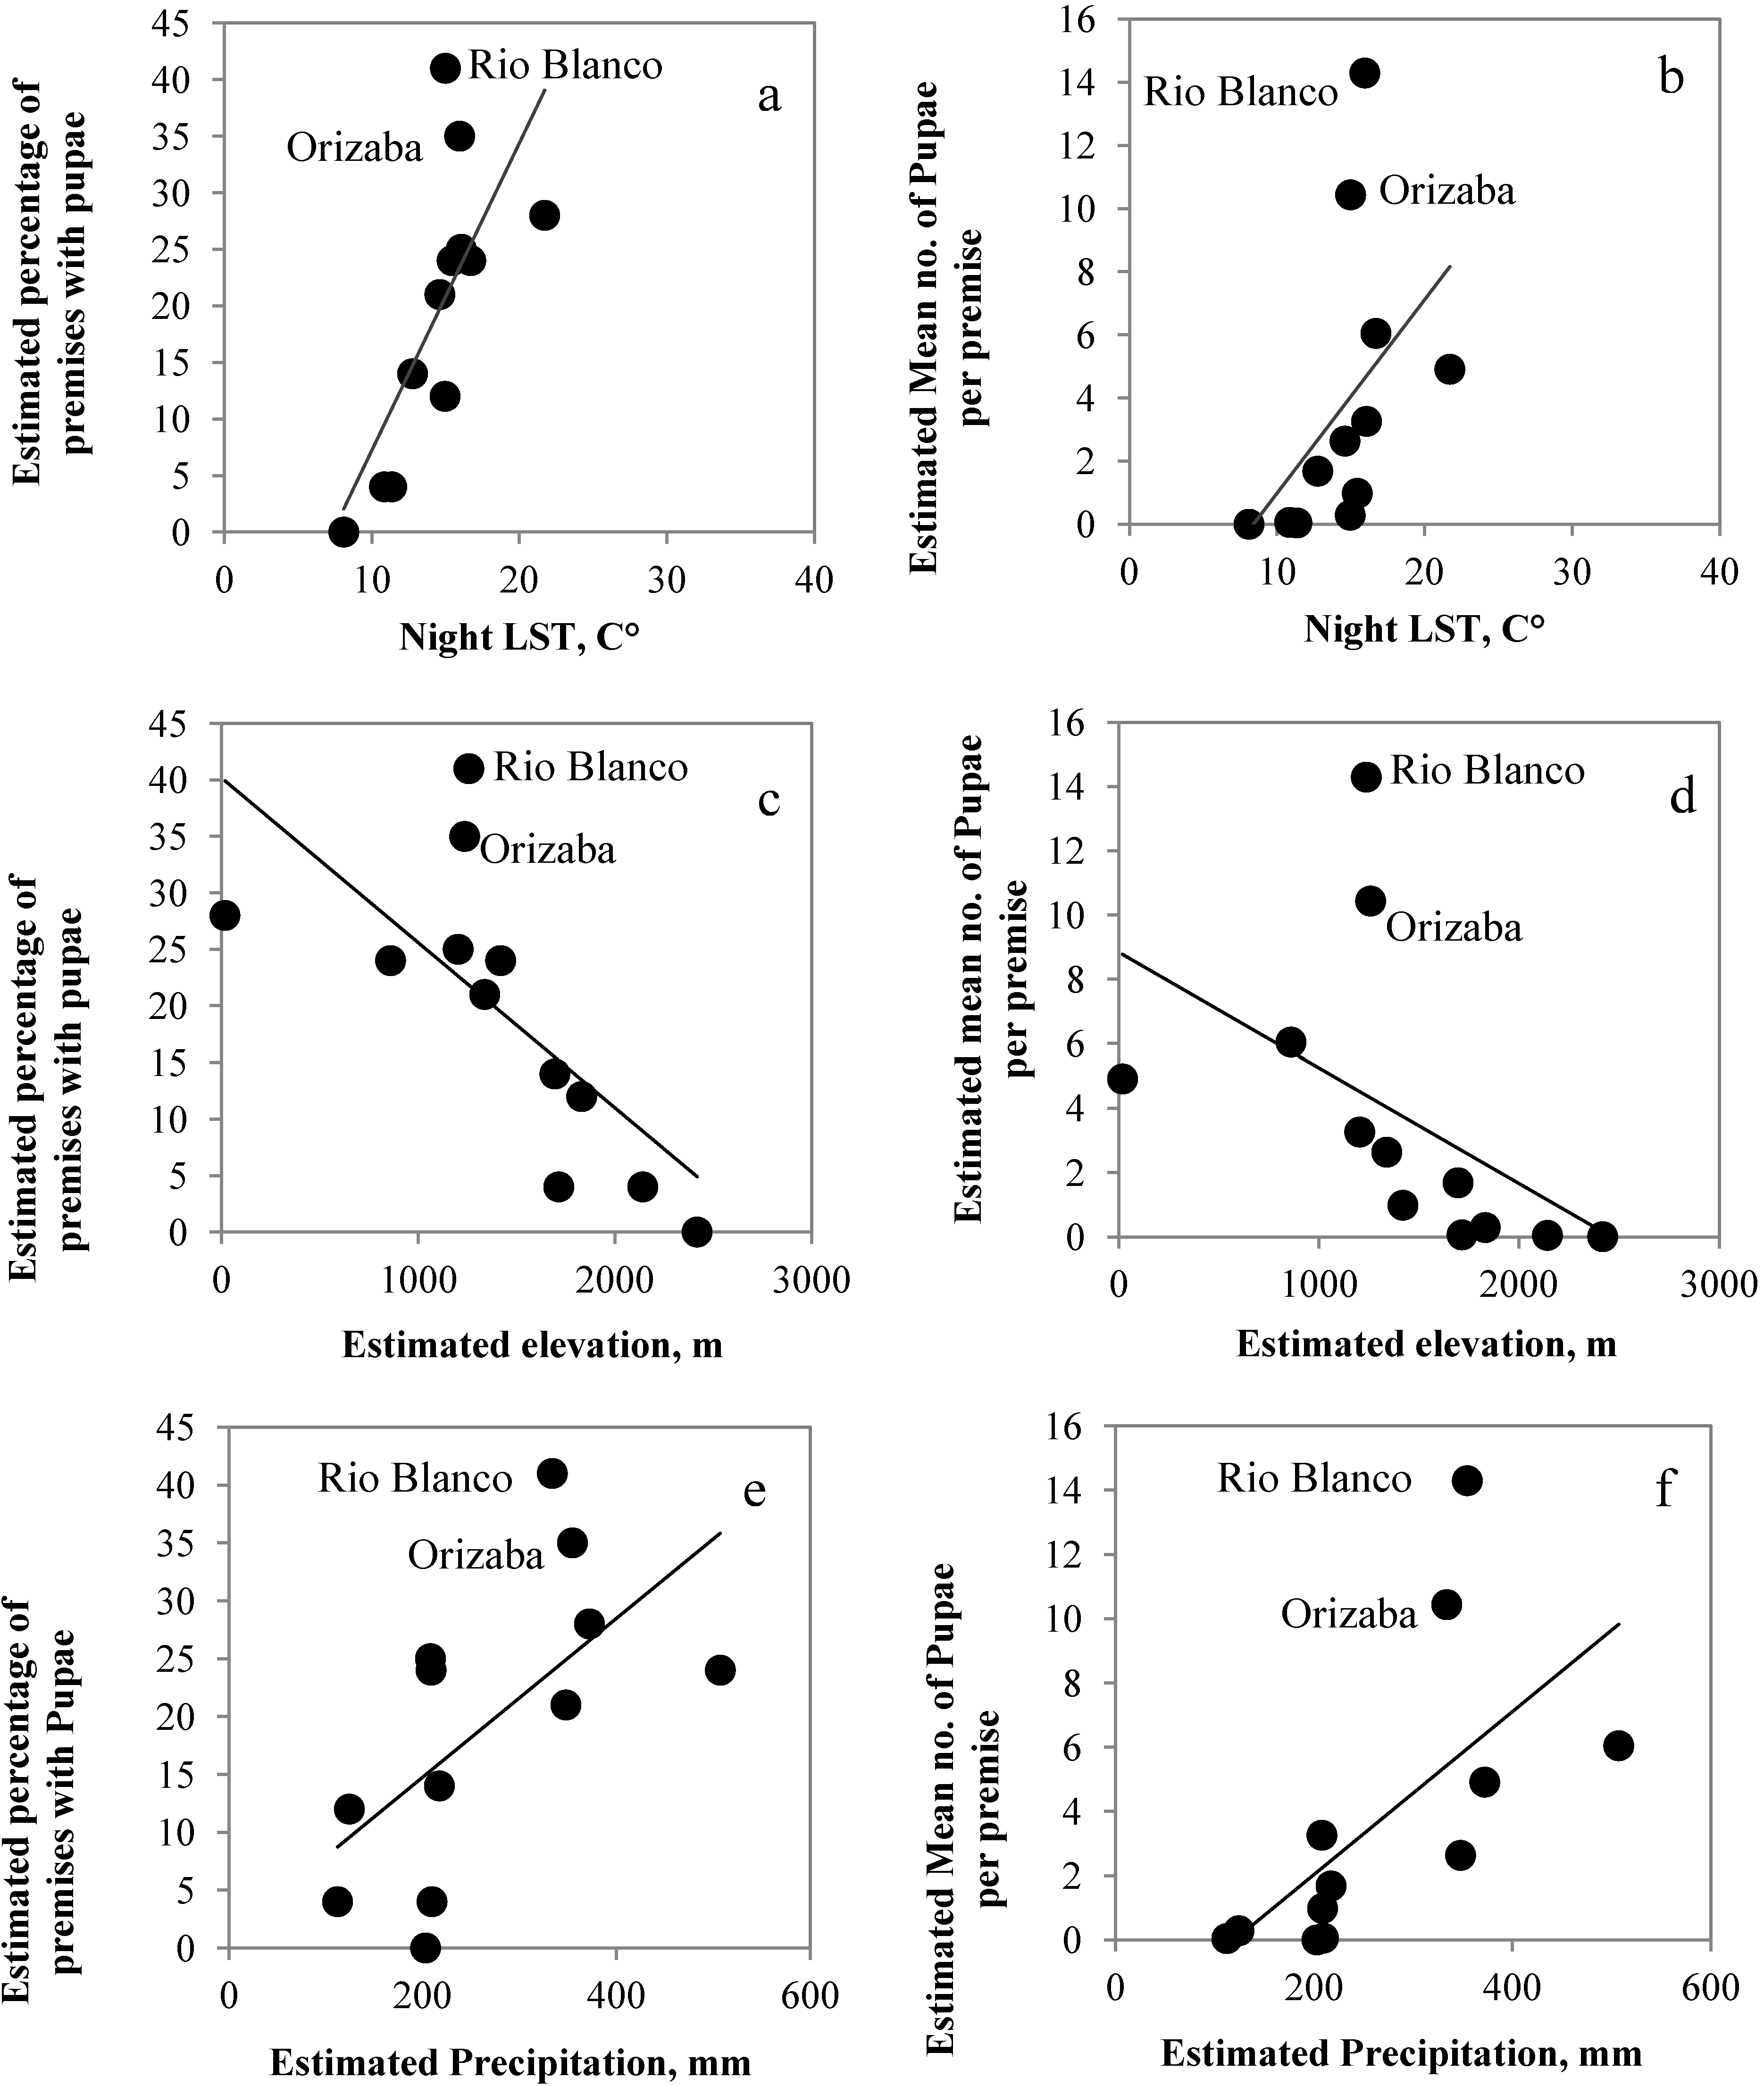
3.2. Correlations among RS-Estimated Climate Variables and Mosquito Presence and Abundance
| Climate Variables | Community | Cluster |
|---|---|---|
| N = 12 | N = 43 | |
| Night LST and percentage | 0.82 ** | 0.56 ** |
| Night LST and mean | 0.78 ** | 0.64 ** |
| Elevation and percentage | −0.84 ** | −0.67 ** |
| Elevation and mean | −0.87 ** | −0.75 ** |
| Rainfall and percentage | 0.61 * | 0.50 ** |
| Rainfall and mean | 0.79 ** | 0.55 ** |
| Day LST and percentage | 0.33 | 0.12 |
| Day LST and mean | 0.29 | 0.21 |
4. Discussion
5. Conclusions
Acknowledgments
Author Contributions
Conflicts of Interest
References
- Epstein, P.R. Climate change and emerging infectious disease. Microbes Infect. 2001, 3, 747–754. [Google Scholar] [CrossRef]
- Githeko, A.K.; Lindsay, S.W.; Confalonieri, U.E.; Patz, J.A. Climate change and vector-borne diseases: A regional analysis. Bull. World Health Organ. 2000, 78, 1136–1147. [Google Scholar]
- Gubler, D.J.; Reiter, P.; Ebi, K.L.; Yap, W.; Nasci, R.; Patz, J.A. Climate variability and change in the United States: Potential impacts on vector and rodent-borne diseases. Environ. Health Perspect. 2001, 109 (Suppl. S2), 223–233. [Google Scholar] [CrossRef]
- Haines, A.; Kovats, R.S.; Campbell-Lendrum, D.; Corvalan, C. Climate change and human health: Impacts, vulnerability and public health. Public Health 2006, 120, 585–596. [Google Scholar] [CrossRef]
- Lafferty, K.D. The ecology of climate change and infectious diseases. Ecol. Soc. Am. 2009, 90, 888–900. [Google Scholar]
- McMichael, A.J.; Woodruff, R.E.; Hales, S. Climate change and human health: Present and future risk. Lancet 2006, 367, 859–869. [Google Scholar] [CrossRef]
- Ceccato, P.; Connor, S.J.; Jeanne, I.; Thomson, M.C. Application of geographical information systems and remote sensing technologies for assessing and monitoring malaria risk. Parassitologia 2005, 47, 81–96. [Google Scholar]
- Mills, J.N.; Gage, K.L.; Khan, A.S. Potential influence of climate change on vector-borne and zoonotic diseases: A review and proposed research plan. Environ. Health Perspect. 2010, 118, 1507–1514. [Google Scholar] [CrossRef]
- Parkinson, A.J.; Butler, J.C. Potential impacts of climate change on infectious diseases in the Arctic. Int. J. Circumpolar Health 2005, 64, 478–486. [Google Scholar]
- Semenza, J.C.; Menne, B. Climate change and infectious diseases in Europe. Lancet Infect. Dis. 2009, 9, 365–375. [Google Scholar] [CrossRef]
- Allen, T.R.; Wong, D.W. Exploring GIS, spatial statistics and remote sensing for risk assessment of vector-borne diseases: A West Nile virus example. Int. J. Risk Asmt. Mgmt. 2006, 6, 253–275. [Google Scholar] [CrossRef]
- Hay, S.I.; Packer, M.J.; Rogers, D.J. The impact of remote sensing on the study and control of invertebrate intermediate hosts and vectors for disease. Int. J. Remote Sens. 1997, 18, 2899–2930. [Google Scholar] [CrossRef]
- Hay, S.I.; Snow, R.W.; Rogers, D.J. From predicting mosquito habitat to malaria seasons using remotely sensed data: Practice, problems and perspectives. Parasitol. Today 1998, 14, 306–313. [Google Scholar] [CrossRef]
- Kalluri, S.; Gilruth, P.; Rogers, D.; Szczur, M. Surveillance of arthropod vector-borne infectious disease using remote sensing techniques: A review. PLoS Pathog. 2007, 3, 1361–1371. [Google Scholar]
- Gubler, D.J.; Clark, G.G. Dengue/Dengue hemorrhagic fever: The emergence of a global health problem. Emerg. Infect. Dis. 1995, 1, 55–57. [Google Scholar] [CrossRef]
- Bhatt, S.; Gething, P.W.; Brady, O.J.; Messina, J.P.; Farlow, A.W.; Moves, C.L.; Drake, J.M.; Brownstein, J.S.; Hoen, A.G.; Sankoh, O.; et al. The global distribution and burden of dengue. Nature 2013, 496, 504–507. [Google Scholar] [CrossRef]
- Brunkard, J.M.; Robles Lopez, J.L.; Ramirez, J.; Cifuentes, E.; Rothenberg, S.J.; Hunsperger, E.A.; Moore, C.G.; Brussolo, R.M.; Villarreal, N.A; Haddad, B.M. Dengue fever seroprevalence and risk factors, Texas-Mexico border, 2004. Emerg. Infect. Dis. 2007, 13, 1477–1483. [Google Scholar] [CrossRef]
- Chowell, G.; Sanchez, F. Climate-based descriptive models of dengue fever: The 2002 epidemic in Colima, Mexico. J. Environ. Health 2006, 68, 40–44. [Google Scholar]
- Chowell, G.; Cazelles, B.; Broutin, H.; Munayco, C.V. The influence of geographic and climate factors on the timing of dengue epidemics in Peru, 1994–2008. BMC Infect. Dis. 2011, 11. [Google Scholar] [CrossRef]
- Colon-Gonzalez, F.J.; Lake, I.R.; Bentham, G. Climate variability and dengue fever in warm and humid Mexico. Am. J. Trop. Med. Hyg. 2011, 84, 757–763. [Google Scholar] [CrossRef]
- Degallier, N.; Favier, C.; Menkes, C.; Lengaigne, M.; Ramalho, W.M.; Souza, R.; Servain, J.; Boulanger, J.P. Toward an early warning system for dengue prevention: Modeling climate impact on dengue transmission. Clim. Chang. 2010, 98, 581–592. [Google Scholar] [CrossRef]
- Fuller, D.O.; Troyo, A.; Beier, J.C. El Nino Southern Oscillation and vegetation dynamics as predictors of dengue fever cases in Costa Rica. Environ. Res. Lett. 2009, 4, 140111–140118. [Google Scholar]
- Herrera-Martinez, A.D.; Rodriguez-Morales, A.J. Potential influence of climate variability on dengue incidence registered in a western pediatric hospital of Venezuela. Trop. Biomed. 2010, 27, 280–286. [Google Scholar]
- Hurtado-Diaz, M.; Riojas-Rodriguez, H.; Rothenberg, S.J.; Gomez-Dantes, H.; Cifuentes, E. Short communication: Impact of climate variability on the incidence of dengue in Mexico. Trop. Med. Int. Health 2007, 12, 1327–1337. [Google Scholar] [CrossRef]
- Johansson, M.A.; Cummings, D.A.T.; Glass, G.E. Multiyear climate variability and dengue-El Nino Southern Oscillation, weather, and dengue incidence in Puerto Rico, Mexico, and Thailand: A longitudinal data analysis. PLoS Med. 2009, 6. [Google Scholar] [CrossRef]
- Johansson, M.A.; Dominici, F.; Glass, G.E. Local and global effects of climate on dengue transmission in Puerto Rico. PLoS Negl. Trop. Dis. 2009, 3. [Google Scholar] [CrossRef]
- Lowe, R.; Bailey, T.C.; Stephenson, D.B.; Graham, R.J.; Coelho, C.A.S.; Carvalho, M.S.; Barcellos, C. Spatiotemporal modelling of climate-sensitive disease risk: Towards an early warning system for dengue in Brazil. Comput. Geosci. 2011, 37, 371–381. [Google Scholar] [CrossRef]
- Machado-Machado, E.A. Empirical mapping of suitability to dengue fever in Mexico using species distribution modeling. Appl. Geogr. 2012, 33, 82–93. [Google Scholar] [CrossRef]
- Eisen, L.; Moore, C.G. Aedes (Stegomyia) aegypti in the Continental United States: A vector at the cool margin of its geographic range. J. Med. Entomol. 2013, 50, 467–478. [Google Scholar] [CrossRef]
- Lozano-Fuentes, S.; Hayden, M.H.; Welsh-Rodriguez, C.; Ochoa-Martinez, C.; Tapia-Santos, B.; Kobylinski, K.C.; Uejio, C.K.; Zielinski-Gutierrez, E.; Monache, L.D.; Monaghan, A.J.; et al. The dengue virus mosquito vector Aedes aegypti at high elevation in México. Am. J. Trop. Med. Hyg. 2012, 87, 902–909. [Google Scholar] [CrossRef]
- Online Visualization and Analysis System (TOVAS). Available online: http://disc.sci.gsfc.nasa.gov/precipitation/tovas (accessed on 6 September 2013).
- Huffman, G.J.; Coauthors. The TRMM multisatellite Precipitation Analysis (TMPA): Quasi-global, multiyear, combined-sensor precipitation estimates at fine scales. J. Hydrometeorol. 2007, 8, 38–55. [Google Scholar] [CrossRef]
- Reverb/Echo NASA EOS Data and Information System (EOSDIS) Website. Available online: http://reverb.echo.nasa.gov/reverb/ (accessed on 20 December 2013).
- Xiong, X.; Barnes, W. An overview of MODIS radiometric calibration and characterization. Adv. Atmos. Sci. 2006, 23, 69–79. [Google Scholar] [CrossRef]
- Parkinson, C.L. Aqua: An earth-observing satellite mission to examine water and other climate variables. IEEE Trans. Geosci. Remote Sens. 2003, 41, 173–183. [Google Scholar] [CrossRef]
- Coll, C.; Caselles, V.; Galve, J.M.; Valor, E.; Niclòs, R.; Sánchez, J.M.; Rivas, R. Ground measurements for the validation of land surface temperatures derived from AATSR and MODIS data. Remote Sens. Environ. 2005, 97, 288–300. [Google Scholar] [CrossRef]
- Wan, Z.; Zhang, Y.; Zhang, Y.Q.; Li, Z-L. Validation of the land-surface temperature products retrieved from Moderate Resolution Imaging Spectroradiometer data. Remote Sens. Environ. 2002, 83, 163–180. [Google Scholar] [CrossRef]
- Farr, T.G.; Rosen, P.A.; Caro, E.; Crippen, R.; Duren, R.; Hensley, S.; Kobrick, M.; Paller, M.; Rodriguez, E.; Roth, L.; et al. The shuttle radar topography mission. Rev. Geophys. 2007, 45. [Google Scholar] [CrossRef]
- Global Data Explorer. Available online: http://gdex.cr.usgs.gov/gdex/ (accessed on 7 October 2013).
- Chaves, L.F.; Morrison, A.C.; Kitron, U.D.; Scott, T.W. Nonlinear impacts of climatic variability on the density-dependent regulation of an insect vector of disease. Glob. Chang. Biol. 2012, 18, 457–468. [Google Scholar]
- Chaves, L.F.; Scott, T.W.; Morrison, A.C.; Takada, T. Hot temperatures can force delayed mosquito outbreaks viasequential changes in Aedes aegypti demographic parameters inautocorrelated environments. Acta Trop. 2014, 129, 15–24. [Google Scholar] [CrossRef]
- Lana, R.M.; Carneiro, T.G.S.; Honório, N.A.; Codeco, C.T. Seasonal and nonseasonal dynamics of Aedes aegypti in Rio de Janeiro, Brazil: Fitting mathematical models to trap data. Acta Trop. 2014, 129, 25–32. [Google Scholar] [CrossRef]
- Marteis, L.; Makowski, L.; Conceicao, K.; La Corte, R. Identification and spatial distribution of key premises for Aedes aegypti in the Porto Dantas neighborhood, Aracaju, Sergipe State, Brazil. Cad. Sause Publica 2013, 29, 368–378. [Google Scholar] [CrossRef]
- Rubio, A.; Cardo, M.V.; Carbajo, A.E.; Vezzani, D. Imperviousness as a predictor for infestation levels of container-breeding mosquitoes in a focus of dengue and Saint Louis encephalitis in Argentina. Acta Trop. 2013, 128, 680–685. [Google Scholar] [CrossRef]
- Honório, N.A.; Codeco, C.T.; Alves, F.C.; Magalhães, M.A.F.M.; Lourenco-de-Oliveira, R. Temporal distribution of Aedes aegypti in different districts of Rio de Janeiro, Brazil, measured by two types of traps. J. Med. Entomol. 2009, 46, 1001–1014. [Google Scholar] [CrossRef]
- Eisen, L.; Monaghan, A.J.; Lozano-Fuentes, S.; Steinhoff, D.F.; Hayden, M.H.; Bieringer, P.E. The impact of temperature on the bionomics of Aedes (Stegomyia) aegypti, with special reference to the cool geographic range margins. J. Med. Entomol. 2014, in press. [Google Scholar]
- Riedel, N.; Vounatsou, P.; Miller, J.M.; Gosoniu, L.; Chizema-Kawesha, E.; Mukonka, V.; Steketee, R.W. Geographical patterns and predictors of malaria risk in Zambia: Bayesian geostatistical modelling of the 2006 Zambia national malaria indicator survey (ZMIS). Malar. J. 2010, 9, 1–13. [Google Scholar] [CrossRef]
- Gebremariam, Y.B. Formulating the Relationship between Temperature and Elevation and Evaluating the Influence of Major Land Covers on Surface Temperature (A Case Study in Part of Northern Ethiopia). Available online: http://www.scribd.com/doc/21553665/ (accessed on 20 March 2014).
- Buyantuyev, A.; Wu, J. Urban heat islands and landscape heterogeneity: Linking spatiotemporal variations in surface temperatures to land-cover and socioeconomic patterns. Landsc. Ecol. 2010, 25, 17–33. [Google Scholar] [CrossRef]
- O’Rourke, P.A.; Terjung, W.H. Relative influence of city structure on canopy photosynthesis. Int. J. Biomet. 1981, 25, 1–19. [Google Scholar] [CrossRef]
- Focks, D.A.; Haile, D.G.; Daniels, E.; Mount, G.A. Dynamic life table model for Aedes aegypti (Diptera: Culicidae): Analysis of the literature and model development. J. Med. Entomol. 1993, 30, 1003–1017. [Google Scholar]
- Focks, D.A.; Haile, D.G.; Daniels, E.; Mount, G.A. Dynamic life table model for Aedes aegypti (Diptera: Culicidae): Simulation results and validation. J. Med. Entomol. 1993, 30, 1018–1028. [Google Scholar]
- Gomes, A.F.; Nobre, A.A.; Cruz, O.G. Temporal analysis of the relationship between dengue and meteorological variables in the city of Rio de Janeiro, Brazil, 2001–2009. Cad. Saúde Pública 2012, 28, 2189–2197. [Google Scholar] [CrossRef]
- Alto, B.W.; Bettinardi, D. Temperature and dengue virus infection in mosquitoes: Independent effects on the immature and adult stages. Am. J. Trop. Med. Hyg. 2013, 88, 497–505. [Google Scholar] [CrossRef]
- Lambrechts, L.; Paaijmans, K.P.; Fansiri, T.; Carrington, L.B.; Kramer, L.D.; Thomas, M.B.; Scott, T.W. Impact of daily temperature fluctuations on dengue virus transmission by Aedes aegypti. Proc. Natl. Acad. Sci. USA 2011, 108, 7460–7465. [Google Scholar] [CrossRef]
- Buczak, A.L.; Koshute, P.T.; Babin, S.M.; Feighner, B.H.; Lewis, S.H. A data-driven epidemiological prediction method for dengue outbreaks using local and remote sensing data. BMC Med. Inform. Decis. Mak. 2012, 12, 1–20. [Google Scholar]
- NPOESS Preparatory Project (NPP): Building a Bridge to a New Era of Earth Observations. Available online: http://www.nasa.gov/pdf/596329main_NPP_Brochure_ForWeb.pdf (accessed on 7 March 2014).
- Kidd, C.; Hou, A. The Global Precipitation Measurement (GPM) Mission: Hydrological Applications. In Proceedings of the 2012 EUMETSAT Meteorological Satellite Conference, Sopot, Poland, 3–7 September 2012.
- Entekhabi, B.D.; Njoku, E.G.; O’Neill, P.E.; Kellogg, K.H.; Crow, W.T.; Edelstein, W.N.; Entin, J.K.; Goodman, S.D.; Jackson, T.J.; Johnson, J.; et al. The soil moisture active passive (SMAP) mission. Proc. IEEE 2010. [Google Scholar] [CrossRef]
- Bethony, J.; Brooker, S.; Albonico, M; Geiger, S.M.; Loukas, A.; Diemert, D.; Hotez, P.J. Soil-transmitted helminth infections: Ascariasis, richuriasis, and hookworm. Lancet 2006, 367, 1521–1532. [Google Scholar] [CrossRef]
- Brooker, S.; Michael, E. The potential of geographical information systems and remote sensing in the epidemiology and control of human helminth infections. Adv. Parasitol. 2000, 47, 245–270. [Google Scholar] [CrossRef]
- Moreno-Madriñán, M.J.; Parajón, D.G.; Al-Hamdan, M.Z.; Martinez, R.; Rickman, D.L.; Parajon, L.; Estes, S. Use of Remote Sensing/Geographical Information Systems (RS/GIS) to Identify Environmental Limits of Soil Transmitted Helminthes (STHs) Infection in Boaco, Nicaragua. Proceedings of American Public Health Association (APHA) 139th Annual Meeting and Exposition, Washington DC, USA, 29 October–2 November 2011; Available online: http://ntrs.nasa.gov/archive/nasa/casi.ntrs.nasa.gov/20120001772.pdf (accessed on 9 May 2014).
- Hagenlocher, M.; Delmelle, E.; Casas, I.; Kienberger, S. Assessing socioeconomic vulnerability to dengue fever in Cali, Colombia: Statistical vs. expert-based modeling. Int. J. Health Geogr. 2013, 12. [Google Scholar] [CrossRef]
- Hii, Y.L.; Rocklöv, J.; Wall, S.; Ng, L.C.; Tang, C.S.; Ng, N. Optimal lead time for dengue forecast. PLoS Negl. Trop. Dis. 2012, 6. [Google Scholar] [CrossRef]
- Rogers, D.J.; Suk, J.E.; Semenza, J.C. Using global maps to predict the risk of dengue in Europe. Acta Trop. 2014, 129, 1–14. [Google Scholar] [CrossRef]
© 2014 by the authors; licensee MDPI, Basel, Switzerland. This article is an open access article distributed under the terms and conditions of the Creative Commons Attribution license (http://creativecommons.org/licenses/by/3.0/).
Share and Cite
Moreno-Madriñán, M.J.; Crosson, W.L.; Eisen, L.; Estes, S.M.; Estes Jr., M.G.; Hayden, M.; Hemmings, S.N.; Irwin, D.E.; Lozano-Fuentes, S.; Monaghan, A.J.; et al. Correlating Remote Sensing Data with the Abundance of Pupae of the Dengue Virus Mosquito Vector, Aedes aegypti, in Central Mexico. ISPRS Int. J. Geo-Inf. 2014, 3, 732-749. https://doi.org/10.3390/ijgi3020732
Moreno-Madriñán MJ, Crosson WL, Eisen L, Estes SM, Estes Jr. MG, Hayden M, Hemmings SN, Irwin DE, Lozano-Fuentes S, Monaghan AJ, et al. Correlating Remote Sensing Data with the Abundance of Pupae of the Dengue Virus Mosquito Vector, Aedes aegypti, in Central Mexico. ISPRS International Journal of Geo-Information. 2014; 3(2):732-749. https://doi.org/10.3390/ijgi3020732
Chicago/Turabian StyleMoreno-Madriñán, Max J., William L. Crosson, Lars Eisen, Sue M. Estes, Maurice G. Estes Jr., Mary Hayden, Sarah N. Hemmings, Dan E. Irwin, Saul Lozano-Fuentes, Andrew J. Monaghan, and et al. 2014. "Correlating Remote Sensing Data with the Abundance of Pupae of the Dengue Virus Mosquito Vector, Aedes aegypti, in Central Mexico" ISPRS International Journal of Geo-Information 3, no. 2: 732-749. https://doi.org/10.3390/ijgi3020732