Development of a GIS-Based Tool for Aquaculture Siting

Abstract
:1. Introduction
1.1. Aquaculture and GIS
1.2. Case Study: Aquaculture in Hawaiʻi
2. Methods

| Stage | Procedure | Source |
|---|---|---|
| 1 | Define extent, scale of nearshore area | Managers at the County of Hawaiʻi, Research and Development office 1. Aquaculture experts 2. |
| 2 | Creation of a marine aquaculture reference database | Literature search using keywords: aquaculture, mariculture, intertidal/subtidal, fishponds, cage culture, nearshore, modeling and multiple search engines |
| 3 | Define potential aquaculture systems | Aquaculture experts 2 on Island |
| 4 | Define biophysical limitations of each system | Aquaculture experts 2 on Island and Literature Search |
| 5 | Gather appropriate supporting data | GIS technicians & Oceanography experts 3 |
| 6 | Analyze scale, extent, and accuracy of data | GIS technicians & Oceanography experts 3 |
| 7 | Develop and run models | GIS technicians 3 |
| 8 | Analysis of results | Aquaculture experts, industry, and community members |
| 9 | Publication of results | Model results and supporting layers of information |
2.1. Aquaculture Systems
| Biophysical Constraints | Socio-Economic Constraints | |||
|---|---|---|---|---|
| Biological | Physical | Regulatory | Accessibility | Cultural Use |
| Salinity | Tidal | Marine Protected Areas | Distance to Harbor | Recreational Use |
| Turbidity | Wave Height | Fishery Designated Areas | Shoreline Access | Cultural Presence |
| Chlorophyll | Flushing | Recreational Areas | Shore-based Facility | Viewshed |
| Temperature | Wind Speed | Shipping Lane Buoys | ||
| Oxygen | Current Speed | Military Dumping Area | ||
| Pollution | Ocean Depth | |||
| Living Features | Ocean Slope | |||
| Substrate | ||||
| Excluded Areas | No. of Hexagons | Buffer (m) | Total Area (ha) |
|---|---|---|---|
| Mooring and Navigational Buoys | 14 | 100 | 1400 |
| Underwater Cables | 26 | 500 | 2300 |
| Sewer Lines | 2 | 100 | 2000 |
| Lava Zone 1 | 28 | 0 | 2800 |
| Marine Life Conservation Districts (No Take) | 20 | 0 | 2000 |
| Offshore Installations | 10 | 100 | 1000 |
| Cautionary Areas | No. of Sites | Total Area | |
| County Parks | Terrestrial | 506 | |
| State Parks | Terrestrial | 231 | |
| Federal Parks | 1 | 93,655 | |
| Precious Coral Locations | 3 | (point data, no associated area) | |
| Dolphin Resting Areas | 14 | (point data, no associated area) | |
| Fishery Managed Areas | 10 | 22,646 | |
| Ocean Designated Recreation Areas | 2 | 280,313,442 | |
| Hawaiian Islands Humpback Whale National Marine Sanctuary | 1 | 38,631 | |
| Identified Recreational Sites | 202 | (point data, no associated area) | |
| Fish Aggregation Devices | 10 | (point data, no associated area) |
2.2. Input Data
2.2.1. GIS Layers
2.2.2. Geophysical Data
2.2.3. Data Layer Selection
2.3. Modeling
2.3.1. Scale and Extent of Data
2.3.2. Stakeholder Input
3. Results
3.1. Applicability of Datasets
| Variables | Resolution | Criteria | ||
|---|---|---|---|---|
| Intertidal | Moored Cage | Line Culture | ||
| Depth | Various | 4–30 m | 20–200 m | 20–200 m |
| Biological Habitat | No Coral Presence | No Coral Presence | No Coral Presence | |
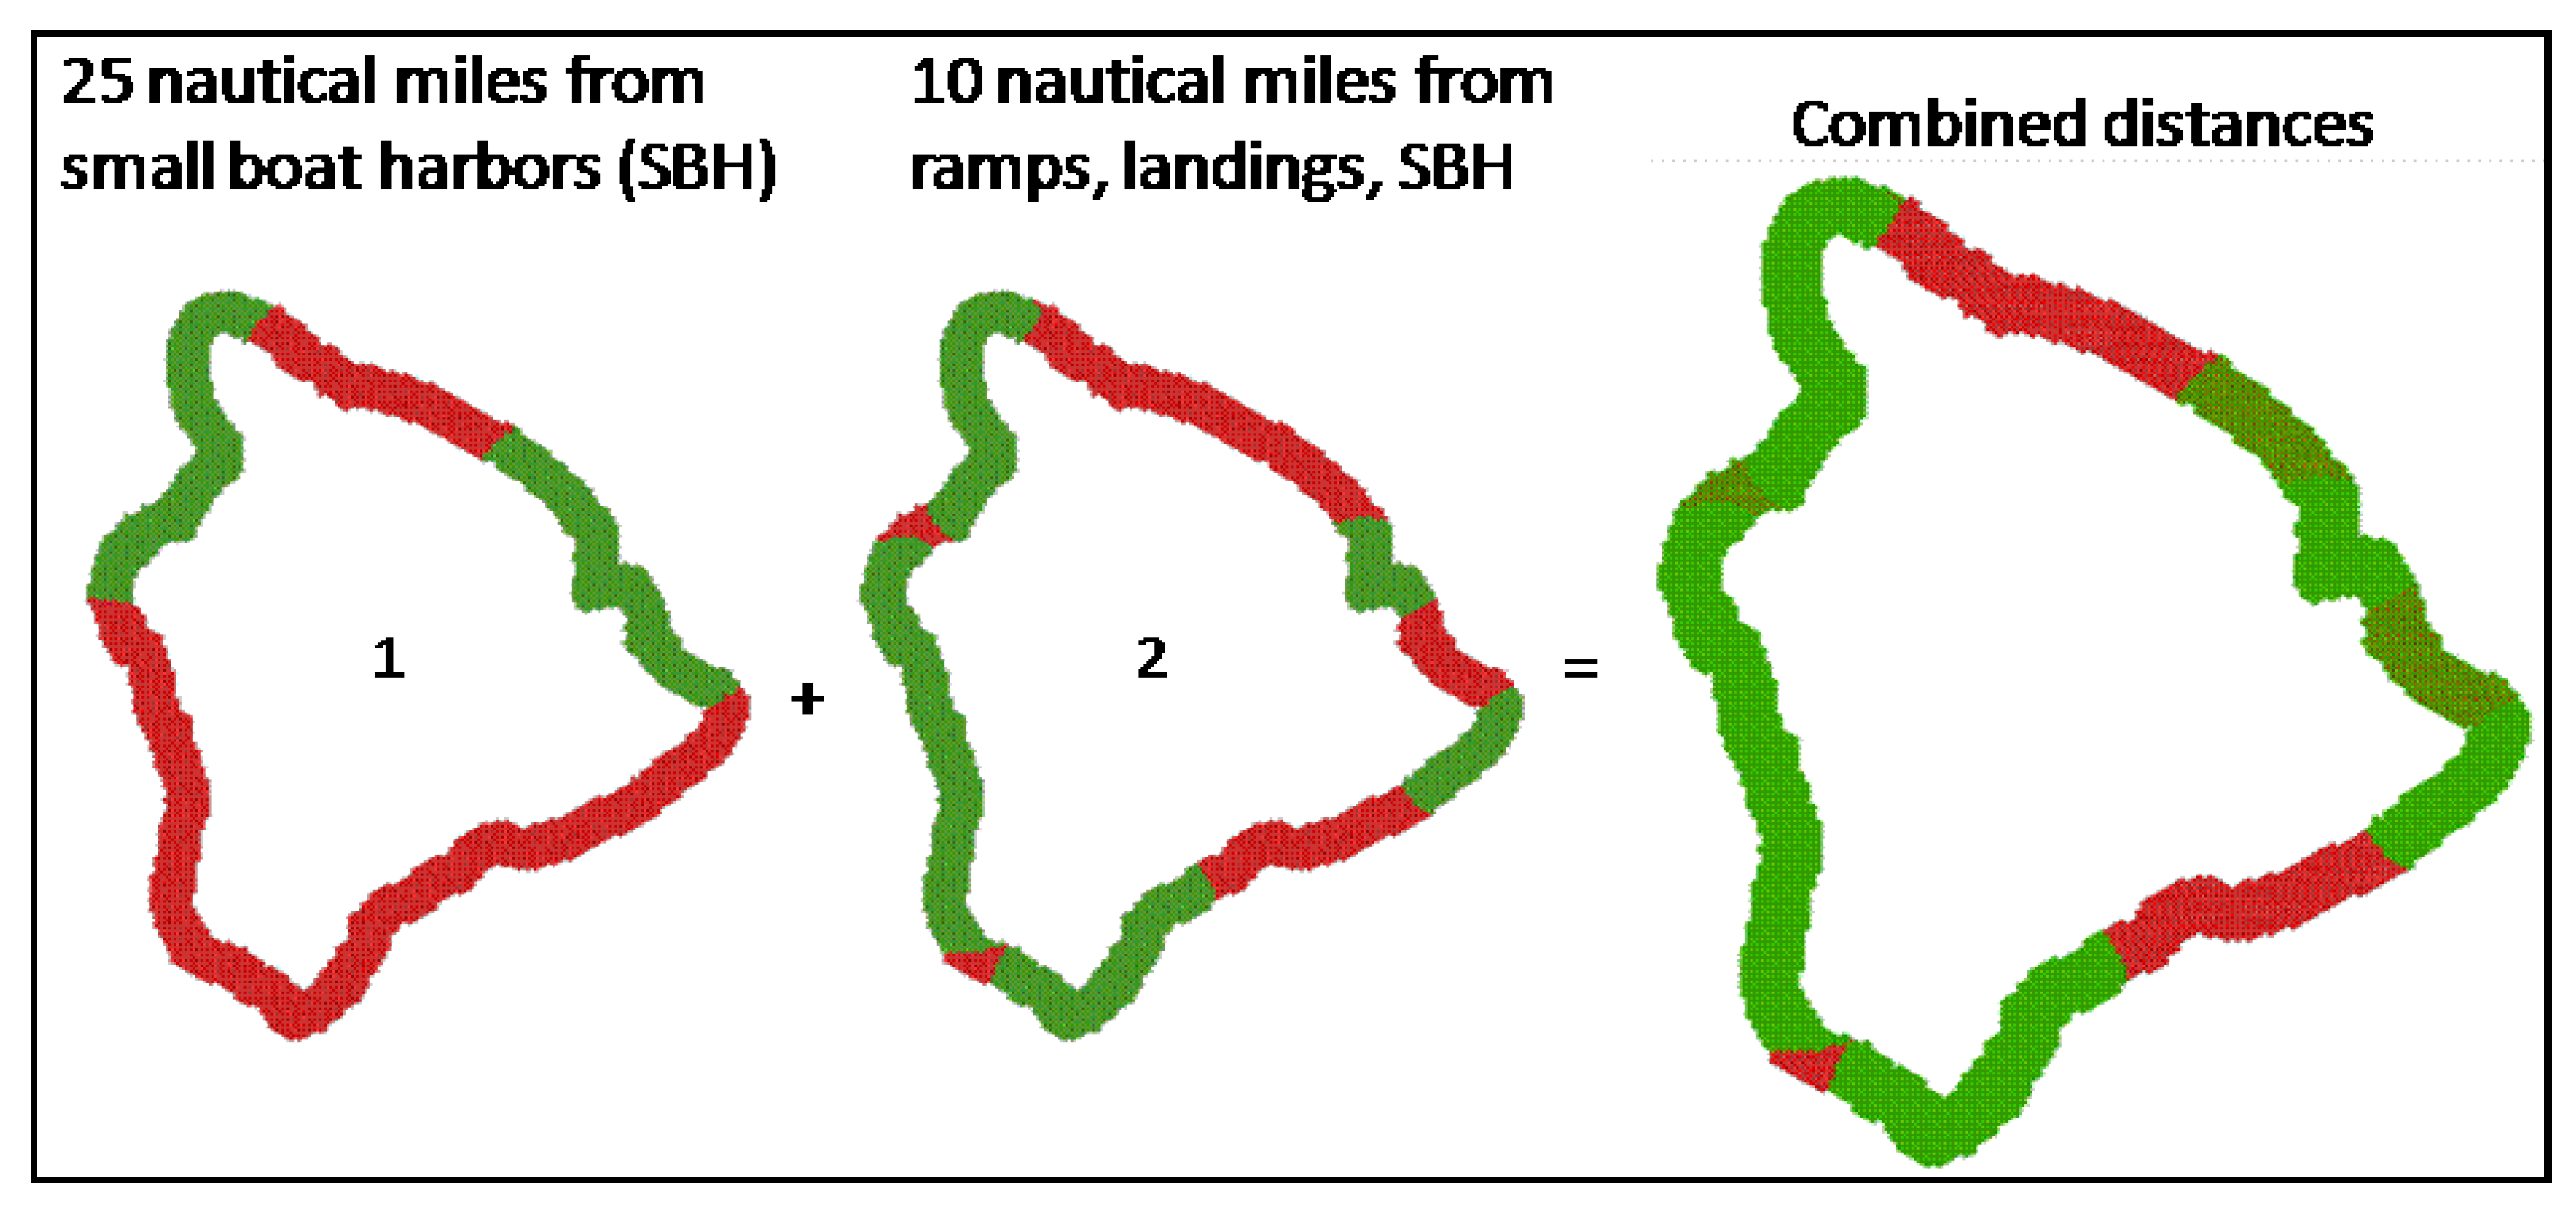
| Distance to Site | m | 25 nm from harbor, 10 nm from ramp | 25 nm from harbor, 10 nm from ramp | 25 nm from harbor, 10 nm from ramp |
| Salinity | Line and Point data | No Perennial Streams or known SGD | not applicable | No Perennial Streams or known SGD |
| Wave Height | 250 × 250 km | not applicable | not applicable | not applicable |
| Wind Speed | 1.5 × 1.5 km Hourly means | |||
| Chlorophyll-A | 5.5 × 5.5 km Monthly means | not applicable | not applicable | Weeks Chl-A less than 0.05 mg/m3 |

3.2. Models

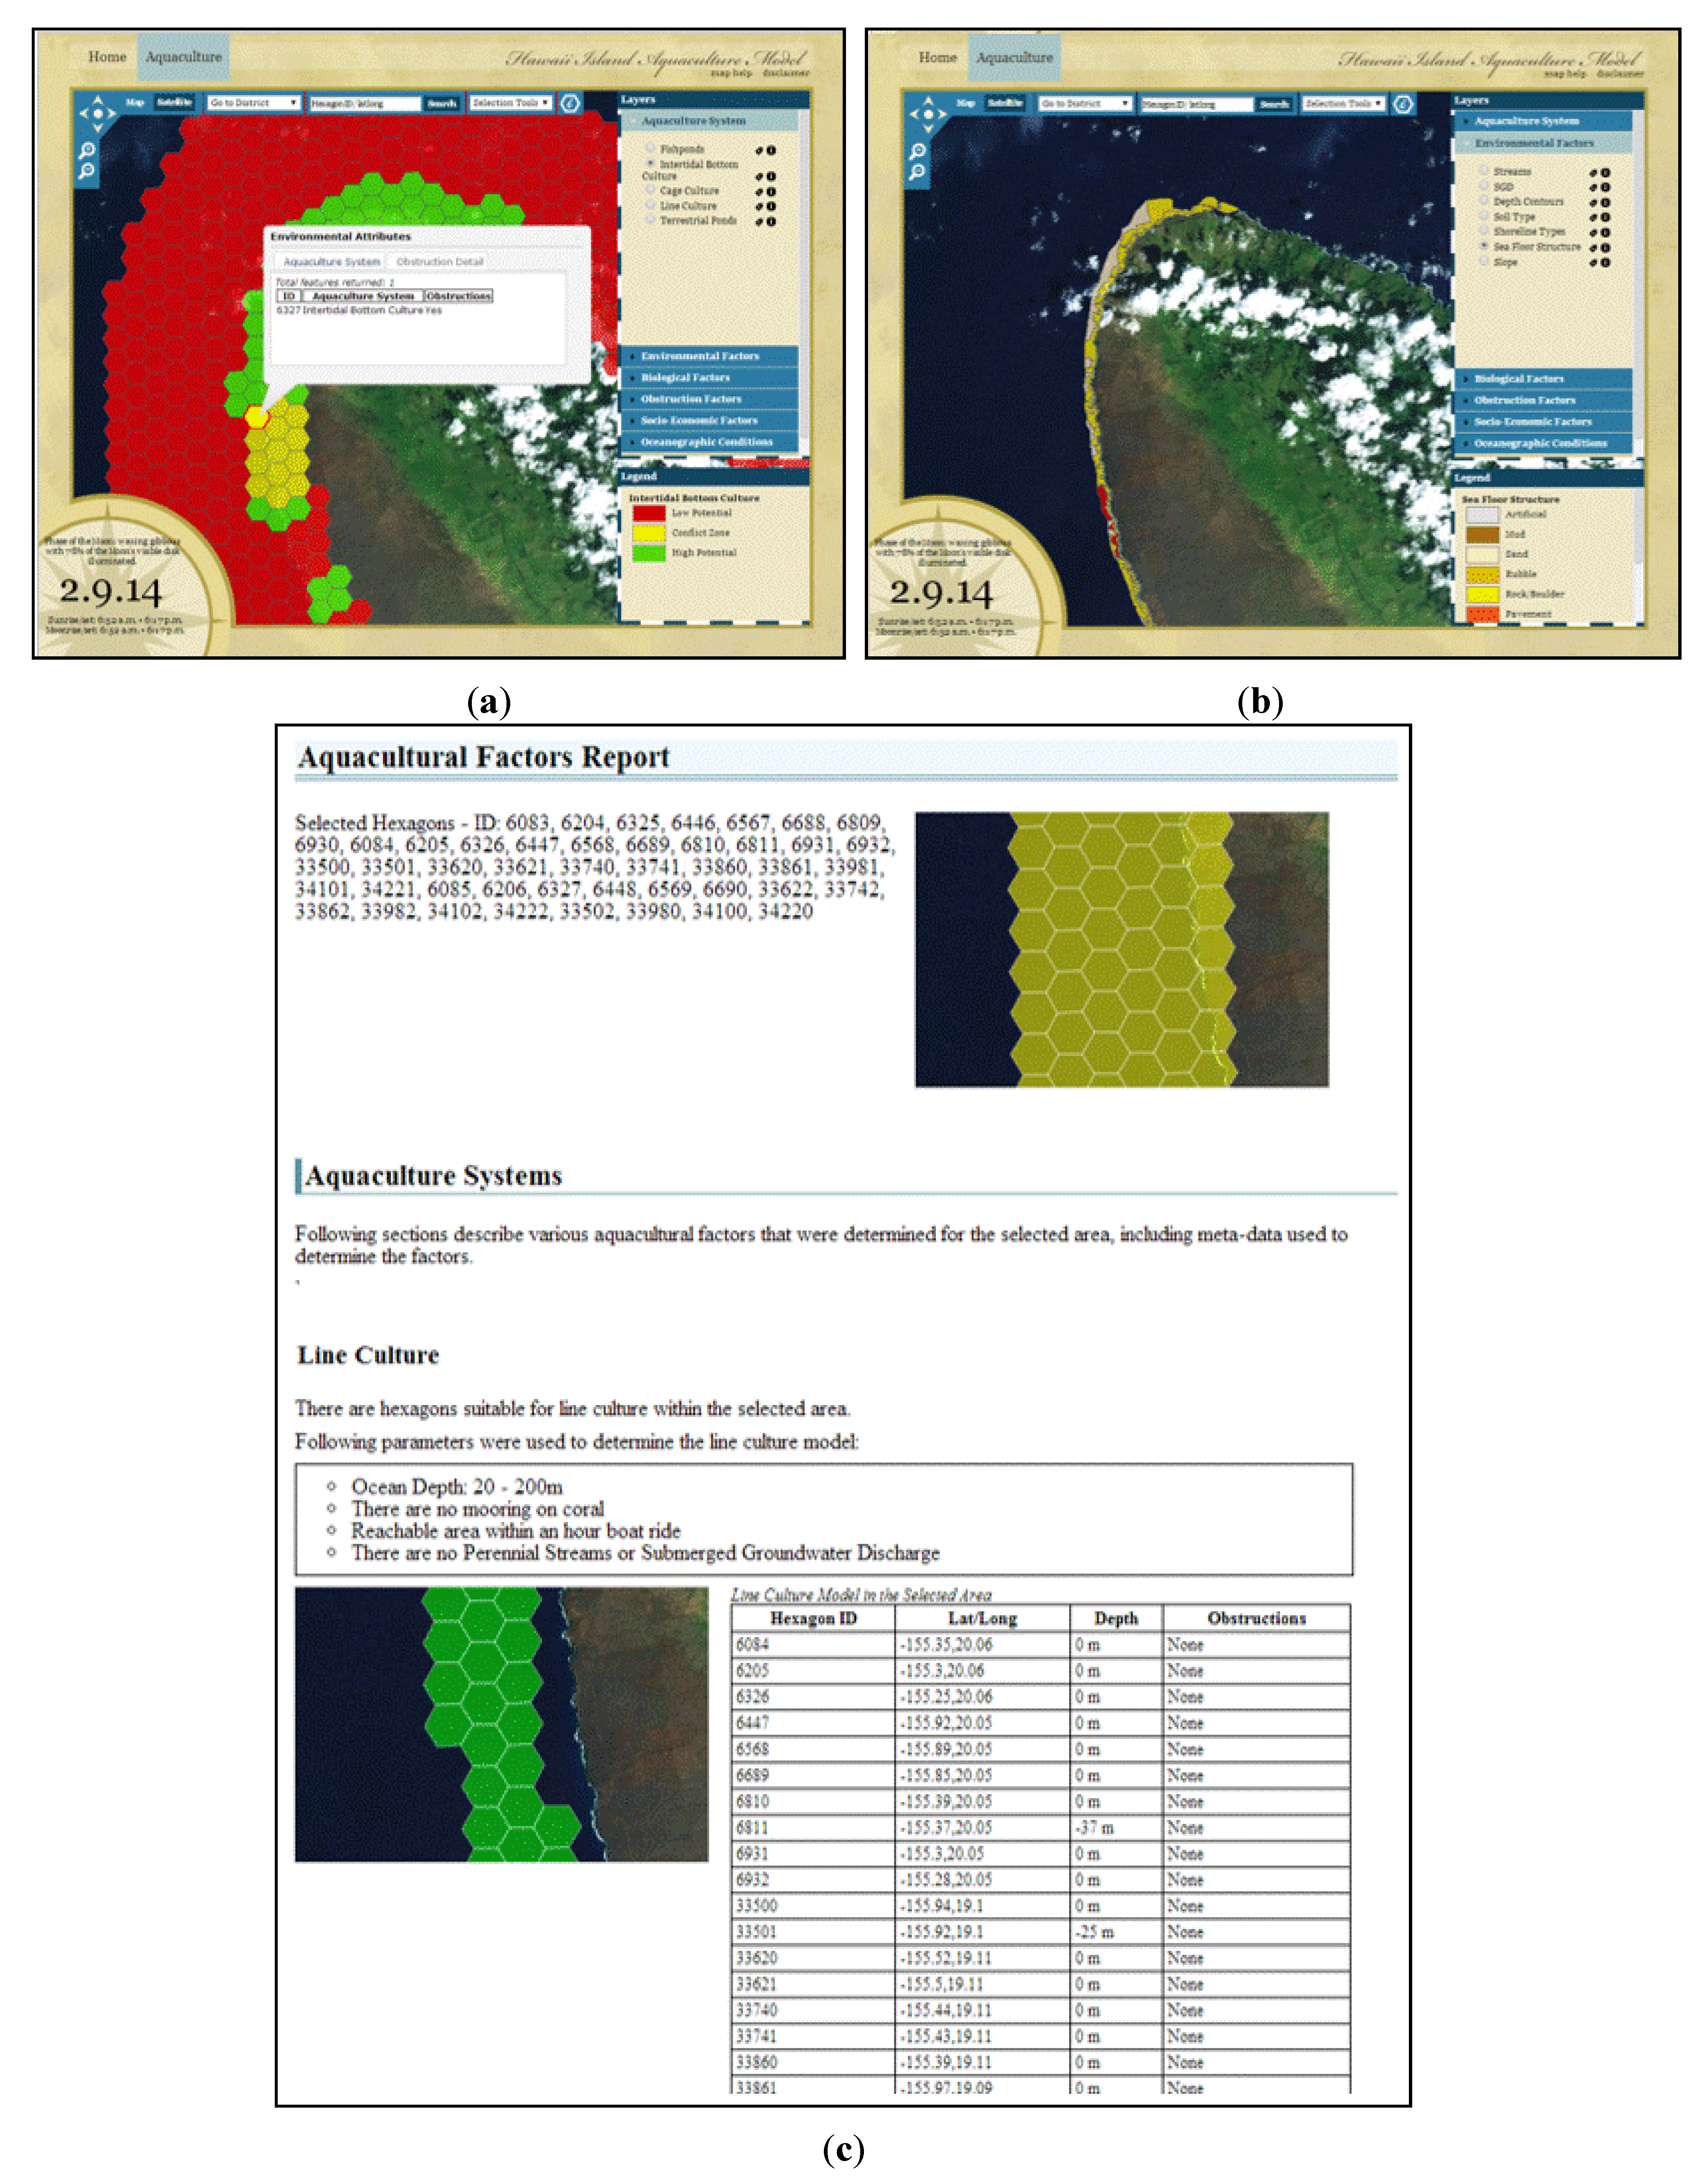
3.3. Web Interface

3.4. Stakeholder Response
3.4.1. State, Federal and Industry Response
3.4.2. Community Responses
4. Discussion
4.1. Temporal and Spatial Scales
4.2. Economic Scales of Operation
4.3. Community Involvement
Acknowledgments
Author Contributions
Conflicts of Interest
References
- Jarmon, C.; Au Bellatti, D.; Mowrey, S. Legal Issues Surrounding the Development of Sustainable Forms of Aquaculture in Hawaiʻi; Publication # 2004–3; University of Hawaiʻi at Manoa, William S. Richardson School of Law: Honolulu, HI, USA, 2004. [Google Scholar]
- Fletcher, K.M.; Neyrey, E. Marine Aquaculture Zoning: A Sustainable Approach in the Growth of Offshore Aquaculture; The World Aquaculture Society: Baton Rouge, LA, USA, 2003; p. 15. [Google Scholar]
- FAO. Part 3—Feeding the World. In FAO Statistical Yearbook 2013; Food and Agricultural Organization of the United Nations: Rome, Italy, 2013; pp. 146–149. [Google Scholar]
- Bostock, J. The application of science and technology development in shaping current and future aquaculture production systems. J. Agric. Sci. 2011, 149, 133–141. [Google Scholar] [CrossRef]
- Klinger, D.; Naylor, R. Searching for solutions in aquaculture: Charting a sustainable course. Annu. Rev. Environ. Resour. 2012, 37, 247–276. [Google Scholar]
- Gullett, W. Incorporating fisheries interests in national oceans policymaking. Coast. Manag. 2012, 40, 222–233. [Google Scholar] [CrossRef]
- Belton, B.; Little, D. The development of aquaculture in Central Thailand: Domestic demand versus export-led production. J. Agrar. Chang. 2008, 8, 123–143. [Google Scholar] [CrossRef]
- Bergquist, D.A. Sustainability and local people’s participation in coastal aquaculture: Regional differences and historical experiences in Sri Lanka and the Philippines. Environ. Manag. 2007, 40, 787–802. [Google Scholar] [CrossRef]
- Rivera-Ferre, M.G. Can export-oriented aquaculture in developing countries be sustainable and promote sustainable development? The shrimp case. J. Agric. Environ. Ethics 2009, 22, 301–321. [Google Scholar] [CrossRef]
- Mazur, N.A.; Curtis, A.L. Understanding community perceptions of aquaculture: Lessons from Australia. Aquac. Int. 2008, 16, 601–621. [Google Scholar] [CrossRef]
- Grigorakis, K.; Rigos, G. Aquaculture effects on environmental and public welfare—The case of Mediterranean mariculture. Chemosphere 2011, 85, 899–919. [Google Scholar]
- Sapkotaa, A.; Sapkotaa, A.R.; Kucharskib, M.; Burkec, J.; McKenzie, S.; Walker, P.; Lawrence, R. Aquaculture practices and potential human health risks: Current knowledge and future priorities. Environ. Int. 2008, 34, 1215–1226. [Google Scholar] [CrossRef]
- FAO Fisheries and Aquacutture Department. Part 1 World Review of Fisheries and Aquaculture. In The State of World Fisheries and Aquaculture; Food and Agriculture Organization of the United Nations: Rome, Italy, 2012; pp. 26–46. [Google Scholar]
- Nath, S.S.; Bolte, J.P.; Ross, L.G.; Aguilar-Manjarrez, J. Applications of geographical information systems (GIS) for spatial decision support in aquaculture. Aquac. Eng. 2000, 23, 233–278. [Google Scholar] [CrossRef]
- Sanchirico, J.N.; Lew, D.K.; Haynie, A.C.; Kling, D.M.; Layton, D.F. Conservation values in marine ecosystem-based management. Mar. Policy 2013, 38, 523–530. [Google Scholar] [CrossRef]
- Nobre, A.M.; Bricker, S.B.; Ferreira, J.G.; Yan, X.; De Wit, M.; Nunes, J.P. Integrated environmental modeling and assessment of coastal ecosystems: Application for aquaculture management. Coast. Manag. 2010, 39, 536–555. [Google Scholar]
- Schuurman, N. Critical GIScience in Canada in the new millennium. Can. Geogr. 2009, 53, 139–144. [Google Scholar] [CrossRef]
- Weller, F. “Down-to-Earth” is imperative! On the problems of landscape-ecological regionalisation by means of multivariate statistical methods. ERDE 2009, 140, 113–125. [Google Scholar]
- The Empty Promise of Ocean Aquaculture in Hawaiʻi. Food & Water Watch 2010.
- Hawaiʻi Department of Agriculture; Department of Land and Natural Resources. Report to the Twenty-Fifth Legislature State of Hawaiʻi 2010 Regular Session Implementation of Chapter 190d, Hawaiʻi Revised Statutes Ocean and Submerged Lands Leasing. In Response to Section 12 of Act 176, Session Laws of Hawaiʻi 1999. Available online: http://files.hawaii.gov/dlnr/reports-to-the-legislature/2010/land/LD10-OceanLeasingRpt.pdf (accessed on 2 June 2014).
- Ferdana, Z. Approaches to Integrating a Marine GIS into the Nature Conservancy’s Ecoregional Planning Process. In Marine Geography: GIS for the Oceans and Seas; Breman, J., Ed.; ESRI, Inc.: Redlands, CA, USA, 2002; pp. 153–160. [Google Scholar]
- Suryanata, K.; Umemoto, K.N. Tension at the nexus of the global and local: Culture, property, and marine aquaculture in Hawaiʻi. Environ. Plan. A 2003, 35, 199–213. [Google Scholar] [CrossRef]
- Suryanata, K.; Umemoto, K. Beyond environmental impact: Articulating the intangibles in a resource conflict. Geoforum 2005, 36, 750–760. [Google Scholar] [CrossRef]
- Bugs, G.; Granell, C.; Fonts, O.; Huerta, J.; Painho, M. An assessment of Public Participation GIS and Web 2.0 technologies in urban planning practice in Canela, Brazil. Cities 2010, 27, 172–181. [Google Scholar] [CrossRef]
- Ball, J. Towards a methodology for mapping regions for sustainability using PPGIS. Progress Plann. 2002, 58, 81–140. [Google Scholar] [CrossRef]
© 2014 by the authors; licensee MDPI, Basel, Switzerland. This article is an open access article distributed under the terms and conditions of the Creative Commons Attribution license (http://creativecommons.org/licenses/by/3.0/).
Share and Cite
Puniwai, N.; Canale, L.; Haws, M.; Potemra, J.; Lepczyk, C.; Gray, S. Development of a GIS-Based Tool for Aquaculture Siting. ISPRS Int. J. Geo-Inf. 2014, 3, 800-816. https://doi.org/10.3390/ijgi3020800
Puniwai N, Canale L, Haws M, Potemra J, Lepczyk C, Gray S. Development of a GIS-Based Tool for Aquaculture Siting. ISPRS International Journal of Geo-Information. 2014; 3(2):800-816. https://doi.org/10.3390/ijgi3020800
Chicago/Turabian StylePuniwai, Noelani, Lisa Canale, Maria Haws, James Potemra, Christopher Lepczyk, and Steven Gray. 2014. "Development of a GIS-Based Tool for Aquaculture Siting" ISPRS International Journal of Geo-Information 3, no. 2: 800-816. https://doi.org/10.3390/ijgi3020800