Article

Field Spectroscopy Metadata System Based on ISO and OGC Standards

by
Marcos Jiménez
1,*,
Magdalena González
1,
Alberto Amaro
2 and
Alix Fernández-Renau
1
1
Remote Sensing Area, National Institute of Aerospace Technology (INTA), Ctra. Ajalvir s/n, Torrejón de Ardoz, 28850 Madrid, Spain
2
Technical Cabinet, Spanish Agency for International Development Cooperation (AECID), Avda. Reyes Católicos, 4, 28040 Madrid, Spain
*
Author to whom correspondence should be addressed.
ISPRS Int. J. Geo-Inf. 2014, 3(3), 1003-1022; https://doi.org/10.3390/ijgi3031003
Submission received: 28 April 2014 / Revised: 2 July 2014 / Accepted: 8 July 2014 / Published: 21 July 2014

Abstract

:
Field spectroscopy has undergone a remarkable growth over the past two decades in terms of use and application to different scientific disciplines. This work presents an important step forward to improve the interoperability for the spectral library interchange in the field spectroscopy scientific community, by establishing an XML-based metadata system using published International Organization for Standardization (ISO) standards and Open Geospatial Consortium (OGC) specifications. The proposed methodology is structured using three different XML files: each spectral library file acquired during a field campaign is accompanied by an XML file encoded according to the ISO 19156 standard, which carries the information related to the material or surface measured and the sampling procedure applied; the spectral libraries acquired on the same date share an XML file encoded according to the ISO 19115 standard, to represent dataset-level metadata; finally, all of the spectral libraries for the entire field campaign are referenced to an XML file encoded according to the Sensor Model Language (SensorML) specification, for information related to the field spectrometer characteristics and status. This structure ensures that the ISO 19156 files are not very large and avoids the repetition of many common metadata elements required to describe the dataset and sensor description.

Graphical Abstract

1. Introduction

The exploration and monitoring capacity of remote sensing to study the Earth’s surface and atmosphere has progressed significantly with the introduction of hyperspectral techniques [1]. Among these techniques, imaging spectroscopy is well developed for airborne platforms, but it is still in its very initial stages for spaceborne instruments [2]. In this sense, forthcoming space missions, like EnMAP [3] or PRISMA [4], will represent a great stimulus to move forward the consolidation of this technique. Field spectroscopy pre-dates the development of airborne or spaceborne imaging spectroscopy by many years [5] and has undergone a remarkable growth over the past two decades in terms of its use and its application to different scientific disciplines, due to its great support to hyperspectral remote sensing.
One of the main purposes of field spectroscopy is to build spectral libraries during planned field campaigns: spectral libraries are collections of spectra that characterize the reflectance or emissivity spectral response of Earth’s surfaces and materials. A field campaign must be planned taking into account: the objectives of the spectral libraries, the accessibility of the study area, field instrumentation transport and setup, the sampling protocol, the target selection and foreseeing the best possible conditions in terms of the atmosphere and solar illumination.
The important constraints imposed by the complexity of natural illumination environments and the huge variability in the constituents of a field spectroscopy campaign (i.e., measurements sites, targets, sampling protocol) demand a complete metadata system to report about what has been measured and the conditions under which the measurement was carried out [6]. Furthermore, this demand has proliferated, because the spectral libraries are increasingly being shared, interchanged and used for purposes other than those that they were produced for [7], and also, the field spectroscopy community shows variability in technical and scientific background regarding the users’ experience, equipment and applications [8].
Metadata supports the interpretation of scientific data in general, helps ensure long-term usability and provides a basis for the assessment of data quality [9]. A metadata procedure based on electronic files guarantees the exchange of data between systems and improves the sharing of data between scientists. Most of the recent metadata systems developed by remote sensing organizations are based on the Extensible Markup Language (XML) W3C specification. Since XML documents are human readable and reasonably clear, this format has been accepted by many knowledge and data sharing communities as the best format to interchange information [10].
There are a few different XML-based metadata methodologies that have been applied for field spectroscopy data interchange: (1) the most relevant and first approach is SPECCHIO [11], which is a spectral database developed by the Remote Sensing Laboratories of the University of Zürich; currently, it is a free available tool based on MySQL database and a Java client application; in its latest release, it has the option to read XML files generated by SPECCHIO [12]; (2) the Ecological Society of America (ESA) has implemented the Ecological Metadata Language (EML) specification [13], focused on ecological data cataloging; for example, it has been adopted by International Long Term Ecological Research (ILTER) as the metadata language for instrumentation and data; (3) the National Institute of Standards and Technology (NIST) has developed the markup language, SpectroML [14], for use as a standard in data exchange and archiving, including associated metadata related with molecular spectrometry; (4) the most recent work has been carried out by the Environmental Earth Observation of the Commonwealth Scientific and Industrial Research Organization (CSIRO) and the School of Geosciences at the University of Edinburgh [7], adapting and optimizing SpectroML for field spectroscopy data and metadata.
There is no international standard developed specifically for field spectroscopy metadata [6]. The important step forward will arrive when a common system is created and the different field spectroscopy organizations can speak the same metadata language. In this regard, the Infrastructure for Spatial Information in the European Community (INSPIRE) Directive (2007/2/EC) establishes a common understanding of the semantics of the data to ensure correct and proper use and interpretation of the data by owners and users. A standardized structure for metadata could also help increase the value of metadata by improving its readability, flexibility and utility for archival processing and usage with software applications. The most relevant organizations publishing standards to define common metadata structures and their hierarchies are the International Organization for Standardization (ISO) and the Open Geospatial Consortium (OGC). These organizations specify the required metadata, their relations and dependencies, the data type, their restrictions and, when needed, the allowed values. All of this information must be filled out in a well-defined XML structure. Finally, the specifications facilitate the basis to create an XML Schema to verify the standard compliance of an XML document.
An example of a complete and active metadata architecture that takes advantage of these international standards is the European Space Agency (ESA) initiative on Heterogeneous Missions Accessibility (HMA) [15]. The HMA was established with the aim of harmonizing the access to data from heterogeneous Earth Observation missions. These missions range from national missions to the Sentinels missions developed within the European Earth Observation program, Copernicus.
The present approach intends to address the standardization for field spectroscopy metadata. In this work, we propose a methodology to define a metadata architecture based on ISO standards and OGC specifications, with the aim of establishing a well-built XML documentation frame appended to the spectral libraries acquired in a field campaign that can be used as a generic means to carry as much information as possible about datasets in a standardized way.

2. Background: Field Spectroscopy Data and Metadata

Field spectroscopy is the measurement of high resolution spectral radiance or irradiance in the field to derive the reflectance or emissivity spectral signatures of Earth’s surface targets under natural environmental conditions. In comparison with airborne or spaceborne imaging spectroscopy, the sensing instrument in the field can remain fixed over the subject of interest for much longer, and the path length between the instrument and the object being measured is reduced [5].
There is a great variety of scientific disciplines in which the use of field spectroscopy is already consolidated: geology, agriculture, forestry and, recently, urban and marine environments [16]. Regardless of the scientific discipline involved, the main applications are [17]: (1) to relate spectral curves with bio-physical and bio-chemical process; (2) to predict the most favorable spectral, radiometric and viewing geometry configuration and the optimum time during the year to carry out a particular remote sensing task; (3) to calibrate, validate and simulate remote sensing data and products.
Prior to presenting the metadata methodology proposed in this work, we outline in the following sections the current status of field spectroscopy data, the basis for a metadata system implementation and the current international metadata standards and specifications available.

2.1. Field Spectroscopy Data: Current Status

Nowadays, field imaging spectroscopy is getting more relevance and has good future prospects [18], but here, the current status of reflectance spectra measurement using field non-imaging devices, which has been well described by several authors [5,19,20,21], is summarized:
(a)
The rugged and portable spectroradiometers developed have been evolved from the non-imaging spectrometers currently used in the laboratory. Spectral radiance measurement using a fiber-optic bundle, with the possibility to attach different optics for field of view (FOV) variation, has become widespread in recent years. Furthermore, contact probes have been developed for very small spatial scale observations, making the measurements independent of the illumination condition. Manufacturers basically offer two kinds of spectroradiometer: (1) small, light devices that are designed to work only in the visible near-infrared spectrum (VNIR: 350–1000 nm), with levels of the signal-to-noise ratio (SNR) around 250:1; and (2) less small and light devices that work in the entire solar spectrum, with actively cooled short wave infrared detectors (SWIR: 1000–2500 nm) and an SNR around 1000:1. Depending on the application considered, the configuration of these spectroradiometers is more variable in terms of sampling interval and spectral resolution. The typical configuration is to have a full width half maximum (FWHM) of nearly 3 nm in the VNIR spectral region, and a FWHM of nearly 10 nm in the SWIR.
(b)
The most widely used acquisition methodology to obtain near-ground reflectance is single beam, where the same instrument is used to measure both the target and the reference panel spectral radiance. In this case, Spectralon® (Labsphere, North Sutton, NH, USA) has been established as the standard material for panels, due to its near-perfect Lambertian response. Even in a cloudless sky and high Sun zenith angles, the most simultaneous radiance acquisition between the panel and target is recommended. The other methodology is dual beam, in which one spectroradiometer measures the radiance of the target and the second one measures the Sun irradiance using a cosine receptor or an integrating sphere. In both methodologies, the measurement reported should be properly described as hemispherical-conical reflectance factors (HCRF) [22]. Measurements with field spectroradiometers are often hand-held, usually with the sensor head mounted on a pole or yoke to keep it away from the operator’s body. Over the years, other platforms, like balloons [23] or helicopters [24], have been researched to make more automated remote observations. Among them, remotely piloted air systems (RPAS), although challenging, offer a great degree of automation and fast throughput [25].
(c)
For a proper sampling strategy design, field campaigns are carried out based on a precise planning of the distribution, number and size of the measurements sites and targets. Stratified areas can be generated using the vegetation and topography cartography of the study area. For measurement site location or artificial target installation, in vicarious calibration activities, the accessibility of the study area must be taken into account. The size of the plot is relevant for surface spectral response characterization, but not for material spectral libraries. The selection of the targets is normally made by random sampling or transects, but each target must represent the “normal” state of the surface or material to be measured (i.e., avoiding damaged, sick or growing specimens in a plant spectral library). The number of samples is dependent on surface heterogeneity and accuracy requirements [17]. It is very important to record information from the auxiliary instrumentation used (i.e., GPS receiver, camera).
(d)
The major constraints imposed by a complex natural lighting environment require spectra acquisition to be accompanied by information about solar angles and the type and percentage of clouds present. For example, taking sky pictures (hemispherical or not) offers support for data interpretation. Furthermore, it could be very helpful to give information about the most variable atmospheric conditions, like aerosol optical thickness (AOT), ozone and water vapor content. These measurements could be acquired using portable Sun photometers (i.e., MICROTOPS II, Solar light, Glenside, PA, USA) or a ground-based remote sensing aerosol network, such as the Aerosol Robotic Network (AERONET) [26].
(e)
The spectroradiometer usually has the option to register target and panel radiance measurements jointly in the same file or in separate files. Either way, for spectra pre-processing, when reflectance is calculated per each reading, the file must be exported to a compatible format using a sensor manufacturer’s software. Depending on the noise of the spectra, polishing techniques could be applied, but being very conservative with information preservation [27]. In the spectra post-process, the average reflectance and standard deviation are calculated for all measurements on the same target. To save the data ready for the scientific community, a widespread file format can be used, like ASCII, Hierarchical Data File (HDF) and jcamp-dx, or a commercial imaging software format, like ENVI’s spectral library (Exelis Visual Information Solutions, Inc., Boulder, CO, USA).
(f)
Uncertainty calculation is fundamental for data quality estimation. Despite the different results obtained with different sampling strategies, the main sources of uncertainty in a field spectroscopy campaign derive from the instrumentation performance (sensor, reference panels, GPS) and environmental conditions (atmosphere and illumination) [28]. For data interchange between organizations, the spectroradiometer must be calibrated periodically, and its traceability must be reported. In this sense, the repeatability of the instrument for constant and stable measurement conditions must be evaluated in the laboratory using an integrating sphere, and the reproducibility of the instrument for variant field conditions (i.e., under varying temperatures, pressures and humidity) could be quantified using panel measurements during the field campaign.

2.2. Field Spectroscopy Metadata: The Basics

Any kind of digital geographic data should be documented, as much as possible, to ensure that the data producer can characterize the geographic data properly and enable users to apply the data in the most efficient way [29]. To design a metadata system, it is necessary to identify the metadata categories and elements that are critical for a valid and reliable data interchange [30]. As with any other geographic data, field spectroscopy will have some specific metadata elements to report the fundamental aspects of the technology and also some general metadata elements that make it easier to unravel the data essentials.
In previous works by Milton et al. [5] and Hueni et al. [11], the most important categories for field spectroscopy metadata were highlighted: the description of the instrumentation used, the measurement method applied, the aspects of the field campaign carried out, the description and location of the surface measured and the illumination and atmospheric conditions at the moment of acquisition. Recently, in a very conscientious work by Rasaiah et al. [31], a complete survey to determine the metadata elements for field spectroscopy was accomplished based on the input of experts in their respective domains. The international metadata standards and specifications published by ISO and OGC (described in Section 3.2) establish a common way to report the information about datasets in terms of: the description of the distributed file, the quality of the data, the point of contact for the person responsible for the data, the spatial representation and the distribution policy.
Metadata should describe resources in ways that will be useful to the users, but towards interoperability, the metadata system must be a common and robust communication system based on a well-defined vocabulary and syntax to support a wide variety of semantic needs [32]. The descriptive quality of a metadata system can be defined via the notions, precision, resolution and repeatability. Precision is the degree of accuracy with which a resource can be represented. Resolution is the ability to differentiate between two similar items. Repeatability is the ability to have the same resource described the same way on two or more occasions [32].
For the implementation of a metadata system, it is strongly recommended to develop an automated software application to fill out metadata files. Such an application needs to extract metadata elements directly from the diversity of information sources involved in field spectra acquisition (i.e., spectrometer, GPS, pictures, Sun photometer). For that software application, we have to consider the different kinds of data recording formats (ASCII or binary) and the data type (i.e., real, integer, text) that we are going to handle to describe the complete range of field spectroscopy metadata aspects.

2.3. International Metadata Standards

The OGC is an international consortium of industry, academic and government organizations, which collaboratively develops publicly-available interface specifications. ISO comprises a network of the national standards institutes of 157 countries. The ISO Technical Committee TC 211 aims to establish a structured set of standards for information concerning objects or phenomena (also called features) that are directly or indirectly associated with a location relative to Earth. The two organizations are very well inter-connected, and some of the OGC’s specifications are ultimately turned into standards published by the ISO.
With regard to metadata for digital geographic data, the most important initiative launched by the OGC is Sensor Web Enablement (SWE). SWE focuses on developing specifications to cover all types of sensors and making them accessible, usable and controllable via the web [33]. Two relevant SWE specifications closely related with metadata are the Sensor Model Language (hereinafter, SensorML) [34] and observations and measurements (hereinafter, O&M) [35]. The SensorML describes the procedure by which an existing observation has been obtained, including the sensor measurement process, as well as any post-processing applied to the raw observations. The O&M model is relevant for the knowledge and interpretation of the data provided through sensors, being spaceborne or airborne and in situ or ex situ.
Current standards published by the ISO in connection with metadata comprise ISO 19115:2003 “Geographic Information—Metadata” where the mandatory and recommended metadata for documented geographic data are defined. ISO 19115:2006 Cor. 1:2006 “Geographic Information—Metadata—Technical Corrigendum 1” represents a modification of the previous standard mentioned. Due to the increasing requirements of raster data users, a new release of ISO 19115-2:2009 “Geographic Information—Metadata for imagery and gridded data” was published to incorporate a group of additional metadata to describe the image acquisition and process characteristics. More recently, ISO 19130:2010 “Geographic Information—Sensor data model for imagery and gridded data” was also published to describe the imagery sensors’ geometry characteristics in depth. The ISO has adapted the O&M specification from the OGC to publish the standard ISO 19156:2011 “Geographic Information—Observations and Measurements”. Finally, ISO 19157:2013 “Geographic Information—Data Quality” establishes the principles to describe the quality of geographic data.
The ISO standards contain a precise definition for mandatory and optional metadata elements and attributes to be included. Furthermore, ISO 19106:2004 “Geographic Information—Profiles” describes how to extract some of the elements and create a profile. This would be useful for determining the minimum group of metadata elements and attributes required to describe the data.
All of these specifications and standards are established and implemented to write the metadata information in XML files. The XML files generated must be well formatted and must accomplish the requirements of data hierarchy and typology according to a predetermined XML Schema file. There are several languages to define these schemas: the most usual of the previously referred specifications has been the W3C XML Schema Language [36]. The impossibility of defining constraints and dependencies between the elements or attributes found in the W3C XML Schema Language 1.0 release has led to using Schematron [37] in some of the newest specifications. From April 2012, the W3C XML Schema Language release 1.1 corrects many of the shortcomings previously commented on in 1.0. In this sense, current recommendations from the ISO and OGC organizations related with the implementation of schemas to meet standards, as for example in ISO19139:2007 “Geographic Information—XML implementation”, specifically describe how the XML documented should be implemented in terms of constraints on the structure and content. The ISO Schema files can be downloaded from [38]. In the case of the OGC, the Schemas files can be found in [39].

3. Metadata Proposed Methodology

3.1. The INTA Field Spectroscopy Data

The Spanish Institute for Aerospace Technology (INTA) is a public research organization attached to the Spanish Ministry of Defence. The Remote Sensing Area of INTA is responsible for INTA’s remote sensing technological research and application development activities. It is also responsible for providing technical advice to civilian and military users of Earth Observation systems.
INTA’s spectroradiometer for field spectroscopy is an ASD FieldSpec3 (Analytical Spectral Devices, Boulder, CO, USA). The FieldSpec3 collects energy using a fiber-optic with the possibility of adapting different fore optic lenses. It works on a spectral range from 350 to 2500 nm with a spectral resolution of 3 and 10 nm and a sampling interval of 1.4 and 2 nm, for the spectral regions of the VNIR and SWIR, respectively.
Regardless of the aim of the field spectroscopy campaign, several spectral libraries are generated for all of the surfaces or materials measured. The distribution data procedure used by INTA is based on the ENVI Spectral Library format, which is a binary file with the reflectance spectra, appended with an additional ASCII header file to be read by ENVI software.
Figure 1. INTA’s categories and elements for its field spectroscopy metadata system.
Ijgi 03 01003 g001
Figure 1 shows the metadata categories and elements determined for INTA’s field spectroscopy metadata system. These categories are based on the previous works mentioned [5,11,31] and the international standards (described in Section 2.3), comprising the most representative metadata-specific aspects: sensor characteristics, methodology of spectra acquisition, campaign information, environmental conditions, description and location of the target. They also include the general aspects of any geographic data: to express the quality of the data, to describe the data format and to indicate the person responsible for the data. The metadata system is supported by an in-house software application that retrieves all of the metadata elements from different sources and then fills out the XML profiles generated based on standards. In Figure 1, the metadata elements for each category that are read directly from the data are indicated with the letter, D; the elements that are manually incorporated by the user interface are indicated by the letter, M; and the elements that are estimated by calculation are indicated by the letter C.
For example, the surface identification element is directly incorporated into the XML documentation, as a result of the direct reading by the in-house software application of the spectra file names. During the field campaign, the files that keep the spectra are named with an identification that describes the surface. Furthermore, to ensure the repeatability of the metadata system, this identification follows the Land Cover Classification System (LCCS). To enhance the precision and resolution of the metadata system to describe the surface measured, a brief surface description element is manually incorporated into the XML (i.e., the name of species in the vegetation measurement).

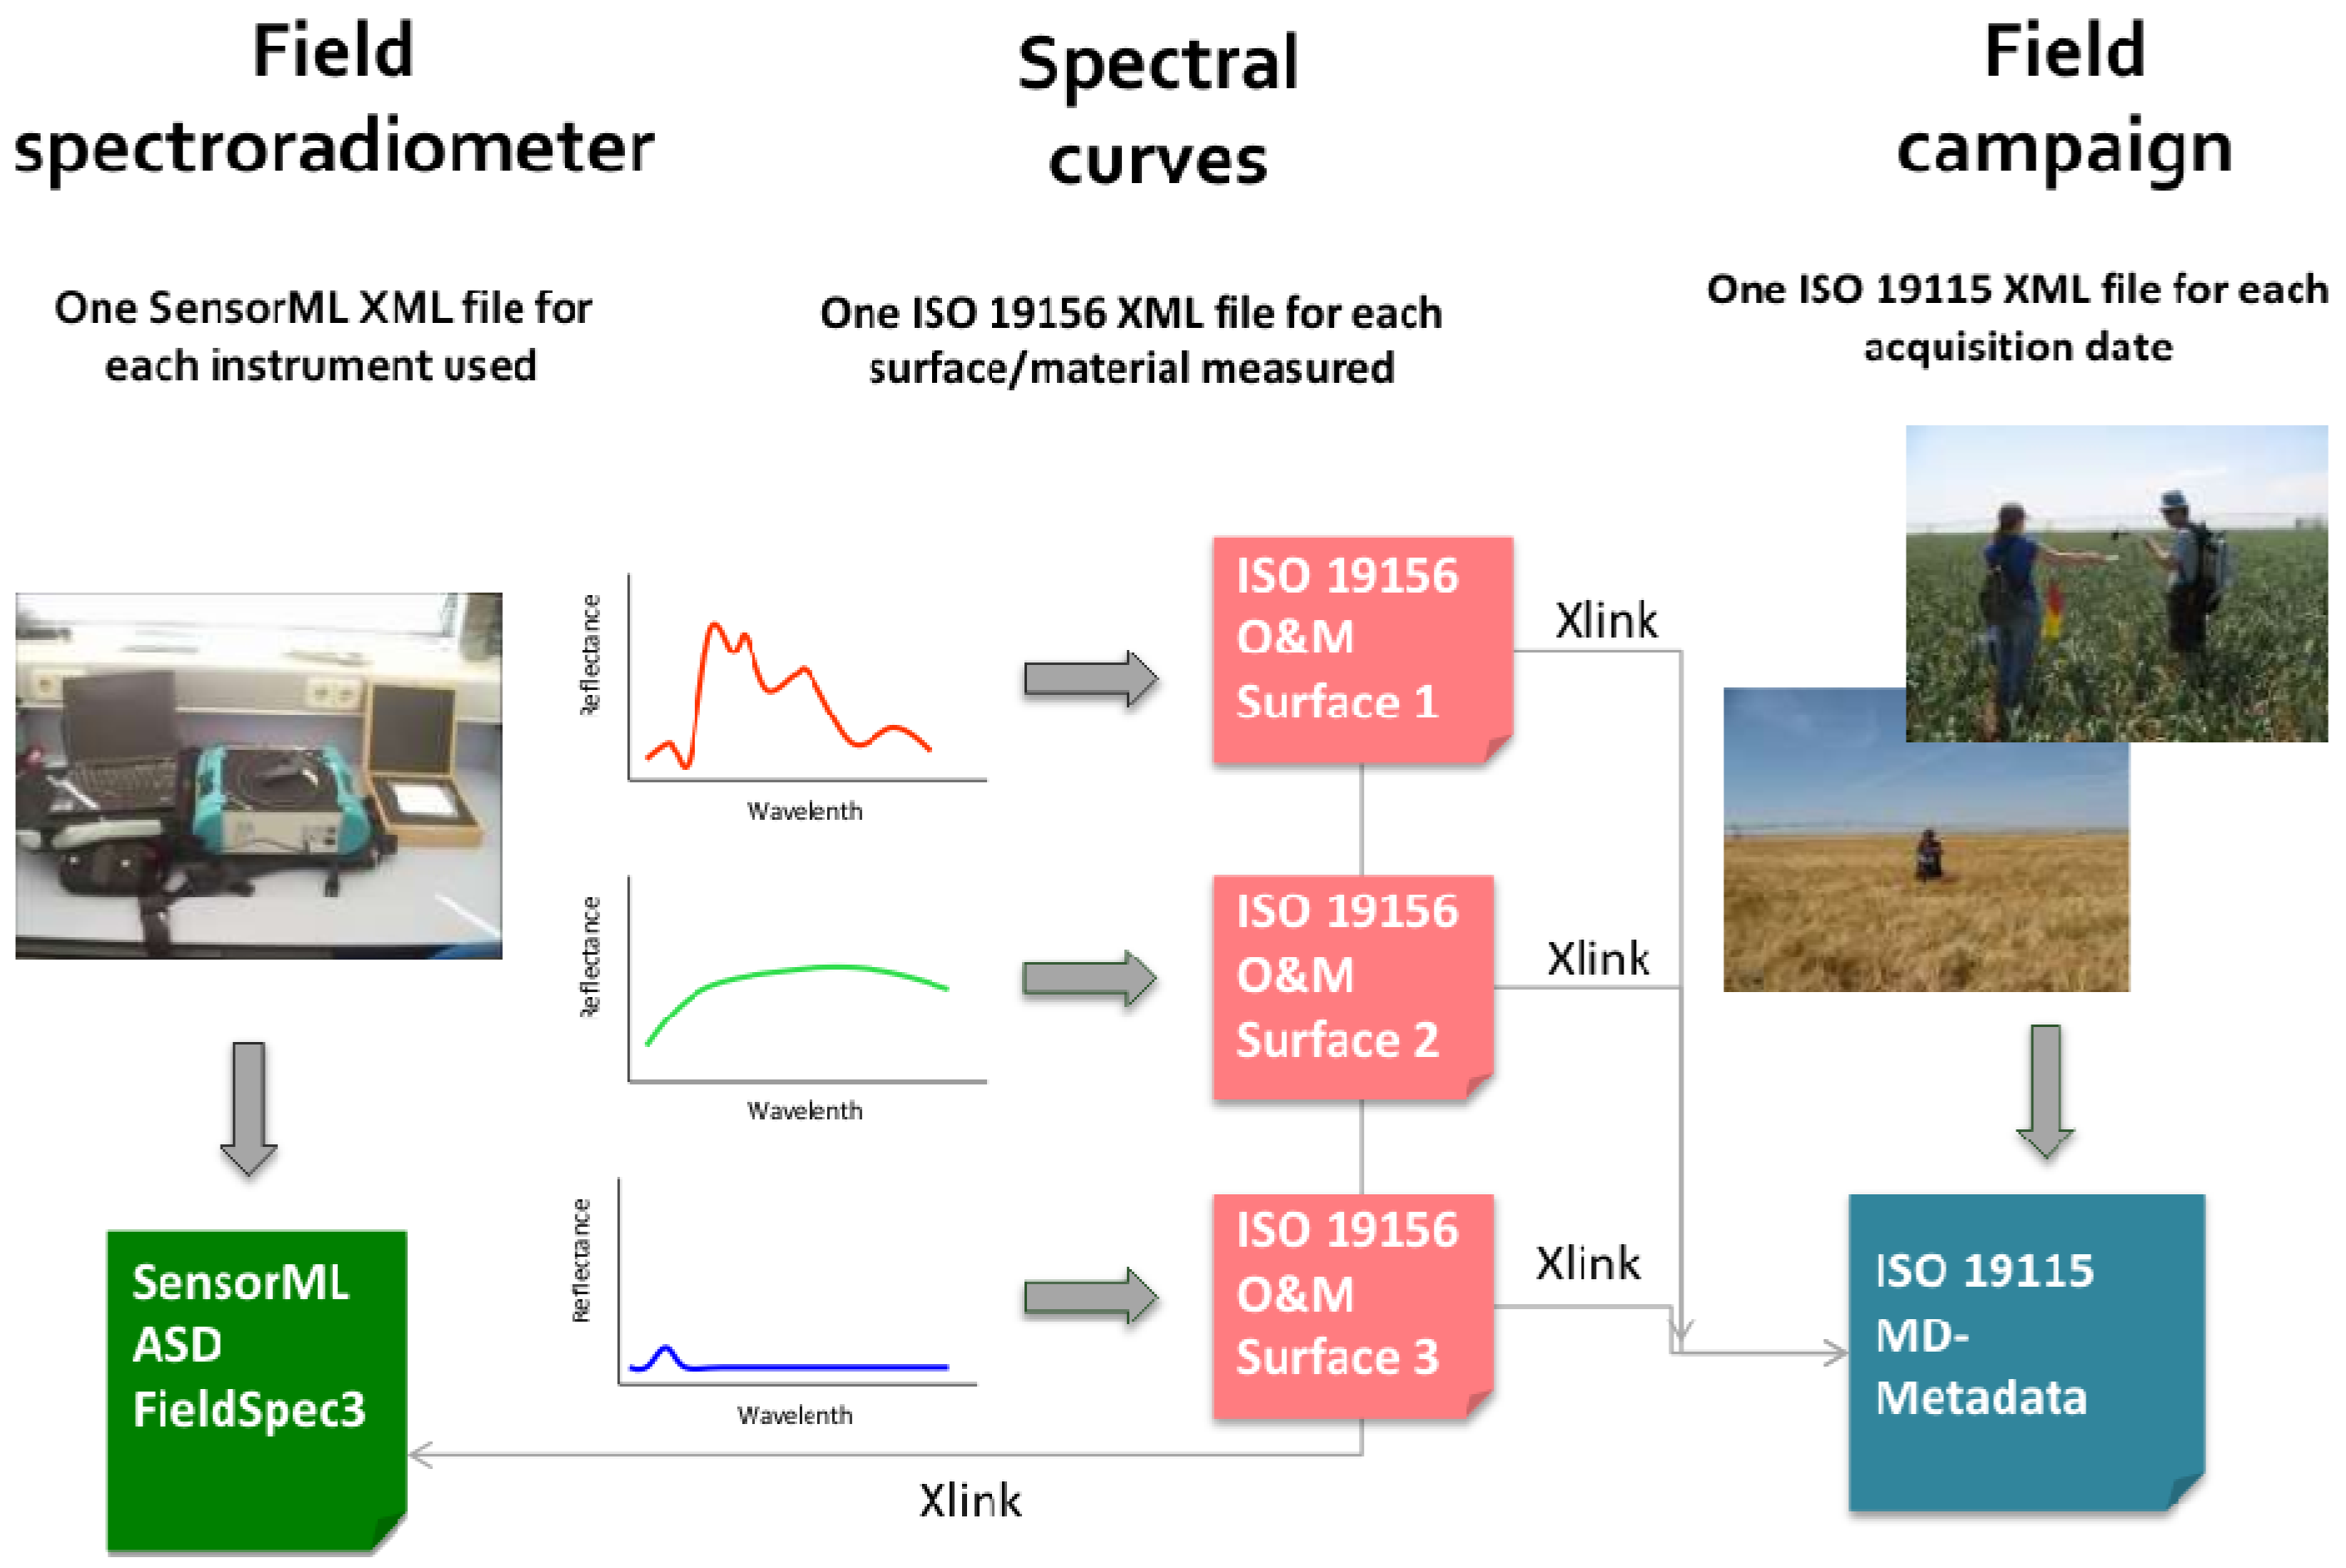
3.2. Metadata General Structure

Figure 2 shows the methodology proposed for reporting the field spectroscopy metadata information. It is structured in three different XML files following three different standards. Each spectral library file acquired during a field campaign is accompanied by an XML file encoded according to the ISO 19156 standard (hereinafter ISO-O&M) to carry property-level and feature-level instance metadata, where all of the information related with the material being observed and the sampling procedure applied are described. A field campaign may extend over two or more days of field work, so all of the spectral library files for the same date share an XML file encoded according to ISO 19115 to represent dataset-level metadata (hereinafter, MD), where all of the aspects of the field campaign are described. Finally, all of the spectral libraries for the entire field campaign share an XML file encoded according to SensorML for information about the sensor characteristics and status.
The three different XML files are interconnected using XML linking language (Xlink, W3C). In every ISO-O&M file, their corresponding MD and SensorML files are referenced by hyperlinks indicating the name of the XML file. Furthermore, Xlink technology is applied to reference all of the specific field spectroscopy terminology used in the metadata information, like reflectance, illumination and observation geometry, etc. The definition of this specific terminology must be as clear and standard as possible, so that they could be linked by Uniform Resource Identifier (URI) to proper global resources, like, for example, the Semantic Web for Earth and Environmental Terminology (SWEET) [40] from the Jet Propulsion Laboratory (JPL). In our case, all of the terminology is referenced by means of hyperlinks to a simple and specific ontology located in an in-house Wikipedia [41], where the concepts have been defined according to the Committee on Earth Observations Satellites (CEOS) glossary [42].
Figure 2. Metadata structure for field spectroscopy based on ISO 19156 (O&M), ISO 19115 (MD) and Sensor Model Language (SensorML).
Ijgi 03 01003 g002

3.3. Description of XML Profiles: SensorML, MD and ISO-O&M

The implementation of an XML file by the ISO standards is based on a series of elements and attributes grouped in entities that correspond to the description of a common aspect of metadata. In every applicable XML Schema, the variety of elements and attributes related to the same area of interest can be identified thanks to its corresponding namespace (the element and/or attribute prefix defined in the schema that provides a method to avoid element name conflicts).
The following subsections describe in detail the three different XML profiles created for the field spectroscopy metadata system shown in Figure 2. These profiles contemplate the simplest case of a spectral library (i.e., just the mean spectra and standard deviation of a surface or material measured). In order to represent better the multiple entities in the different XML profiles, the graphical language, Unified Model Language (UML), is used in the figures accompanying the explanation. UML has been adopted by Open Management Group (OMG) as the standard for modeling software-intensive systems and published as ISO standard ISO/IEC 19501:2005 “Unified Model Language (UML)”.

3.3.1. SensorML for Field Spectroradiometers

The main goal of SensorML is related to the definition of a common format to interchange sensors’ information. Hence, it provides a framework by which sensor and platform capabilities and properties can be published in a server configured to comply with the OGC Sensor Observation Service (SOS) specifications and to allow their discovery by other servers via the Internet. In SensorML, all of the processes involved in sensor architecture, such as the hardware, are considered as components receiving an input, applying an algorithm or procedure and, finally, generating an output. SensorML distinguishes between physical models, defined as the mechanical operation of detectors, and non-physical models, which can be treated as merely mathematical operations. When the model is comprised of a process chain (more than one algorithm) or system (more than one sensor), sequentially ordered components are linked by element connections. The schema is designed so that it can be used to support the processing and geolocation of data from virtually any sensor, whether mobile or dynamic, in situ or remotely sensed, active or passive.
Figure 3 shows the SensorML profile determined for the ASD FieldSpec3 spectroradiometer. The FieldSpec3 is considered to be a system of components. In the left part of Figure 3, all of the attributes that potentially define a system are shown in the UML class diagram. The attributes selected for the INTA profile are: name, description, metadataGroup, input, and output. With name and description, the spectroradiometer can be briefly described using free text. The attribute, metadataGroup, is primarily to support the discovery of resources and assistance for users and includes information about identifiers, classifiers, constraints, capabilities, properties, contacts, documentation sources and history. To illustrate the INTA profile, Figure 3 shows the implementation of the XML elements for some of the attributes used for the ASD Fieldspec3: within identification elements, the name and serial number of the spectroradiometer are indicated, while with point of contact elements, we can report the address and e-mail of the person responsible for the spectroradiometer. The capabilities elements are intended to describe the radiometric, spectral and geometric characteristics of the sensor, and the XML elements shown in Figure 3 indicate the equipment’s actual calibration date.
Figure 3. The SensorML profile to describe the ASD FieldSpec-3 spectroradiometer.
Ijgi 03 01003 g003
The attributes input and output represent “ports” by which external processes exchange data with this process. However, as pointed out in Section 3.1 and Section 3.2, the methodology proposed in this work writes and distributes the field spectroscopy data using the ENVI spectral library format. For this reason, the XML elements of SpectroML for input and output are only used as metadata to describe the physical quantity of inputs to the sensor (spectral radiance) and outputs as the observable property of the target (in our case, spectral reflectance).

3.3.2. ISO 19115 (MD) for Field Spectroscopy Campaign

ISO 19115 (MD) defines an extensive set of metadata elements that provide information about identification, constraints, extents, quality, spatial and temporal schemas, spatial reference and the distribution of digital geographic data. From the eleven possible entities determined in the standard that covers more than 400 metadata elements, a profile has been selected to describe field spectroscopy campaigns, in this case following the recommendations of the Metadata Spanish Core (Núcleo Español de Metadatos, NEM [43]).
Figure 4 shows the MD elements selected for INTA’s field spectroscopy campaign profile. The root entity is MD_Metadata, which is the header element for all of the rest of the elements structured according to a parent-child hierarchy. The namespaces used to describe field spectroscopy campaigns are listed in the root MD_Metadata (upper part of Figure 4).
Figure 4. ISO 19115 profile for field spectroscopy campaign.
Ijgi 03 01003 g004
In the left part of Figure 4, the UML class shows the mandatory attributes for MD_Metadata. Among these, hierarchyLevel references that the field spectra is in the scope to which the metadata applies, indicating the fieldsession in the MD_ScopeCode codelist. MD_Metadata aggregates the rest of the entities defined in the standard to describe the complete data set. Among these, the mandatory MD_Identification entity and the optional MD_Distribution and DQ_DataQuality entities have been selected to describe the field spectroscopy campaign carried out.
The MD_Identification entity is specified by the MD_DataIdentification subclass, which includes a group of elements to identify the dataset. With the aggregated class CI_Citation, we can report the name, date and place of the field campaign. Figure 4 shows, by way of example, the XML implementation to register the name of the project (CVBAF), the date of the measurements (28 April 2011) and the location of the study area (Villacañas, Toledo, Spain). Using the abstract and purpose elements, a brief description of the objective and intention of the spectral library measurements can be reported. Using the CI_Contact aggregated class, the user can find information about the person and organization responsible for the resource. The MD_Keyword aggregated class is used to indicate certain keywords required for search operations. The MD_Usage aggregated class also provides information about any specific application for which the resource has been used, and here, we can indicate the person responsible at the organization for the data requirements. In the SpatialRepresentationInfo element, the field spectra spatial representation is indicated a vector type. Additionally, we chose environment in the element topicCategory as the main theme of the dataset.
The MD_distribution class is used to provide a description of the data distribution format. In Figure 4, the XML implementation shows the child element, MD_Format, to indicate that the ENVI Spectral Library is the format for field spectroscopy data distribution.
The DQ_DataQuality entity contains the scope of the quality assessment. The quality information is related to the data set, so the roles of report and lineage are presented. For the description of the radiometric and geometric accuracy aspects of the data set, the DQ_QuantitativeAttributeAccuracy specific class is used twice. Figure 4 shows the elements to report the radiometric quality of the ASD Fieldspec3 using the parameter, noise equivalent delta radiance (NEDL). Although NEDL is calculated for each spectral band, in the XML file, only three different values (one per detector) were included as a synthesis. In the LI_linage class, where the ProcessStep element is included, we can describe the information about the process carried out to create the dataset.

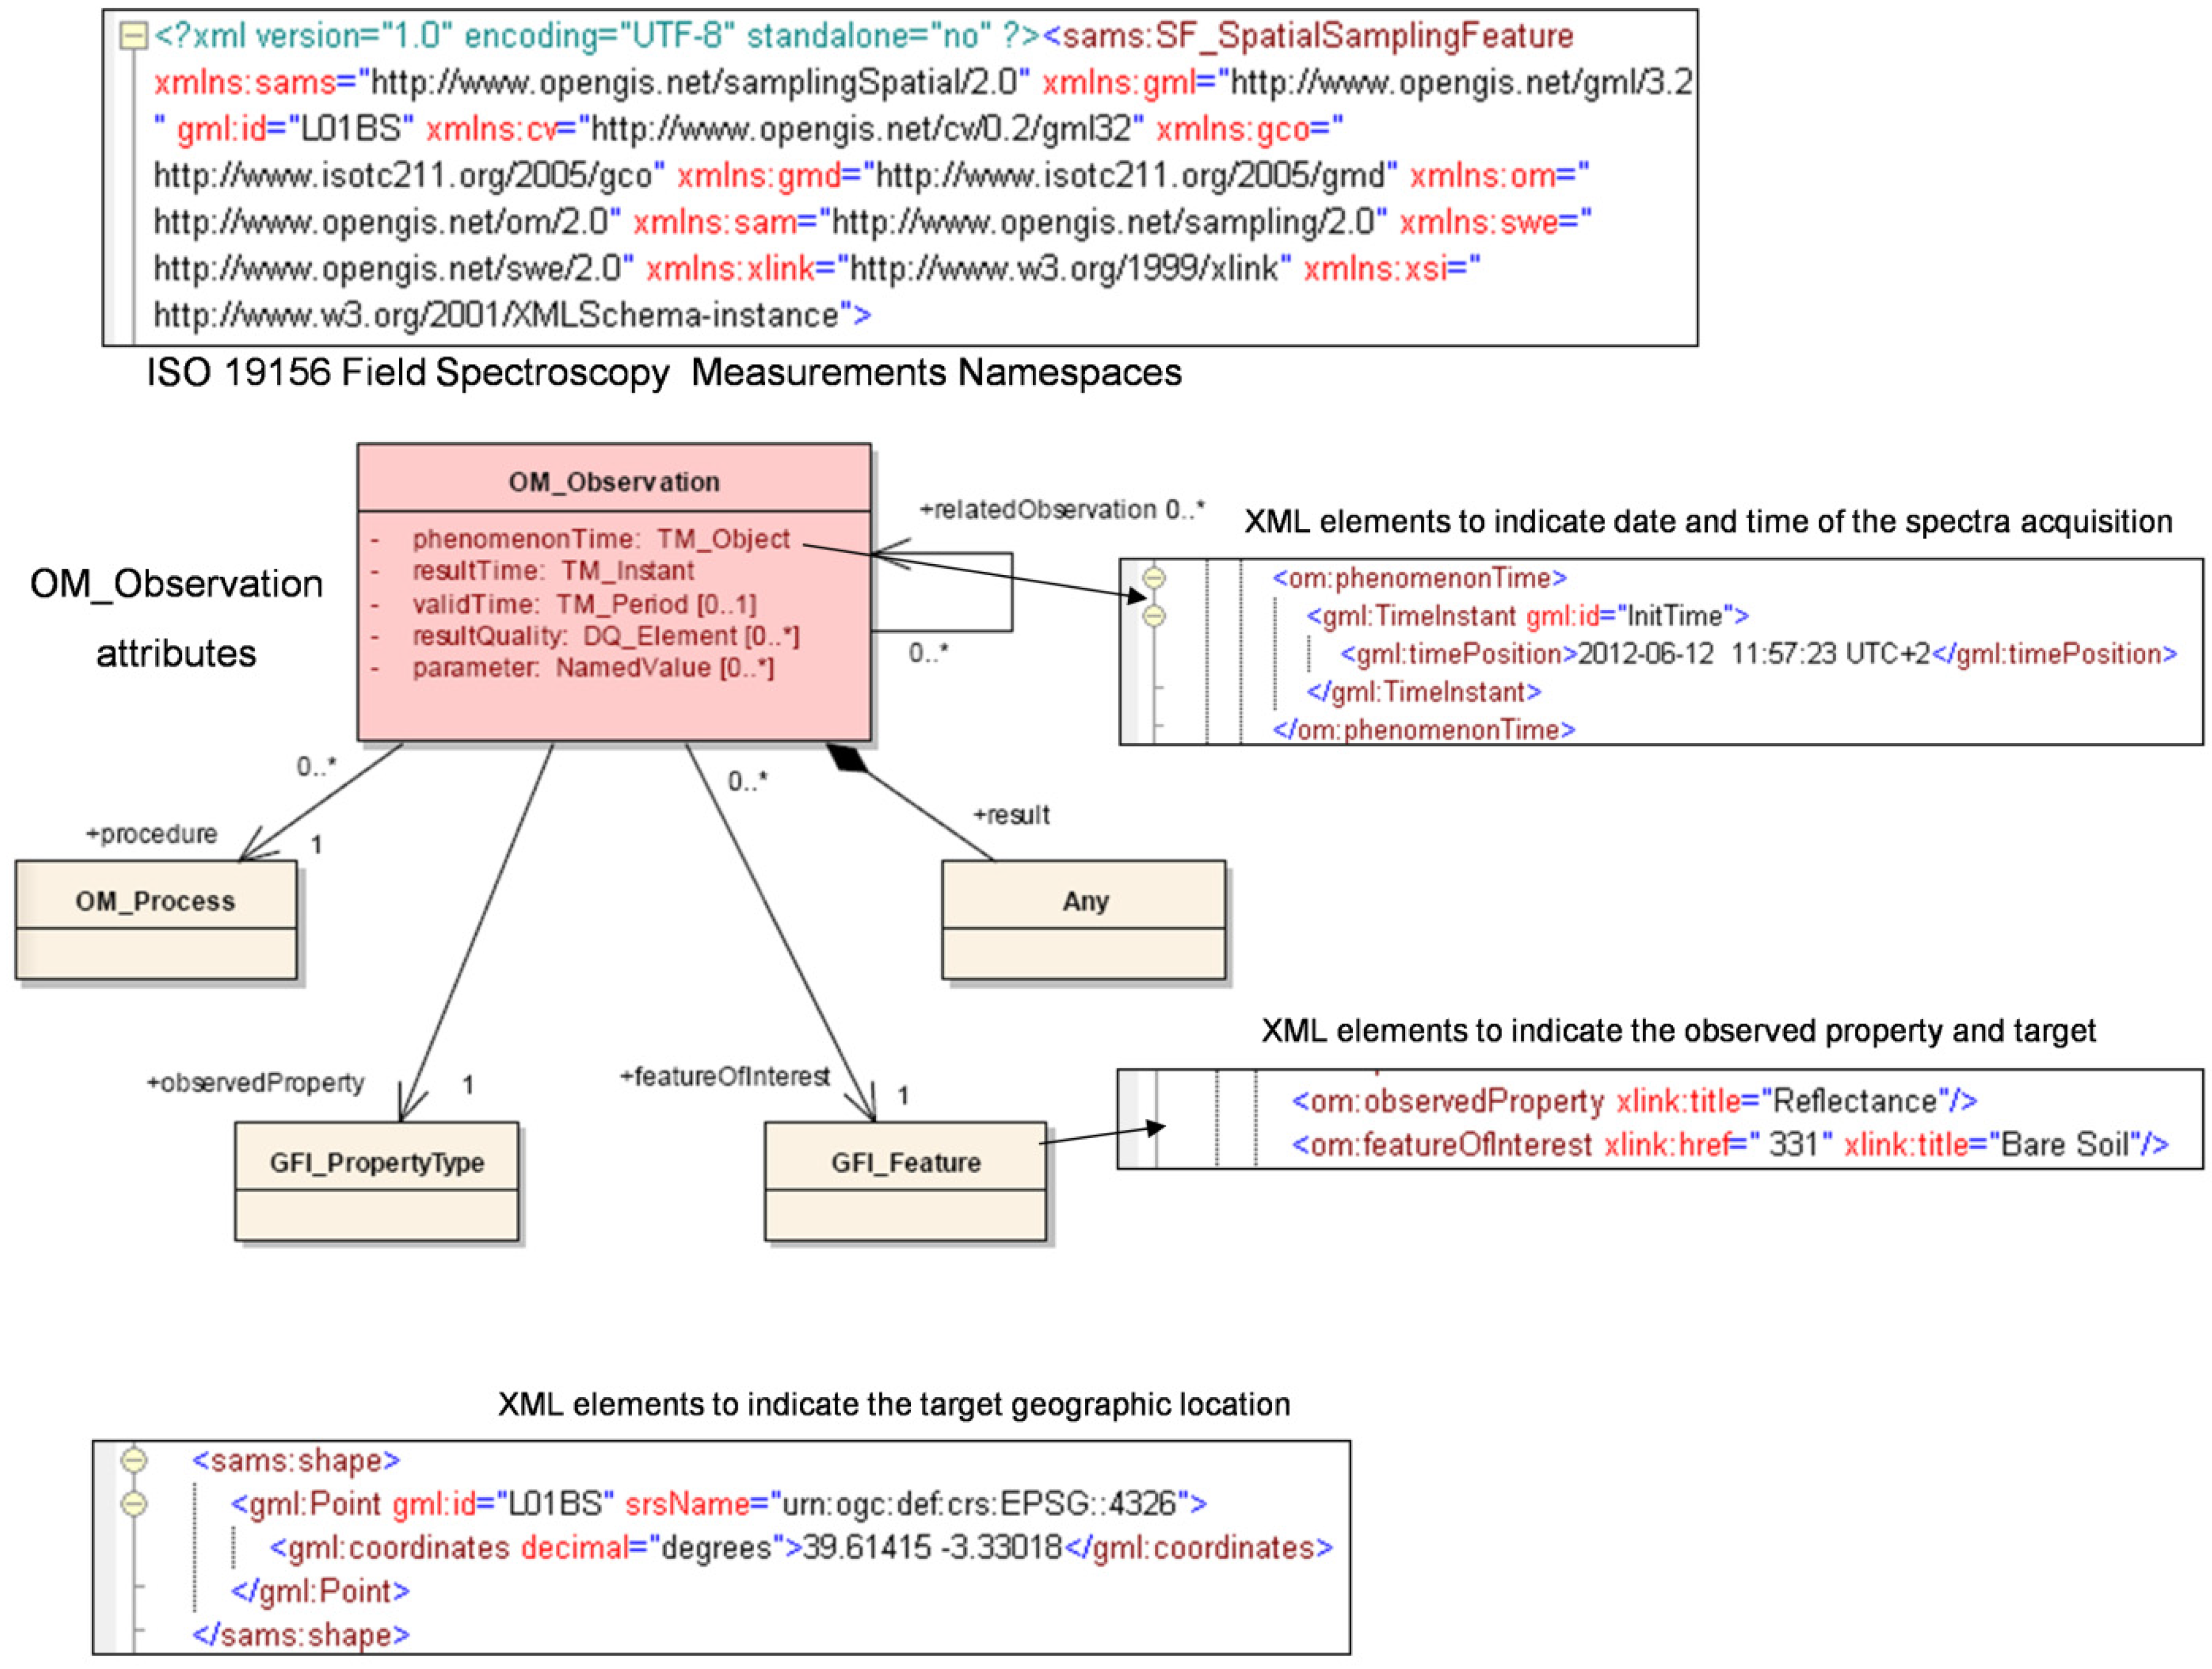
3.3.3. ISO 19156 (ISO-O&M) for the Spectral Library

The ISO 19156 (ISO-O&M) standard defines a conceptual schema for the observations and features involved (an abstraction of real-world phenomena) in sampling when making observations. Normally, the domain feature (i.e., spatiotemporal variation of a property) may not be fully accessible, and the value of a property in the domain feature involves sampling in representative locations. The schema considers observation to be a constant result, where the property of the feature of interest does not vary in space or over time. When the property varies within the spatiotemporal domain of interest, the schema would consider it as Coverage. It also considers whether the procedure may be applied in situ, remotely or ex situ with respect to the sampling location.
The sampling schema is based on an observation protocol, which is the conjunction of a sampling feature together with the observation procedure. The SF_SamplingFeature core entity can support two classes: LI_Linage to give details of the survey procedure or information related to the handling of the specimen, and Parameter to describe any arbitrary parameter associated with the measurement protocol. In addition, SF_SamplingFeature can be associated with the OM_Observation entity in the role of related observation, describing the event of taking the measurement. This entity is closely related to the instant of making the observation more than to the position of the featured observed, so SF_SamplingFeature is associated with the SF_SpatialSamplingFeatureSampling entity to give details of the shape of the extensive spatial sampling (curve, surface or solid), like flight line, borehole, trajectory, etc., and to report the positioning.
Figure 5 shows the ISO-O&M elements selected for the INTA field spectroscopy profile. First, the namespaces for field spectroscopy measurements are presented. The OM_Observation entity supports up to five attributes. Three of these properties are used to describe the time constraints of the observation: the attribute, validTime, indicates the time period when the result is intended to be used, while the spectra time acquisition or sensor measurement can be referenced with phenomenonTime, and with resultTime, we can differentiate between the processing time of the spectra and the time when it becomes available to users. For the INTA profile, we applied phenomenonTime (see the XML elements in Figure 5) to report the acquisition time of the measurement and resultTime to indicate the time when the spectral library was processed. The parameter property is used to describe any observation’s specific event that can reference the sensor measurement aspects in depth. In our case, the parameter attribute is replicated four times to indicate: the illumination source, cloud cover percentage, solar azimuth and solar zenith angles at the moment of spectra acquisition. The resultQuality element provides information about the quality of the observation following the ISO 19157:2013 standard. Here, two different DQ_QuantitativeAttributeAccuracy elements were included to report the target homogeneity using the variation coefficient of the target measurements and measurement uncertainty using the variation coefficient of the panel measurements.
Figure 5 also shows the five possible associations that the OM_Observation entity can have. In the Metadata entity, the corresponding ISO-MD file for the actual measurements is indicated using Xlink elements. The same Xlink technology is used to refer to the pertinent SensorML file in the ProcessUsed association in the procedure role with respect to the observation. The real-world object whose properties are under observation is indicated in the entity, Domain, which plays the role of the feature of interest. In field spectroscopy, the feature observed, as was mentioned in Section 2, could be any surface or material on Earth’s surface that is going to be studied by remote sensing. Figure 5 shows the XML elements to report the featureOfInterest: first, an Xlink attribute to indicate the surface or material measured by a code following ISO 19144-2:2012 “Geographic Information-Classification Part2: Land Cover Meta Language (LCML)” and a second Xlink attribute to indicate the description of the surface or material (i.e., the bare soil observed for the spectral library). The observedProperty association describes a property that is either assignable or observable in the featureOfInterest. The spectral library could include the spectral curve of radiance, irradiance, reflectance or emissivity along the wavelength. Figure 5 shows the XML elements to report the observedProperty; an Xlink attribute is used to indicate that the spectral reflectance is the property observed. Finally, the value generated by the measurement procedure is indicated in the result entity. For the INTA profile, we use Xlink technology to index the name of the spectral library in ENVI format, where the field spectroradiometer data is kept and distributed. Depending on the type of result, the ISO-O&M recommends that the observations should be classified as specified classes, such as measurement (scalar), categorical (thematic) and Boolean, and record for complex observations. In our case, OM_Observation is the OM_Measurement type to report scalar values of the reflectance spectra.
Figure 5. ISO 19156 (ISO-O&M) profile for the reflectance spectral library.
Ijgi 03 01003 g005
The GM_Geometry entity can be associated to include the Shape element, where the geographic location can be reported (longitude and latitude). It also includes the srsName property, where the coordinate reference system is indicated using an OGC Uniform Resource Name (URN) schema. In Figure 5, the srsName has urn:ogc:def:crs:EPSG:6.8:4326 to indicate that the coordinate reference system for the spectral library acquired is WGS84.

4. Discussion

The great data storage versatility of the XML specification has resulted in a significant increase in XML-based methodologies for field spectroscopy data and metadata interchange, such as SpectroML and Malthus et al. [7]. Furthermore, the SensorML specification and ISO-O&M standard are also very well developed to incorporate spectral data (spectral reflectance or radiance) and its associated metadata. However, this well-developed specification is optimized for data reporting via a web service, and the data extraction by common remote sensing software, such as ENVI, is still to be developed. In any case, the ENVI spectral library format is widely used in sharing data among the field spectroscopy community, and the international standards for metadata are optimized to report information about digital geographic data. For this reason, the proposed data distribution in this work is based on the use of the ENVI spectral library for the spectral data and the international standards for metadata.
With regard to the standards selected for field spectroscopy profile design, although the ISO 19115-2 and ISO 19130 are the most recent standard releases and append new metadata definitions, we have to consider that these standards are optimized for the raster data type and that the new metadata elements are not applicable enough to the point-vector data processed in field spectroscopy. For example, the ISO 19115-2 standard provides the MI_Event element, which plays a similar role as the OM_Observation element in the context of image capturing. Note that ISO 19115-2 defines extensions for imagery and gridded data and additional metadata elements to deal with the particularities of imagery data. However, ISO-O&M was chosen over ISO 19115-2, because it handles modularity more easily. In this sense, the metadata profiles developed in the HMA initiative to establish harmonized access to the data of heterogeneous EO missions are based on ISO-O&M and SensorML instead of ISO 19115-2 and ISO 19130. The next version of SensorML (2.0) is expected to converge with the ISO 19130 schema representations [44].
All of the standards are also revisable and could suffer changes in update versions. For example, MD is now in its revision period; these renovations mostly heading towards increasing the interoperability and compatibility between standards. In this sense, the methodology proposed could easily evolve when these standards are revised.
Depending on the goal and application of the spectral library acquisition, a complex field spectroscopy campaign can take several dates, sites and targets. Thus, the number of spectral libraries acquired could be considerably high. The metadata structure proposed here is based on three different XML files to describe all aspects of the dataset. At a glance, this metadata structure may seem very confusing due to the number of files generated. However, the final structure is not so complex, because each spectral library is directly appended to an ISO-O&M file, including Xlink references for the corresponding MD and SensorML file. This structure forces the use of easily and directly recognizable filenames: the SensorML is identified with the instrument and the corresponding year (i.e., SM_ASDFieldSpec3_yyyy.xml); the MD includes the name of the project (in our case, with five digits, ppppp) and the date of the field campaign (i.e., MD_yymmdd_ppppp.xml); the ISO-O&M includes the same as MD, plus spectral library identification (in our case, using five digits, sssss) (i.e., OM_yymmdd_ppppp_sssss.xml). This structure ensures that the O&M files are not excessively large, and avoids the repetition of many common metadata elements required to describe the dataset and sensor description.
This paper is a first approximation to establish a metadata system based on ISO and OGC standards. For the moment, it only considers the simplest case of a spectral library (i.e., just mean spectra and the standard deviation of a surface or material measured). A spectral library can also include the spatiotemporal variation of a surface or material, characterizing different properties or stages (i.e., different phenological stages in a plant species spectral library [45]). ISO and OGC standards are very rich in metadata elements that can provide solutions to describe these more complex spectral libraries, so future work must address those generic cases.
Regardless of the approach adopted, to design a metadata system based on international standards, the considerable number of elements to fill out and the low flexibility of metadata input are significant drawbacks. The system needs a custom software application to fill out the metadata elements in the XML files. In our case, we have developed a software tool using IDL language (Exelis Visual Information Solutions, Inc.) that inserts the metadata into its corresponding position within the XML file. It also permits the possibility of adding or modifying metadata manually, along with the metadata maintenance and searching task.
With the emergence of online data archives, spectral databases and the proliferation of web-interfacing applications [12], it is necessary to use a metadata encoding format that is sufficiently robust to capture the required data elements and provide hierarchical information [11]. The use of international standards in the metadata storage for spectral databases enhances the interchange of spectral libraries between organizations, thus increasing interoperability.

5. Conclusions

Standardization is the key when aiming at open and interoperable software architectures and solutions [15]. Several XML-based methodologies exist for metadata in field spectroscopy, but a standard methodology is required to improve data readability, flexibility and utility for archival, processing and use with software applications. This paper presents a major step forward towards having all field spectroscopy organizations speaking the same metadata language.
This work presents a first approximation to establish a standard metadata system for field spectroscopy. A complete selection of the core metadata categories and elements, based on previous authors [5,11,31], to describe the reflectance spectra of Earth’ surfaces and material acquired in the field were determined for INTA’s spectral libraries, which are archived in the ENVI Spectral Library format. ISO standards and OGC specifications offer a great variety of metadata elements that could be applied to describe the collection of spectroradiometric data listed, so profiles under the ISO 19115 and ISO 19156 standards and the OGC SensorML specification were generated to implement the metadata system.

Author Contributions

Marcos Jiménez designed and conducted the work presented. Magdalena González was involve in Field Spectroscopy metadata identification and profiles creation. Alberto Amaro was involve in standards elements and attributes selection and profiles validation. Alix Fernández-Renau was involve in the design and conduction of the work. The article was improved by the contributions of all the co-authors.

Acknowledgments

The authors are very grateful to the staff of INTA’s Remote Sensing Area for the support received in the course of the work carried out. In particular, we appreciate the contribution of Clara Lines for helpful comments while reviewing the paper. Furthermore, the authors are very grateful to the reviewers for their interesting comments.

Conflicts of Interest

The authors declare no conflict of interest.

References

  1. Van der Meer, F.D.; de Jong, S.D. Imaging Spectrometry: Basic Principles and Prospective Applications; Springer: Dordrecht, The Netherlands, 2011; p. 406. [Google Scholar]
  2. Schaepman, M.E.; Ustin, S.L.; Plaza, A.J.; Painter, T.H.; Verrelst, J.; Liang, S. Earth system science related imaging spectroscopy—An assessment. Remote Sens. Environ. 2009, 6, 100–110. [Google Scholar]
  3. Kaufmann, H.; Segl, K.; Kuester, T.; Rogass, C.; Foerster, S.; Wulf, H.; Hofer, S.; Sang, B.; Storch, T.; Mueller, A.; et al. The Environmental Mapping and Analysis Program (EnMAP)—Present Status of Preparatory Phase. In Proceedings of the 2013 International Geoscience and Remote Sensing Symposium (IAGARSS’13), Melbourne, Vic, Australia, 21–26 July 2013.
  4. Romano, F.; Santini, F.; Simoniello, T.; Ananasso, C.; Corsini, G.; Cuomo, V. The PRISMA Hyperspectral Mission: Science Activities and Opportunities for Agriculture and Land Monitoring. In Proceedings of the 2013 International Geoscience and Remote Sensing Symposium (IGARSS’13), Melbourne, Vic, Australia, 21–26 July 2013.
  5. Milton, E.J.; Schaepman, M.E.; Anderson, K.; Kneubühler, M.; Fox, N. Progress in field spectroscopy. Remote Sens. Environ. 2009, 113, 92–109. [Google Scholar] [CrossRef]
  6. Pfitzner, K.; Bollhöfer, A.; Esparon, A.; Bartolo, B.; Staben, G. Standardized Spectra (400–2500 nm) and Associated Metadata: An Example from Northern Tropical Australia. In Proceedings of the 2010 IEEE International Geoscience and Remote Sensing Symposium, Honolulu, HI, USA, 25–30 July 2010.
  7. Malthus, T.; Hueni, A. An XML-Based Format for the Exchange of Spectro-Radiometric Data. In Proceedings of the EARSeL SIG IS Workshop, Tel Aviv, Israel, 16–19 March 2009.
  8. Jung, A.; Götze, C.; Gläßer, C. Overview of experimental setups in spectroscopic laboratory measurements—The spectour project. Photogramm. Fernerkund. Geoinf. 2012, 433–442. [Google Scholar] [CrossRef]
  9. Michener, W.K. Metadata. In Ecological Data: Design, Management and Processing; Michener, W.K., Brunt, J.W., Eds.; Blackwell Science: Oxford, UK, 2000; pp. 92–116. [Google Scholar]
  10. Extensible Markup Language (XML). Available online: http://www.w3.org/XML/ (accessed on 24 April 2014).
  11. Hueni, A.; Nieke, J.; Schopfer, J.; Kneubühler, M.; Itten, K.I. The spectral database SPECCHIO for improved long-term usability and datasharing. Comput. Geosci. 2009, 35, 557–565. [Google Scholar] [CrossRef] [Green Version]
  12. Hueni, A.; Malthus, T.; Kneubuehler, M.; Schaepman, M. Data exchange between distributed spectral databases. Comput. Geosci. 2011, 37, 861–873. [Google Scholar] [CrossRef]
  13. Ecological Markup Language. Available online: https://knb.ecoinformatics.org/#external//emlparser/docs/index.html (accessed on 24 April 2014).
  14. Rühl, M.A.; Schäfer, R.; Kramer, G.W. SpectroML—A markup language for molecular spectrometry data. JALA 2001, 6, 76–82. [Google Scholar]
  15. Heterogeneous Missions Accessibility. Available online: http://earth.esa.int/hma/index.html (accessed on 24 April 2014).
  16. Rasaiah, B.; Jones, S.; Bellman, C. Building Better Hyperspectral Datasets: The Fundamental Role of Metadata Protocols in Hyperspectral Field Campaigns. In Proceedings of the 2011 Surveying & Spatial Sciences Biennial Conference, Wellington, New Zealand, 21–25 November 2011.
  17. Mac Arthur, A.; Alonso, L.; Malthus, T.; Moreno, J. Spectroscopy Field Strategies and Their Effect on Measurements of Heterogeneous and Homogeneous Earth Surfaces. In Proceedings of the 2013 Living Planet Symposium, Edinburgh, UK, 9–13 September 2013.
  18. Buddenbaum, H.; Stern, O.; Stellmes, M.; Stoffels, J.; Pueschel, P.; Hill, J.; Werner, W. Field imaging spectroscopy of beech seedlings under dryness stress. Remote Sens. 2012, 4, 3721–3740. [Google Scholar] [CrossRef]
  19. Salisbury, J.W. Spectral Measurements Field Guide; Tech. Rep. ADA362372; Defense Technology Information Centre: Fort Belvoir, VA, USA, 1998. [Google Scholar]
  20. Mac Arthur, A.; MacLellan, C.; Malthus, T.J. The fields of view and directional response functions of two field spectroradiometers. IEEE Trans. Geosci. Remote Sens. 2012, 50, 3892–3907. [Google Scholar] [CrossRef]
  21. Goetz, A.F.H. Making Accurate Field Spectral Reflectance Measurements; ASD Inc.: Boulder, CO, USA, 2012. [Google Scholar]
  22. Schaepman-Strub, G.; Schaepman, M.E.; Painter, T.H.; Dangel, S.; Martonchik, J.V. Reflectance quantities in optical remote sensing—Definitions and case studies. Remote Sens. Environ. 2006, 103, 27–42. [Google Scholar] [CrossRef]
  23. Vierling, L.A.; Fersdahl, M.; Chen, X.; Li, Z.; Zimmerman, P. The Short Wave Aerostat-Mounted Imager (SWAMI): A novel platform for acquiring remotely sensed data from a tethered balloon. Remote Sens. Environ. 2006, 103, 255–264. [Google Scholar] [CrossRef]
  24. Kuusk, A.; Kuusk, J.; Lang, M. A dataset for the validation of reflectance models. Remote Sens. Environ. 2009, 113, 889–892. [Google Scholar] [CrossRef]
  25. Burkart, A.; Cogliati, S.; Schickling, A.; Rascher, U. A novel UAV-based ultra-light weight spectrometer for field spectroscopy. IEEE Sens. J. 2013, 14, 62–67. [Google Scholar] [CrossRef]
  26. Aerosol Robotic Network. Available online: http://aeronet.gsfc.nasa.gov/ (accessed on 24 April 2014).
  27. Schmidt, K.S.; Skidmore, A.K. Smoothing vegetation spectra with wavelets. Int. J. Remote Sens. 2004, 25, 1167–1184. [Google Scholar] [CrossRef]
  28. Pinto, C.T.; Ponzoni, F.J.; Morgado de Castro, R. Spectral uniformity evaluation of reference surfaces for airborne and orbital sensors absolute calibration. Rev. Bras. Geofis. 2012, 30, 263–275. [Google Scholar]
  29. International Organization for Standardization (ISO). Geographic Information—Metadata; International Organization for Standardization: Geneva, Switzerland, 2003. [Google Scholar]
  30. Ruby, J.G.; Fischer, R.L. Spectral signatures database for remote sensing applications. Proc. SPIE 2002, 4816, 156–163. [Google Scholar]
  31. Rasaiah, B.; Jones, S.; Bellman, C.; Malthus, T.J. Critical metadata for spectroscopy field campaigns. Remote Sens. 2014, 6, 3662–3680. [Google Scholar] [CrossRef]
  32. Watson, T.D.; Wiley, D. Structured metadata spaces. J. Internet Cat. 2000, 3, 263–277. [Google Scholar] [CrossRef]
  33. Bröring, A.; Echterhoff, J.; Jirka, S.; Simonis, I.; Everding, T.; Stasch, C.; Liang, S.; Lemmens, R. New generation sensor web enablement. Sensors 2011, 11, 2652–2699. [Google Scholar] [CrossRef] [PubMed]
  34. Botts, M. OGC Implementation Specification 07-000 OpenGIS Sensor Model Language (SensorML); Open Geospatial Consortium: Wayland, MA, USA, 2007. [Google Scholar]
  35. Cox, S. OGC Implementation Specification 07-022r1: Observations and Measurements—Part 1: Observation Schema; Open Geospatial Consortium: Wayland, MA, USA, 2007. [Google Scholar]
  36. W3C XML Schema. Available online: http://www.w3.org/standards/xml/schema (accessed on 24 April 2014).
  37. ISO Schematron (ISO/IEC 19757-3:2006). Available online: http://www.schematron.com/ (accessed on 24 April 2014).
  38. ISO TC 211 Schemas. Available online: http://www.isotc211.org/schemas/2005/gco/ (accessed on 24 April 2014).
  39. OGC Schemas. Available online: http://schemas.opengis.net/ (accessed on 24 April 2014).
  40. Semantic Web for Earth and Environmental Terminology (SWEET). Available online: http://sweet.jpl.nasa.gov/ontology/ (accessed on 24 April 2014).
  41. INTA Field Radiometry Wikipedia. Available online: http://teledeteccion.cec.inta.es/wiki (accessed on 24 April 2014).
  42. CEOS: The Earth Observation Handbook. Available online: http://www.eohandbook.com/ (accessed on 24 April 2014).
  43. Metadata Spanish Core (Núcleo Español de Metadatos, NEM). Available online: http://www.idee.es/resources/documentos/NEMv1.2.pdf (accessed on 24 April 2014).
  44. OGC SensorML 2.0. Available online: http://www.opengeospatial.org/node/1971 (accessed on 24 April 2014).
  45. Nidamanuri, R.R.; Zbell, B. Use of field reflectance data for crop mapping using airborne hyperspectral image. ISPRS J. Photogramm. Remote Sens. 2011, 66, 683–691. [Google Scholar] [CrossRef]

