Article

Vertical Measurements in Oblique Aerial Imagery

Direzione Generale della Pianificazione Urbanistica Territoriale e della Vigilanza Edilizia. Viale Trieste 186, 09121 Cagliari, Italy
*
Author to whom correspondence should be addressed.
ISPRS Int. J. Geo-Inf. 2014, 3(3), 914-928; https://doi.org/10.3390/ijgi3030914
Submission received: 27 February 2014 / Revised: 5 June 2014 / Accepted: 2 July 2014 / Published: 14 July 2014

Abstract

:
This article first introduces oblique aerial imagery, then describes how vertical distances can be measured once the pixel distances of the original pictures are known. The calculations require that, not only all camera settings be known, but also that one relies on the availability of detailed digital terrain and digital surface models (DSM and DTM), in order to provide the necessary ground level for calculating vertical distances. The algorithm is finally implemented in an online viewer.

Graphical Abstract

1. Introduction

Detailed aerial photography is becoming progressively more important for landscape planning and sustainable development purposes. Both nadiral and oblique photographs allow for a better analysis of the territory and for the identification of many architectural details of buildings themselves (e.g., facades). In this way, the use of such photographs can be used to support landscape planning activities, as they provide accurate and detailed views of urban centers and can help track the evolution of land use. Grenzdörffer et al. [1] show how oblique images can be used in commercial software, such as MultiVision, to provide an interactive, multi-perspective view of any area, structure and/or feature. Due to the overlap in subsequent aerial shots, the images may also be viewed in stereo. In turn, the MultiVision software allows for an automated generation of 3D-textured facades, which can be used for advanced visualization and interpretation purposes.
Great advancements in 3D reconstructions in computer vision, graphics, photogrammetry and remote sensing [2] have been made, as well, which have assisted in the rendering of 3D facades. Much work has been done, as well, with the use of aerial photography for producing 3D models of built environments [3] and the overall use of 3D reconstruction in urban planning and the projection of urban city spaces for sustainable development [2]. Such applications are becoming more readily available and realistic [4], even as applied to the management of land use and space [5].
However, the motivation and need for a software that can measure vertical distances in a real-time environment are quite different from a projected landscape. Public administrations have an immediate need for tracking land use and development, rather than testing “what-if” scenarios [3]. 3D reconstructions also suffer from accuracy, noise and simplified data, which might affect their use in evaluating urban development. If aerial photographs are readily available, then the choice between creating software with complicated computations and the use of an online application in an existing geoportal can be argued for.
In recent years, the Regione Sardegna has promoted the creation of a spatial data infrastructure (SDI), where all geographical information of the Region converges and is then made public through the institutional geo-portal. All geographical vector layers are now freely available, and most nadiral aerial photography can also be viewed in the geoportal. This represents a state-of-the-art feature in Italian regional public administration and is also in compliance with the Inspire Directive at the European level. Oblique pictures are a recent addition to the cartographical collection and will soon be published on the geoportal. One main problem related to these pictures is connected with the possibility of measuring distances. This is not a trivial problem, given the complex variables that are needed for the calculations. These variables are generally related to the three-dimensional position of the plane during its flight and include a digital model of buildings and the terrain.
While some commercial desktop software have advanced analysis tools, online viewers usually offer fewer functionalities to the final user. For example, through the Automated Information Mapping System (AIMS) [6], oblique pictures can be viewed online, but measurement tools are only available to licensed users (state, regional and municipal staff). On the other hand, the Interactive Maps used by the Massachusetts Department of Transportation [7] allow registered users additional features and tools for measuring and integrating GIS data, provided that they too hold a licensed account. Finally, Idan’s Oblivision [8] (available both as a desktop and online version) does allow for vertical distance measurement, although there is no guidance to prevent the user from making invalid measurements in unbuilt areas. Other available online viewers of 45° pictures include Google Maps [9] and Bing [10], although, in these cases, no measurements are available through their viewers. Private companies, such as Fugro [11] and Blom [12], do offer oblique mapping systems (Panoramix and Pictometry, respectively), which include desktop and online viewers; however, once again, these are for licensed users only. These software have limited online accessibility, requiring licenses to be purchased, which can be costly for private individuals or even public administrations. Thus, a software offering open access to such data is not only novel, but useful for accurately producing the needed measurements for all users.
This paper describes the development of a mathematical algorithm aimed at calculating vertical distances and the implementation of this algorithm inside an oblique picture online viewer. The use of such a tool within the online viewer of the SDI adopted by the public administration of the Regione Sardegna will bring more accuracy to the development of urban areas and landscape planning by offering readily controllable measurements and compliance with building codes, thus leading to a more sustainable development of the Region.

2. Methods

2.1. Oblique Images

The Regione Sardegna has recently acquired oblique pictures that cover a large portion of the regional territory, including all historical residential settlements. Beyond the traditional nadiral view, oblique pictures offer four additional inclined views of the territory. In fact, during flight, five shots were taken simultaneously from five different cameras, one of which was mounted in the nadiral direction and four with an inclination from the vertical axis, shooting in the forward, backward, left and right directions [13].
A sophisticated on-board system tracked the geographical coordinates of each oblique picture at the time when the shot was taken. A proprietary software, part of the Pictometry digital mapping system [12,14], was then used to determine the projection of each photograph on the ground. Following this procedure, image tiling was still not possible, because oblique pictures have a different perspective, which means they cannot be matched at the borders. Once the projections were georeferenced, however, the pictures could be published on the regional geoportal and be navigated, just like any other orthophotograph, even if in a discrete, rather than continuous, way. Despite this elaboration of the photographs, the problem of making vertical measurements on these remained. The next sections describe how this problem was tackled.

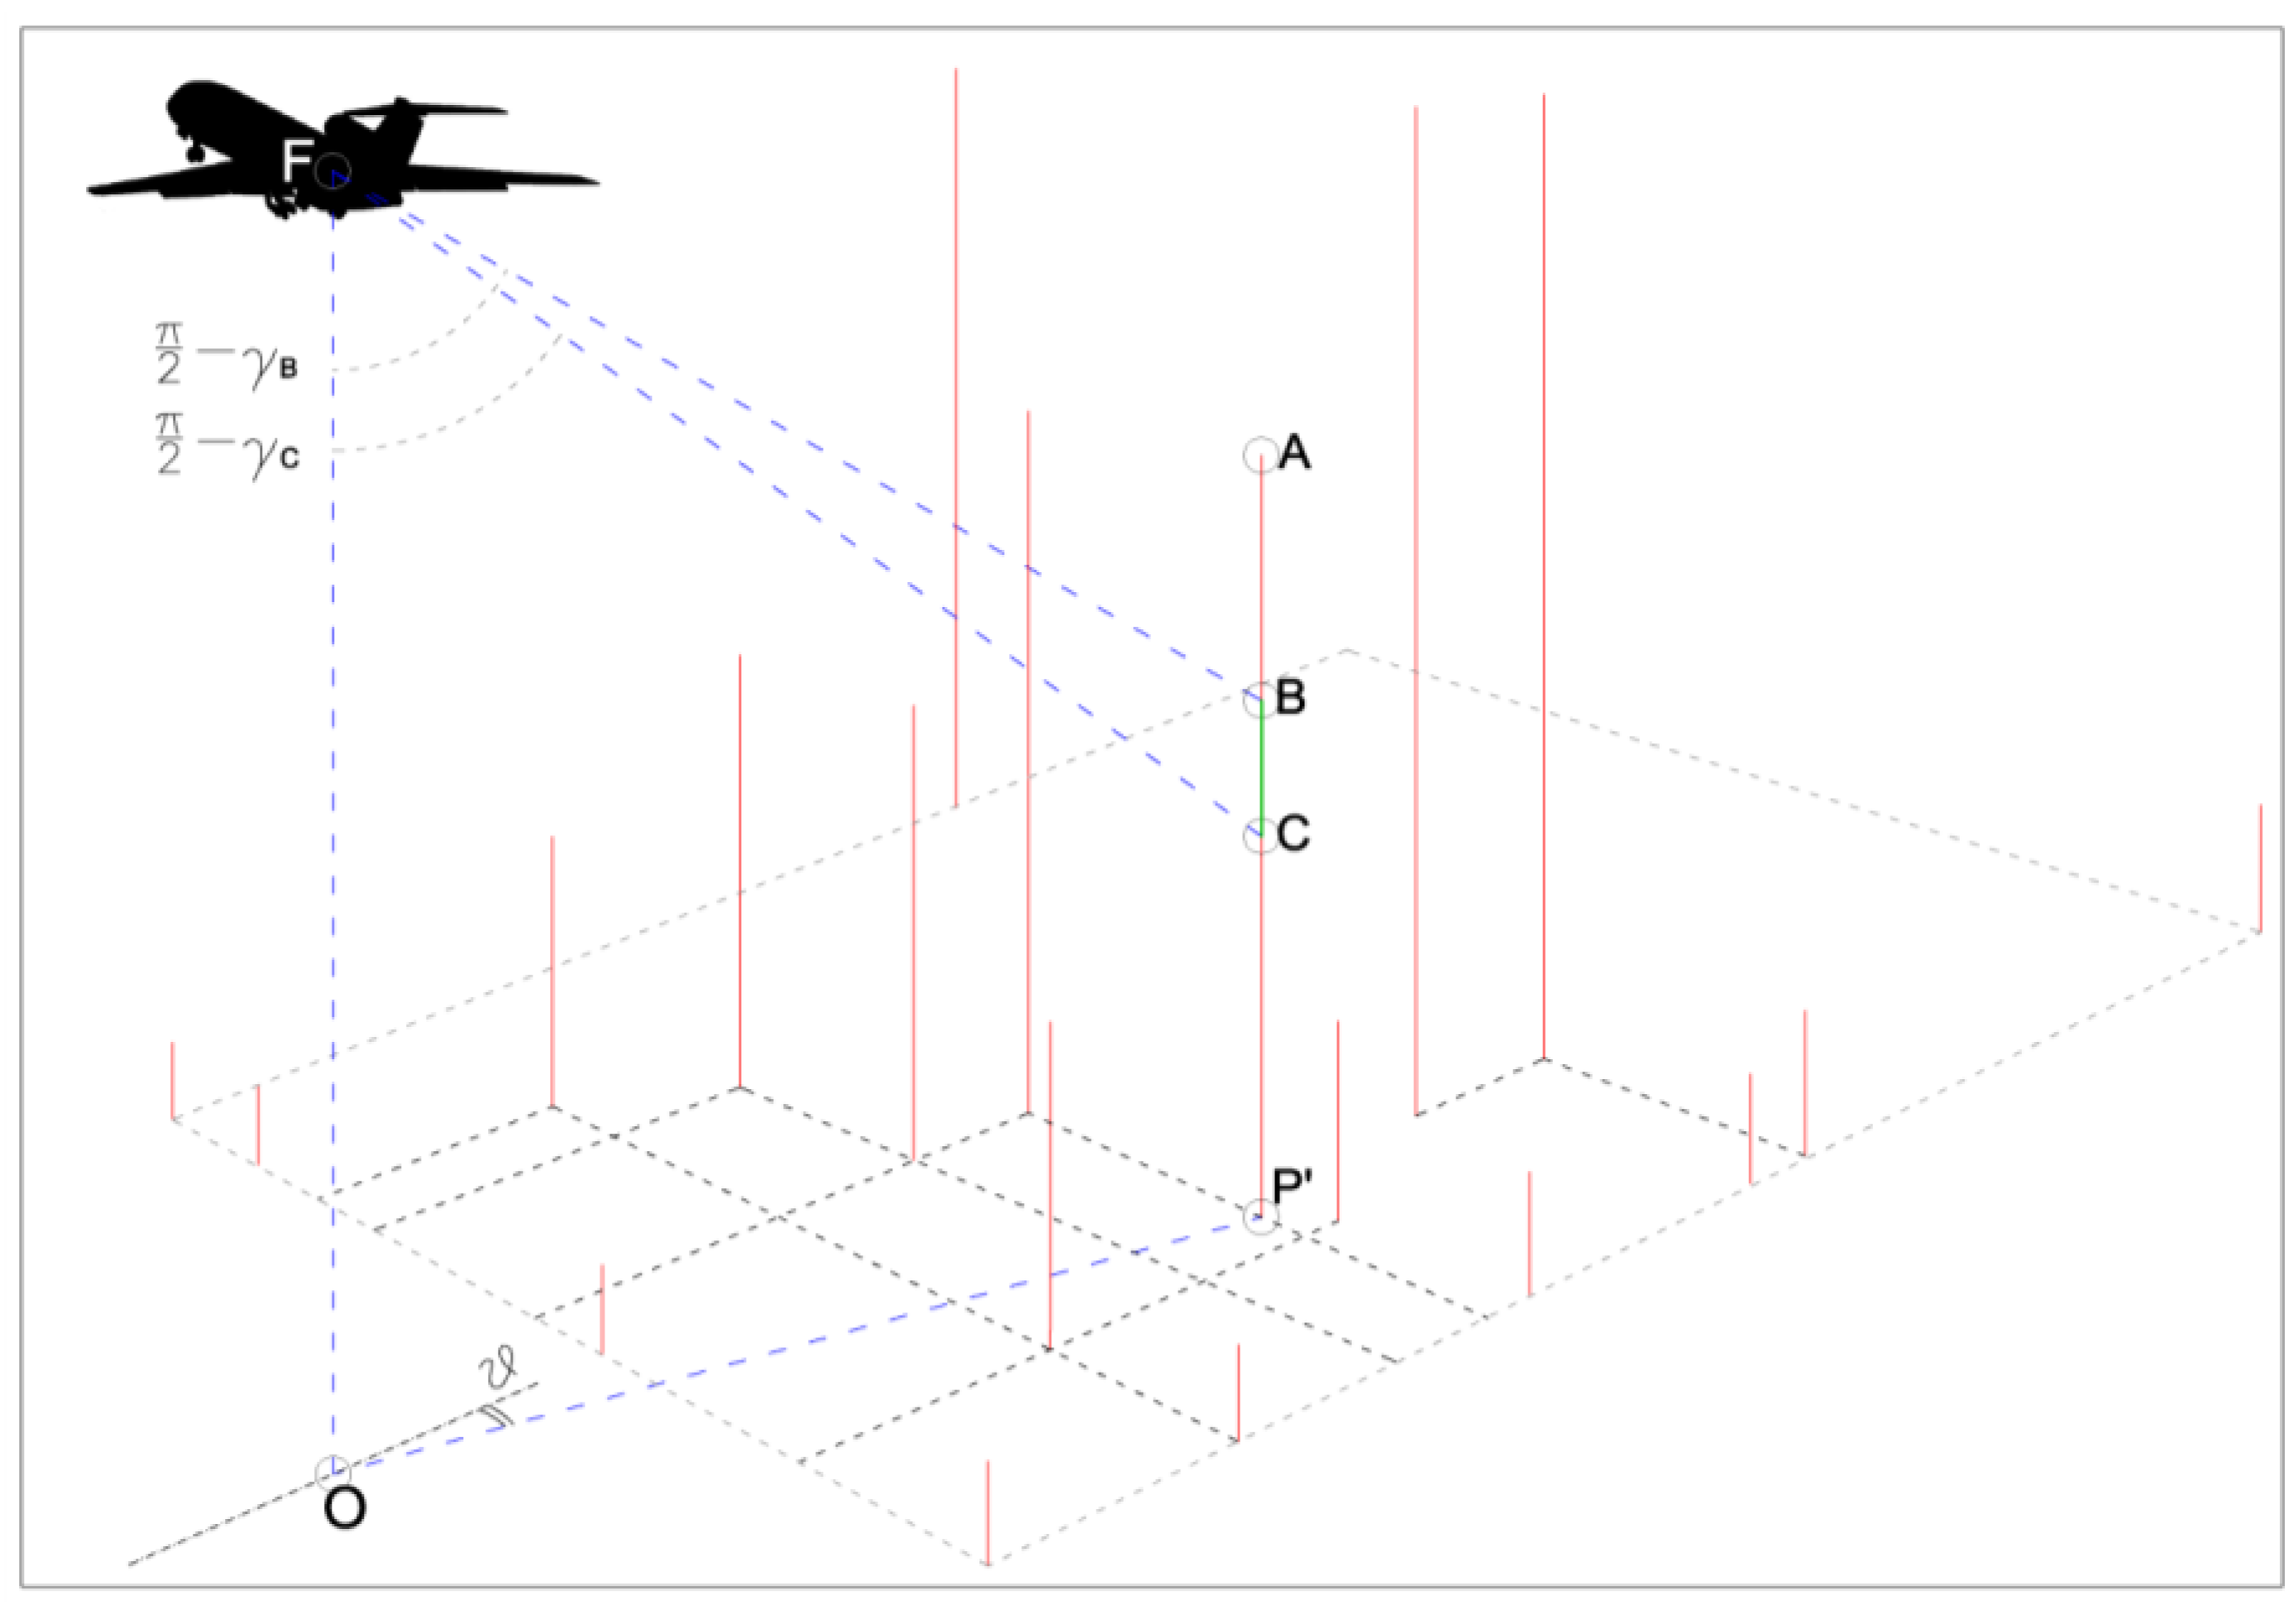
2.2. Calculating Vertical Distances

Figure 1 illustrates the classical, 3-view representation of a photographic plane inclined in space during flight. Let F be the focal point of the camera, located hF meters above the ground. The projection on the ground of a point A' in the picture is indicated as A''', and the actual point in space is A (e.g., the corner of a building).
Because the terrain is obviously not flat, the correspondence between a point in the photograph (A') and the projected point on the ground (A''') cannot be found simply by stretching the picture to fit its ground projection, as this would give a deformed view of reality, as seen in Figure 2. To rectify the photographic relation between A' and A''' we need to take into consideration the 3D geometry of the camera during flight (Figure 3). The vertical plane A'FN represents the actual observation from the airplane. x and y are known, as they represent the coordinates of A' which is selected by the user on the picture and can be measured directly on the photograph (Figure 4). Let us indicate as [15]:
-
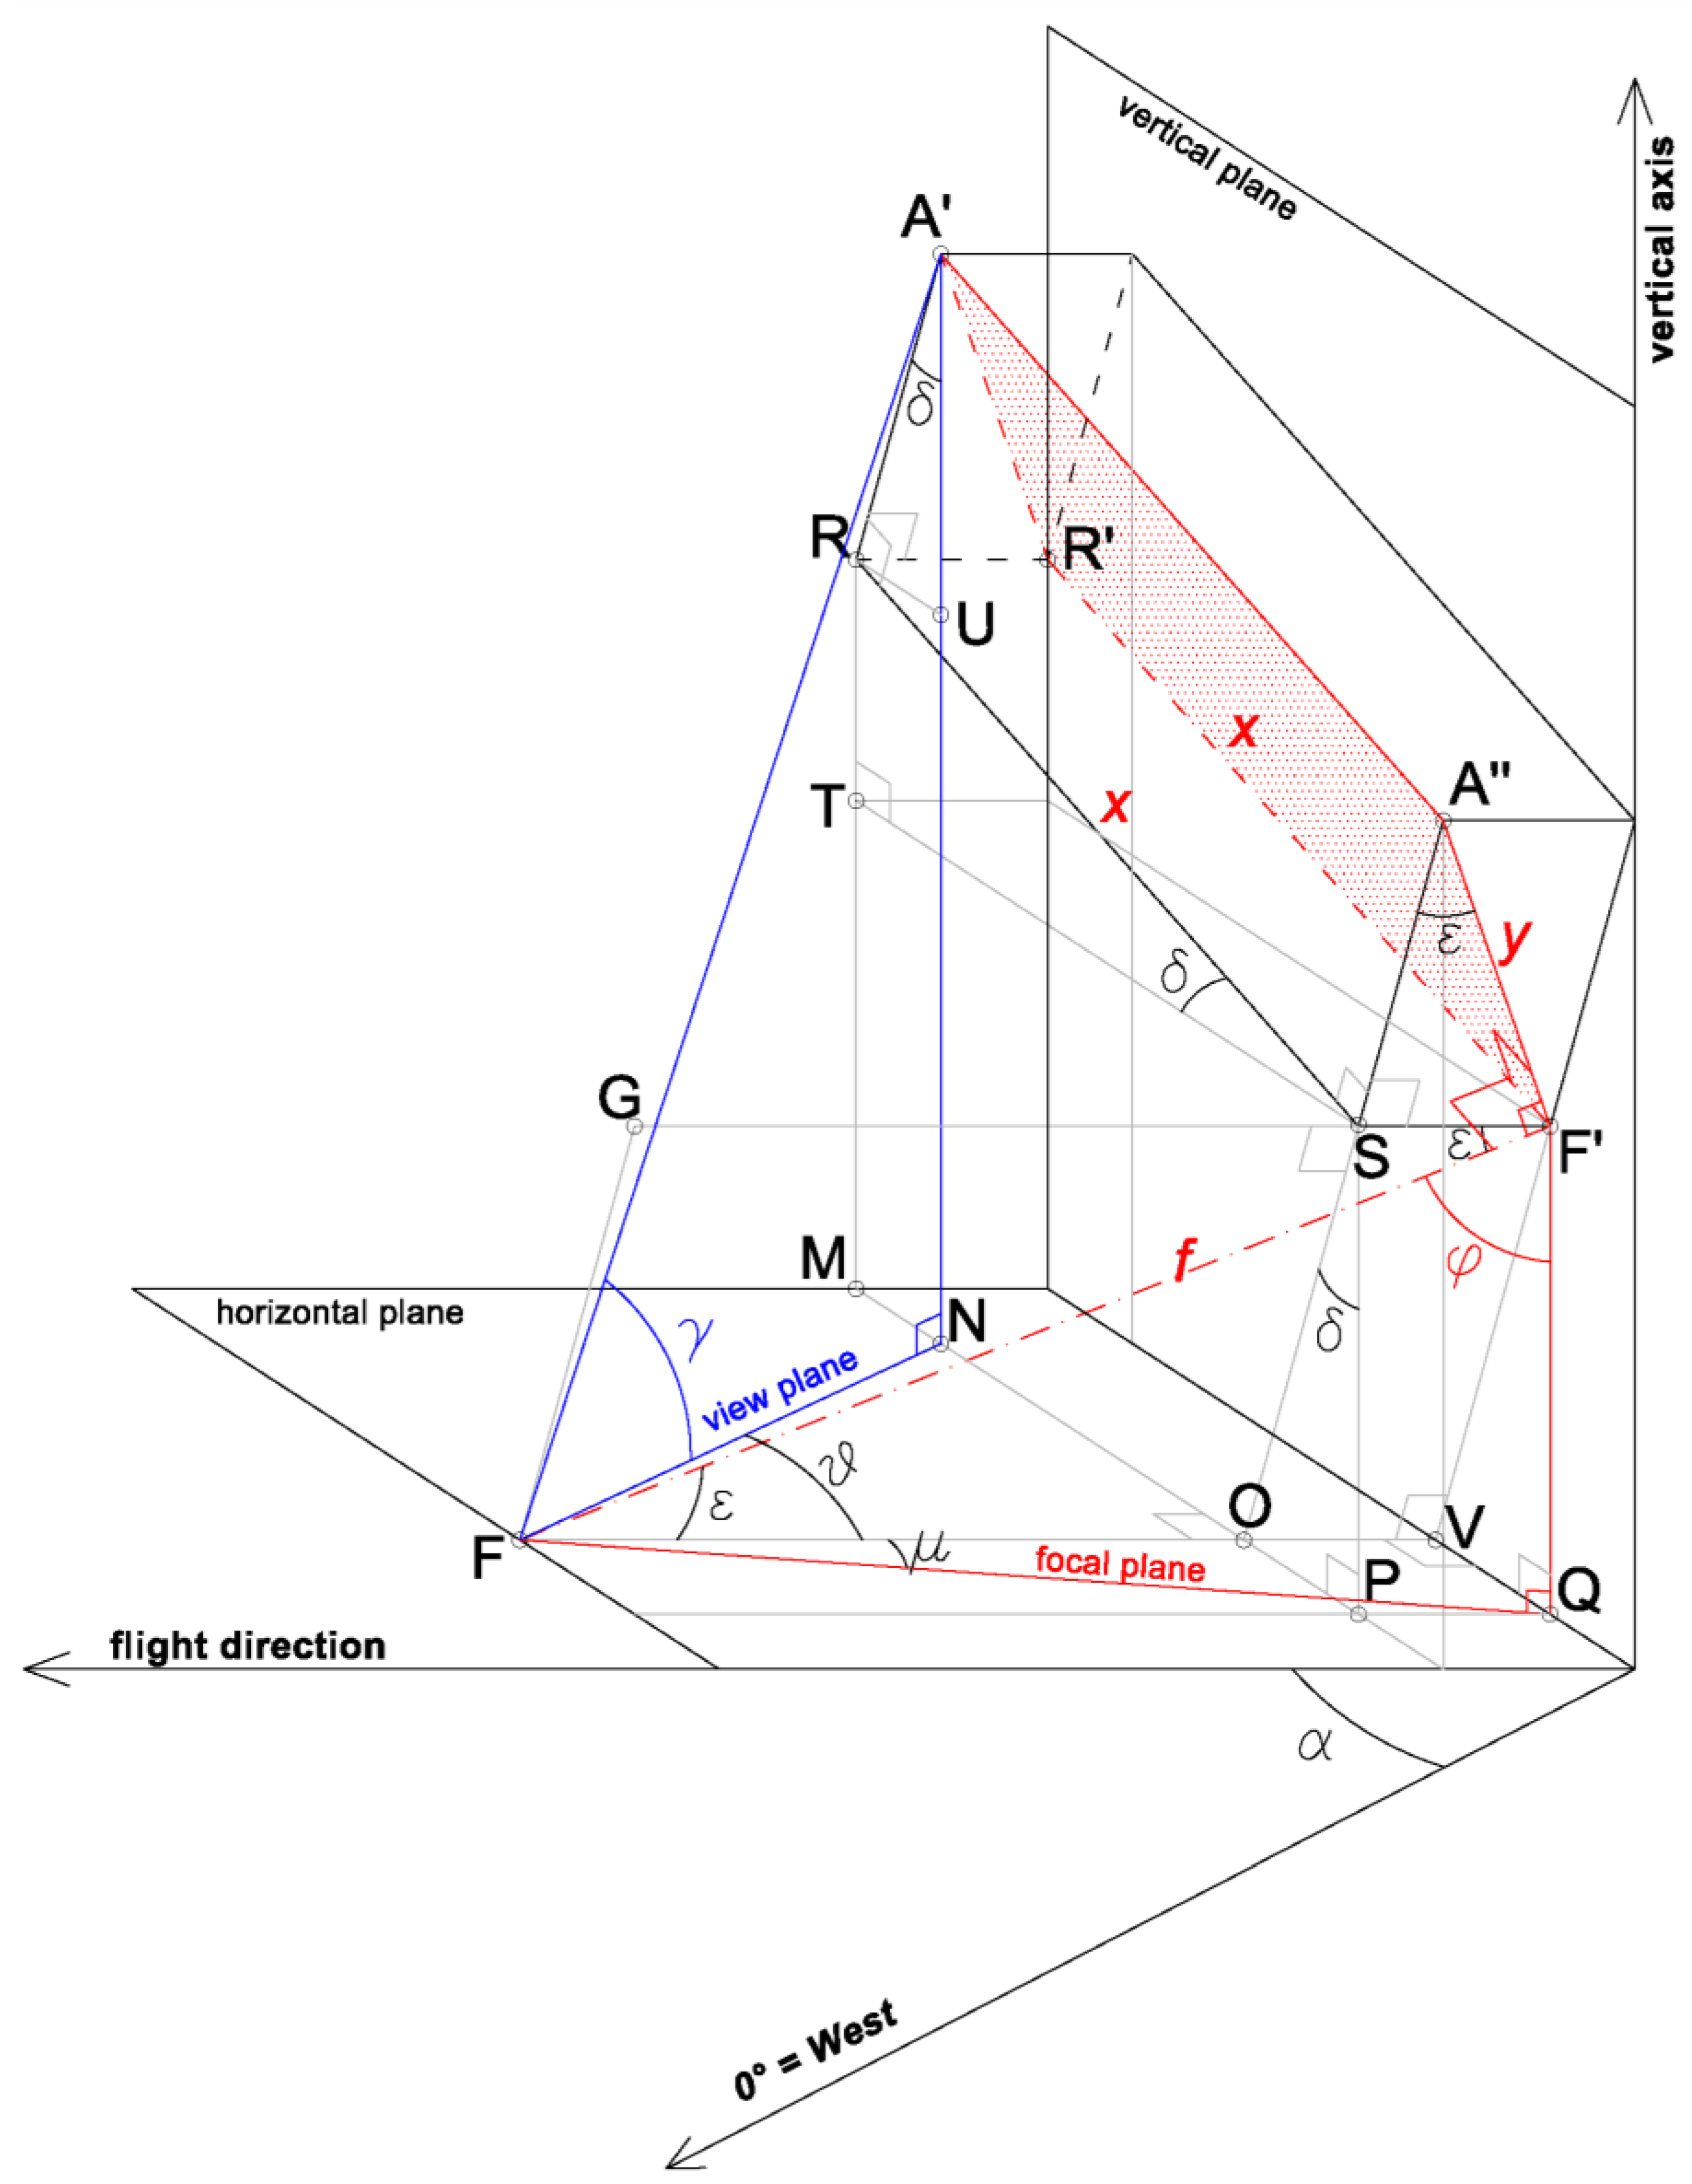
FQ the projection of the focal axis f on the horizontal plane;
-
Declination angle δ = Ijgi 03 00914 i001 (that is, the angle formed by RS and ST; we will follow this convention from now on), positive, as shown in Figure 3, and known from the camera parameters. This angle being other than zero means that the airplane was not flying on a perfectly horizontal plane when the shot was taken;
-
φ the roll angle, i.e., the angle between the focal axis and the vertical direction (known);
-
α the bearing angle, i.e., the azimuth angle between the camera longitudinal axis and west (known);
-
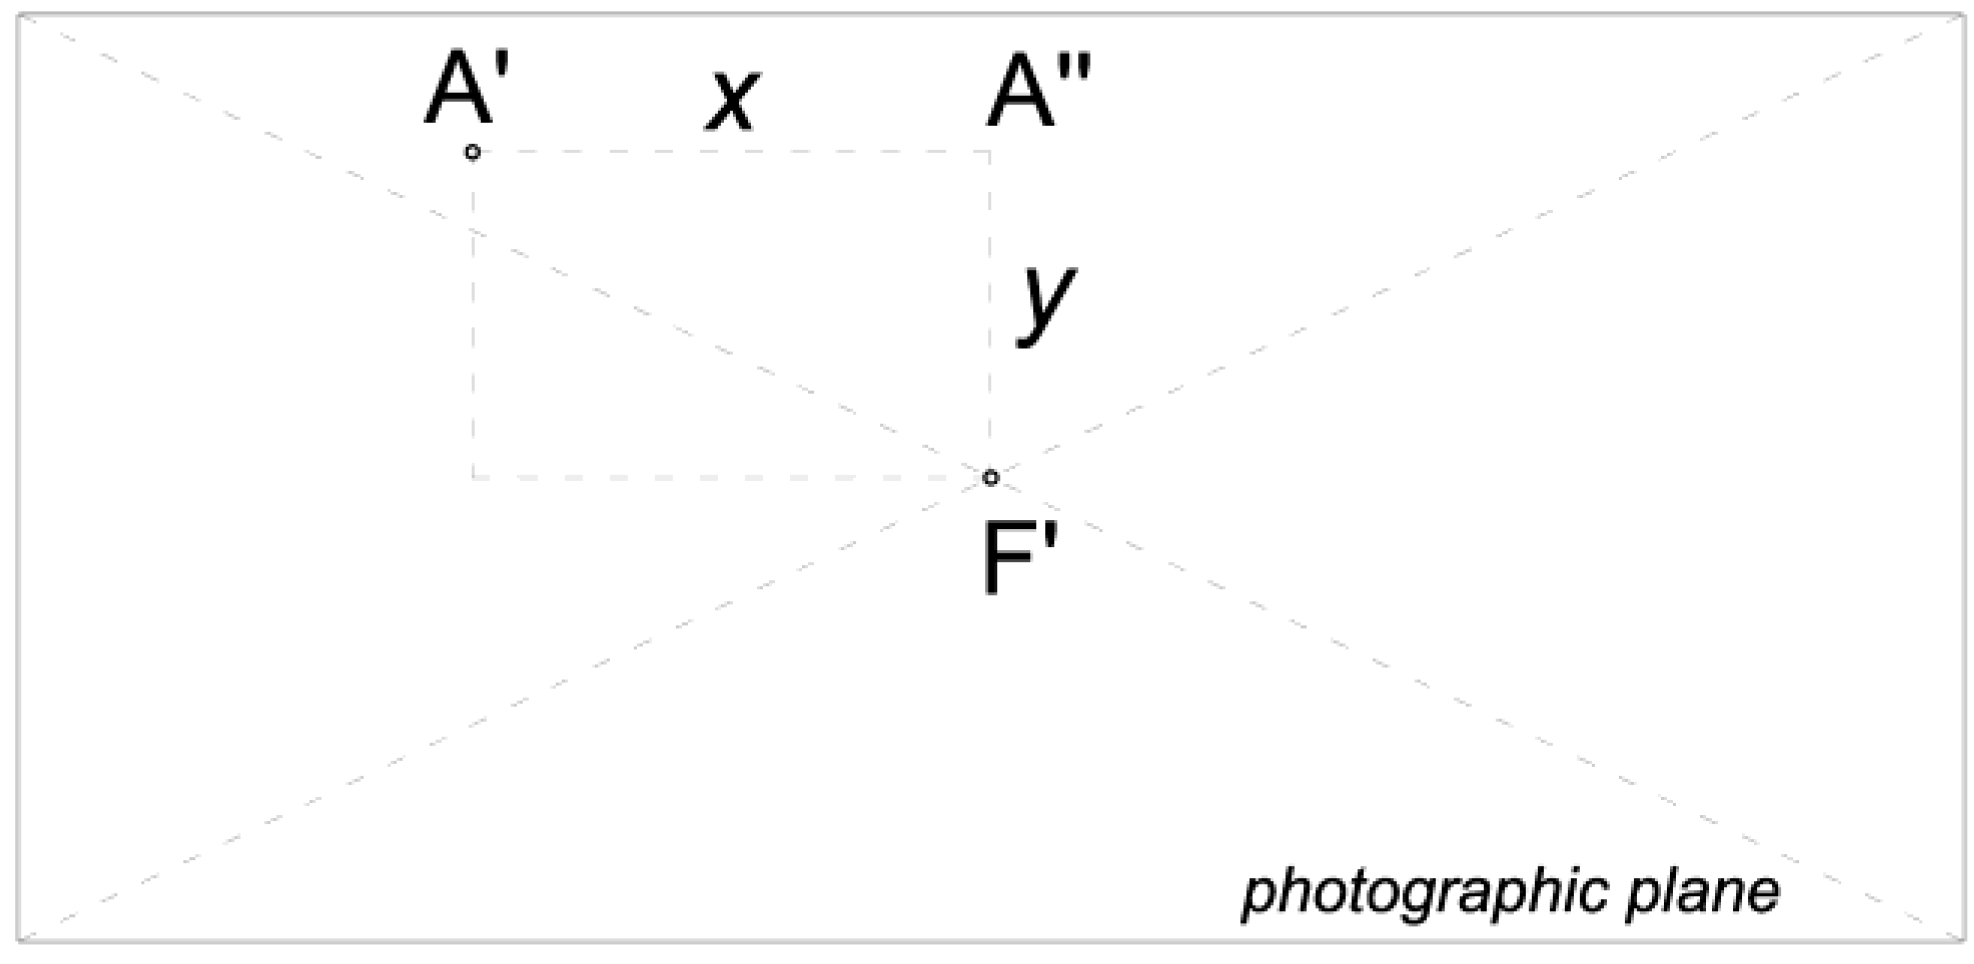
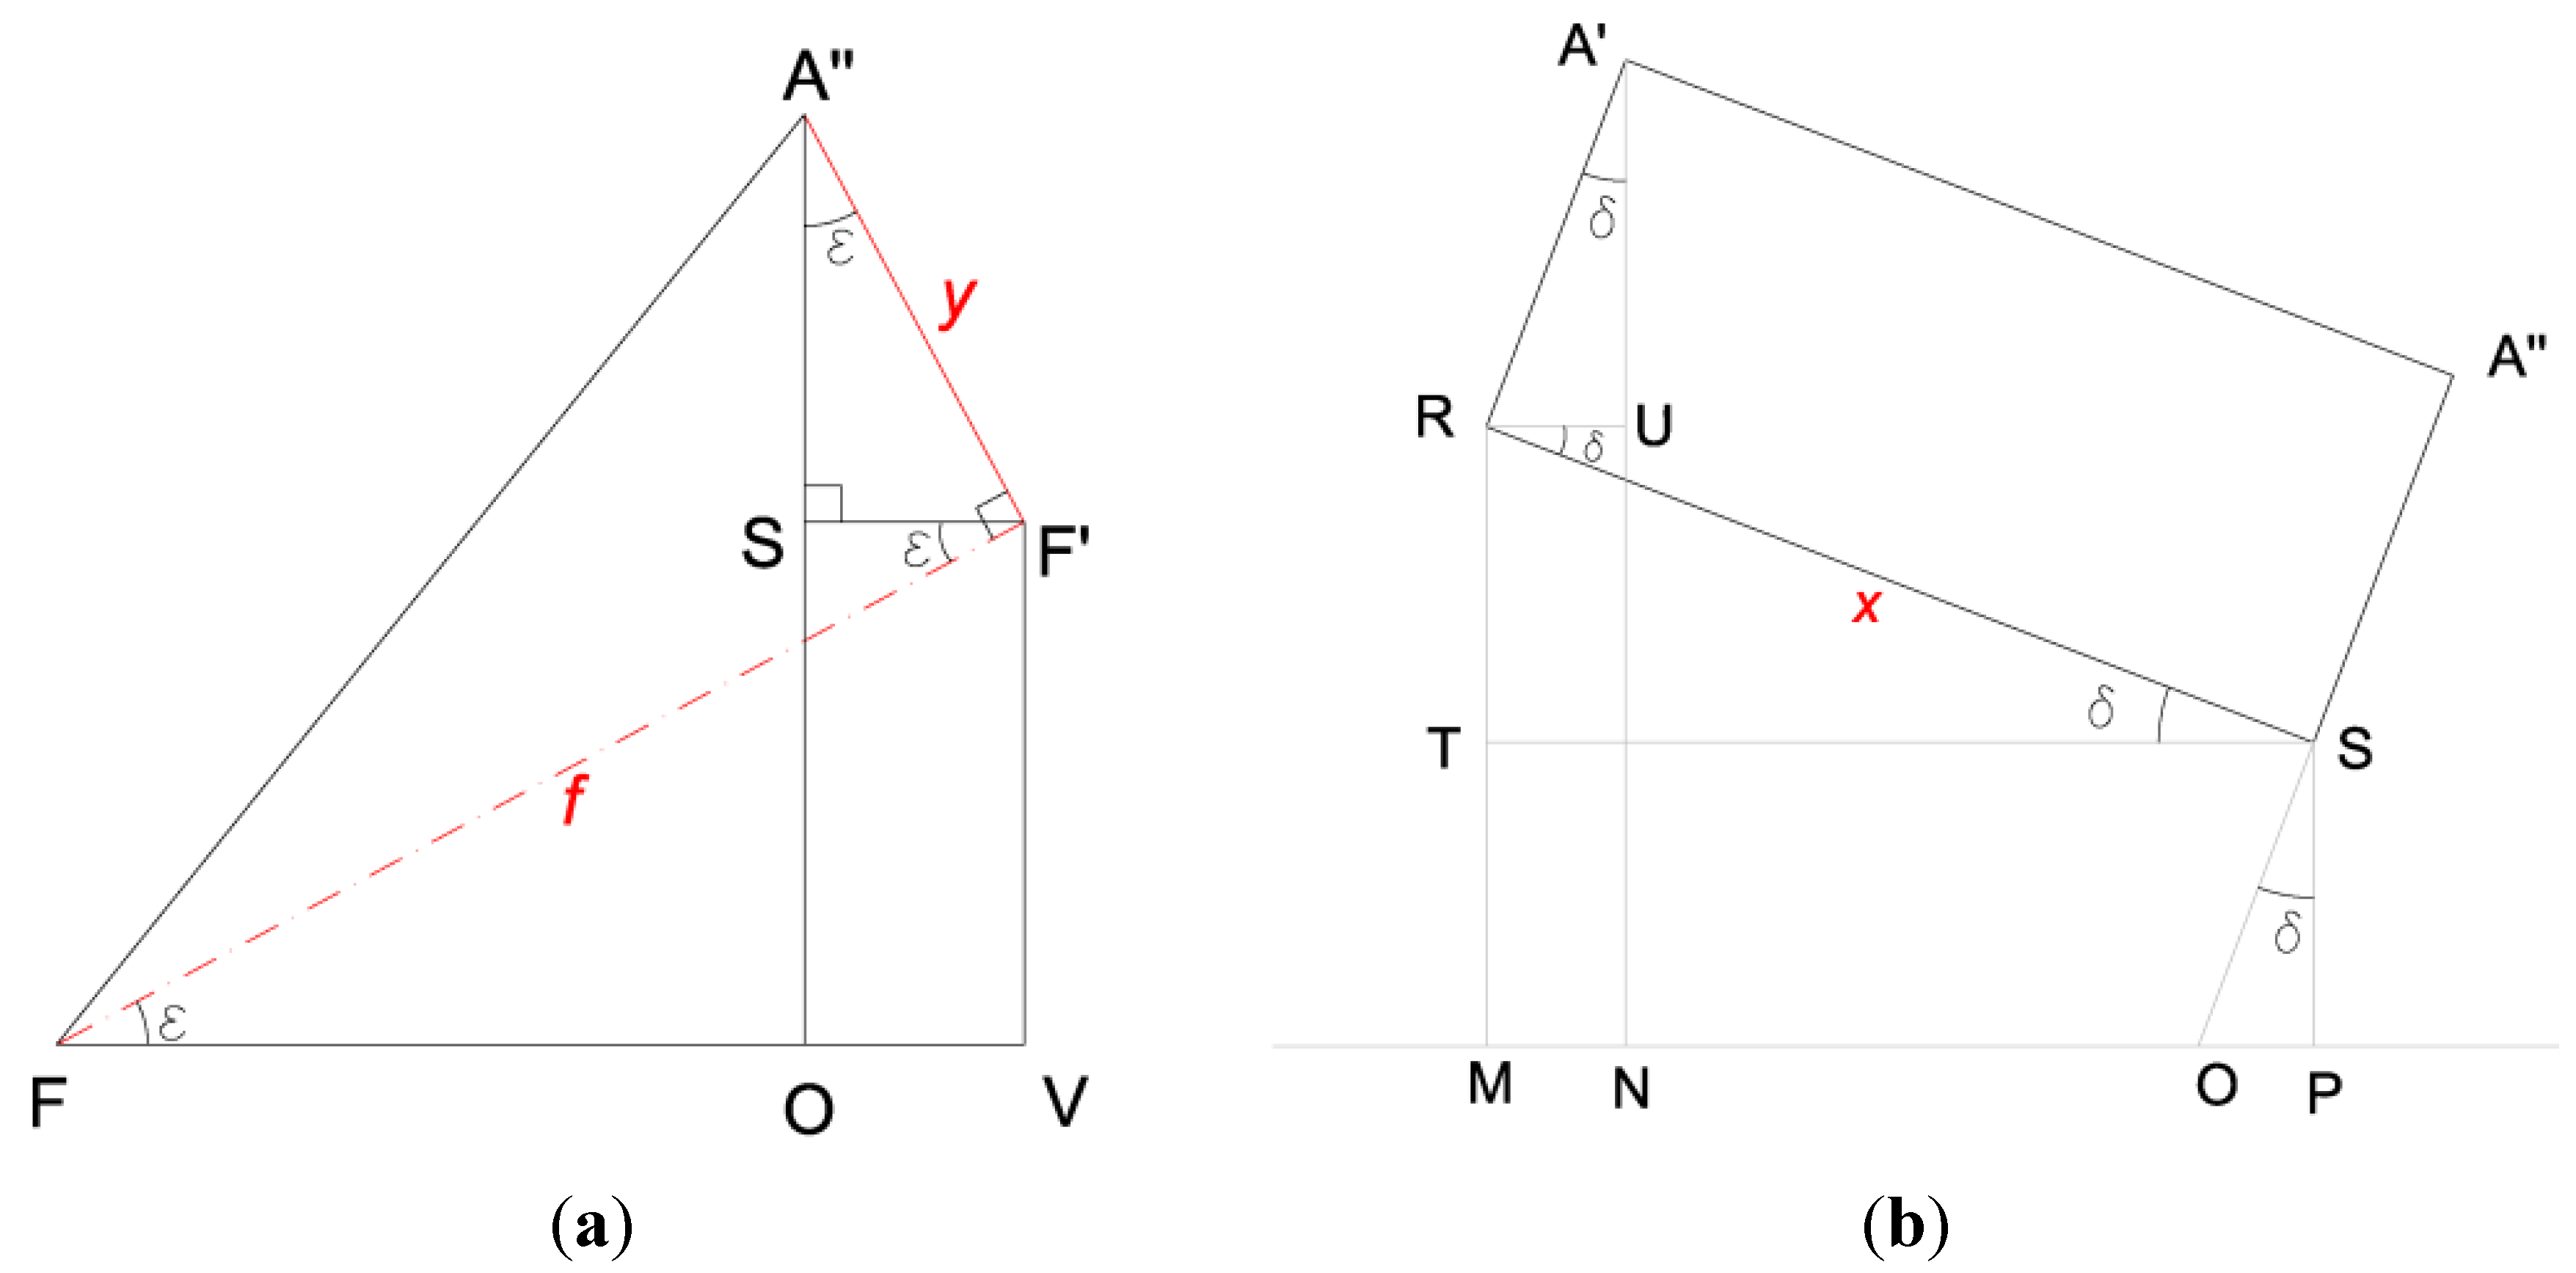
S the intersection between the vertical plane containing A' and A'' and the horizontal line passing through F' and parallel to the direction of flight;
-
O the intersection between the horizontal plane containing F and the line through A'' and S;
-
R the fourth corner of the rectangle A'A''SR;
-
T the intersection between the vertical axis through R and the horizontal plane through S;
-
M, N, P and Q the intersection of the horizontal plane with the vertical axes through R, A', S and F', respectively.
We need to calculate the zenith angle γ = Ijgi 03 00914 i002 and the azimuth ϑ = Ijgi 03 00914 i003.
Figure 1. Projection of the photographic plane on the three orthogonal planes.
Ijgi 03 00914 g001
The following calculations refer to the case when δ > 0 and are valid for points located in the top-left quadrant of the photographic plane (for these points, x > 0 and y > 0. The equations can however be determined trivially for all other cases.).
From triangle F'FQ, we have:
FQ = f ∙ sin φ
F'Q = SP = f ∙ cos φ
From triangle OSP:
OP = SP ∙ tan δ
Figure 2. (a) Oblique picture; (b) stretched view to fit ground projection.
Ijgi 03 00914 g002
Figure 3. The picture shows the view plane A'NF, the focal plane F'FQ and the top-left quadrant of the photographic plane A'A''F'R' (F' is the projection of the focal point on to the photographic plane).
Ijgi 03 00914 g003
Figure 4. Point A' represents the point selected by the user on the photographic plane.
Ijgi 03 00914 g004
However, OP = VQ. Therefore, indicating with μ = Ijgi 03 00914 i004, from triangle FVQ, we have:
OP = FQ ∙ sin μ
Hence:
Ijgi 03 00914 i005
From triangle FVQ:
FV = FQ ∙ cos μ
We also have:
Ijgi 03 00914 i006
From triangle F'FV, we get (see also Figure 5, which illustrates the front view of the GFVF' plane, inclined by the declination angle δ from the vertical plane):
Ijgi 03 00914 i007
SF' = OV = y ∙ sin ε
A'R = A''S = y ∙ sin ε
From triangle TSR, located on a vertical plane, we have (see Figure 5):
MP = TS = x ∙ cos δ
RU = MN = A'R ∙ sin δ
NO = MPOPMN (Note that, if δ < 0, then NO = MP + OP + MN)
FO = FVOV
Ijgi 03 00914 i008
We can now calculate the azimuth ϑ and zenith γ, relative to point A':
Ijgi 03 00914 i009
Ijgi 03 00914 i010
It is now possible to calculate the ground projections, provided that digital terrain and building models (DTM and DSM) are available. The morphology can be sensibly different from a simple horizontal plane. Figure 6 shows that, at the time the shot was taken, the position of the plane on the ground was at a very different altitude from the elevation of the buildings from which one would need to measure vertical distances.
Figure 7 illustrates the trigonometry involved in the calculation of a vertical distance, say BC, representing, for example, the height of a window in a building, where AP is the facade. The calculations will be carried out along the observer direction, i.e., on the vertical plane containing the focal point F and A'. Let also hF be the elevation of the focal point of the oblique picture with respect to the height datum.
Figure 5. (a) Front view of the oblique plane GFVF' and (b) of the vertical plane A'RMPA''.
Ijgi 03 00914 g005
Figure 6. A detailed digital terrain model is crucial for calculating ground projections.
Ijgi 03 00914 g006
The calculations require knowledge of the position of P, which is the projection on the ground of the top corner A of the building. The exact position of P will be calculated in the next chapter.
The angles γA, γB, γC can be calculated as in Equation (17), respectively, for the three points, A, B and C, of the building projected on to the oblique picture. It is then possible to calculate the angles between the directions FA, FB, FC and the vertical direction through F. We also have:
Ijgi 03 00914 i011
Ijgi 03 00914 i012
Ijgi 03 00914 i013
where the following values are known:
AOA = BOB = COC = POP
It is finally possible to calculate the height of the object (the window):
BC = FOCFOB'
and the elevation of each point in the building:
hA = hFFOA
hB = hFFOB
hC = hFFOC
Similarly, we can determine the projections to the ground of the points, A, B and C, along the FA, FB and FC directions, respectively.
Figure 7. Calculation of vertical distances.
Ijgi 03 00914 g007

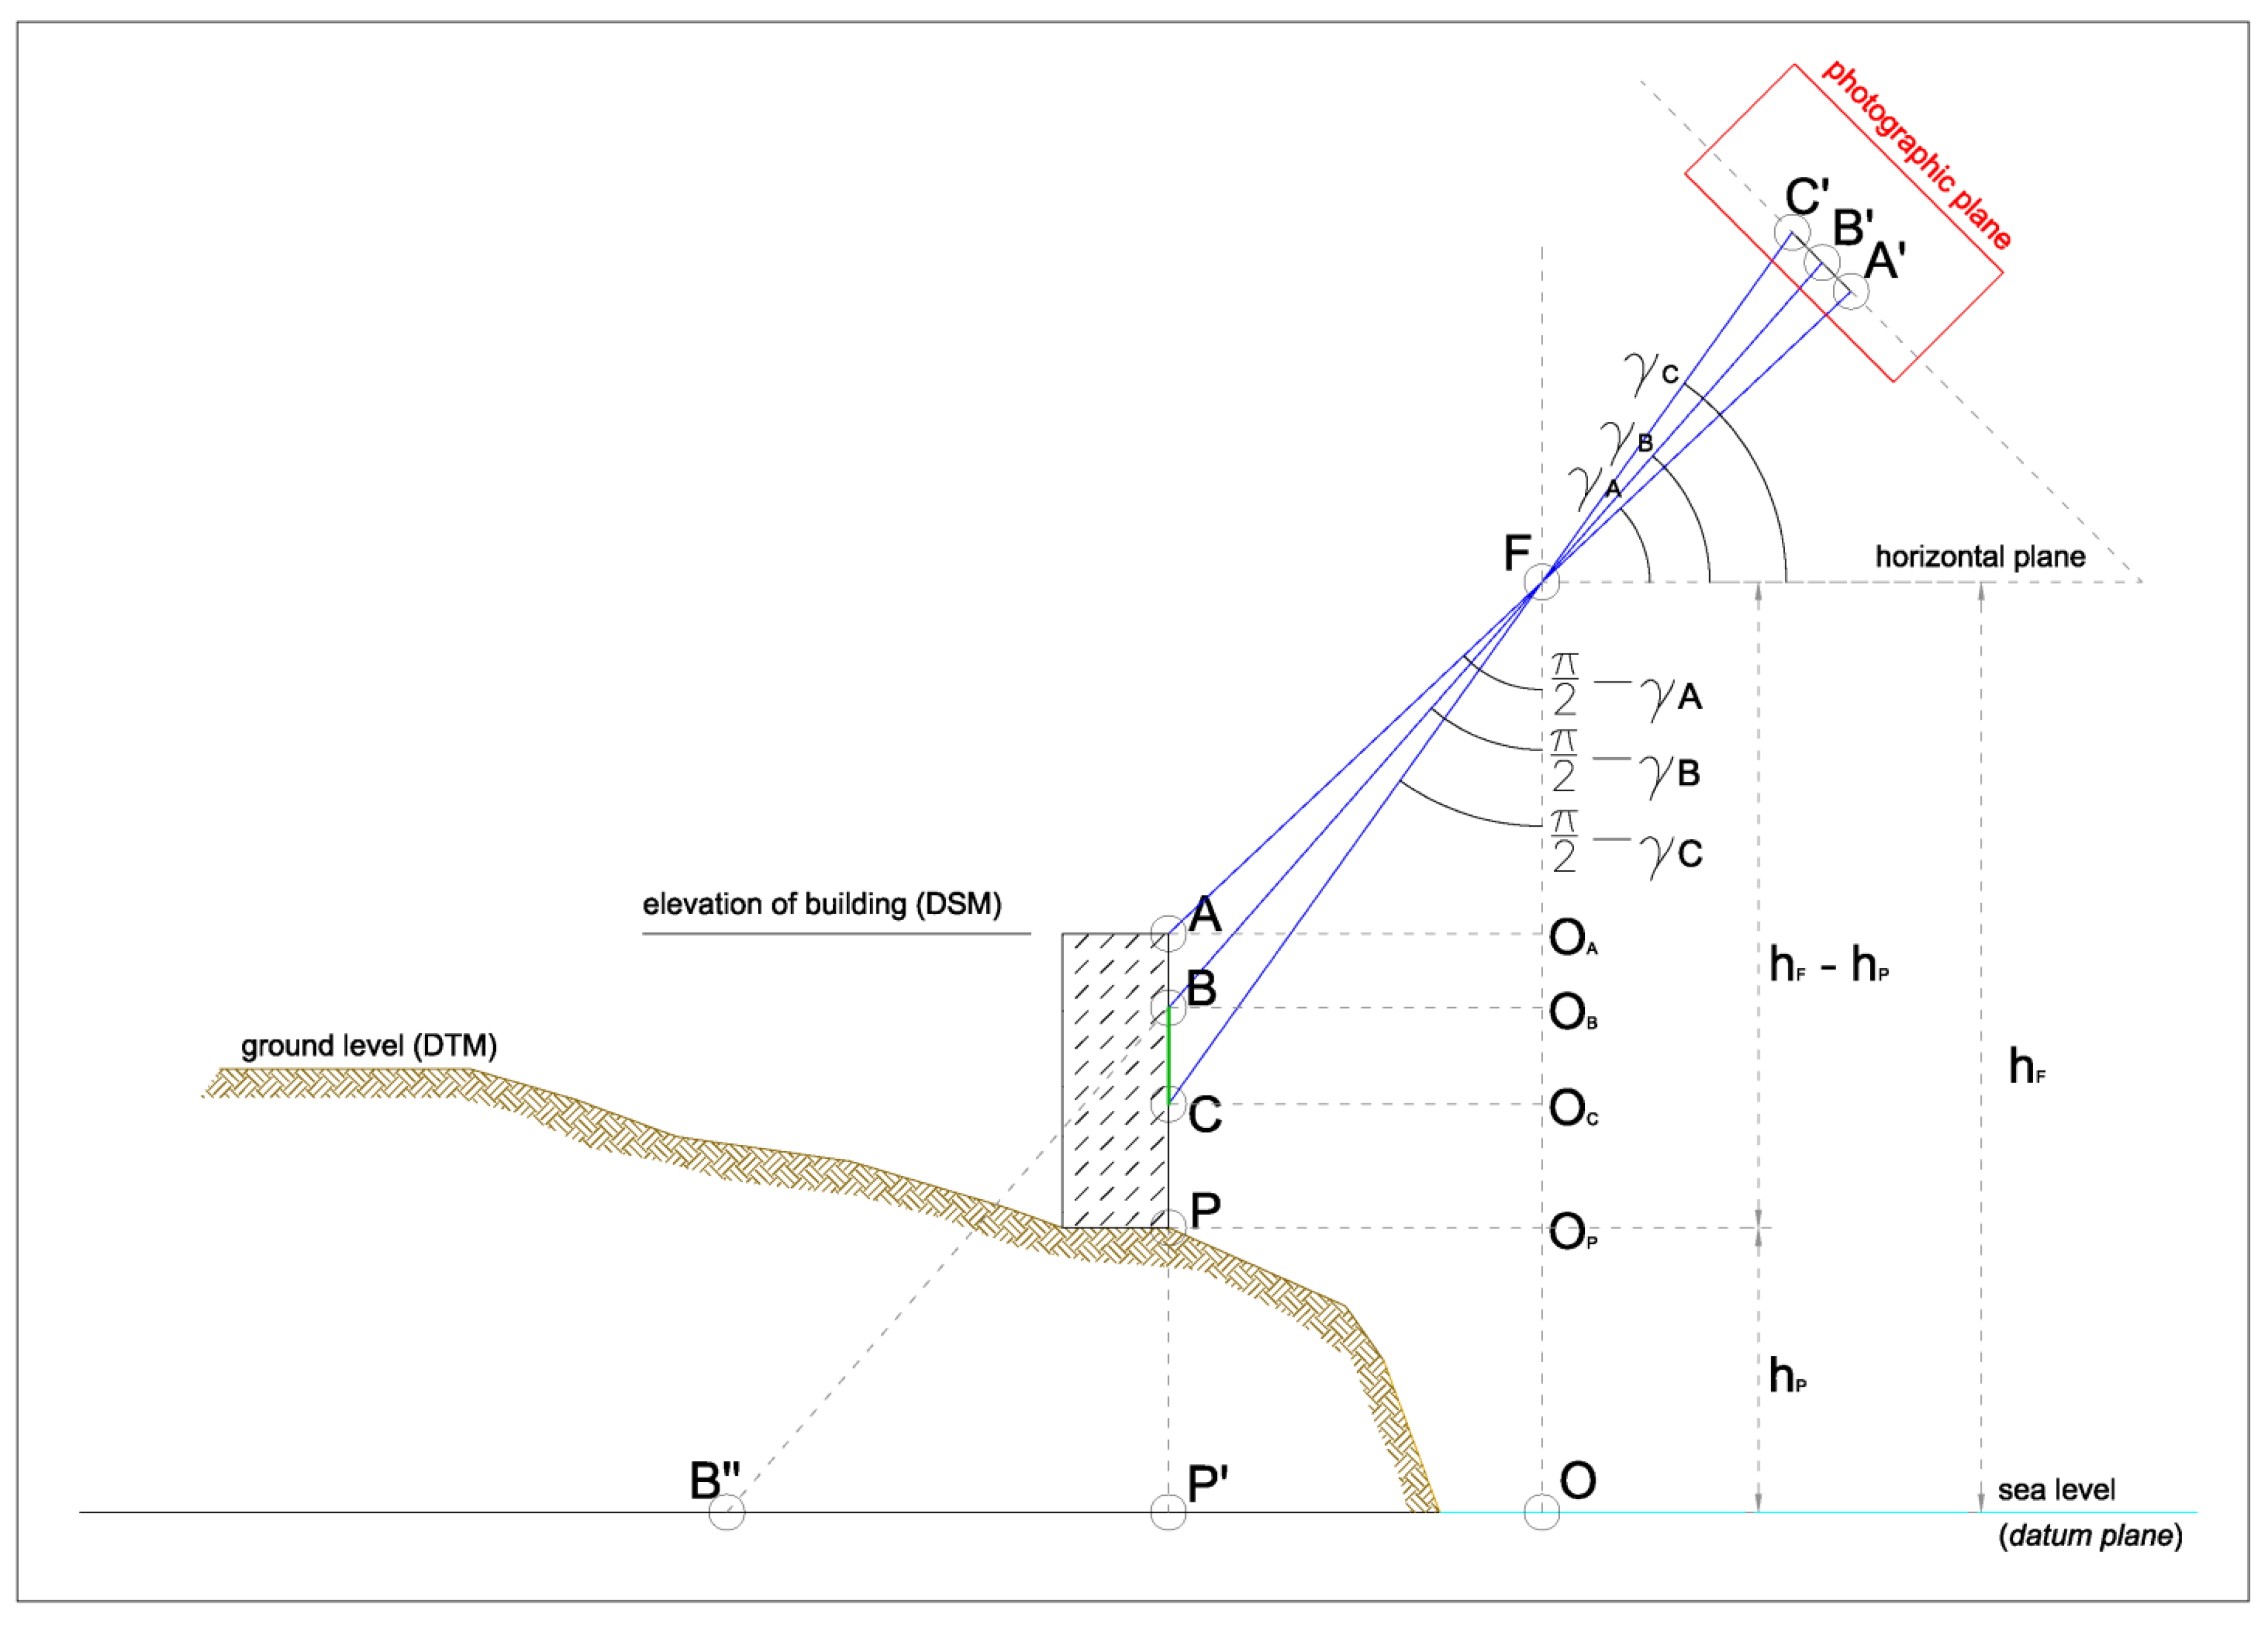
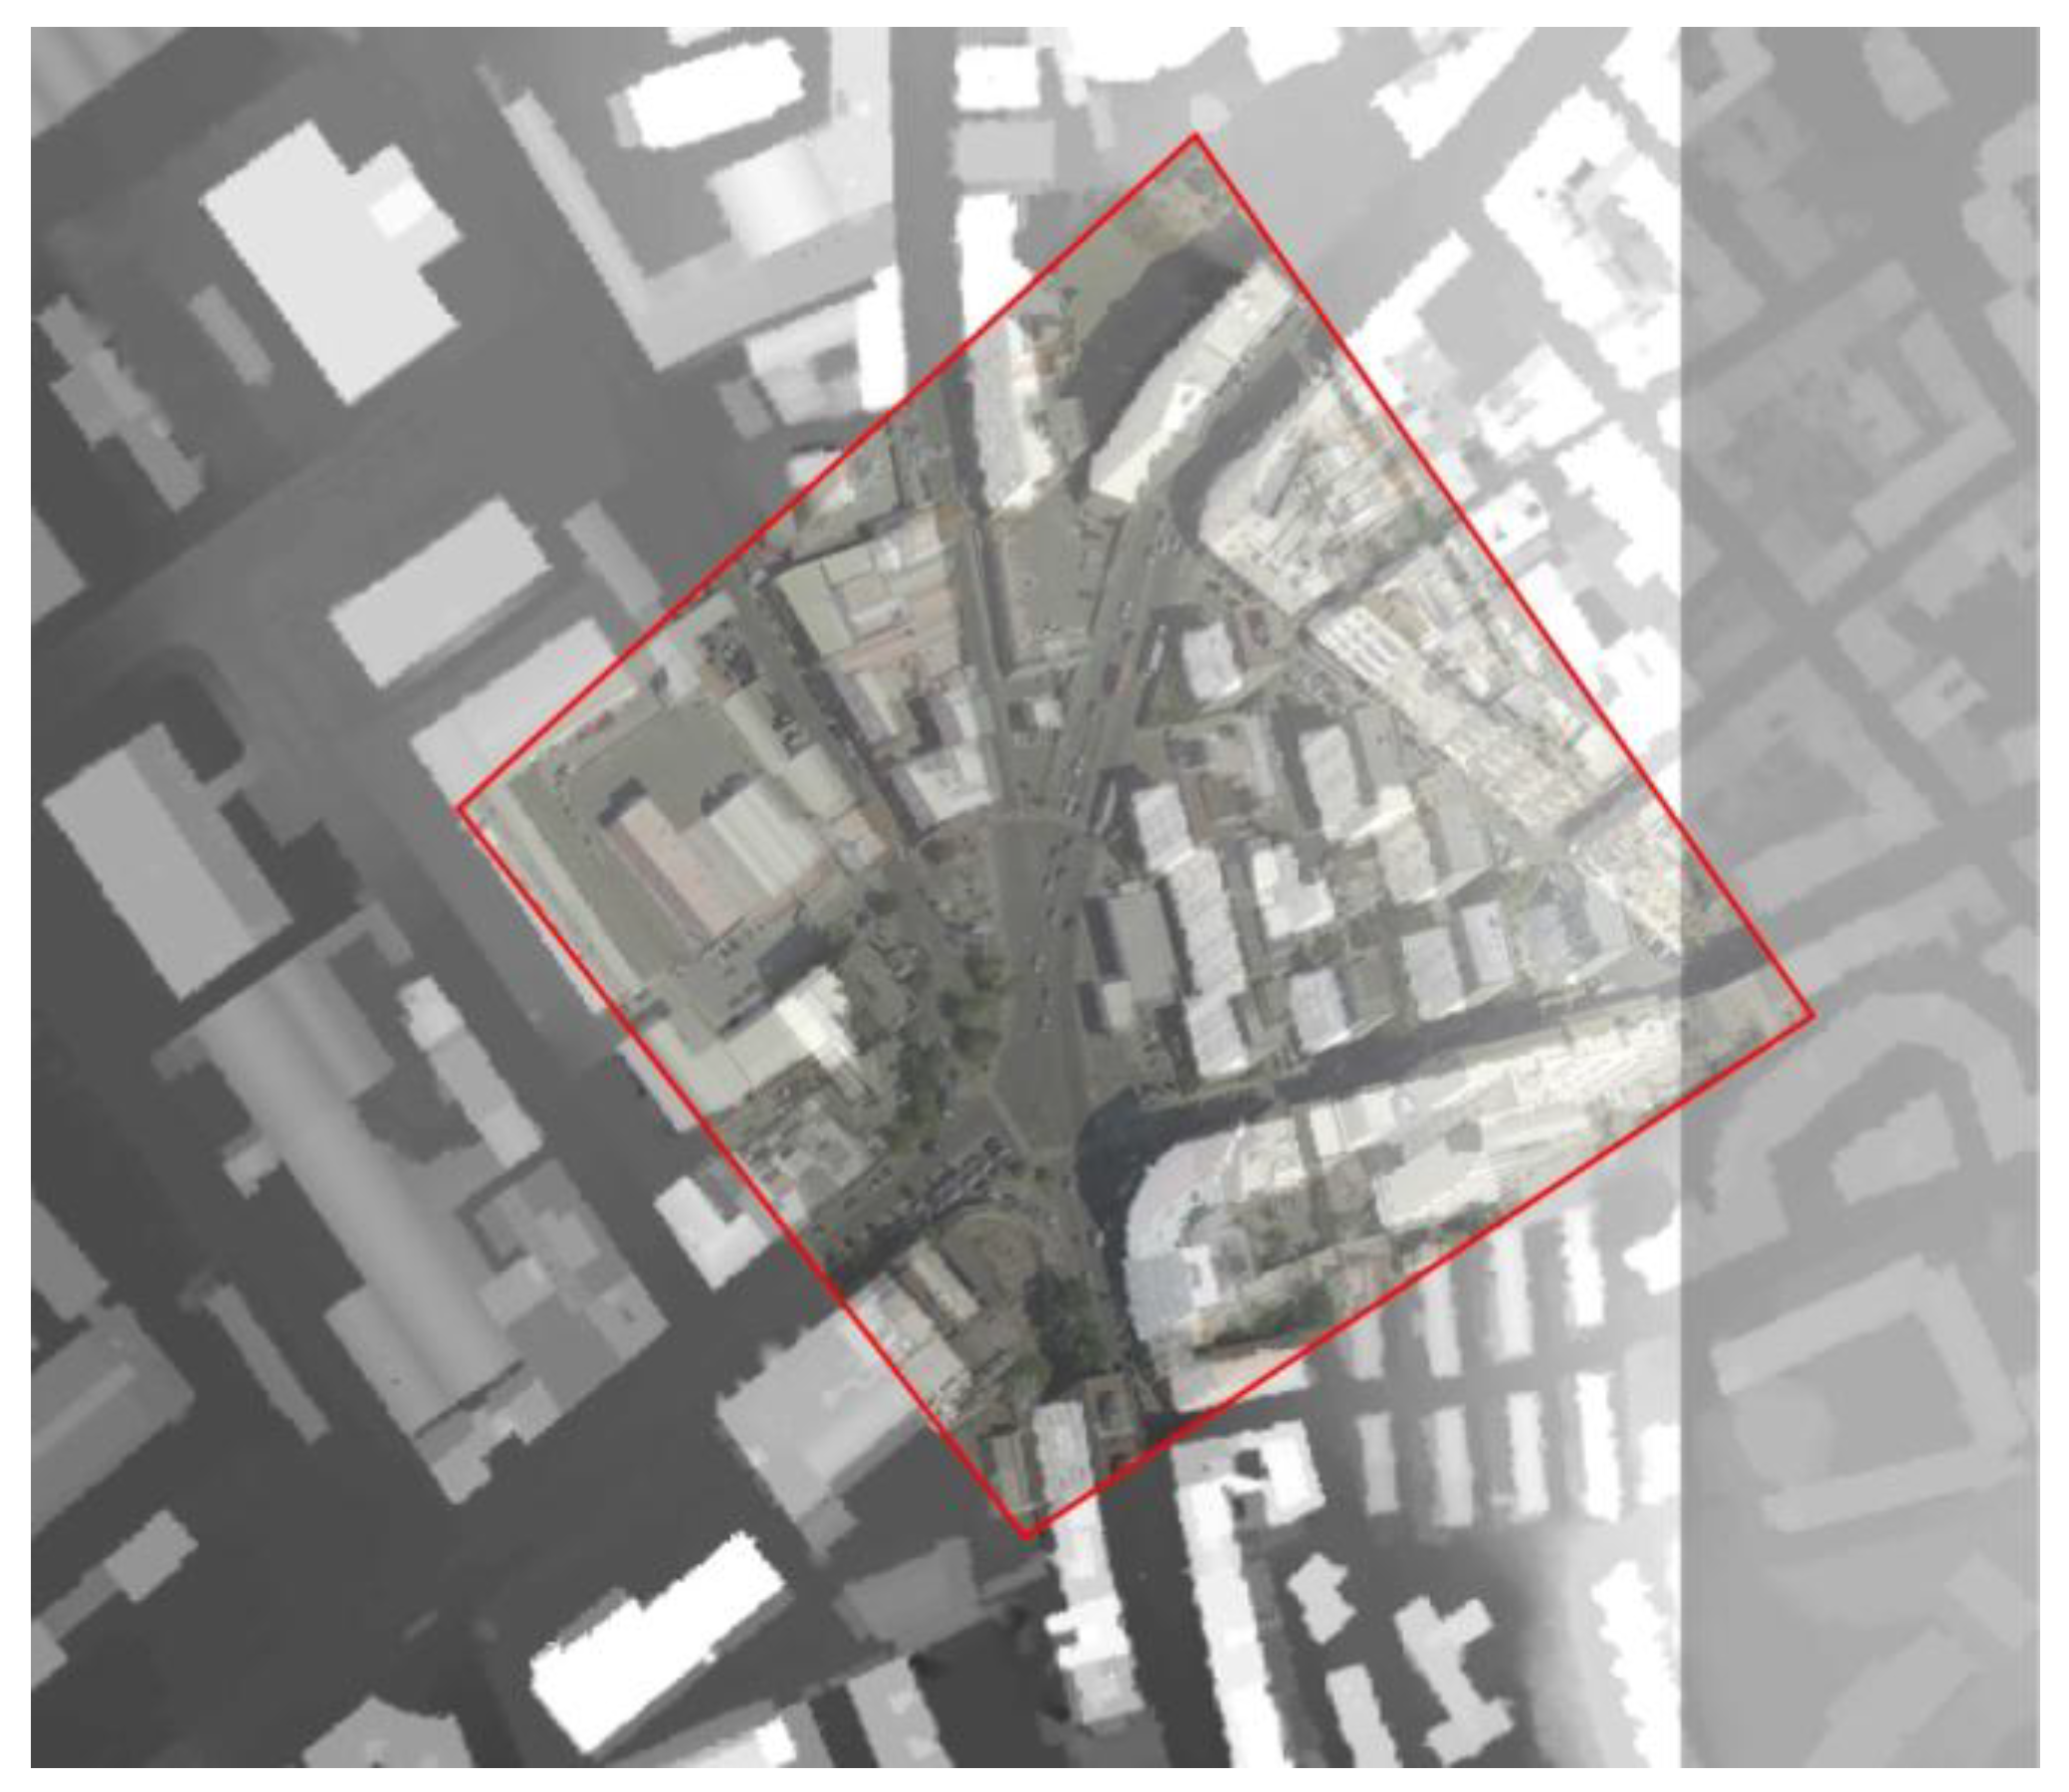
2.3. Calculating Ground Projections

To determine the ground projection P of the corner A of the building, in Figure 7, it is necessary to have a digital terrain model (DTM) and a digital surface model (DSM).
The Regione Sardegna is currently completing the acquisition of a high-precision DTM and DSM covering all historical settlements of the territory, with a 1-m cell size. The coordinate reference system is WGS84/UTM32N-EPSG:32632. The data was organized in ARC/INFO ASCII GRID format files.
The DSM is essentially a numerical matrix where:
-
NCOLS and NROWS represent the number of columns and rows in the matrix;
-
CELLSIZE is the grid cell size (1 m);
-
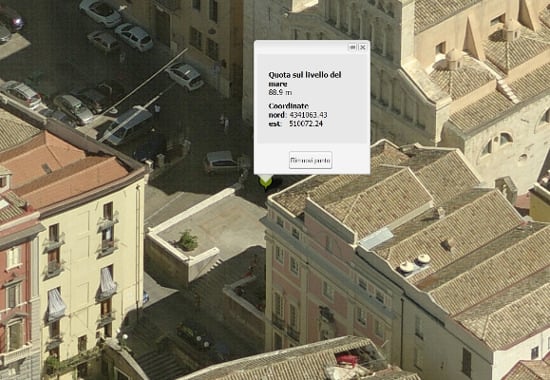
XLLCENTER, YLLCENTER are the geographical coordinates of the lower left number of the matrix (the number itself is the height of the point at those coordinates).
Therefore, a number in row r and column c of the matrix represents the elevation of a point located r CELLSIZE meters north of YLLCENTER and c CELLSIZE meters east of XLLCENTER.
The DSM matrix can also be read by GIS software as a grayscale image, such as that in Figure 8.
Figure 8. The DSM representation, overlapping the orthophotograph.
Ijgi 03 00914 g008
Essentially the DSM provides the elevation of the building above ground level (which, in turn, is provided by the DTM), as illustrated in Figure 9.
Figure 9. Schematic representation of DSM.
Ijgi 03 00914 g009
We now want to measure the vertical distance between two points, B and C, of a building. The vertical observation plane contains the points, F, B and C, and its projection, P'-O, “crosses” the DSM matrix (of which Figure 10 only shows a subset, the DSM having 1-m density) at an angle equal to ϑ, which was determined in the formulae of the previous section.
Figure 10. Schematic representation of DSM and the observation plane from the airplane.
Ijgi 03 00914 g010
The ground projection P of point B can be determined simply as the first point where the height above sea level (i.e., the distance AP') is equal or larger than the height of the observation line FB at (xP', yP'). Computationally speaking, we simply need to “browse” the DSM matrix in the ϑ direction until a point (xP', yP') is found where the value of the matrix (i.e., the elevation of the DSM) is equal or larger than the height of the observation line FB in that point. Since the observation line FB is inclined by Ijgi 03 00914 i014, known from the previous calculations, with reference to Figure 7, that condition is satisfied if:
AP'BP'
where AP' is the DSM value in P', and:
BP' = B''P' ∙ tan γB
where:
Ijgi 03 00914 i015
Note that P'O = POP is known because it represents the distance of P from OP as we browse the DSM matrix.
Furthermore, because PP' is the value of the DTM in P, we can find the elevation of B from the ground:
BP = BP'PP'
It is worth pointing out that a DSM value is defined at any geographical location. The DSM model is by definition discrete with a 1-m resolution; therefore, all points inside a 1 × 1-m square are assigned the same height.

3. Results: Algorithm Implementation and Accuracy

The algorithm was implemented inside the oblique picture online viewer developed by the Regione Sardegna (Figure 11). This function can be activated with a button in the viewer GUI and returns the elevation of any point of a building (roofs and facades alike) from the ground. It also returns the longitude and latitude of the ground projection.
Figure 11. Implementation of the algorithm in the SardegnaMappe web interface.
Ijgi 03 00914 g011
In calculating vertical distances, it is more desirable that, once the ground projection P of the first point selected by the user is calculated, the software should not recalculate the projection P' for the second point selected. In fact, one needs to consider the inevitable input error generated by the user while selecting the two points, resulting in these points not being vertically aligned, so that their ground projections will not overlap.
In any case, the software does allow the user to remove this setting, for instance, when they need to measure the vertical distance between two points having different ground projections (i.e., as in the case of slanted roofs).
The algorithm returns the elevation with a level of accuracy that is inherently dependent on the resolution of the DSM model (1 m). Thus, if the corner of a building is selected in order to determine its height, the projection line from the position of the observer might fall beyond the building; thus, the software might actually return an elevation of a point on the ground that lies behind the building (Figure 12 and Figure 13). In this case, however, the software will only display the height above sea level, making the elevation from the ground meaningless.
Figure 12. The corner of a building is selected to find the elevation from the ground.
Ijgi 03 00914 g012
Figure 13. The algorithm precision is related to the DSM model being discrete. Thus, selecting the corner of a building might result in the algorithm calculating the elevation of the point that lies beyond the building itself.
Ijgi 03 00914 g013

4. Discussion

The application in the SDI of the Regione Sardegna of the algorithm described here has several uses:
(1) At the public level, an online software that is freely accessible to the public, where one can measure vertical distances, is currently lacking. Most programs of this nature cost money, which the private individual or even public administrations may not be able to afford.
(2) The ability of a tool that can immediately calculate vertical distances within the construction industry enables more efficient building and enhances compliance with building codes.
(3) For city governments under whose jurisdiction building and housing code enforcement falls, the application and use of such a tool allow for easy monitoring of building compliance and, in the long run, help to better promote sustainable planning.
The main objective of such a software at the public administration level is so that each municipal government has access to an accurate database of aerial photography, which can then be manipulated on a case by case basis, using measurements to determine such things as facade height, roof angulation, antenna and satellite dish location, location of solar panels, building extensions or even door and window heights. This puts the regulation of compliance with zoning and building ordinances at the local level, even when governed by larger regional/state/or country codes.
The Regione Sardegna, for instance, has a specific need for the compliance with such codes, particularly along coastal zones and in historical city centers. With each “comune” (municipality) responsible for their unique territorial needs, land development and urban and landscape planning can proceed in a more sustainable way; thus balancing the need for development and expansion with the preservation of a unique island perspective.

5. Conclusions

This article describes a mathematical algorithm that calculates the vertical distances of buildings, based on measurements made on high-resolution oblique pictures. All camera settings, flight parameters and detailed digital terrain and digital surface models are required to calculate these distances. The algorithm was implemented on a public web application, which allows users to view the oblique pictures in a continuous way and to measure both vertical and oblique distances.

Author Contributions

Massimiliano Molinari: analysis of flight variables and photograph parameters; algorithm generation, revision and testing; bibliographic research. Stefano Medda: problem setting; analysis of flight variables and photograph parameters; bibliographic research. Samir Villani: problem setting; bibliographic research.

Conflicts of Interest

The authors declare no conflict of interest.

References

  1. Grenzdörffer, G.J.; Guretzki, M.; Friedlander, I. Photogrammetric Image Acquisition and Image Analysis of Oblique Imagery—A New Challenge for the Digital Airborne System PFIFF. In Proceedings of 2007 ISPRS Hannover Workshop: High-Resolution Earth Imaging for Geospatial Information, Hannover, Germany, 29 May–1 June 2007.
  2. Przemyslaw, M.; Wonka, P.; Aliaga, D.G.; Wimmer, M.; Gool, L.; Purgathofer, W. A Survey of Urban Reconstruction. In Computer Graphics Forum; John Wiley & Sons Ltd.: New York, NY, USA, 2013; Volume 32, pp. 146–177. [Google Scholar]
  3. Pons, J.P.; Soubra, S. 3D Reconstruction of Large Scale City Models as a Support to Sustainable Development. In Cooperative Design, Visualization, and Engineering; Springer: Berlin/Heidelberg, Germany, 2008; pp. 172–175. [Google Scholar]
  4. Charalambos, P.; You, S. 3D Reconstruction of Urban Areas. In Processing of the 2011 International Conference on 3D Imaging, Modeling, Visualization and Transmission (3DIMPVT), Hangzhou, China, 16–19 May 2011; pp. 33–40.
  5. Guo, R.; Li, L.; Ying, S.; Luo, P.; He, B.; Jiang, R. Developing a 3D cadastre for the administration of urban land use: A case study of Shenzhen, China. Comput. Environ. Urban Syst. 2013, 40, 46–55. [Google Scholar] [CrossRef]
  6. AIMS. Available online: http://aims.jocogov.org/AIMSData/Oblique.aspx (accessed on 17 April 2014).
  7. Massachusetts Department of Transportation. Available online: https://www.massdot.state.ma.us/planning/Main/MapsDataandReports/Maps/InteractiveMaps/Pictometry.aspx (accessed on 16 April 2014).
  8. Idan Computers Ltd. Available online: http://www.idan.com (accessed on 17 April 2014).
  9. Google Maps. Available online: https://maps.google.it (accessed on 22 April 2014).
  10. Bing Maps. Available online: http://www.bing.com/maps (accessed on 22 April 2014).
  11. Fugro. Available online: http://www.fugrogeospatial.com/services/aerial-imagery/panoramix_oblique_imagery (accessed on 22 April 2014).
  12. Blom. Available online: http://www.pictometry.com (accessed on 3 December 2013).
  13. Garnero, G.; Cogoni, A. Activity at Low Altitude Photography in Urban Agglomerations of Sardinia and Its Architectural Context. In Planning Support Tools: Policy Analysis, Implementation and Evaluation, Proceedings of the 2012 International Conference on Informatics and Urban and Regional Planning, Cagliari, Italy, 10–12 May 2012.
  14. Hohle, J. Photogrammetric measurements in oblique aerial images. Photogramm. Fernerkund. Geoinform. 2008, 1, 7–14. [Google Scholar]
  15. Cannarozzo, R.; Cucchiarini, L.; Meschieri, W. La presa dei fotogrammi. In Misure, Rilievo, Progetto, 4th ed.; Zanichelli Editore: Bologna, Italy, 2012; Volume 3, pp. 34–66. [Google Scholar]

