Determination of Suitable Areas for the Generation of Wind Energy in Germany: Potential Areas of the Present and Future

Abstract
:1. Introduction
1.1. General Criteria for the Estimation of Potential Areas
1.2. Research Context and Scientific Contribution
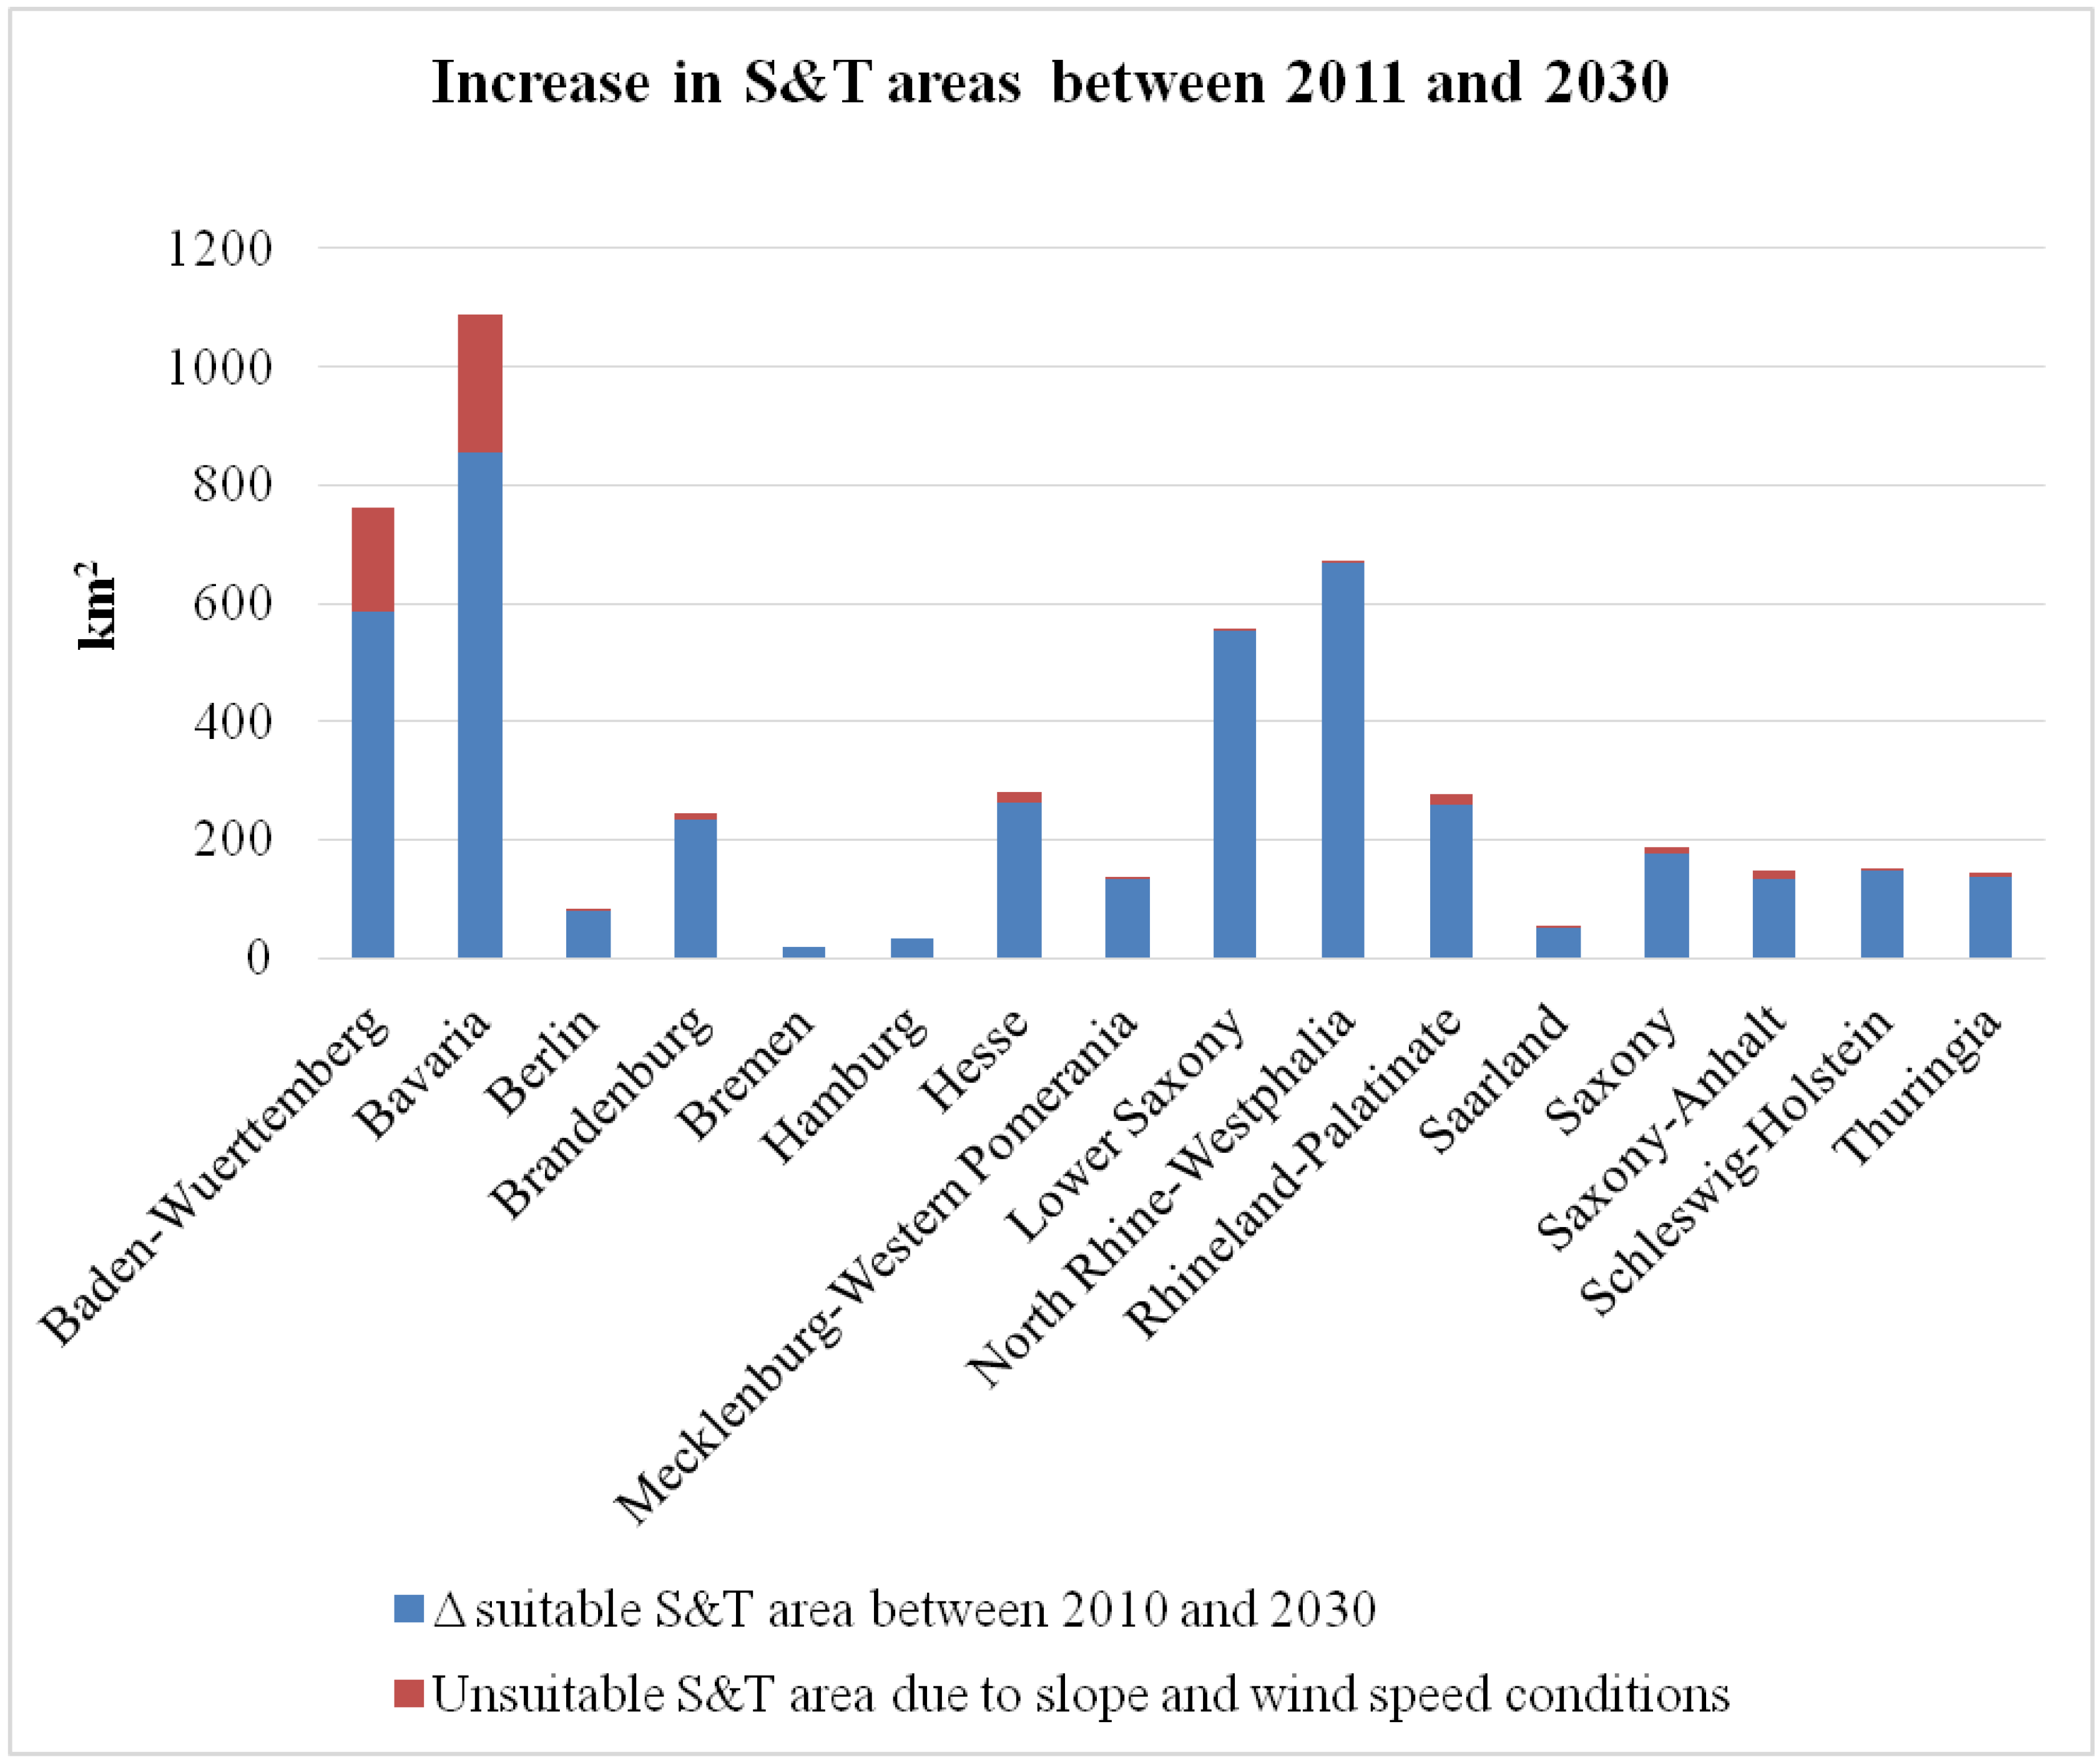
1.3. The Development of Settlement and Traffic Areas
2. Data

| Spatial Coverage | Data Source | Data Description | Timelines |
|---|---|---|---|
| Germany | Federal Agency for Cartography and Geodesy | DLM AAA250 | 2006–2011, partly 2012 |
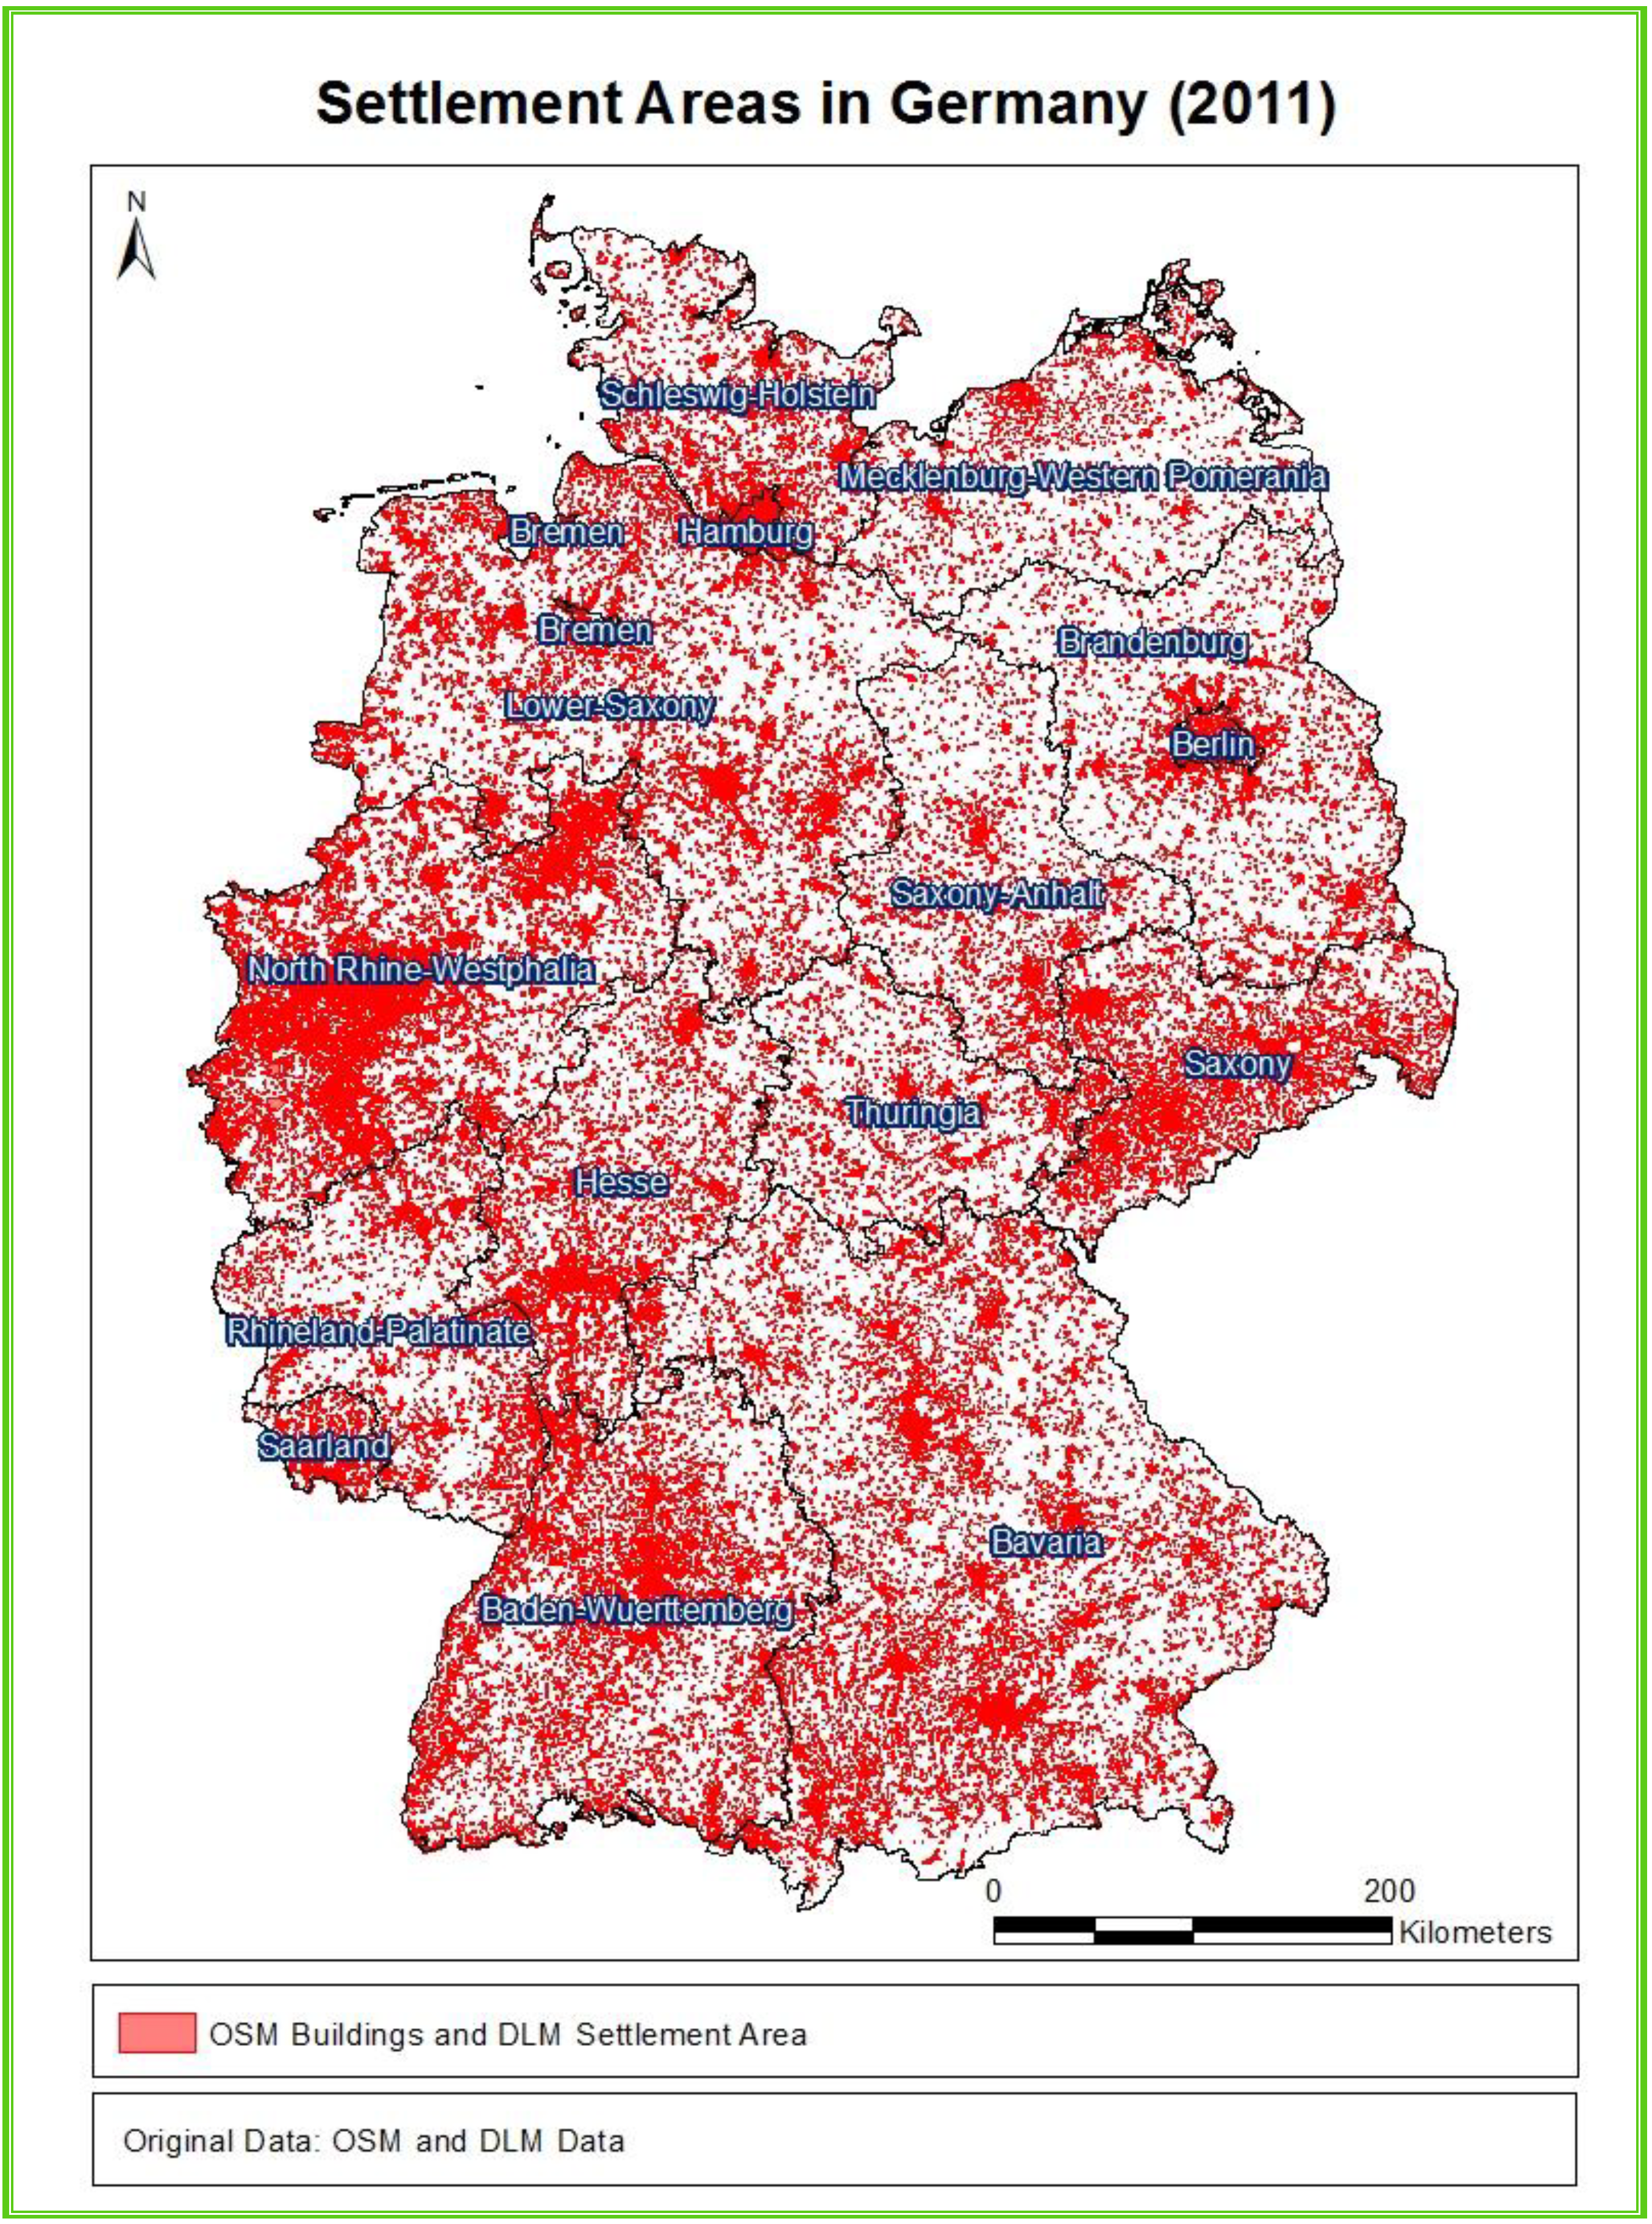
| Germany | Open Street Map | Building data | 06/2013 |
| Baden-Wuerttemberg | Landesanstalt für Umwelt, Messungen und Naturschutz Baden-Württemberg (LUBW) | Coordinates and time of commissioning date (partial) of each WEP listed | 12/2012 |
| Bavaria | Energy Atlas Bavaria | Coordinates and time of commissioning date (partial) of each WEP listed | 5/2013 |
| Berlin | Google Earth (manually captured) | Coordinates and time of commissioning date of each WEP listed | 5/2013 |
| Brandenburg | Landesamt für Umwelt, Gesundheit und Verbraucherschutz; Department T/3 gebietsbezogener Immissionsschutz, Lärmschutz | Coordinates and time of commissioning date (partial) of each WEP listed | 3/2013 |
| Bremen | Federal Agency for Cartography and Geodesy | Coordinates of each WEP listed | 03/2012 |
| Hamburg | Federal Agency for Cartography and Geodesy | Coordinates of each WEP listed | 03/2012 |
| Hesse | Hessisches Länderinformationssystem Anlagen (LIS-A); Hessisches Ministerium für Umwelt, Energie, Landwirtschaft und Verbraucherschutz | Coordinates and time of commissioning date of each WEP listed | 2/2013 |
| Mecklenburg-Western Pomerania | Federal Agency for Cartography and Geodesy | Coordinates of each WEP listed | 03/2012 |
| Lower Saxony | Federal Agency for Cartography and Geodesy | Coordinates of each WEP listed | 03/2012 |
| North Rhine-Westphalia | Landesamt für Natur, Umwelt und Verbraucherschutz | Coordinates and time of commissioning date (partial) of each WEP listed | 12/2012 |
| Rhineland-Palatinate | Ministerium für Wirtschaft, Klimaschutz, Energie und Landesplanung | Coordinates and time of commissioning date (partial) of each WEP listed | 3/2013 |
| Saarland | Federal Agency for Cartography and Geodesy | Coordinates of each WEP listed | 03/2012 |
| Saxony | Sächsische Energieagentur SAENA GmbH | Coordinates and time of commissioning date (partial) of each WEP listed | 12/2011 |
| Saxony-Anhalt | Federal Agency for Cartography and Geodesy | Coordinates of each WEP listed | 03/2012 |
| Schleswig-Holstein | Federal Agency for Cartography and Geodesy | Coordinates of each WEP listed | 03/2012 |
| Thuringia | Federal Agency for Cartography and Geodesy | Coordinates of each WEP listed | 03/2012 |
| Germany | CGIAR-CSI Internal Centre for Tropical Agriculture (CIAT) | SRTM_NW_38_02; SRTM_NO_39_02; SRTM_SW_38_03; SRTM_SO_39_03 | 02/2000 |
| Germany | Federal Agency for Nature Conservation, Department Z 2.1Geographic Information Systems, Nature Protection Information and Cartography | Areas of Natura 2000; Biosphere reserves; National parks; Landscape protection areas; Nature protection areas; Protected Areas under the RAMSAR Convention; Natural parks | 2012 |
| Germany | European Environment Agency | Moors and heathlands; Inland marshes; Peat Bogs; Glaciers and perpetual snow | 04/2012 |
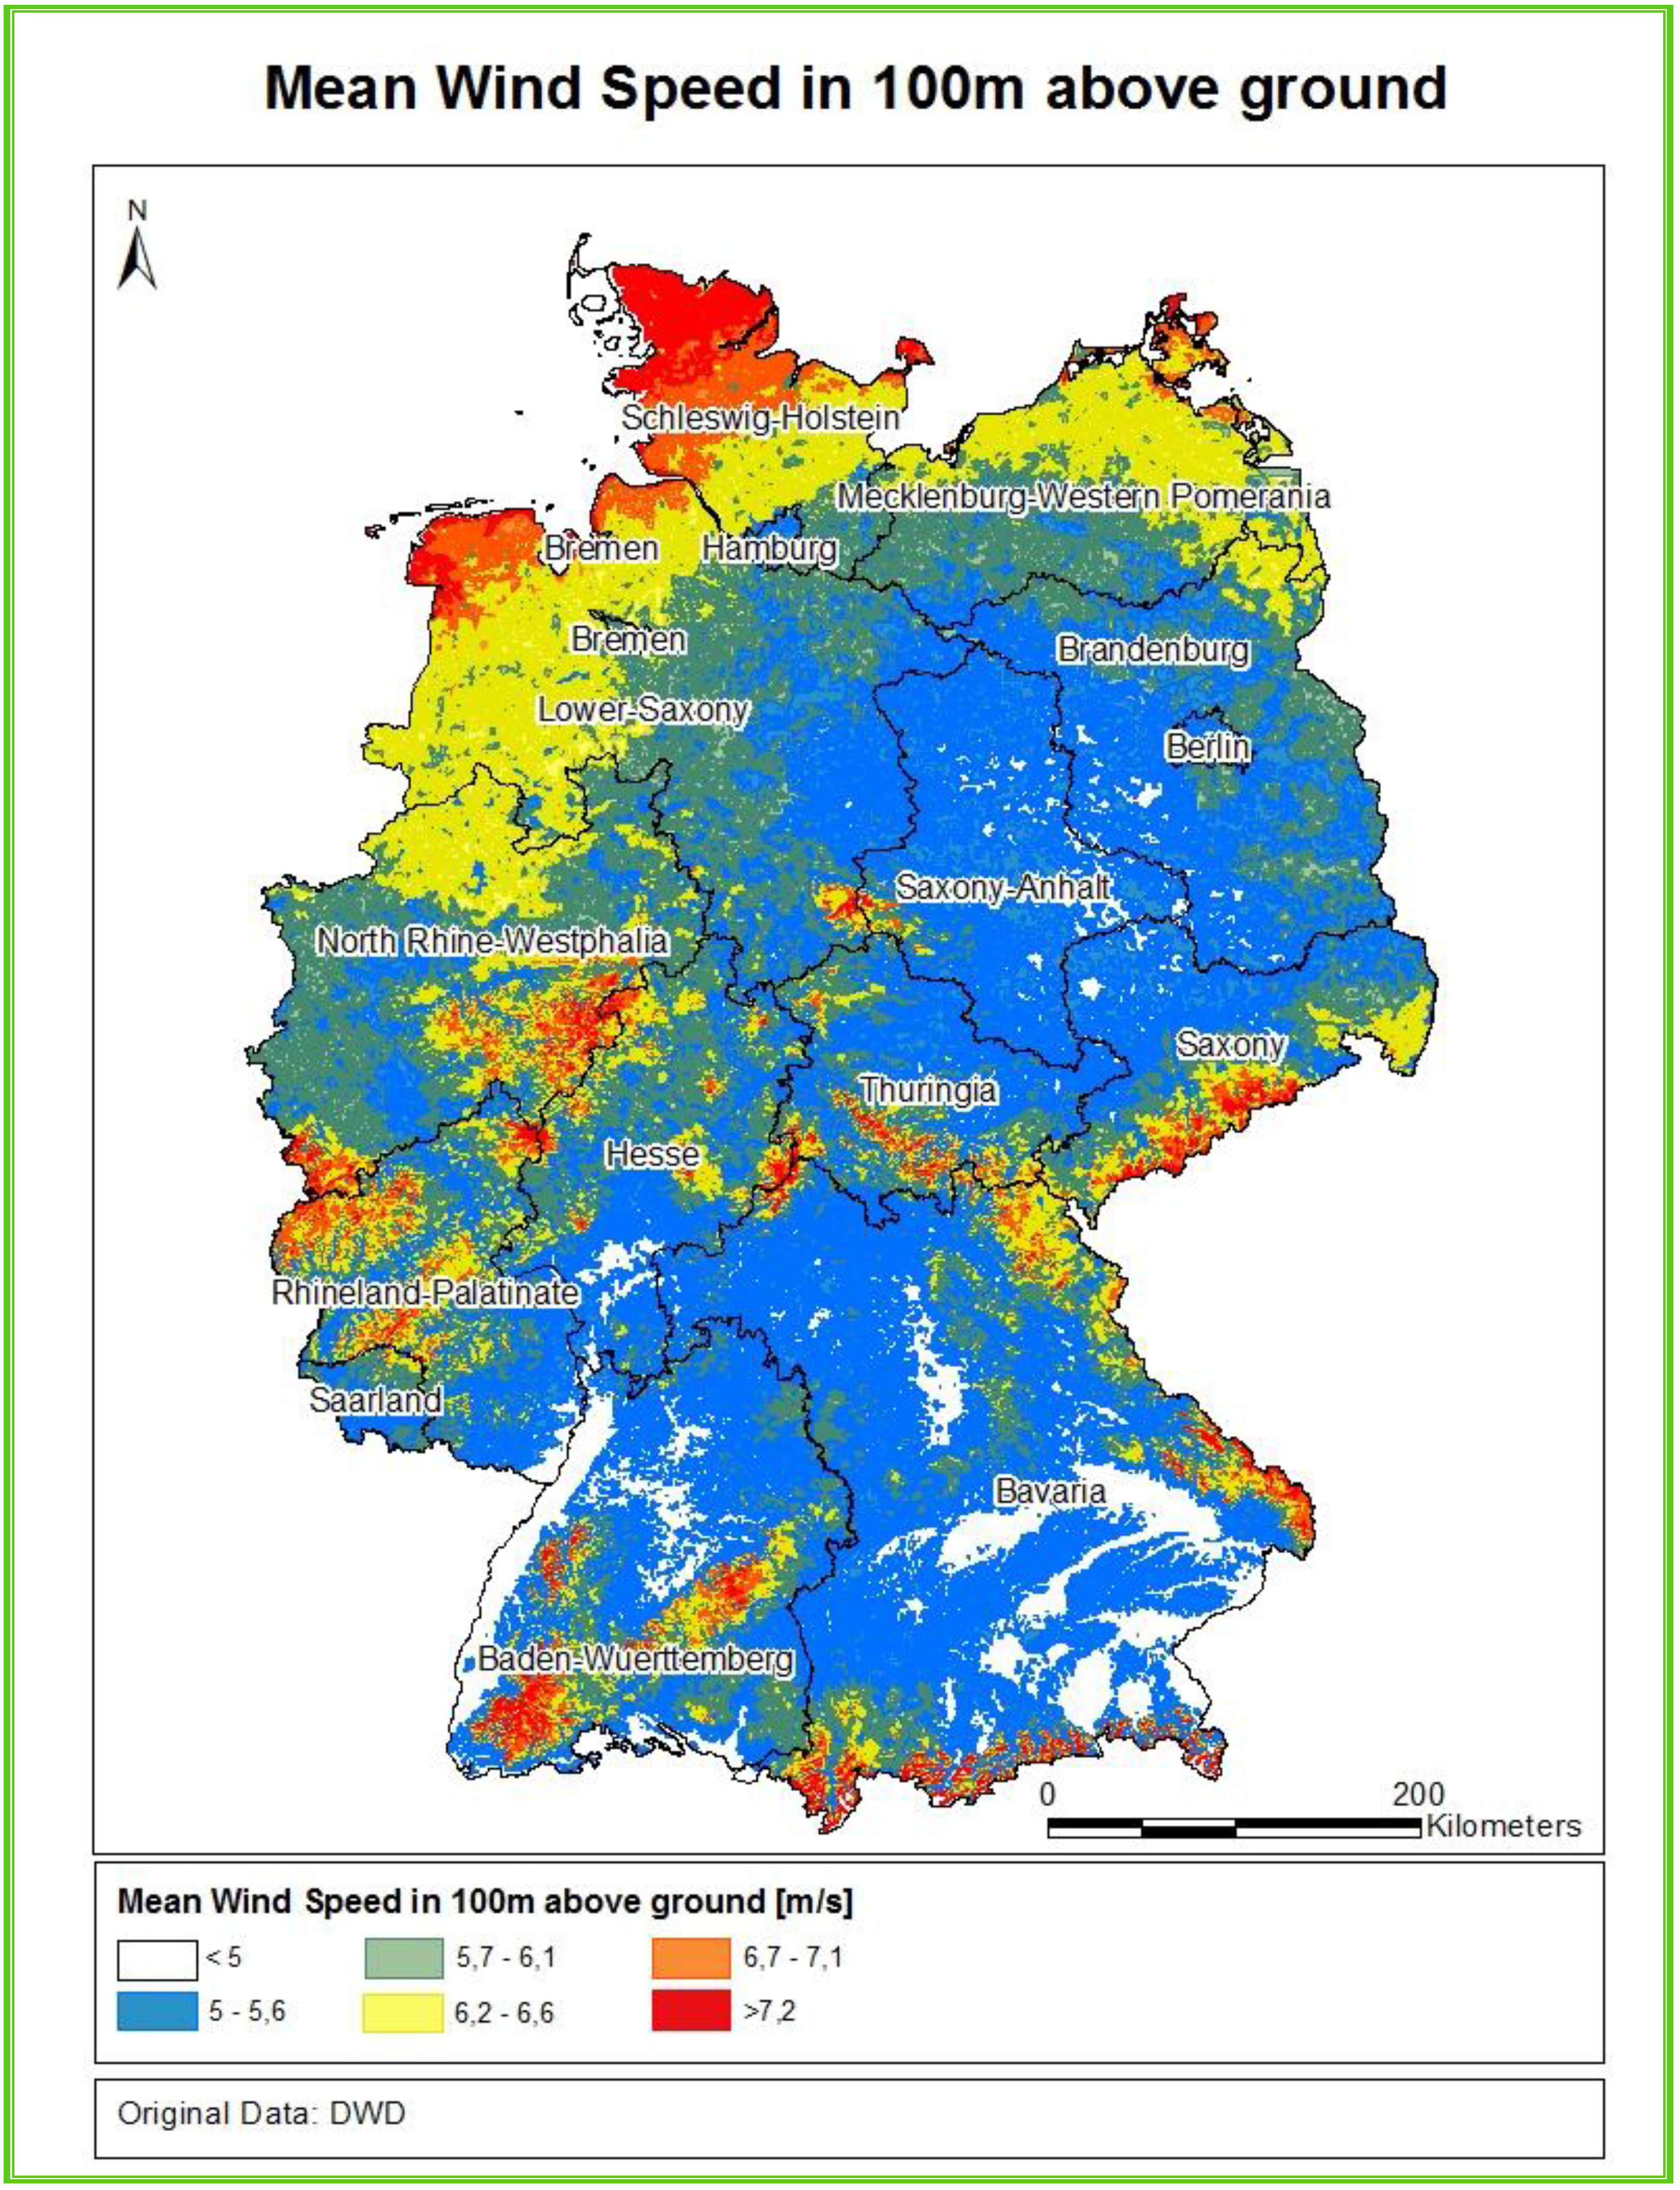
| Germany | German Weather Service (DWD) | Mean wind speed in 100 m above ground, 200 m-Raster | 07/2012 |
| Ettlingen | Landesamt für Geoinformation und Landentwicklung (LGL), Ettlingen | ALKIS-survey data | 07/2013 |
| Federal States and/ or Counties | Regional Database Germany and GENESIS online, provided by the Federal Statistical Office | Statistical data on Land use | 07/2013 |
3. Approach
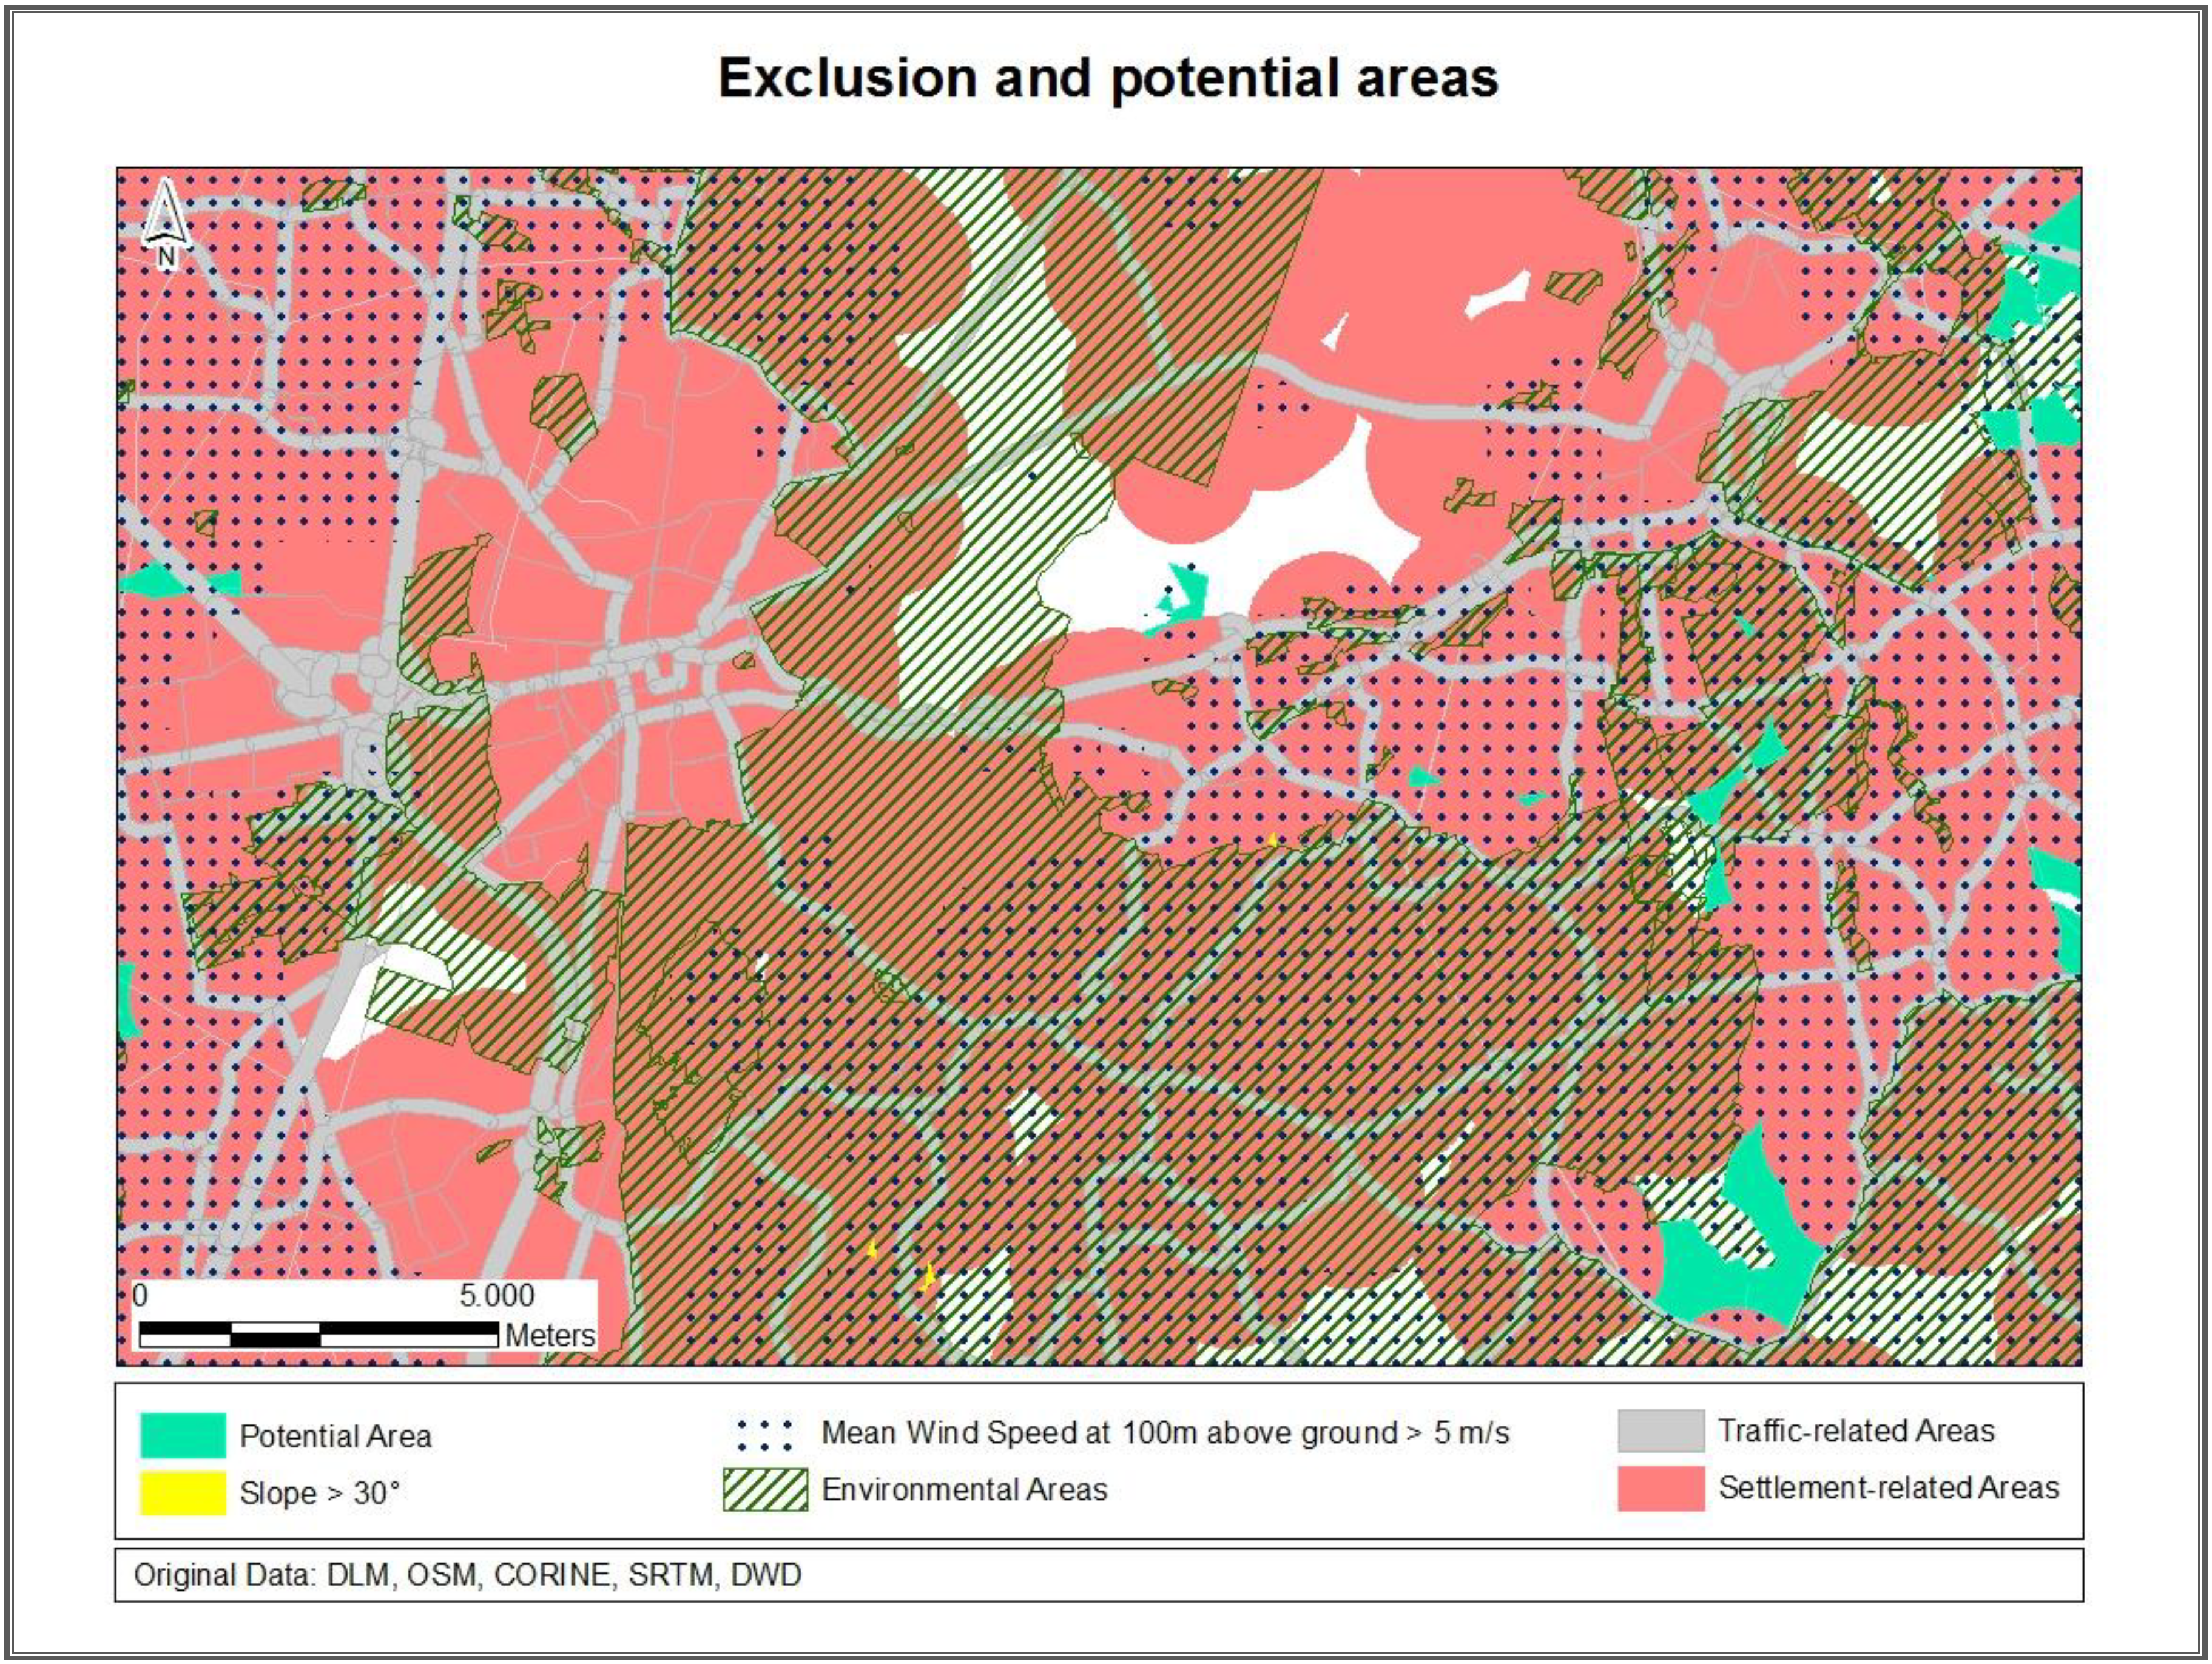
3.1. Determining Areas Suitable for Wind Energy Conversion in 2011
3.2. Scenarios on Areas Suitable for Wind Energy Conversion in 2030
3.2.1. Land Use Changes
Scenario I
Scenario II
- The demand for supra-local street networks will develop on a constantly high level as the traffic volume of motorized transportation of passengers and goods will continuously increase over the next 15 years [38].
- Areas used indirectly as traffic areas (e.g., parking lots) will not change in size until 2050.
- A multitude of roadwork projects will be implemented such as the construction of new ring roads [34].
- Land use regulations will not change in the near future [30].
Scenario III
- The establishment of intergeneration equity,
- Improvement of quality of life,
- Advancement of social cohesion and
- Consolidation of international responsibility.

| 63% of Former Increase (km2) | Annual Reduction of S&T (km2) | Annual Increase over Time (km2) | |||||||||
|---|---|---|---|---|---|---|---|---|---|---|---|
| 2012 | 2013 | 2014 | 2015 | 2016 | 2017 | 2018 | 2019 | 2020 | |||
| Baden-Wuerttemberg | 14.5 | 1.6 | 21.5 | 19.9 | 18.3 | 16.7 | 15.1 | 13.5 | 11.9 | 10.3 | 8.7 |
| Bavaria | 41.1 | 4.6 | 61.1 | 56.5 | 52.0 | 47.4 | 42.9 | 38.3 | 33.7 | 29.2 | 24.6 |
| Berlin | 0.4 | 0.0 | 0.6 | 0.5 | 0.5 | 0.5 | 0.4 | 0.4 | 0.3 | 0.3 | 0.2 |
| Brandenburg | 7.4 | 0.8 | 11.0 | 10.2 | 9.4 | 8.5 | 7.7 | 6.9 | 6.1 | 5.3 | 4.4 |
| Bremen | 0.4 | 0.1 | 0.6 | 0.6 | 0.5 | 0.5 | 0.4 | 0.4 | 0.3 | 0.3 | 0.3 |
| Hamburg | 0.1 | 0.0 | 0.1 | 0.1 | 0.1 | 0.1 | 0.1 | 0.1 | 0.1 | 0.1 | 0.1 |
| Hesse | 3.1 | 0.4 | 4.6 | 4.3 | 3.9 | 3.6 | 3.2 | 2.9 | 2.6 | 2.2 | 1.9 |
| Mecklenburg-Western Pomerania | 6.1 | 0.7 | 9.1 | 8.5 | 7.8 | 7.1 | 6.4 | 5.7 | 5.0 | 4.4 | 3.7 |
| Lower Saxony | 33.8 | 3.8 | 50.3 | 46.6 | 42.8 | 39.1 | 35.3 | 31.6 | 27.8 | 24.0 | 20.3 |
| North Rhine-Westphalia | 22.8 | 2.5 | 34.0 | 31.4 | 28.9 | 26.3 | 23.8 | 21.3 | 18.7 | 16.2 | 13.7 |
| Rhineland-Palatinate | 2.3 | 0.3 | 3.4 | 3.2 | 2.9 | 2.7 | 2.4 | 2.2 | 1.9 | 1.6 | 1.4 |
| Saarland | 1.1 | 0.1 | 1.6 | 1.5 | 1.4 | 1.2 | 1.1 | 1.0 | 0.9 | 0.8 | 0.6 |
| Saxony | 13.7 | 1.5 | 20.4 | 18.9 | 17.4 | 15.9 | 14.3 | 12.8 | 11.3 | 9.8 | 8.2 |
| Saxony-Anhalt | 13.4 | 1.5 | 19.9 | 18.4 | 16.9 | 15.4 | 14.0 | 12.5 | 11.0 | 9.5 | 8.0 |
| Schleswig-Holstein | 10.9 | 1.2 | 16.2 | 15.0 | 13.8 | 12.6 | 11.4 | 10.2 | 9.0 | 7.7 | 6.5 |
| Thuringia | 11.7 | 1.3 | 17.4 | 16.1 | 14.8 | 13.5 | 12.2 | 10.9 | 9.6 | 8.3 | 7.0 |
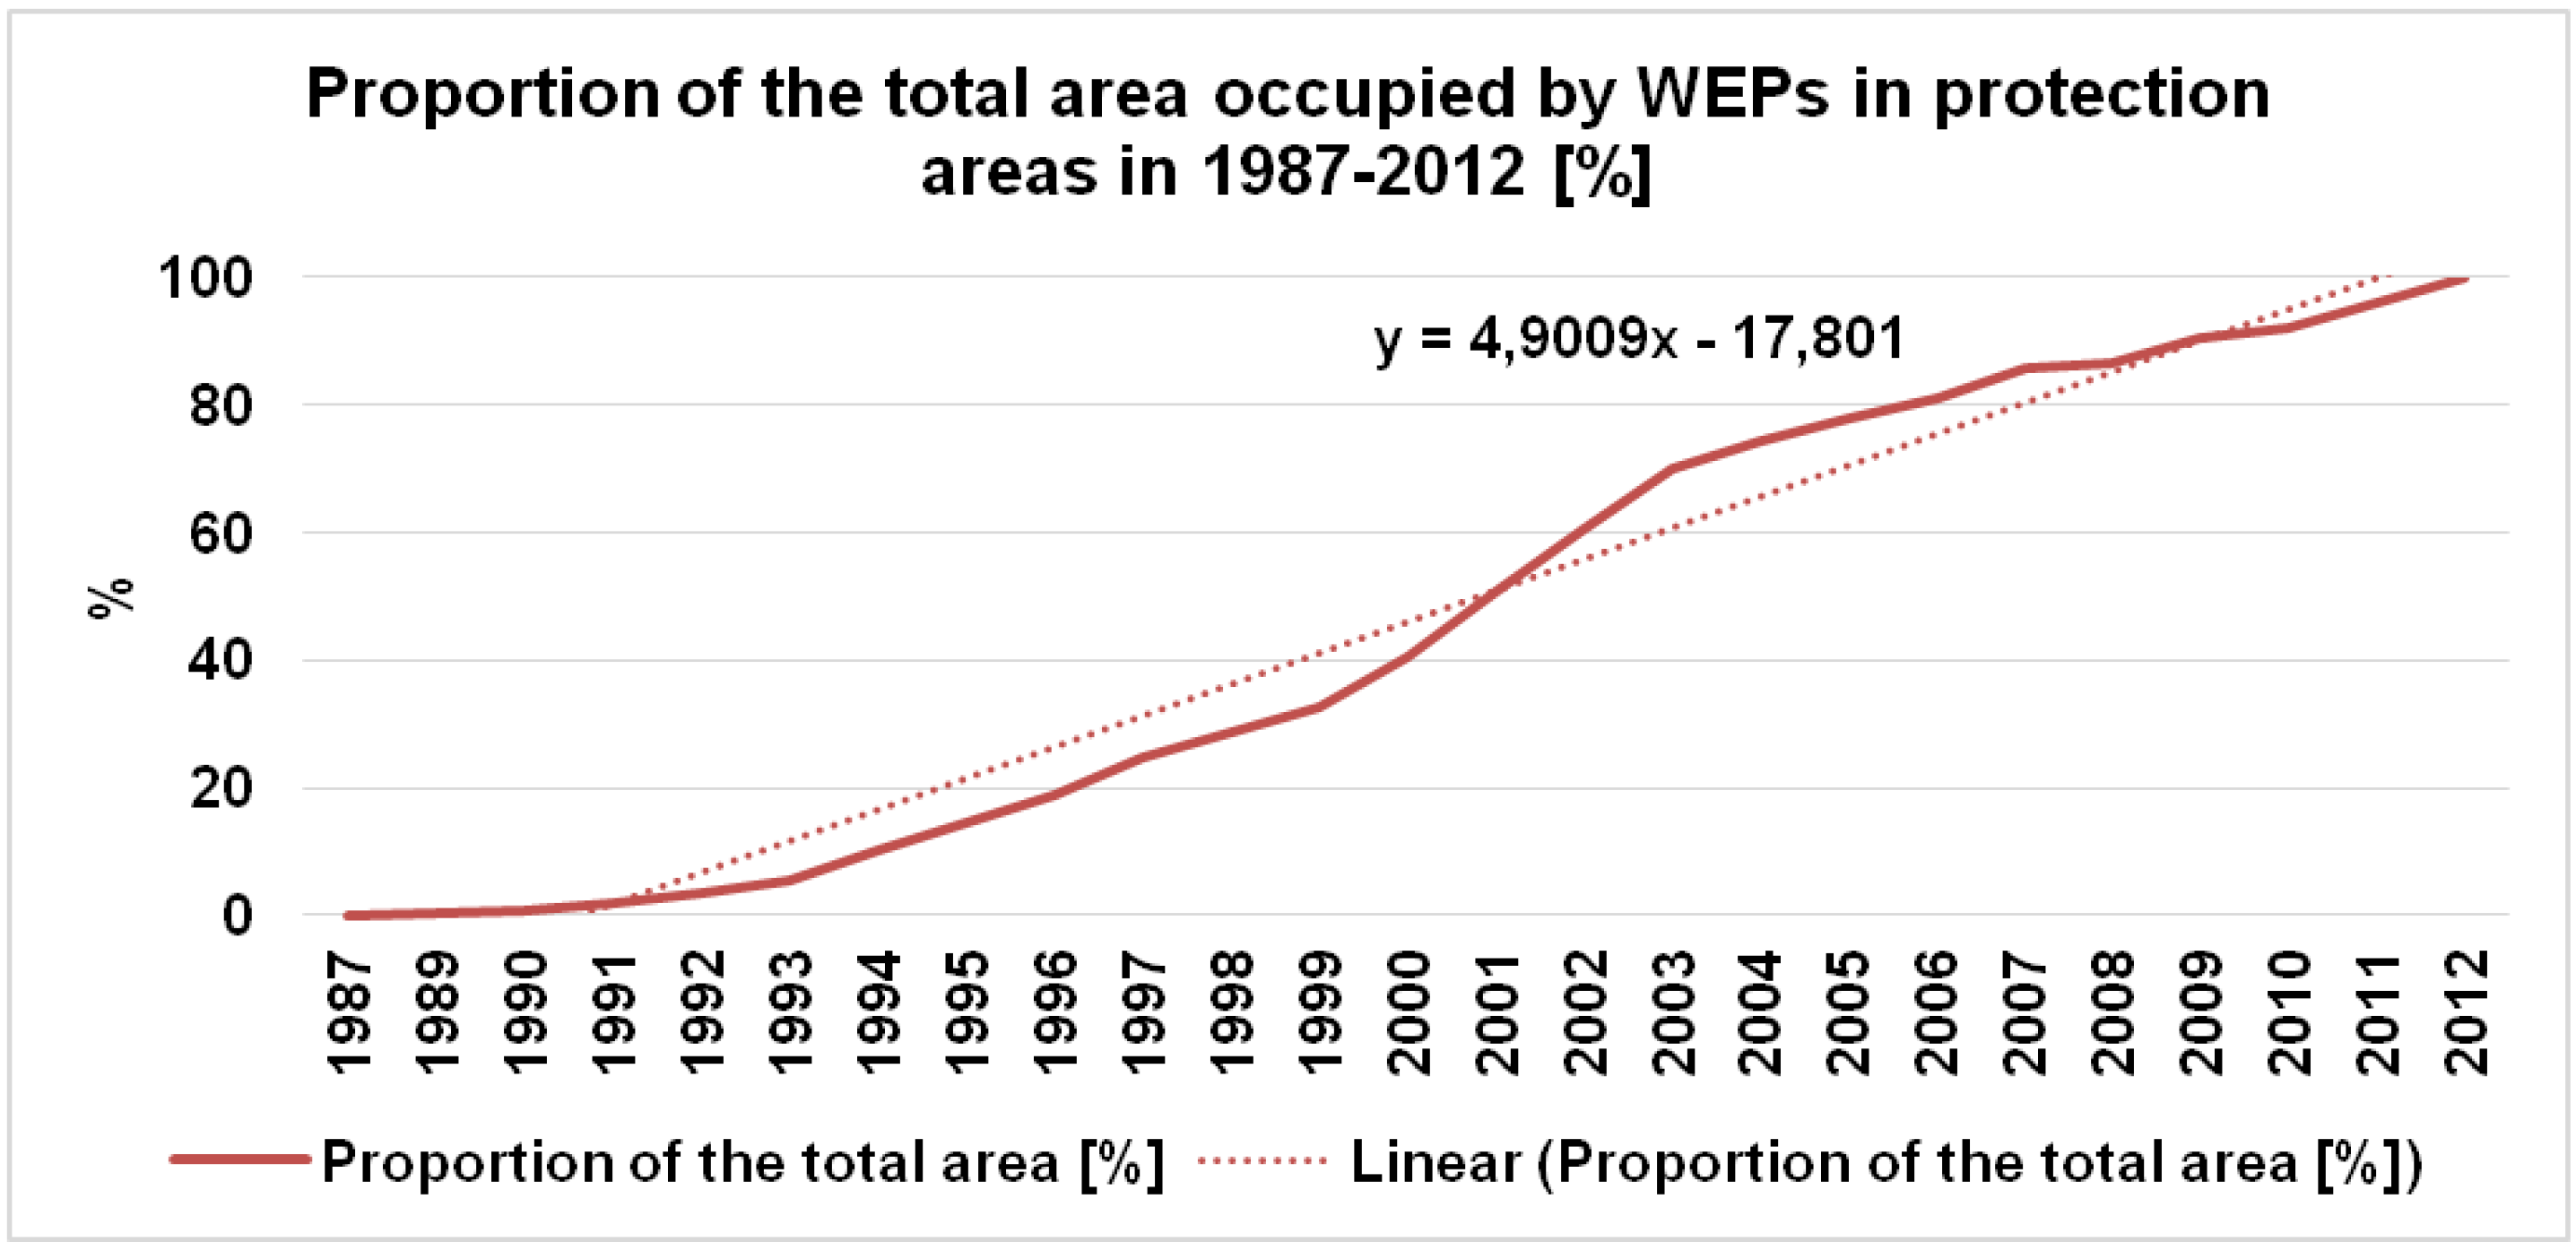
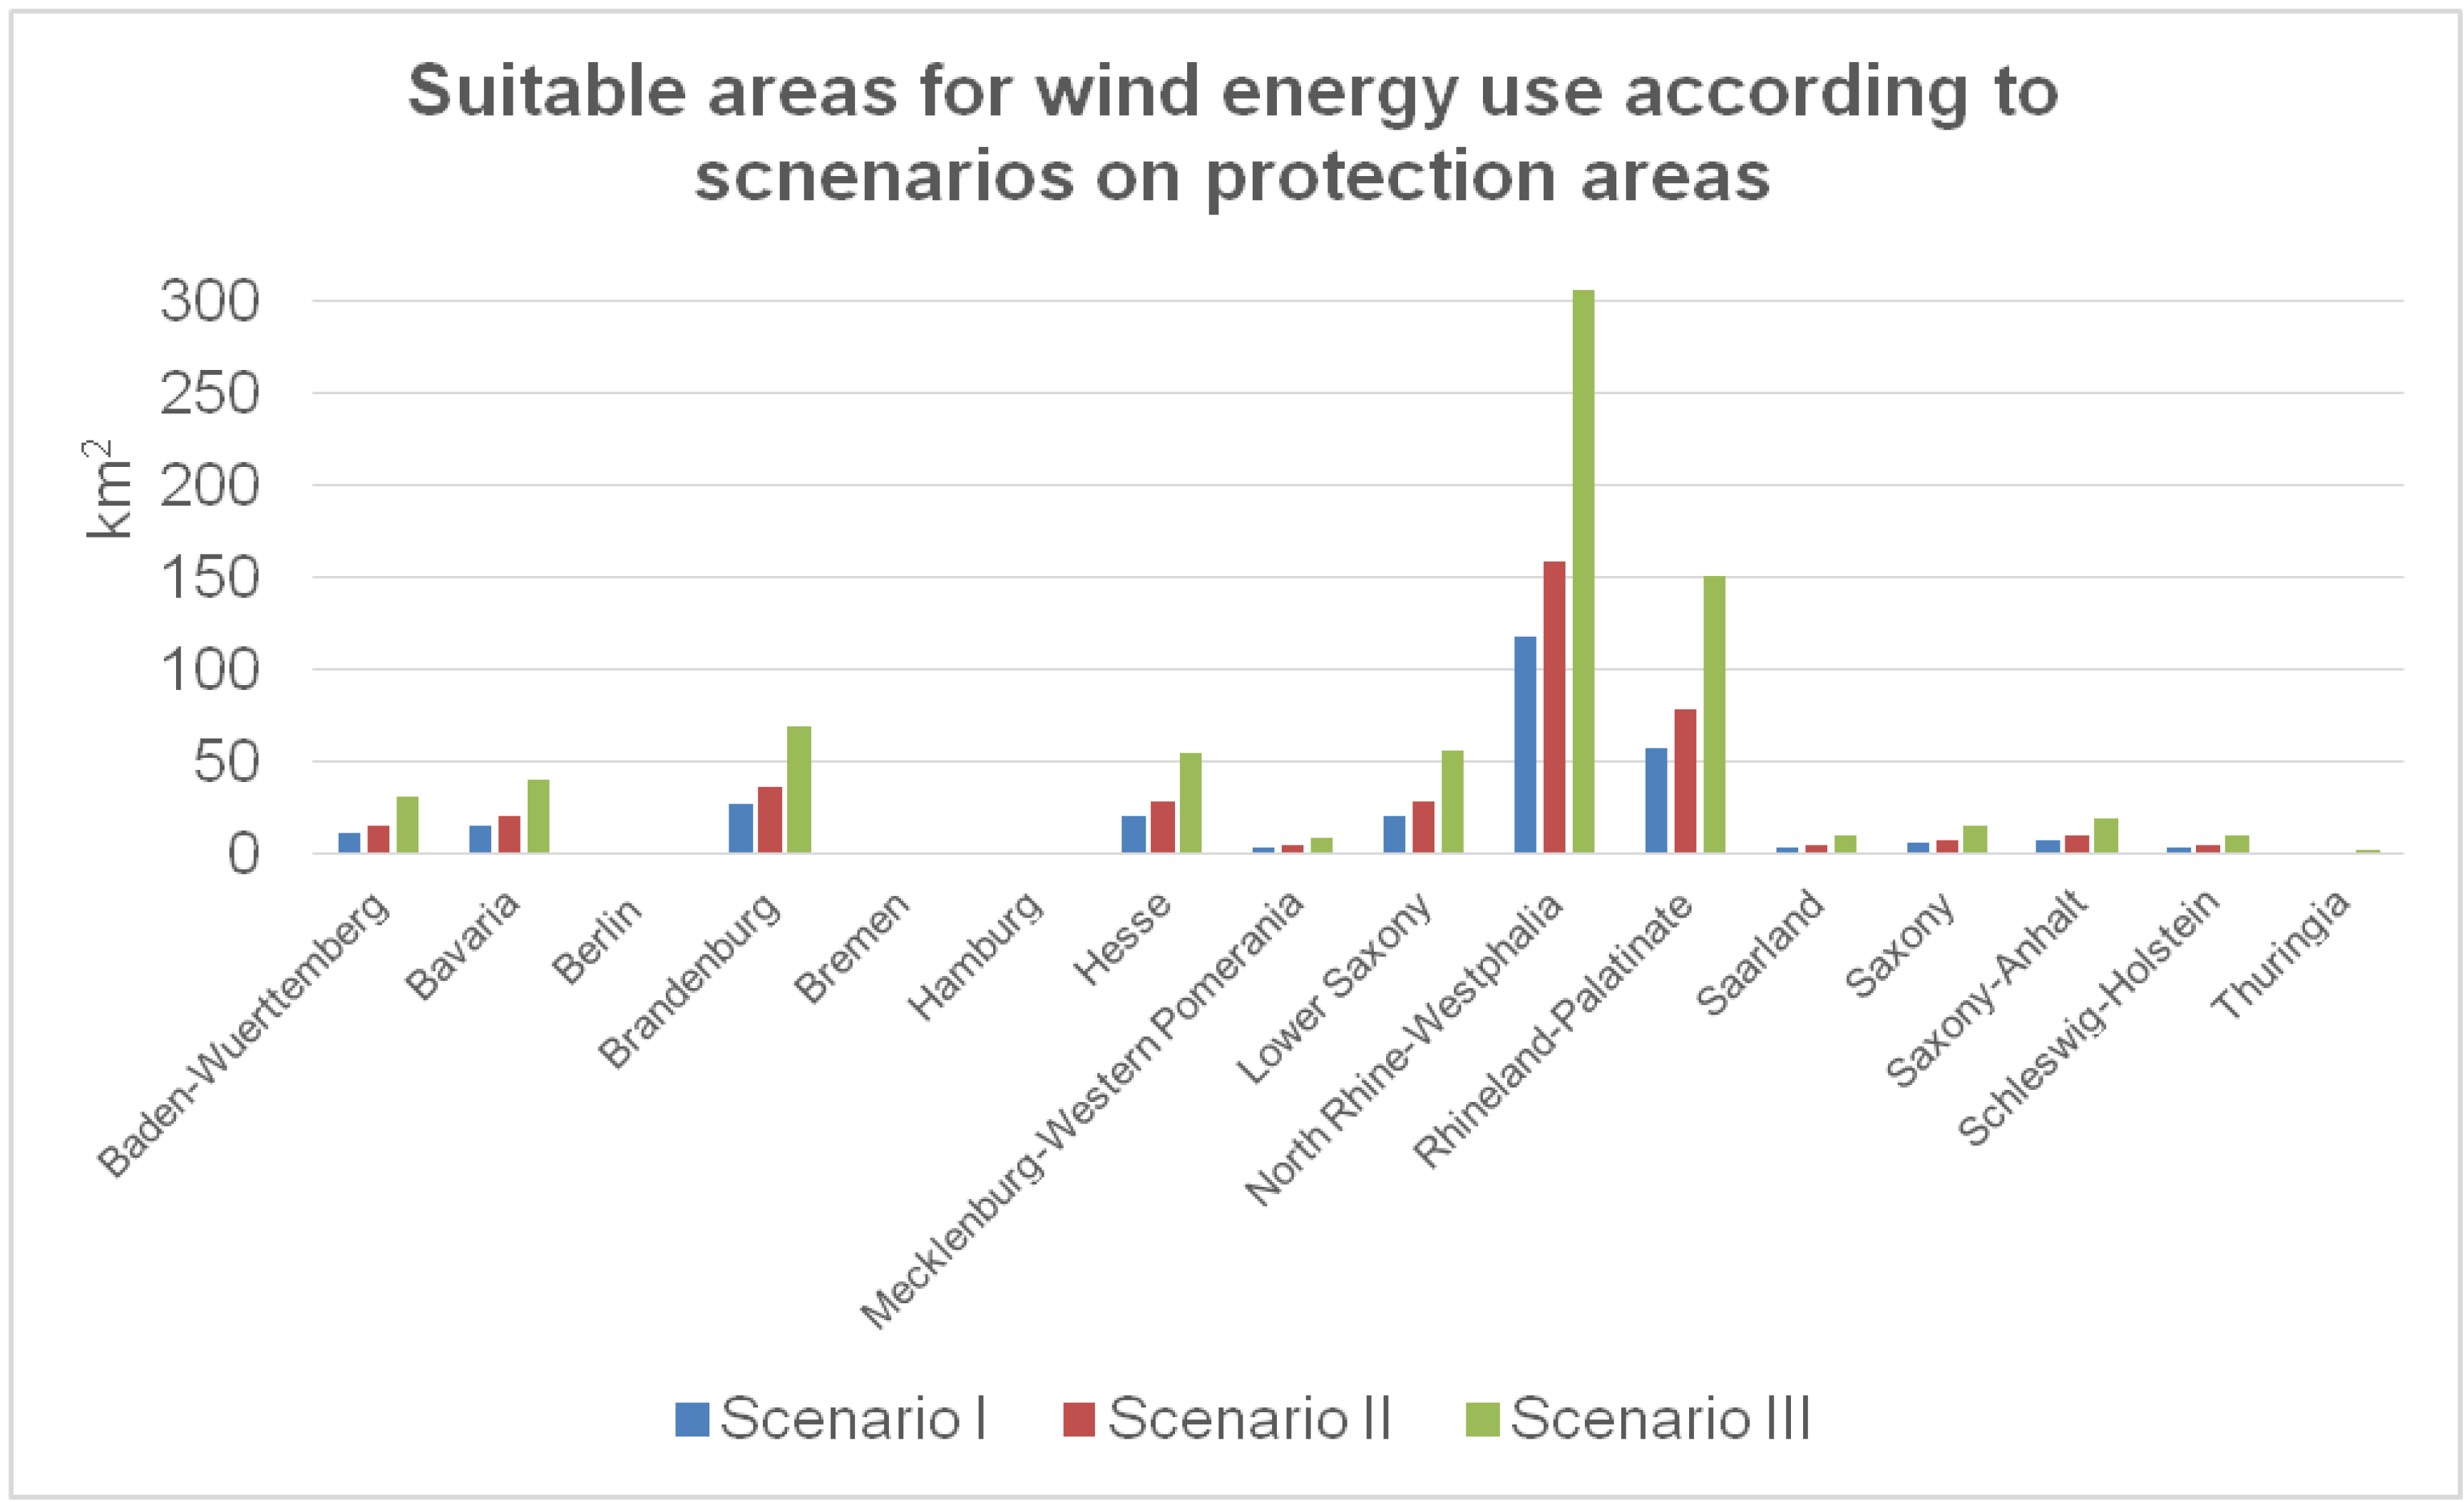
3.2.2. Protection Areas
Scenario I
Scenario II

Scenario III
4. Results
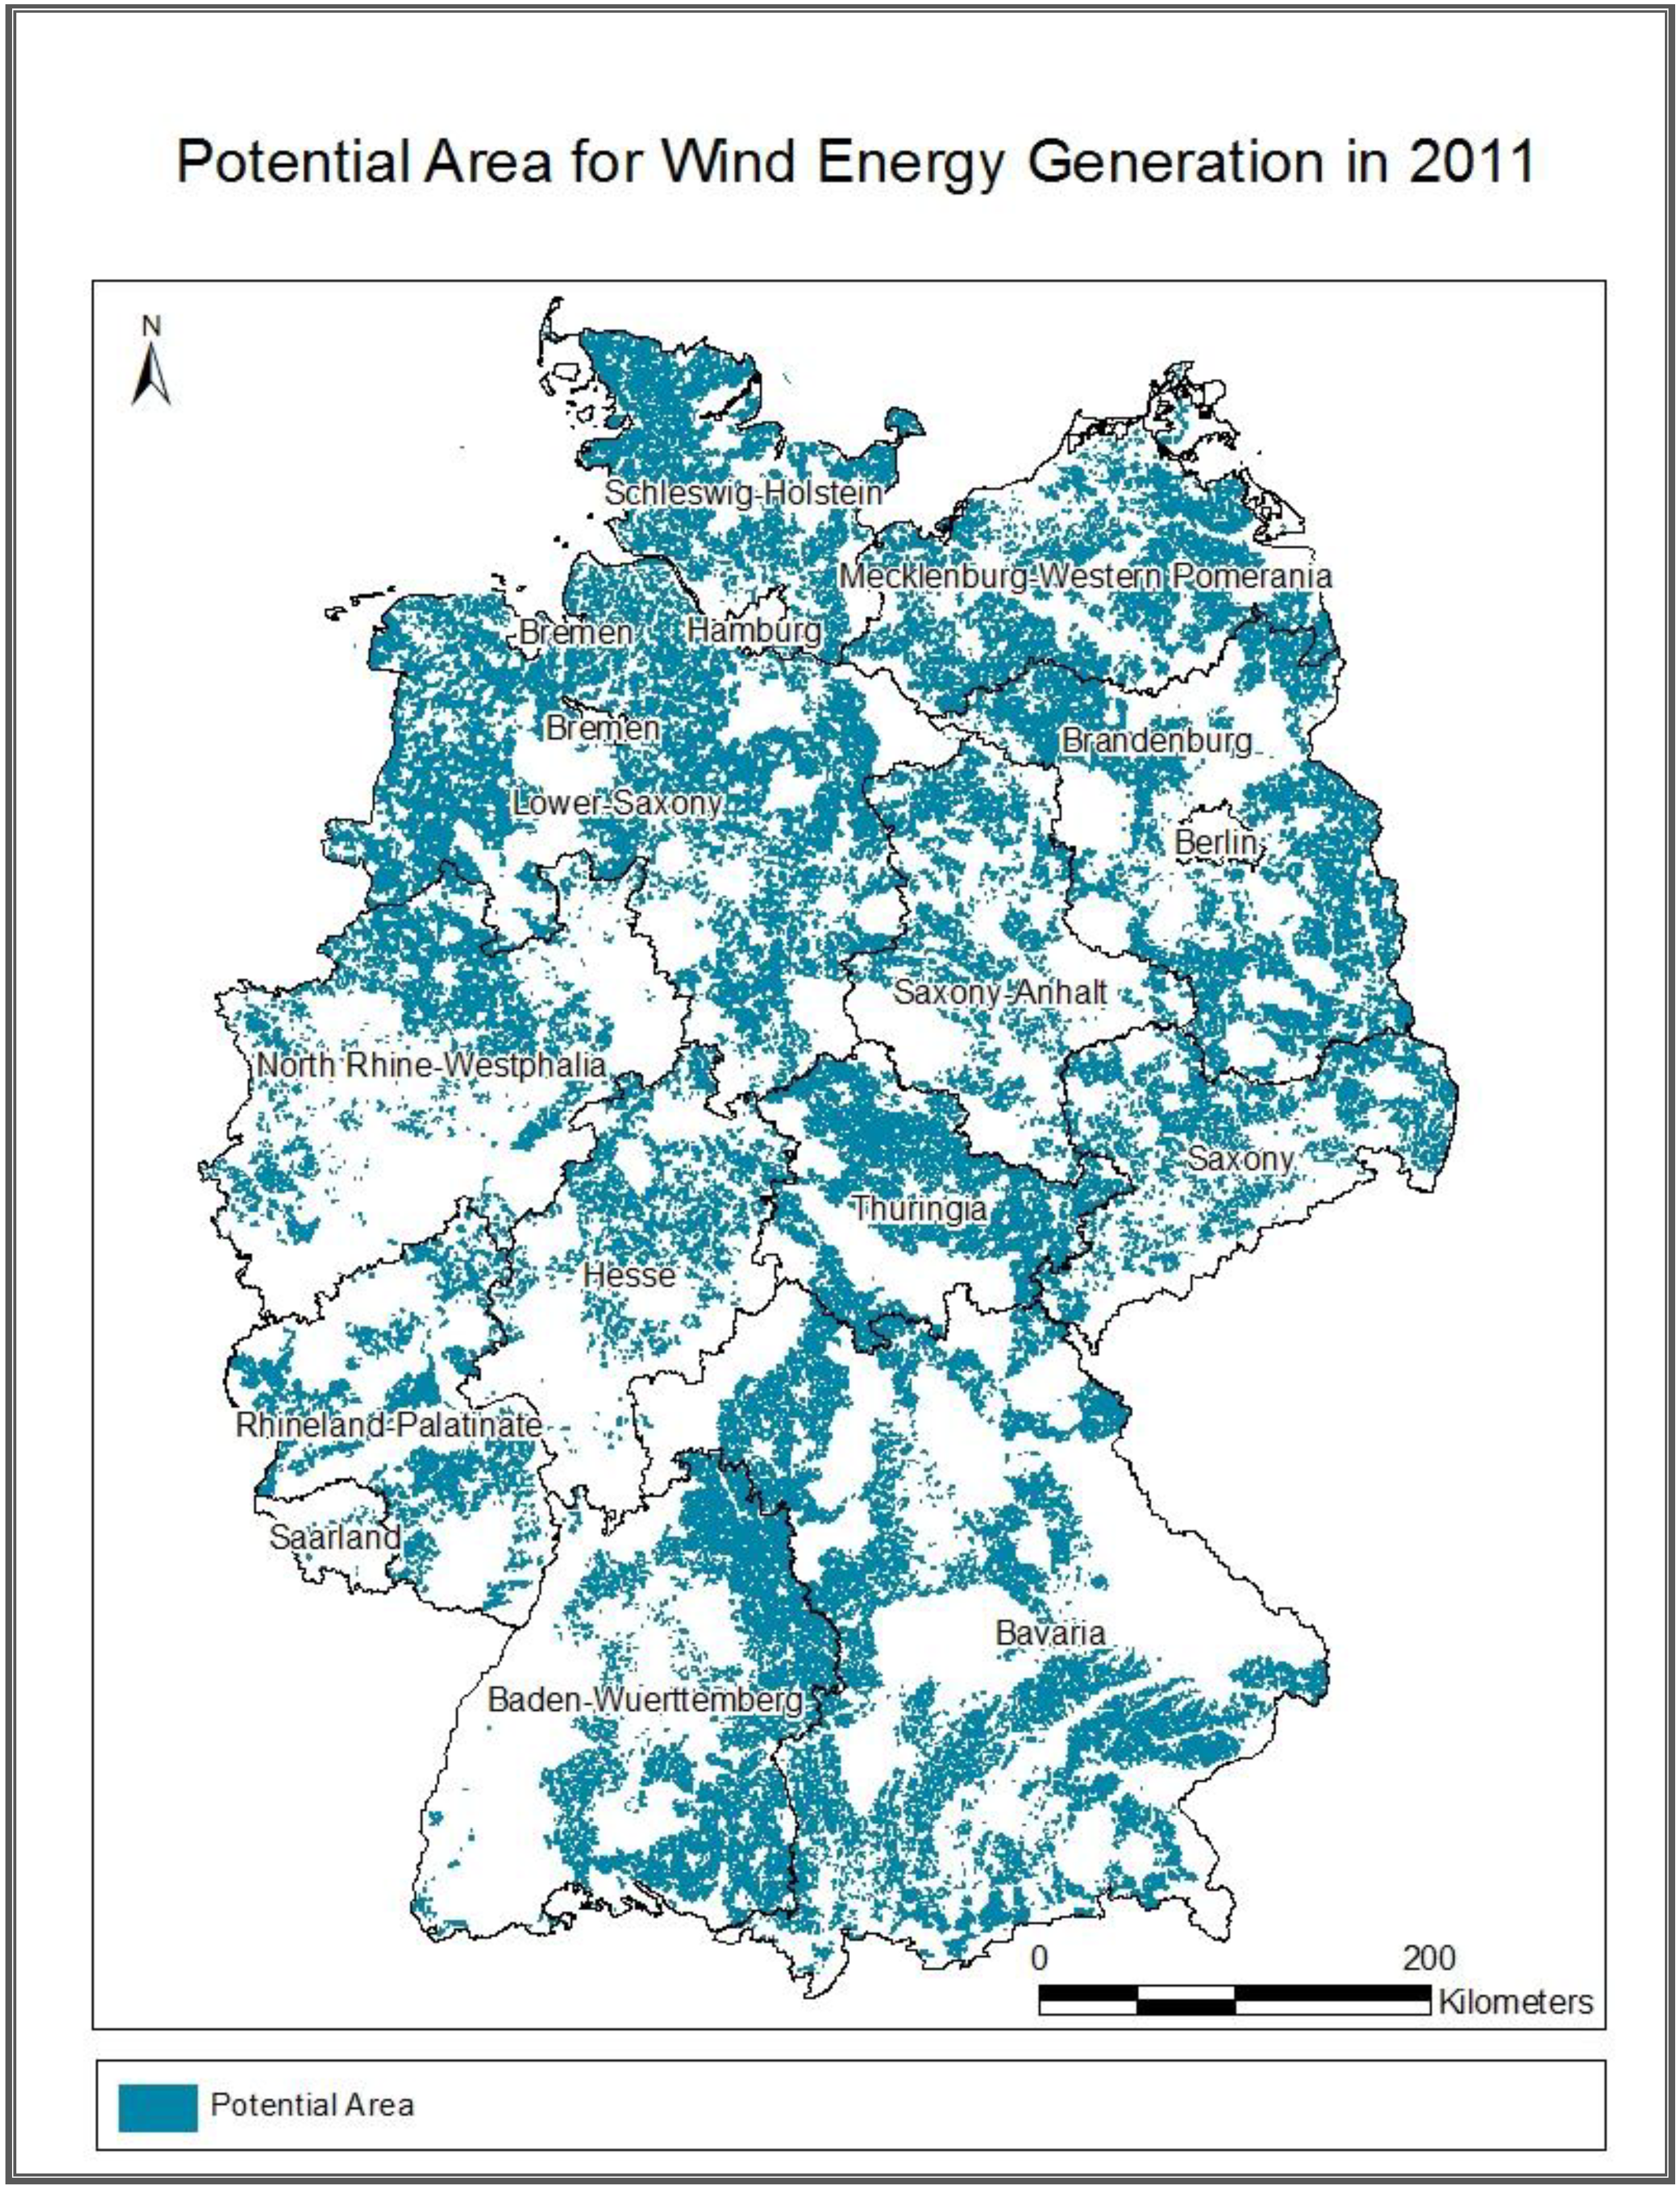
4.1. Resulting Areas Suitable for Wind Energy Conversion in 2011
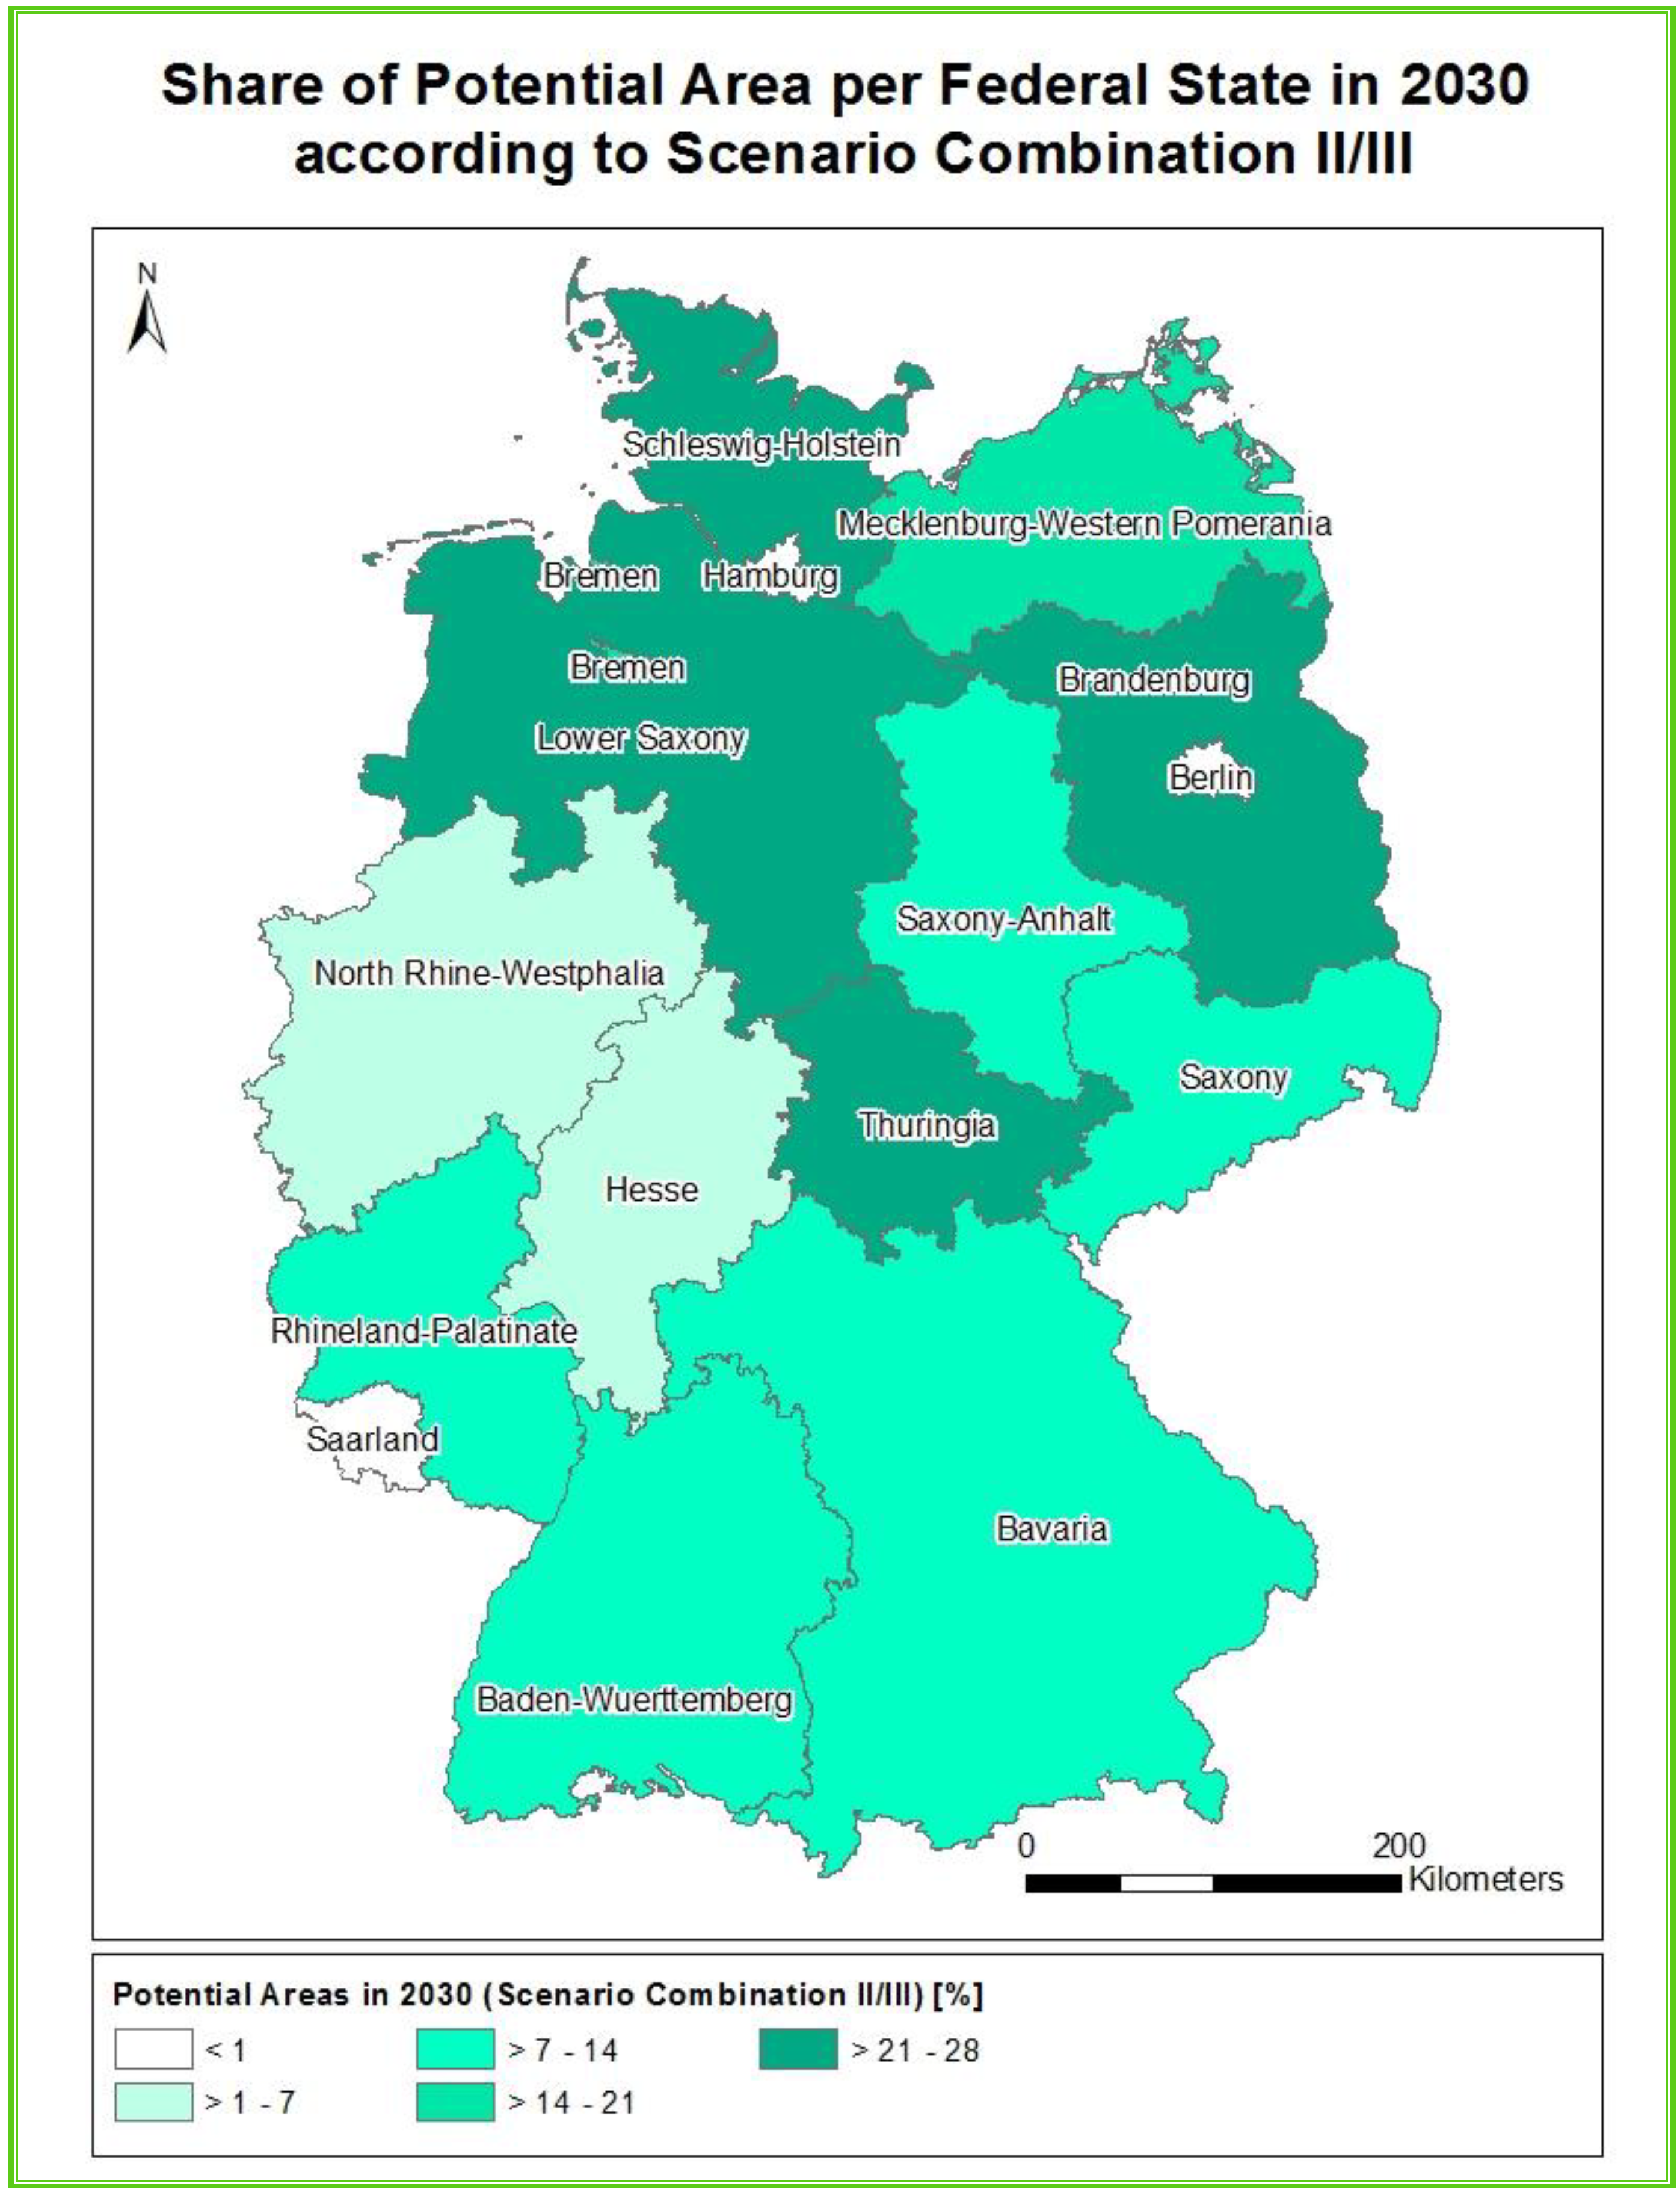
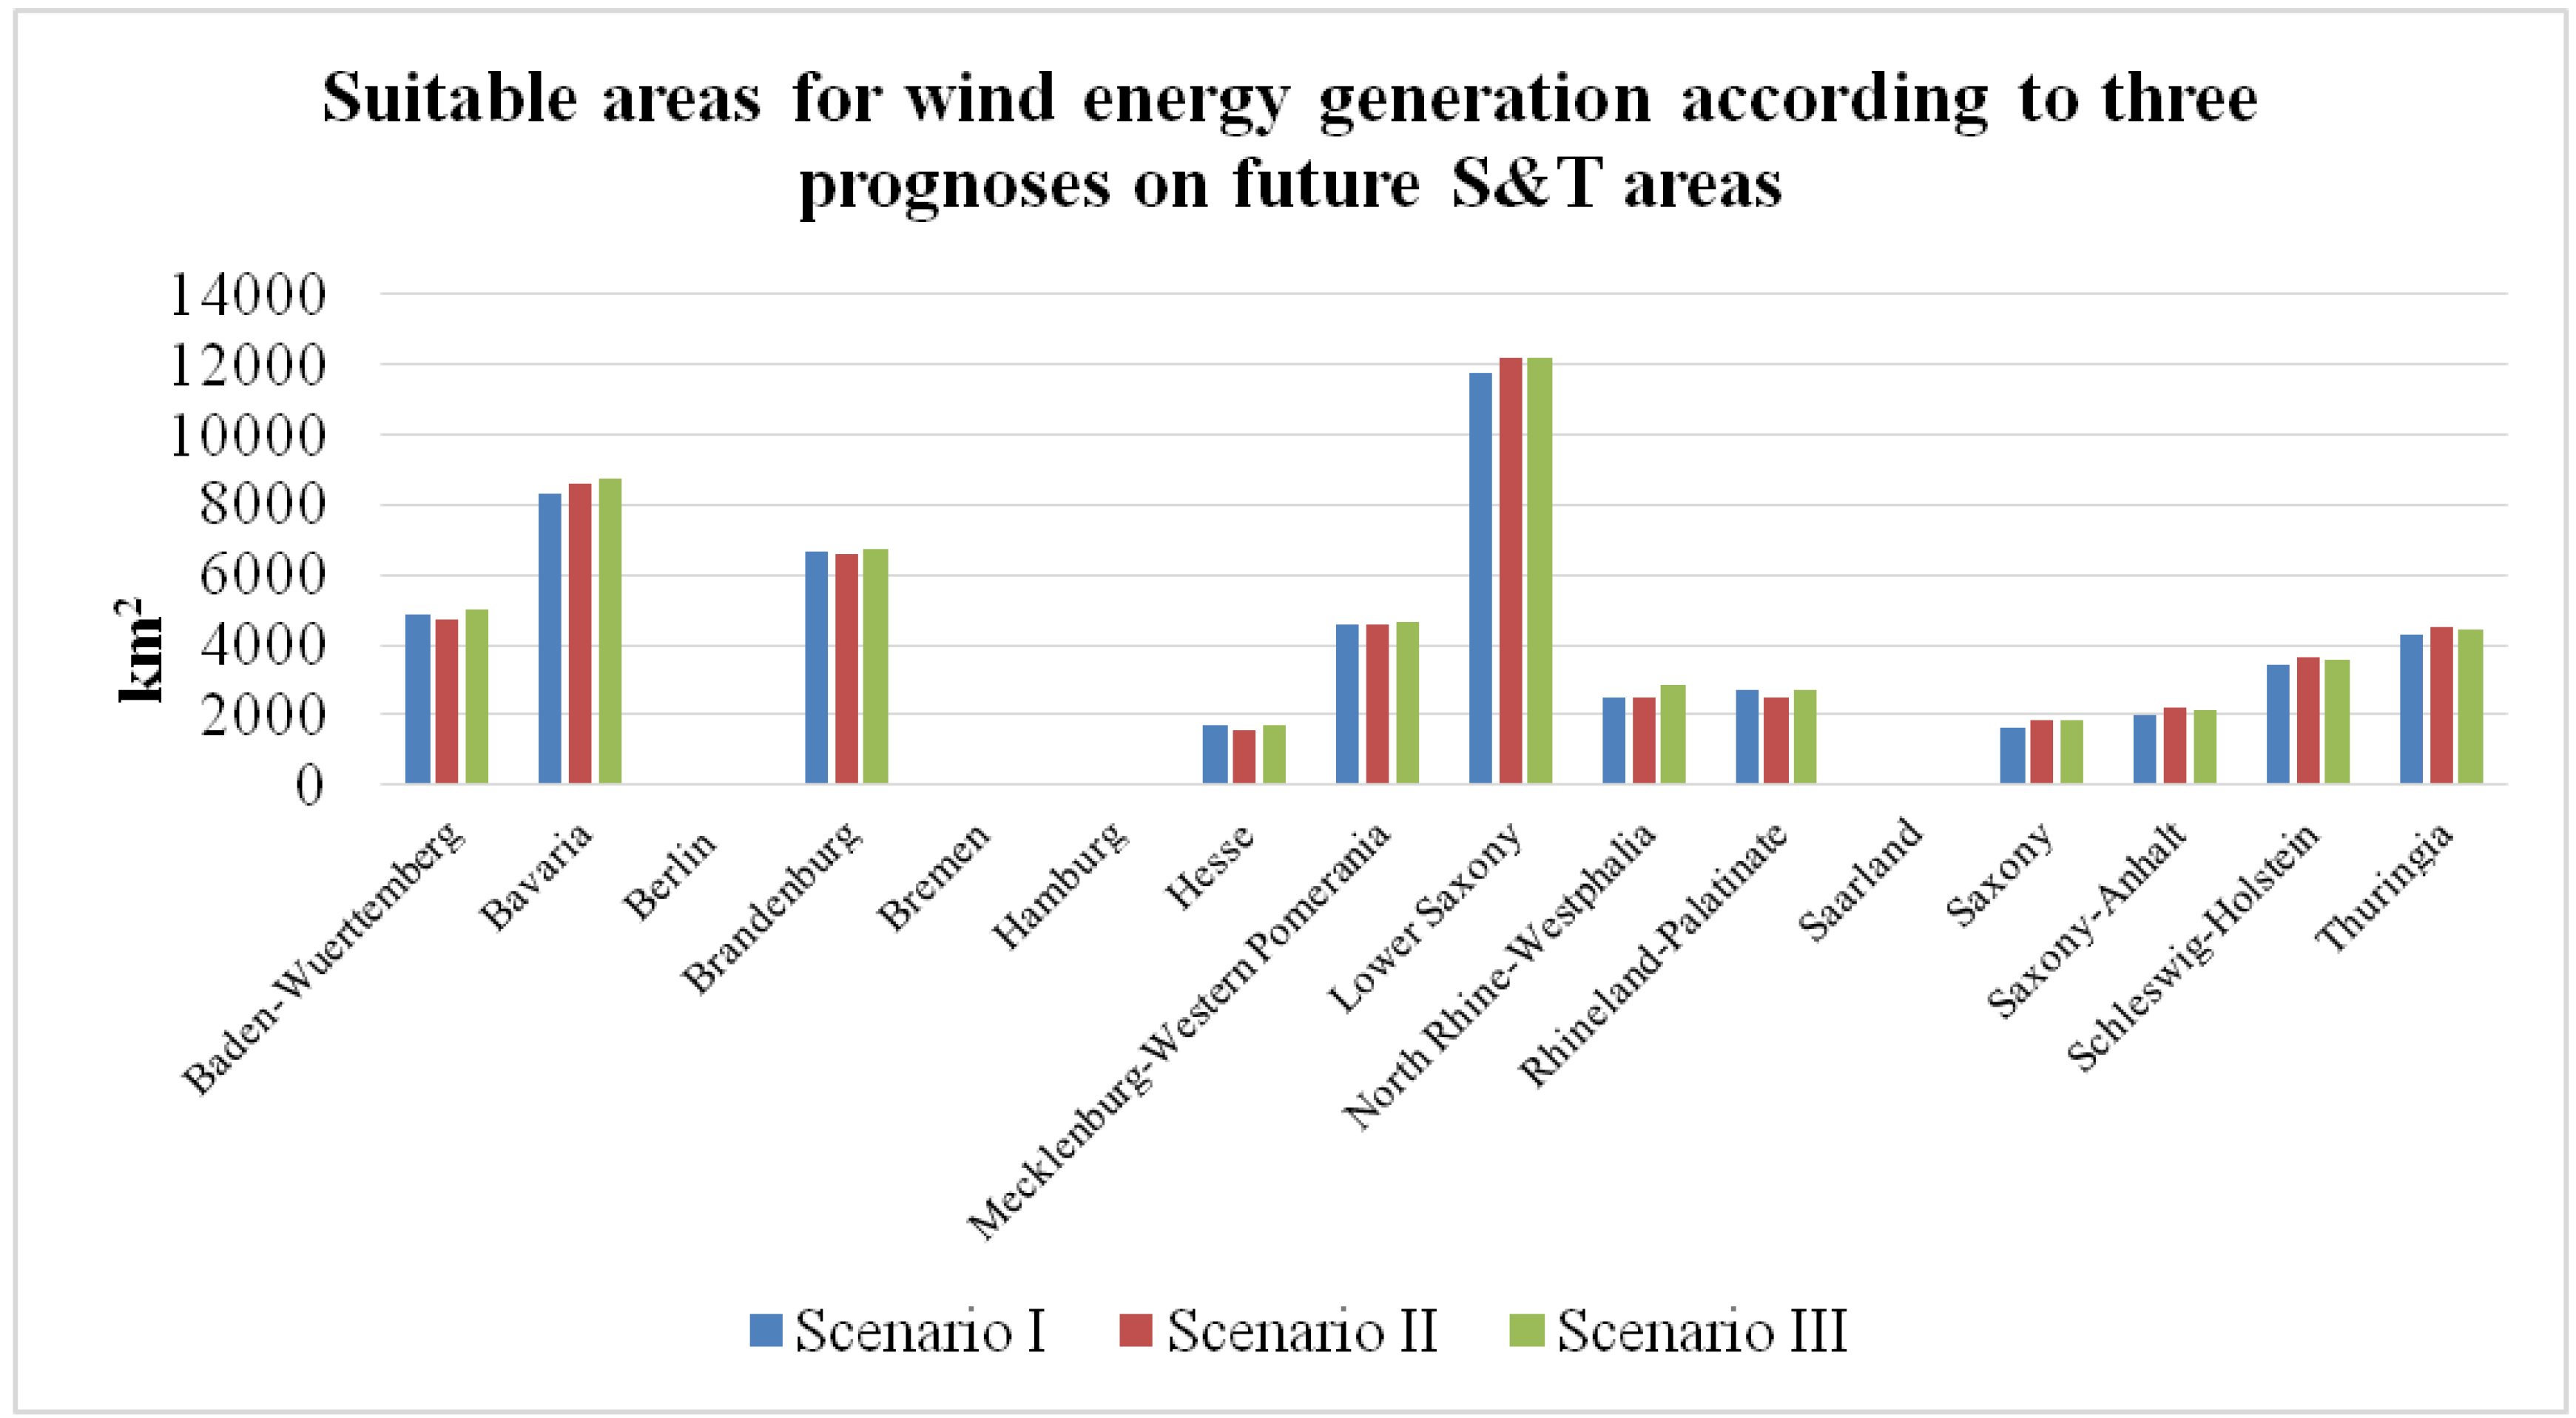
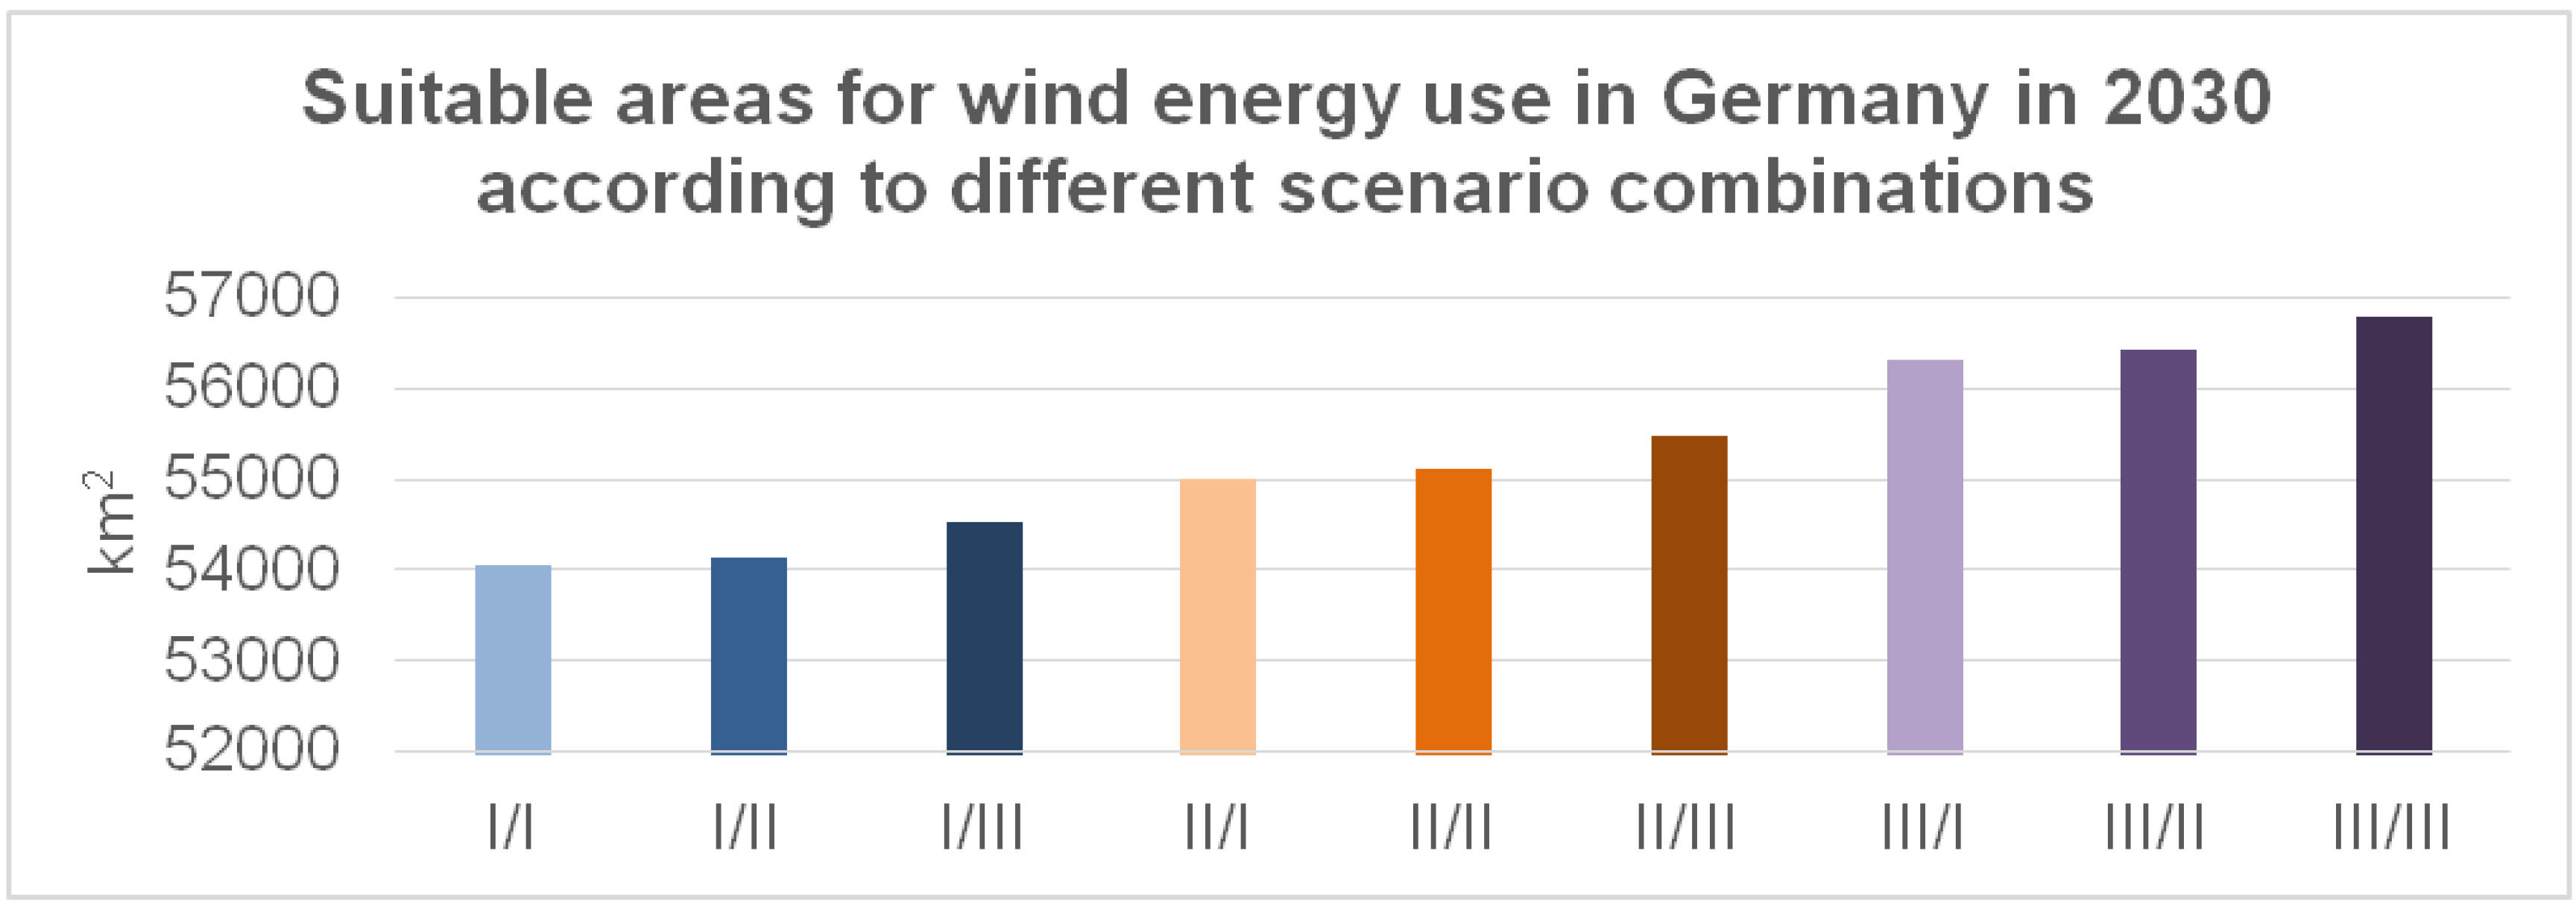
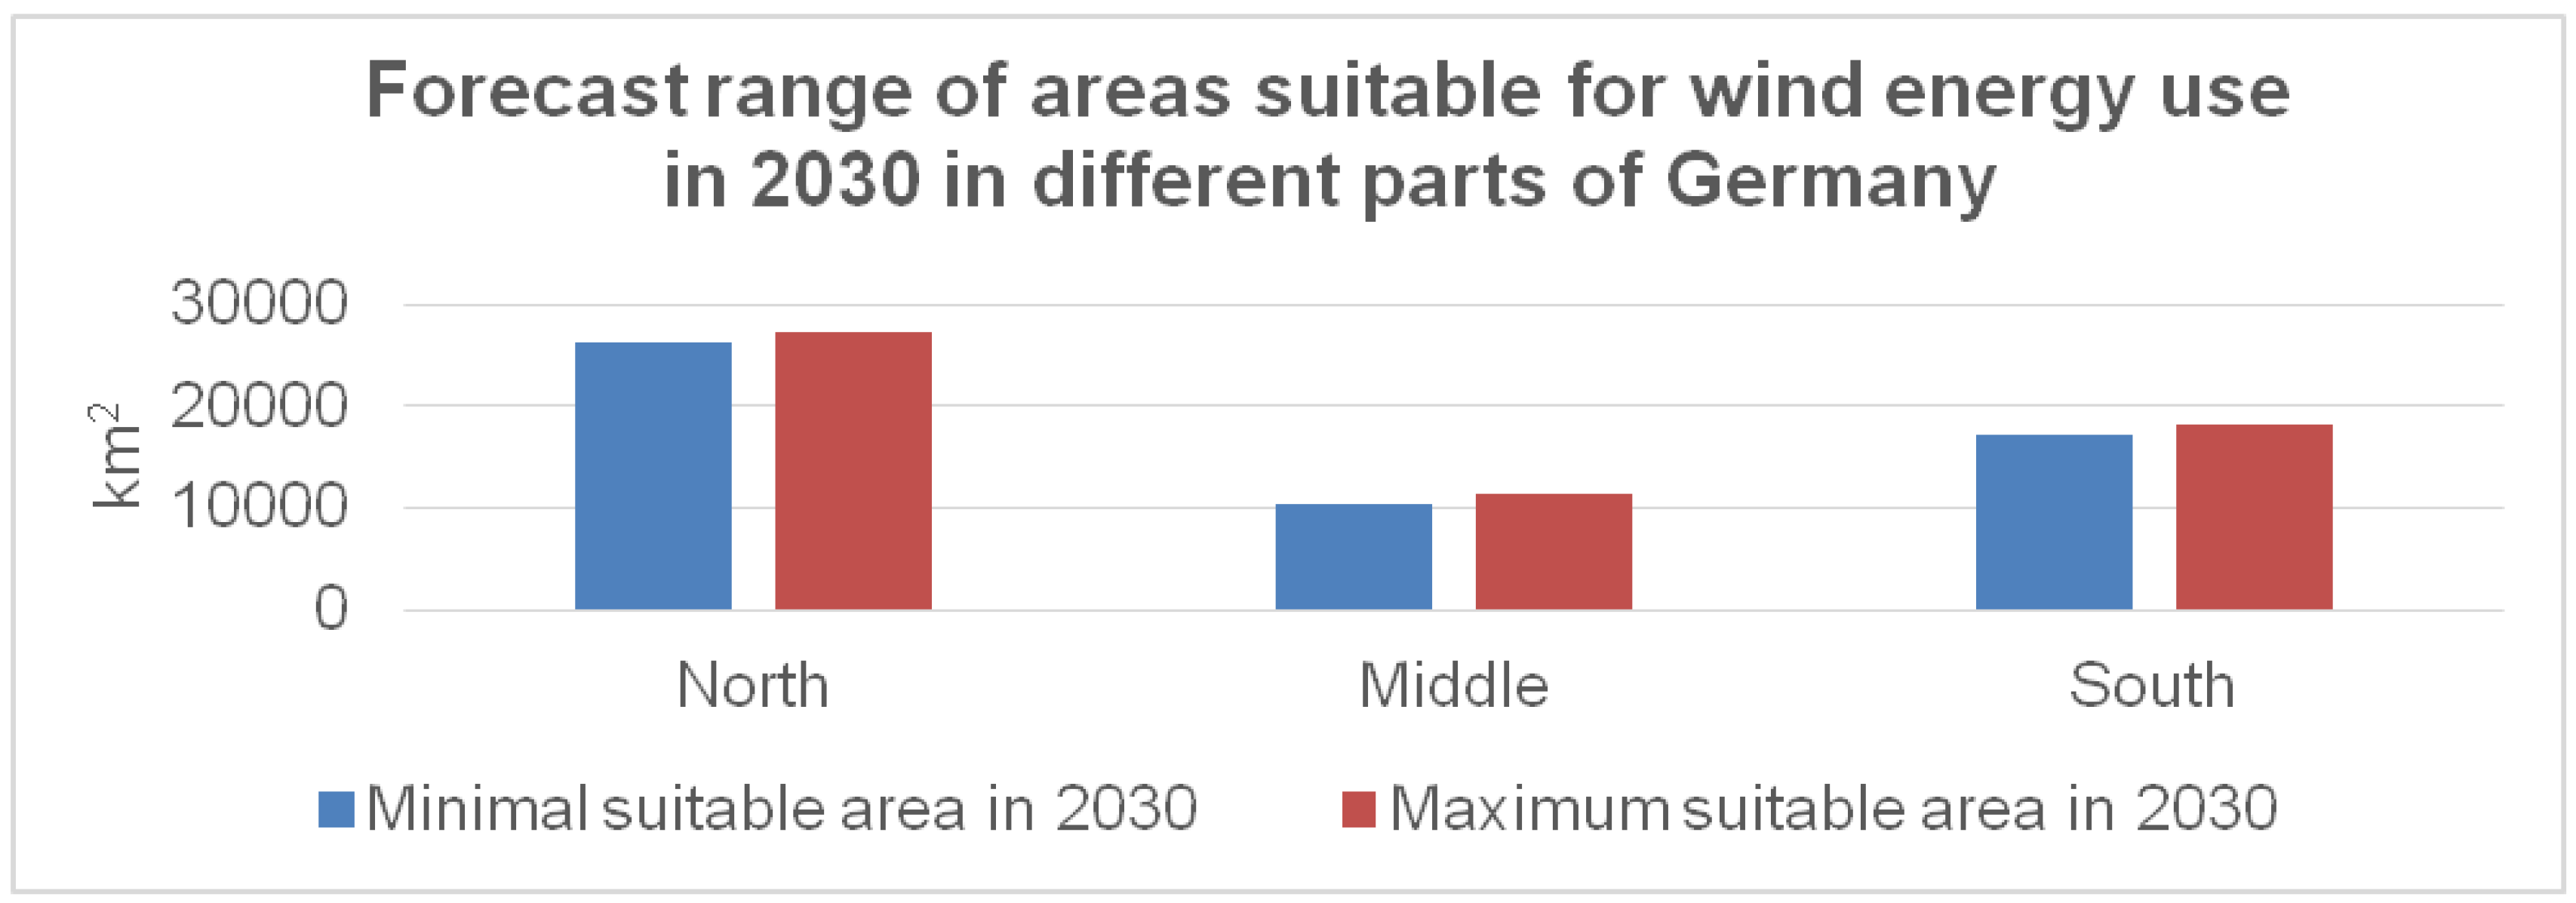
4.2. Resulting Areas Suitable for Wind Energy Conversion in 2030


5. Discussion and Limitations
5.1. Discussion on the Determined Potential Areas of 2011
| Basic Data | Advantage | Disadvantage |
|---|---|---|
| DLM 250 |
|
|
| CORINE |
|
|
| Mean Wind Speed |
|
|
5.2. Discussion on the Determined Potential Areas of 2030
6. Conclusions
Acknowledgments
Author Contributions
Conflicts of Interest
References and Notes
- Islam, M.R.; Mekhilef, S.; Saidur, R. Progress and recent trends of wind energy technology. Renew. Sustain. Energy Rev. 2013, 21, 456–468. [Google Scholar] [CrossRef]
- Wittneben, B.B. The impact of the Fukushima nuclear accident on European energy policy. Environ. Sci. Policy 2012, 15, 1–3. [Google Scholar] [CrossRef]
- Jahn, D.; Korolczuk, S. German exceptionalism: The end of nuclear energy in Germany! Environ. Polit. 2012, 21, 159–164. [Google Scholar] [CrossRef]
- Appelrath, H.-J.; Kagermann, H.; Mayer, C. (Eds.) Future Energy Grid. Migration to the Internet of Energy; Acatech: Munich, Germany, 2012.
- Resch, B.; Sagl, G.; Toernros, T.; Bachmaier, A.; Eggers, J.-B.; Herkel, S.; Narmsara, S.; Guendra, H. GIS-based planning and modelling for renewable energy: Challenges and future research avenues. ISPRS Int. J. Geo-Inf. 2014, 3, 662–692. [Google Scholar] [CrossRef]
- Scheer, H. The Solar Economy: Renewable Energy for a Sustainable Global Future; Routledge: Oxford, UK, 2013. [Google Scholar]
- Böhme, D.; Dürrschmidt, W. Erneuerbare Energien: Motor der Energiewende; Bundesministerium für Umwelt, Naturschutz und Reaktorsicherheit (BMU): Berlin, Germany, 2012. [Google Scholar]
- Fairley, P. Germany jump-starts the supergrid. IEEE Spectr. 2013, 50, 36–41. [Google Scholar] [CrossRef]
- Angelis-Dimakis, A.; Biberacher, M.; Dominguez, J.; Fiorese, G.; Gadocha, S.; Gnansounou, E.; Guariso, G.; Kartalidis, A.; Panichelli, L.; Pinedo, I.; et al. Methods and tools to evaluate the availability of renewable energy sources. Renew. Sustain. Energy Rev. 2011, 15, 1182–1200. [Google Scholar] [CrossRef]
- Swofford, J.; Slattery, M. Public attitudes of wind energy in Texas: Local communities in close proximity to wind farms and their effect on decision-making. Energy Policy 2010, 38, 2508–2519. [Google Scholar] [CrossRef]
- Shen, Y.C.; Chou, C.J.; Lin, G.T. The portfolio of renewable energy sources for achieving the three E-Policy goals. Energy 2011, 36, 2589–2598. [Google Scholar] [CrossRef]
- Lüdkehus, I.; Salecker, H.; Adlunger, K. Potenzial der Windenergie an Land: Studie zur Ermittlung des Bundesweiten Flächen- und Leistungspotenzials der Windenergienutzung an Land; Umweltbundesamt: Dessau-Roßlau, Germany, 2013. [Google Scholar]
- Bofinger, S.; Callies, D.; Scheibe, M.; Saint-Drenan, Y.-M.; Rohrig, K. Studie zum Potenzial der Windenergienutzung an Land—Kurzfassung; Fraunhofer Institut für Windenergie und Energiesystemtechnik Abteilung Energiewirtschaft und Netzbetrieb, Bundesverband Wind-Energie e.V.: Berlin, Germany, 2011. [Google Scholar]
- Institut für angewandtes Stoffstrommanagement (IfaS) & Transferstelle Bingen (TSB). Integriertes Klimaschutzkonzept und Teilkonzept Erschließung der verfügbaren Erneuerbare-Energien-Potenziale in den Landkreisen Alzey-Worms, Bad Kreuznach und Mainz-Bingen, Abschlussbericht; Kreisverwaltung Alzey-Worms; Kreisverwaltung Mainz-Bingen, Energiedienstleistungsgesellschaft Rheinhessen-Nahe mbH: Birkenfeld, Germany, 2013. [Google Scholar]
- Jackson, A.L. Renewable energy vs. biodiversity: Policy conflicts and the future of nature conservation. Glob. Environ. Chang. 2011, 21, 1195–1208. [Google Scholar] [CrossRef]
- Bundesministerium für Umwelt, Naturschutz und Reaktorsicherheit (BMU). Überblick zu den landesplanerischen Abstandsempfehlungen für die Regionalplanung zur Ausweisung von Windenergiegebieten. Available online: http://www.erneuerbare-energien.de (accessed on 28 November 2013).
- Frenz, W.; Müggenborg, H.-J. (Eds.) BNatSchG: Bundesnaturschutzgesetz: Kommentar; Erich Schmidt: Berlin, Germany, 2011.
- Fridolfsson, S.O.; Tangerås, T.P. A reexamination of renewable electricity policy in Sweden. Energy Policy 2013, 58, 57–63. [Google Scholar] [CrossRef]
- Abu Hamed, T.; Flamm, H.; Azraq, M. Renewable energy in the Palestinian Territories: Opportunities and challenges. Renew. Sustain. Energy Rev. 2012, 16, 1082–1088. [Google Scholar] [CrossRef]
- Palaiologou, P.; Kalabokidis, K.; Haralambopoulos, D.; Feidas, H.; Polatidis, H. Wind characteristics and mapping for power production in the island of Lesvos, Greece. Comput. Geosci. 2011, 37, 962–972. [Google Scholar] [CrossRef]
- Deutsche Energie-Agentur (DENA). Dena-Netzstudie II. Integration erneuerbarer Energien in die deutsche Stromversorgung im Zeitraum 2015–2020 mit Ausblick 2025; DENA: Berlin, Germany, 2010. [Google Scholar]
- Bergek, A. Levelling the playing field? The influence of national wind power planning instruments on conflicts of interests in a Swedish County. Energy Policy 2010, 38, 2357–2369. [Google Scholar] [CrossRef]
- McKenna, R.; Gantenbein, S.; Fichtner, W. Determination of cost-potential-curves for wind energy in the German federal state of Baden-Württemberg. Energy Policy 2013, 57, 194–203. [Google Scholar] [CrossRef]
- Wallasch, A.-K.; Rehfeldt, K. Wirtschaftlichkeit von Standorten für die Windenergienutzung: Untersuchung der Wesentlichen Einflussparameter; Deutsche WindGuard: Berlin, Germany, 2012. [Google Scholar]
- De Vried, B.J.M.; van Vuuren, D.P.; Hoogwijk, M.M. Renewable energy sources: Their global potential for the first-half of the 21st century at a global level: An integrated approach. Energy Policy 2007, 35, 2590–2610. [Google Scholar] [CrossRef]
- Resch, G.; Held, A.; Faber, T.; Panzer, C.; Toro, F.; Haas, R. Potentials and prospects for renewable energies at global scale. Energy Policy 2008, 36, 4048–4056. [Google Scholar] [CrossRef]
- Xia, C.; Song, Z. Wind energy in China: Current scenarios and future perspectives. Renew. Sustain. Energy Rev. 2009, 13, 1966–1974. [Google Scholar] [CrossRef]
- Statistisches Bundesamt (DESTATIS). Available online: https://www.destatis.de/DE/Service/Glossar/S/Siedlungsflaeche.html (accessed on 19 November 2013).
- Hoymann, J.; Dosch, F.; Beckmann, G. Trends der Siedlungsflächenentwicklung: Status Quo und Projektion 2030; Bundesinstitut für Bau-, Stadt- und Raumforschung (BBSR): Bonn, Germany, 2012. [Google Scholar]
- Dosch, F.; Beckmann, G. Auf dem Weg, aber noch nicht am Ziel: Trends der Siedlungsflächenentwicklung; Bundesinstitut für Bau-, Stadt- und Raumforschung (BBSR): Bonn, Germany, 2011. [Google Scholar]
- Nagendra, H.; Sudhira, H.S.; Katti, M.; Tengö, M. Urbanization and its impacts on land use, biodiversity and ecosystems in India. INTERdisciplina 2014, 2, 305–313. [Google Scholar]
- Distelkamp, M.; Ulrich, P.; Siedentop, S.; Mohr, K. 30-ha-Ziel: Konsequenzen des Szenarios Flächenverbrauchsreduktion auf 30 ha im Jahr 2020 für die Siedlungsentwicklung; Bundesministerium für Verkehr, Bau und Stadtentwicklung (BMVBS): Bonn, Germany, 2011. [Google Scholar]
- Distelkamp, M.; Lutz, C.; Ulrich, P.; Wolter, M.I. Entwicklung der Flächeninanspruchnahme für Siedlung und Verkehr bis 2020: Ergebnisse des Rationalisierten Modells Panta Rhei Regio; Gesellschaft für Wirtschaftliche Strukturforschung mbH: Osnabrück, Germany, 2008. [Google Scholar]
- Deutscher Wetterdienst (DWD). Windkarten und Winddaten für Deutschland: Bezugszeitraum 1981–2000; Abteilung Klima- und Umweltberatung: Offenbach, Germany, 2013. [Google Scholar]
- Ushiyama, I. Wind power in Japan: Past, present and future prospects. In Wind Power for the World: International Reviews and Developments; Maegaard, P., Krenz, A., Palz, W., Eds.; CRC Press: Boca Braton, FL, USA, 2013; pp. 217–242. [Google Scholar]
- Lautenbach, S.; Kugel, C.; Lausch, A.; Seppelt, R. Analysis of historic changes in regional ecosystem service provisioning using land use data. Ecol. Indic. 2011, 11, 676–687. [Google Scholar] [CrossRef]
- Statistisches Bundesamt (DESTATIS). Land- und Forstwirtschaft, Fischerei: Bodenfläche nach Art der tatsächlichen Nutzung; Statistisches Bundesamt (DESTATIS): Wiesbaden, Germany, 2012. [Google Scholar]
- Baba, L.; Kemper, J.; Schwedt, A. Regionale Siedlungsflächenentwicklung in den Neuen Bundesländern auf Basis von Prognosen der Bau- und Immobilienwirtschaft; Bundesministerium für Verkehr, Bau und Stadtentwicklung (BMVBS): Bonn, Germany, 2007. [Google Scholar]
- Presse- und Informationsamt der Bundesregierung (BPA). Perspektiven für Deutschland: Unsere Strategie für eine nachhaltige Entwicklung; Fortschrittsbericht: Berlin, Germany, 2014. [Google Scholar]
- Ring, I. Compensating municipalities for protected areas: Fiscal transfers for biodiversity conservation in Saxony, Germany. GAIA-Ecol. Perspect. Sci. Soc. 2008, 17, 143–151. [Google Scholar]
- Sliz-Szkliniarz, B.; Vogt, J. GIS-based approach for the evaluation of wind energy potential: A case study for the Kujawsko-Pomorskie Voivodeship. Renew. Sustain. Energy Rev. 2011, 15, 1696–1707. [Google Scholar] [CrossRef]
- Vester, F. Ausfahrt Zukunft: Strategien für den Verkehr von Morgen; Eine Systemuntersuchung. Heyne: München, Germany, 1990. [Google Scholar]
© 2014 by the authors; licensee MDPI, Basel, Switzerland. This article is an open access article distributed under the terms and conditions of the Creative Commons Attribution license (http://creativecommons.org/licenses/by/3.0/).
Share and Cite
Blankenhorn, V.; Resch, B. Determination of Suitable Areas for the Generation of Wind Energy in Germany: Potential Areas of the Present and Future. ISPRS Int. J. Geo-Inf. 2014, 3, 942-967. https://doi.org/10.3390/ijgi3030942
Blankenhorn V, Resch B. Determination of Suitable Areas for the Generation of Wind Energy in Germany: Potential Areas of the Present and Future. ISPRS International Journal of Geo-Information. 2014; 3(3):942-967. https://doi.org/10.3390/ijgi3030942
Chicago/Turabian StyleBlankenhorn, Valerie, and Bernd Resch. 2014. "Determination of Suitable Areas for the Generation of Wind Energy in Germany: Potential Areas of the Present and Future" ISPRS International Journal of Geo-Information 3, no. 3: 942-967. https://doi.org/10.3390/ijgi3030942