A Geospatial Approach for Prioritizing Wind Farm Development in Northeast Nebraska, USA

Abstract
:
1. Introduction


| Study/Research | Study Area | Modeling Approach | Factors |
|---|---|---|---|
| Aydin et al., 2010 [1] | Western Turkey | Multi-criteria decision-making with fuzzy set theory | Distance to natural reserves, distance to large cities, distance from towns, distance from airports, noise, distance from lakes and wetlands, wind power |
| Baban and Parry, 2001 [9] | United Kingdom | Multi-criteria analysis and questionnaire | Slope, distance to water bodies, historical sites, urban areas, roads and railways, land use and the presence of important ecological areas |
| Janke, 2010 [11] | Colorado, U.S. | Multi-criteria analysis | Wind potential, distance to transmission lines, distance to cities, population density, distance to roads, land cover, federal lands |
| Rodman and Meentemeyer, 2006 [7] | Northern California, U.S. | Rule-based spatial analysis | Physical criteria: wind speed, forest density, valley slope and distance to ridge; Environmental criteria: vegetation, endangered plant species and wetlands; Human impact criteria: urban areas and recreation areas |
| Van Haaren and Fthenakis, 2011 [10] | New York, U.S. | Multi-stage multi-criteria analysis | Economic evaluation: distance to transmission grid, distance to roads, land clearing costs, wind resources; Bird impact evaluation; Excluded locations: urban areas, federal lands, reservations, roads, lakes, steep slopes, karst areas; Planning criteria: noise |
| Van Hoesen and Letendre, 2010 [12] | Poultney Valley, Vermont, U.S. | GIS-based overlay analysis | Wind potential, viewshed for visual impact including heights of canopy, slopes and elevation |
2. Methods
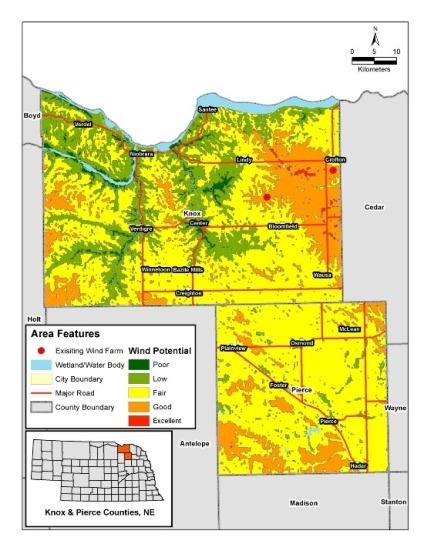
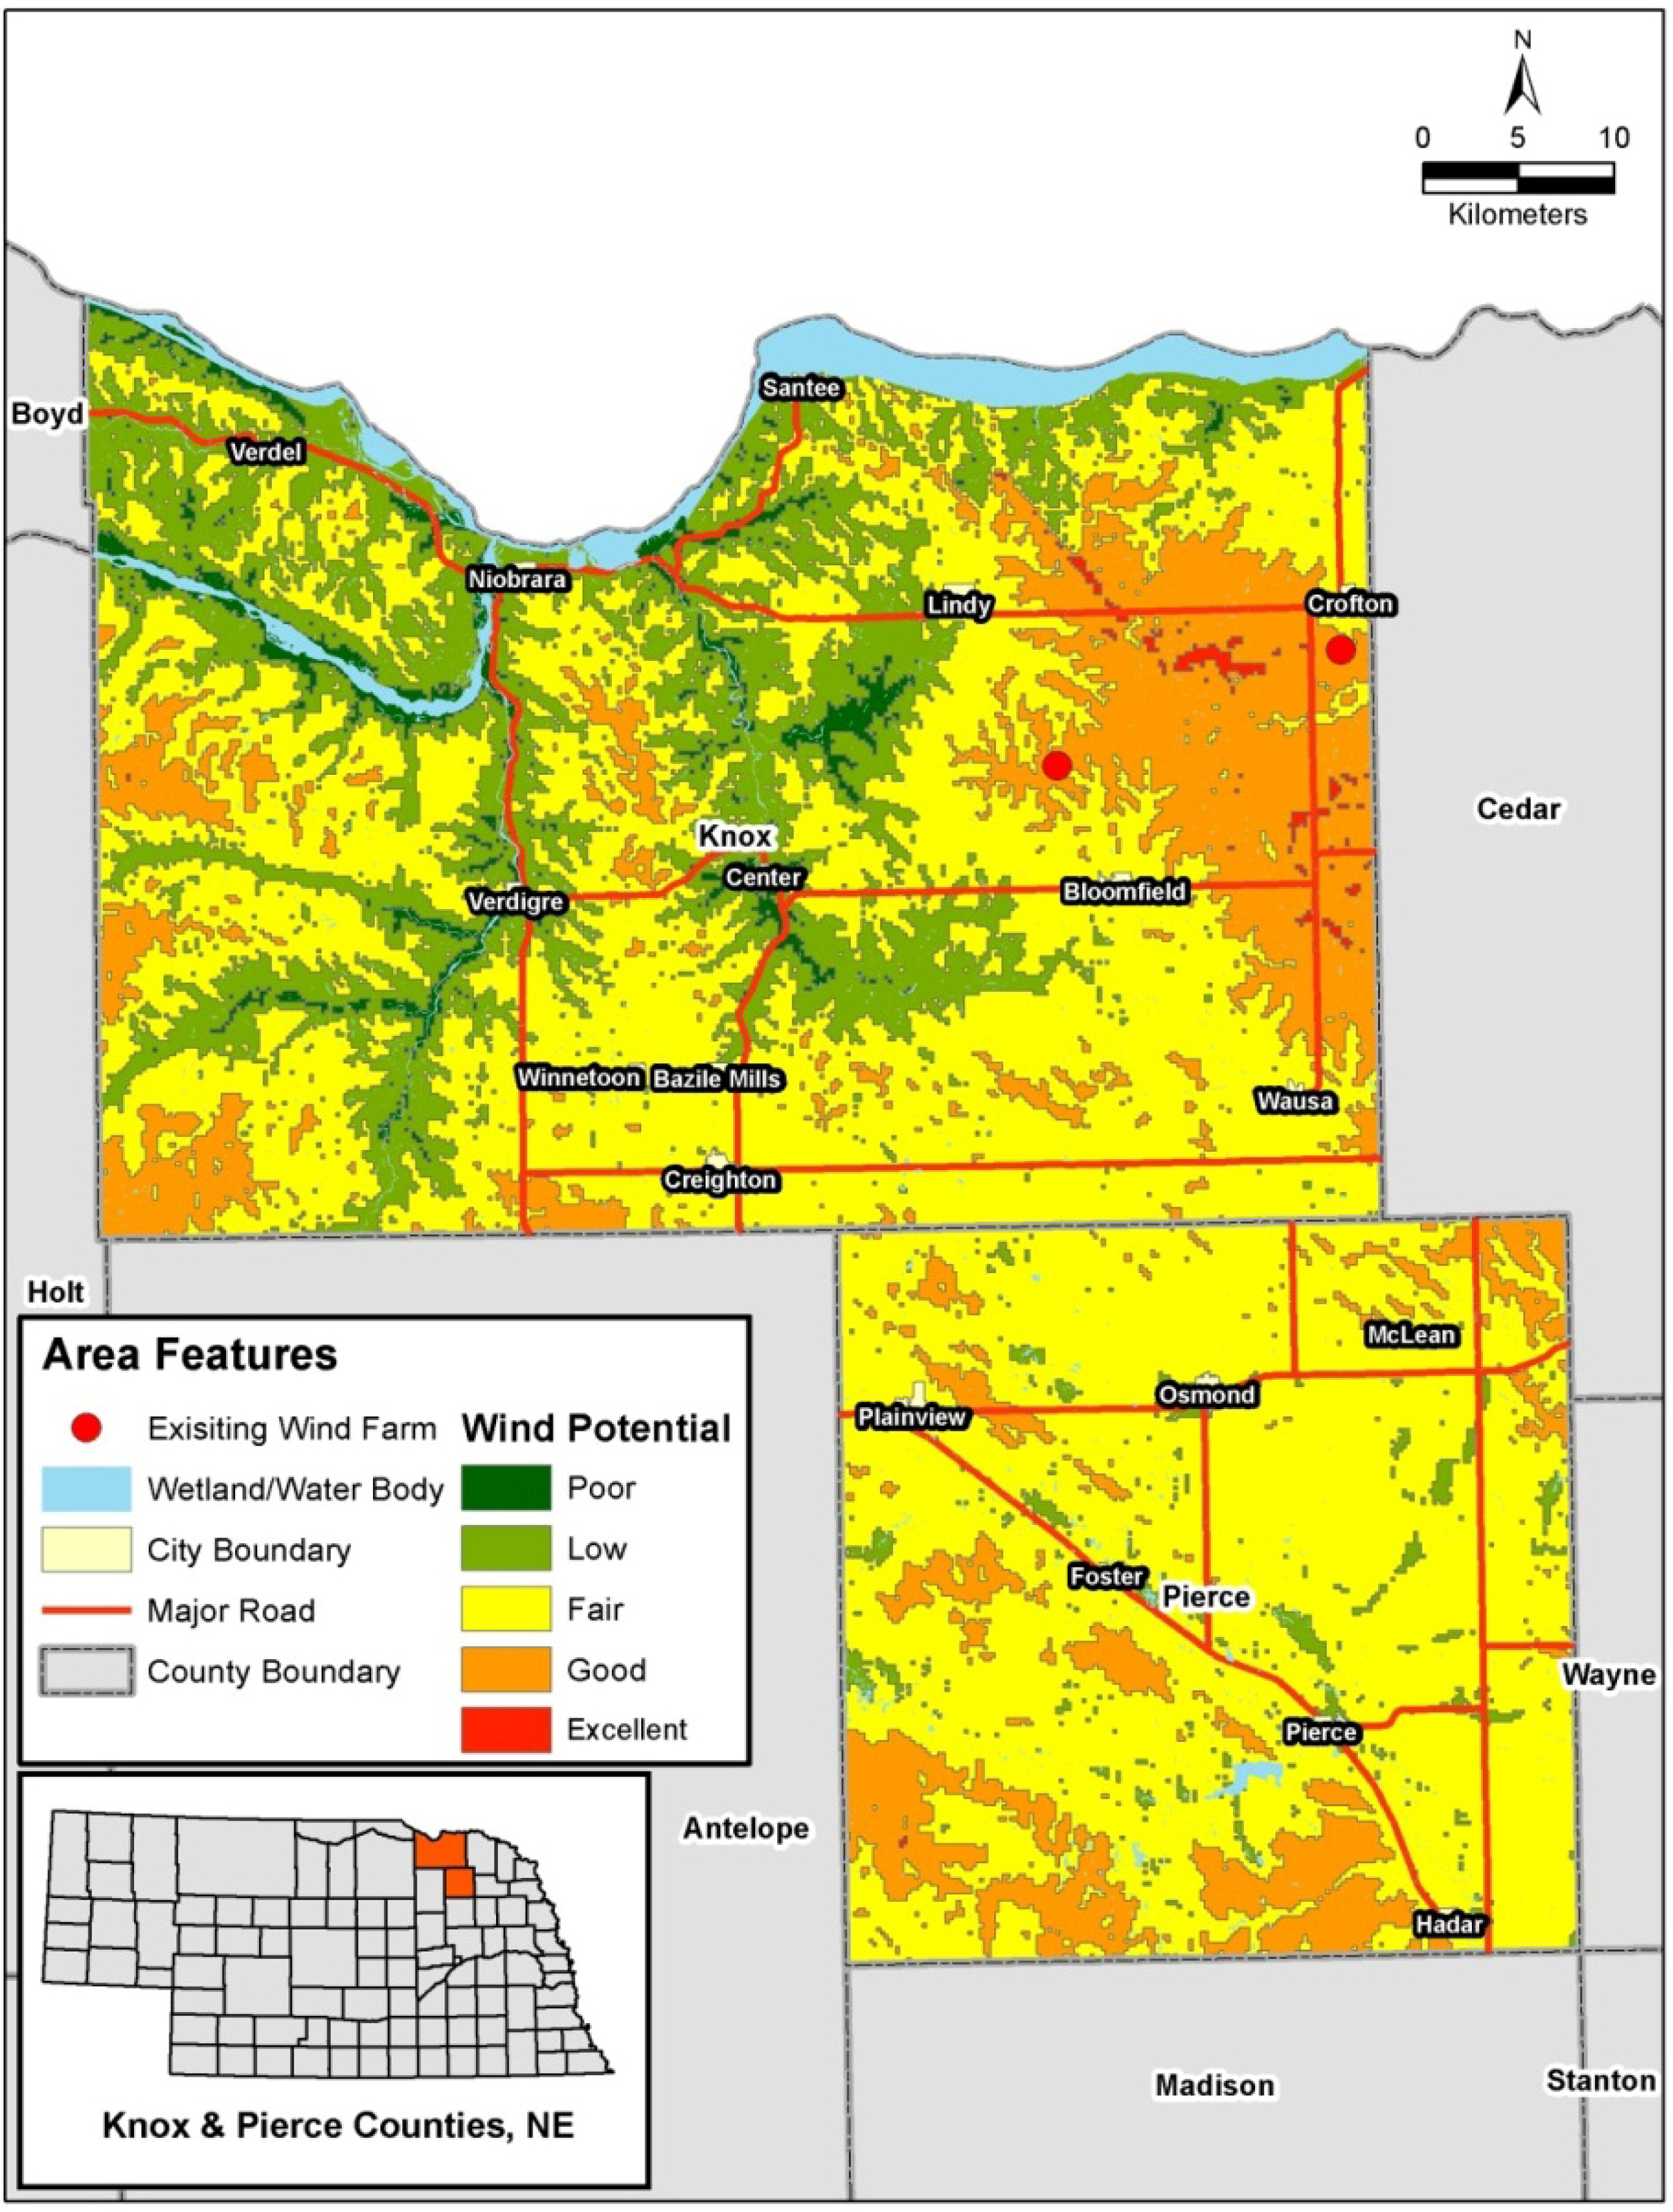
2.1. Study Area

2.2. Selection of Model Factors
| Criteria | Data Sources | Reasons for Selection | Original Data Structure | Original Resolution/Feature type |
|---|---|---|---|---|
| Slope | USGS DEMs 1 [17] | Slope affects the ease of construction and maintenance [18] | Raster | 30 m |
| Wind Energy Potential | NREL Wind Energy Potential Map [19] | Wind potential is essential for wind energy production [9] | Raster | 200 m |
| Land Use | 2005 Nebraska Land Use Dataset [20] | Land use is a criterion representing the environmental impacts of the wind farms [7] | Raster | 30 m |
| Population Density | U.S. Census Bureau TIGER 2 [21] | Public concerns regarding its visual and noise impacts [7] | Vector | Polygon |
| Distance to Transmission Lines | U.S. Census Bureau TIGER [21] | Reducing the cost of building new transmission lines [9] | Vector | Polyline |
| Distance to Roads | U.S. Census Bureau TIGER [21] | Allowing for better access for construction and maintenance [9] | Vector | Polyline |
| Exclusionary Areas (towns) | U.S. Census Bureau TIGER [21] | Conflicting land use preoccupied by human infrastructure | Vector | Polygon |
| Exclusionary Areas (wetlands) | National Wetlands Inventory [22] | Avoiding ecological sensitive areas [10] | Vector | Polygon |
| Exclusionary Areas (airports) | U.S. Census Bureau TIGER [21] | Conflicting land use preoccupied by human infrastructure | Vector | Polygon |
| Exclusionary Areas (Railroads) | U.S. Census Bureau TIGER [21] | Avoiding areas on the railroads [18] | Vector | Polyline |
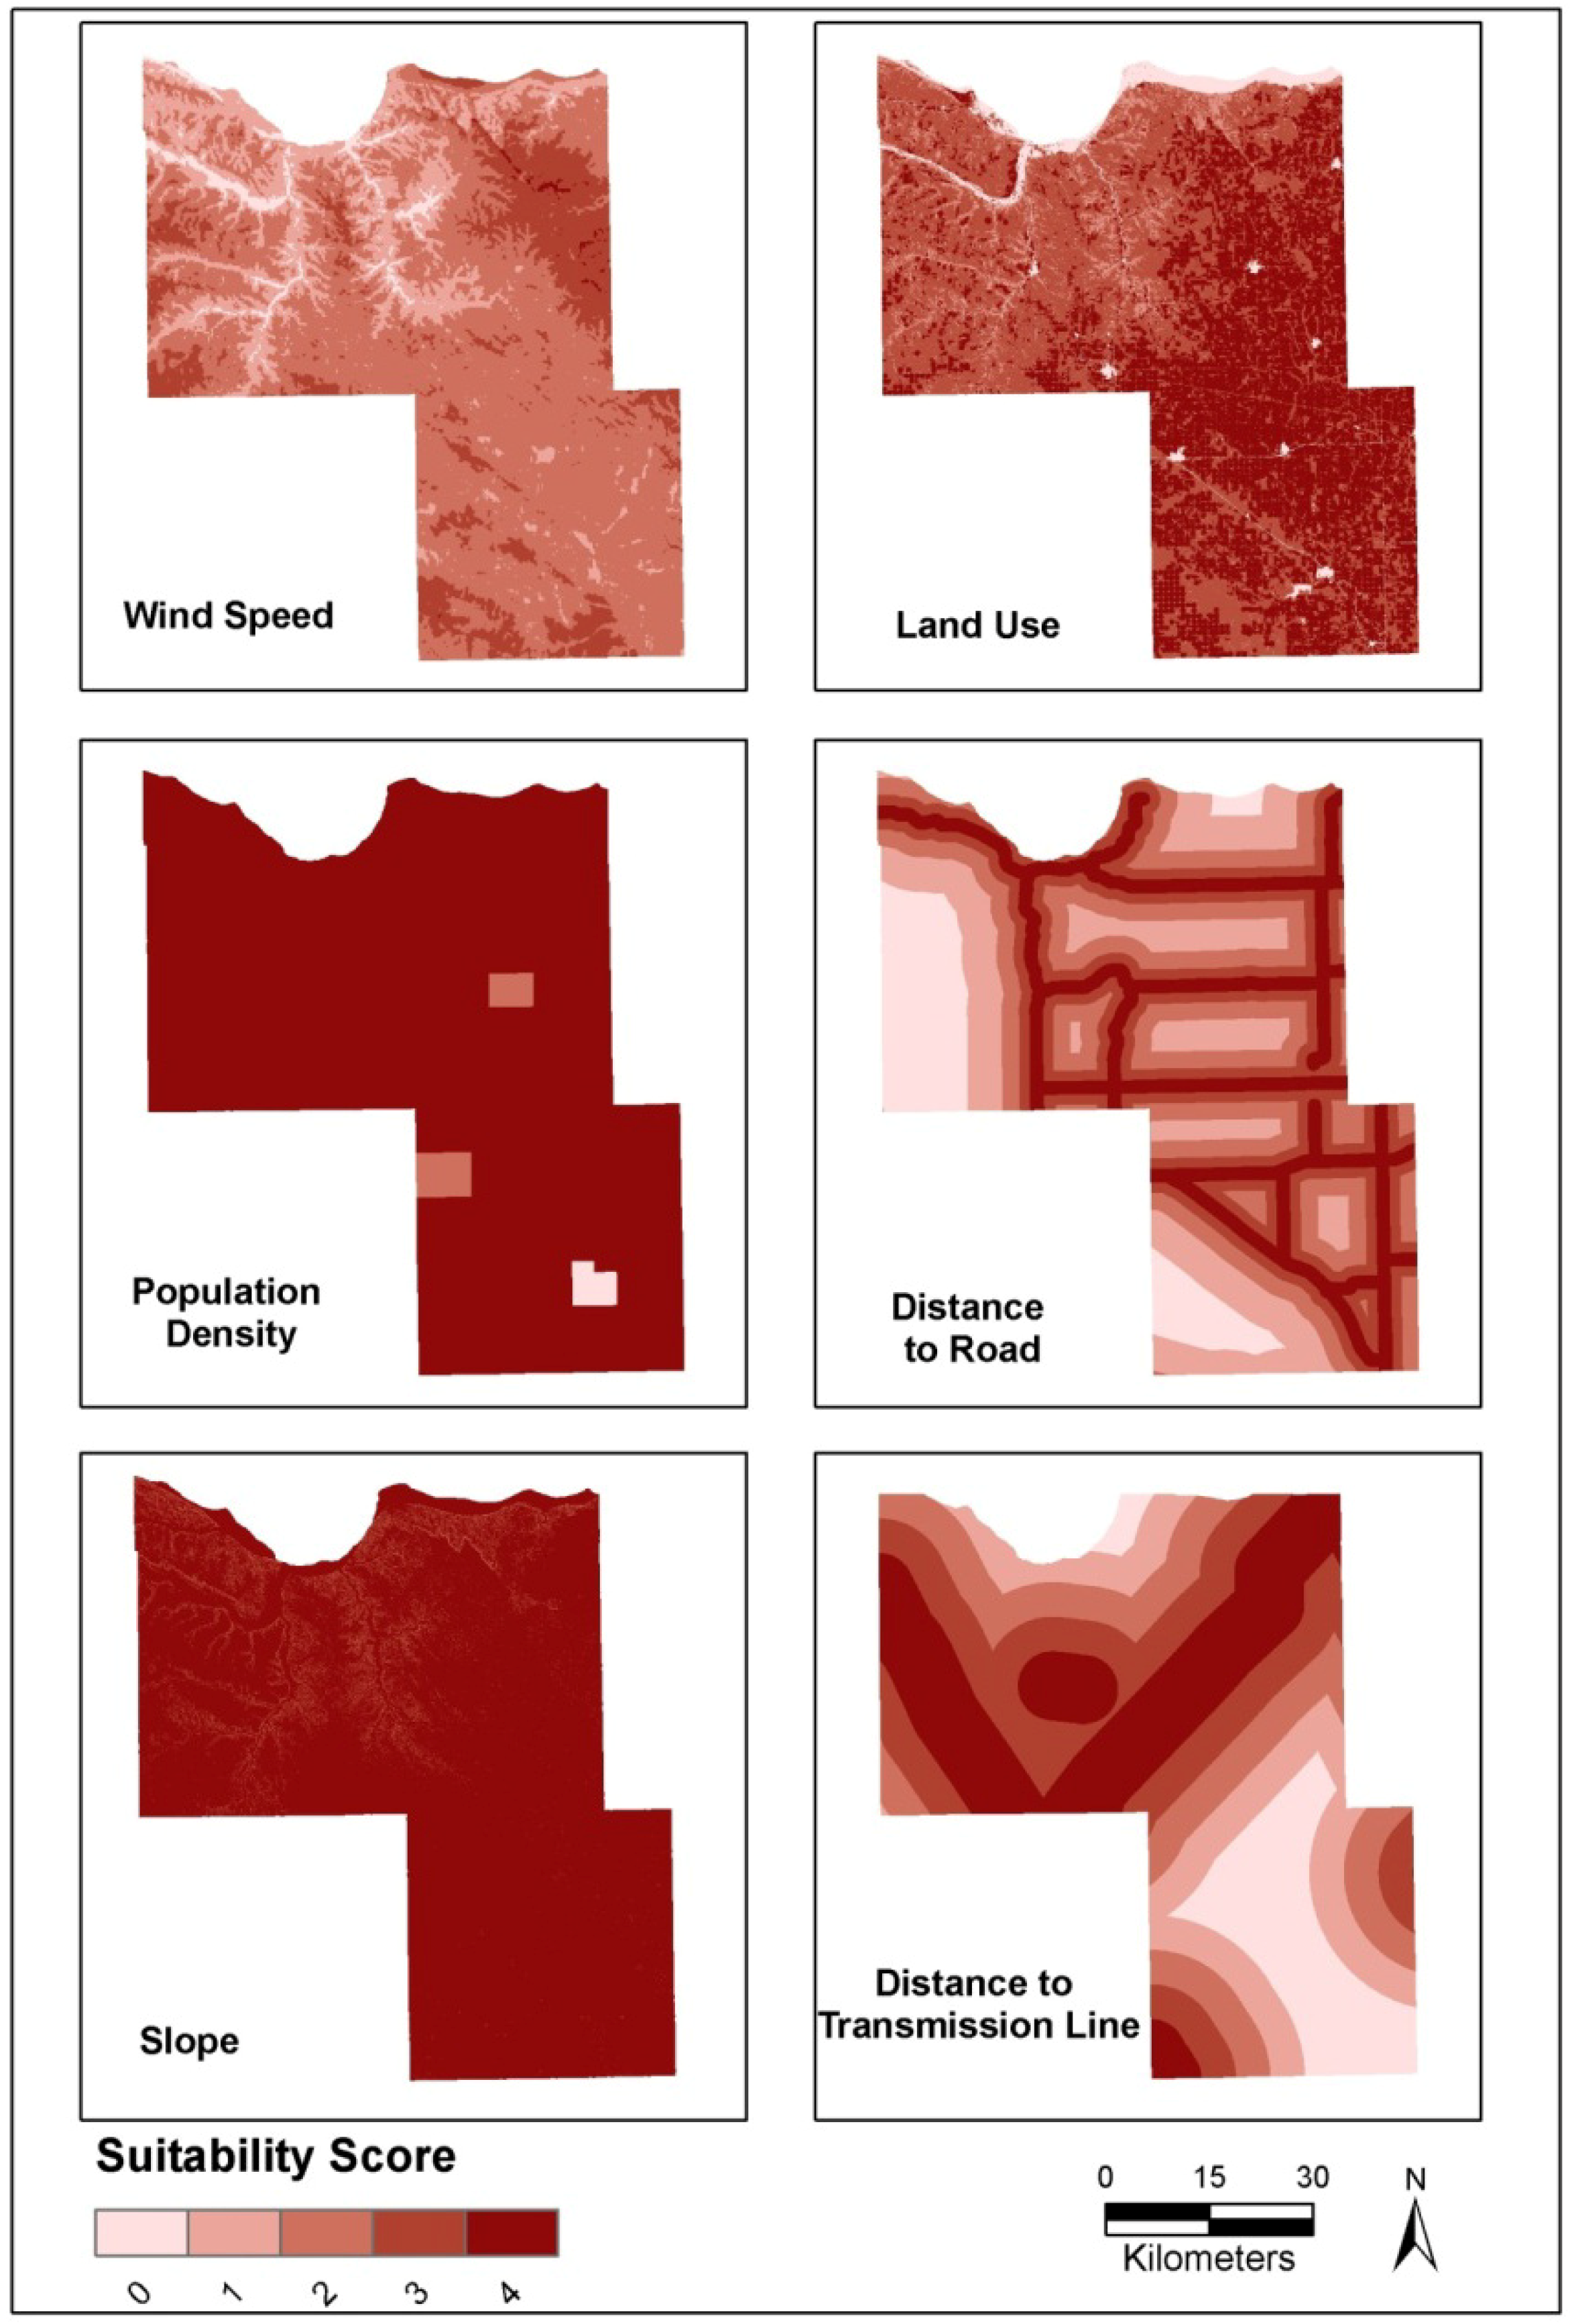
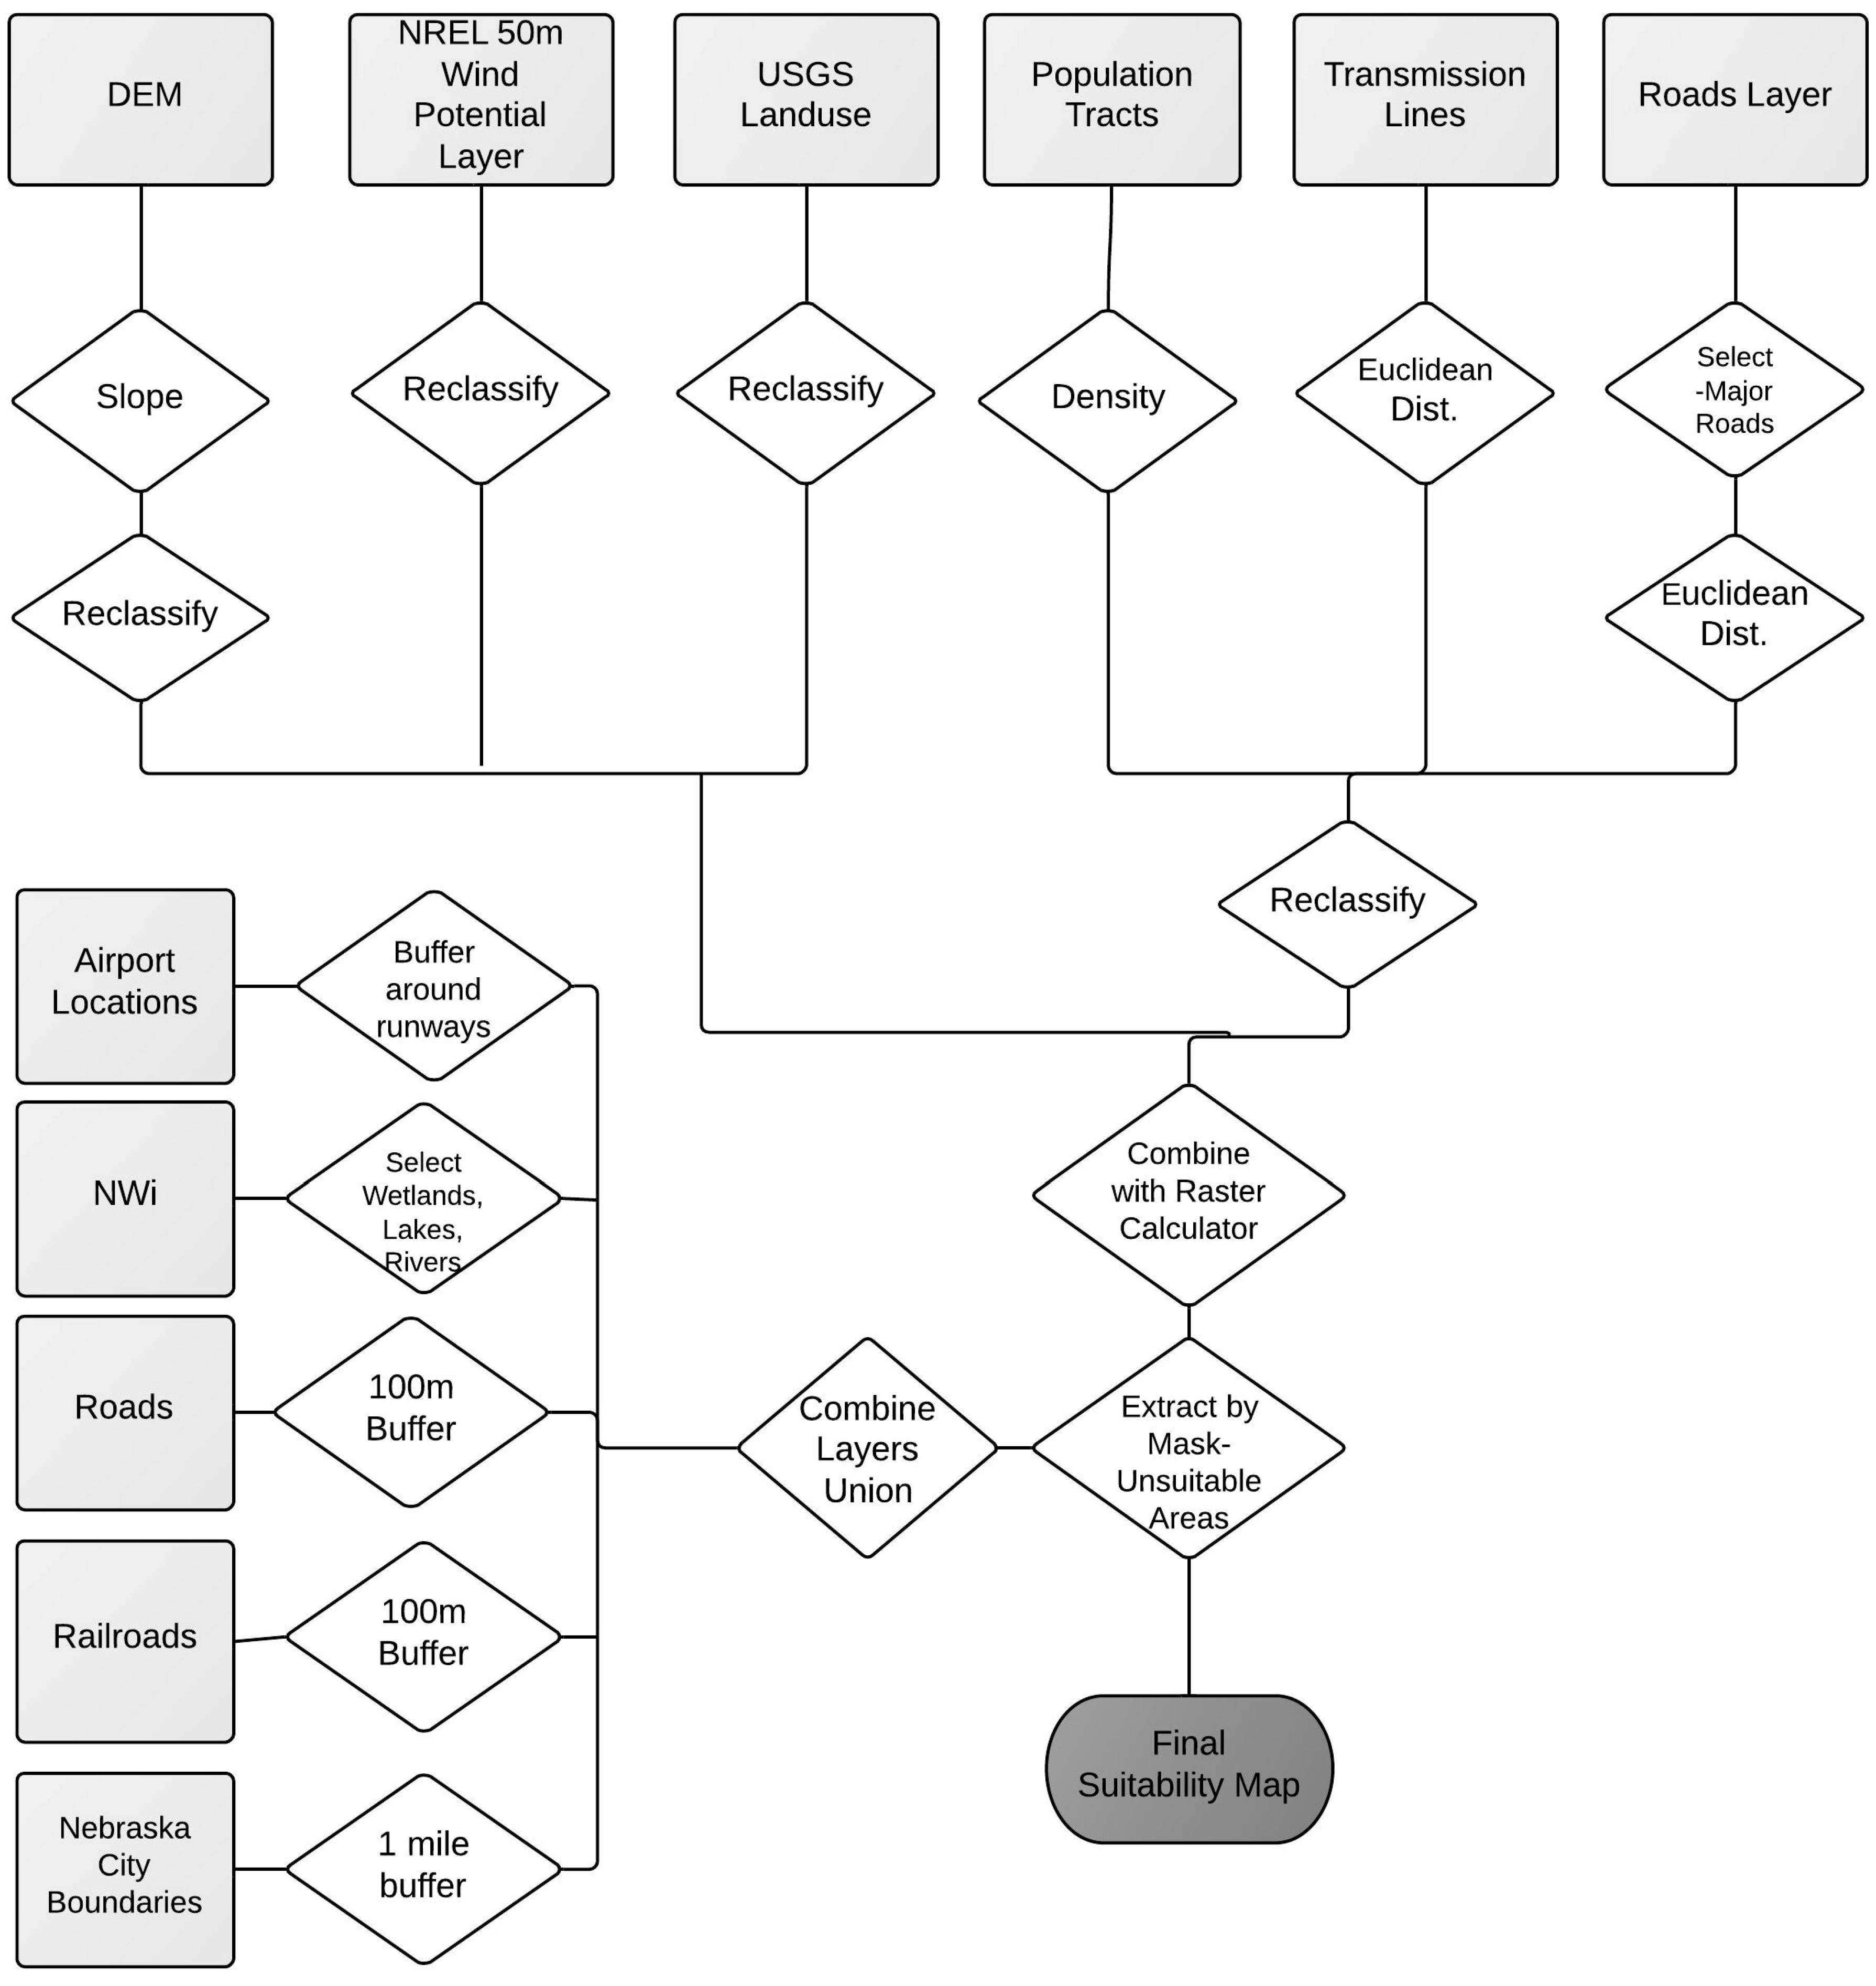
2.3. Modeling Procedure
| Suitability Score | Slope (Degrees) | NREL WPC (50m) Speed (m/s) | Land Use | Population Density (person/mi²) | Distance to Transmission Line (m) | Distance to Major Road (m) |
|---|---|---|---|---|---|---|
| High (4) | [0, 7] | >7.5 | Agriculture/Barren | (0, 25] | (0, 5000] | (0, 1000] |
| Medium (3) | (7, 16] | (7, 7.5] | Grassland | (25, 50] | (5000, 10,000] | (1000, 2500] |
| Low (2) | (16, 30] | (6.4, 7] | Shrub land | (50, 100] | (10,000, 15,000] | (2500, 5,000] |
| Lowest (1) | (30, 40] | (5.6, 6.4] | Forest/Woodland | (100, 150] | (15,000, 20,000] | (5000, 10,000] |
| Unsuitable (0) | >40 | (0, 5.6] | Wetlands/Urban/Water | >150 | >20,000 | >10,000 |

| Layer | Assigned Weight |
|---|---|
| Wind energy potential | 3 |
| Slope | 2 |
| Land use | 2 |
| Distance to transmission lines | 2 |
| Distance to roads | 2 |
| Population density | 1 |

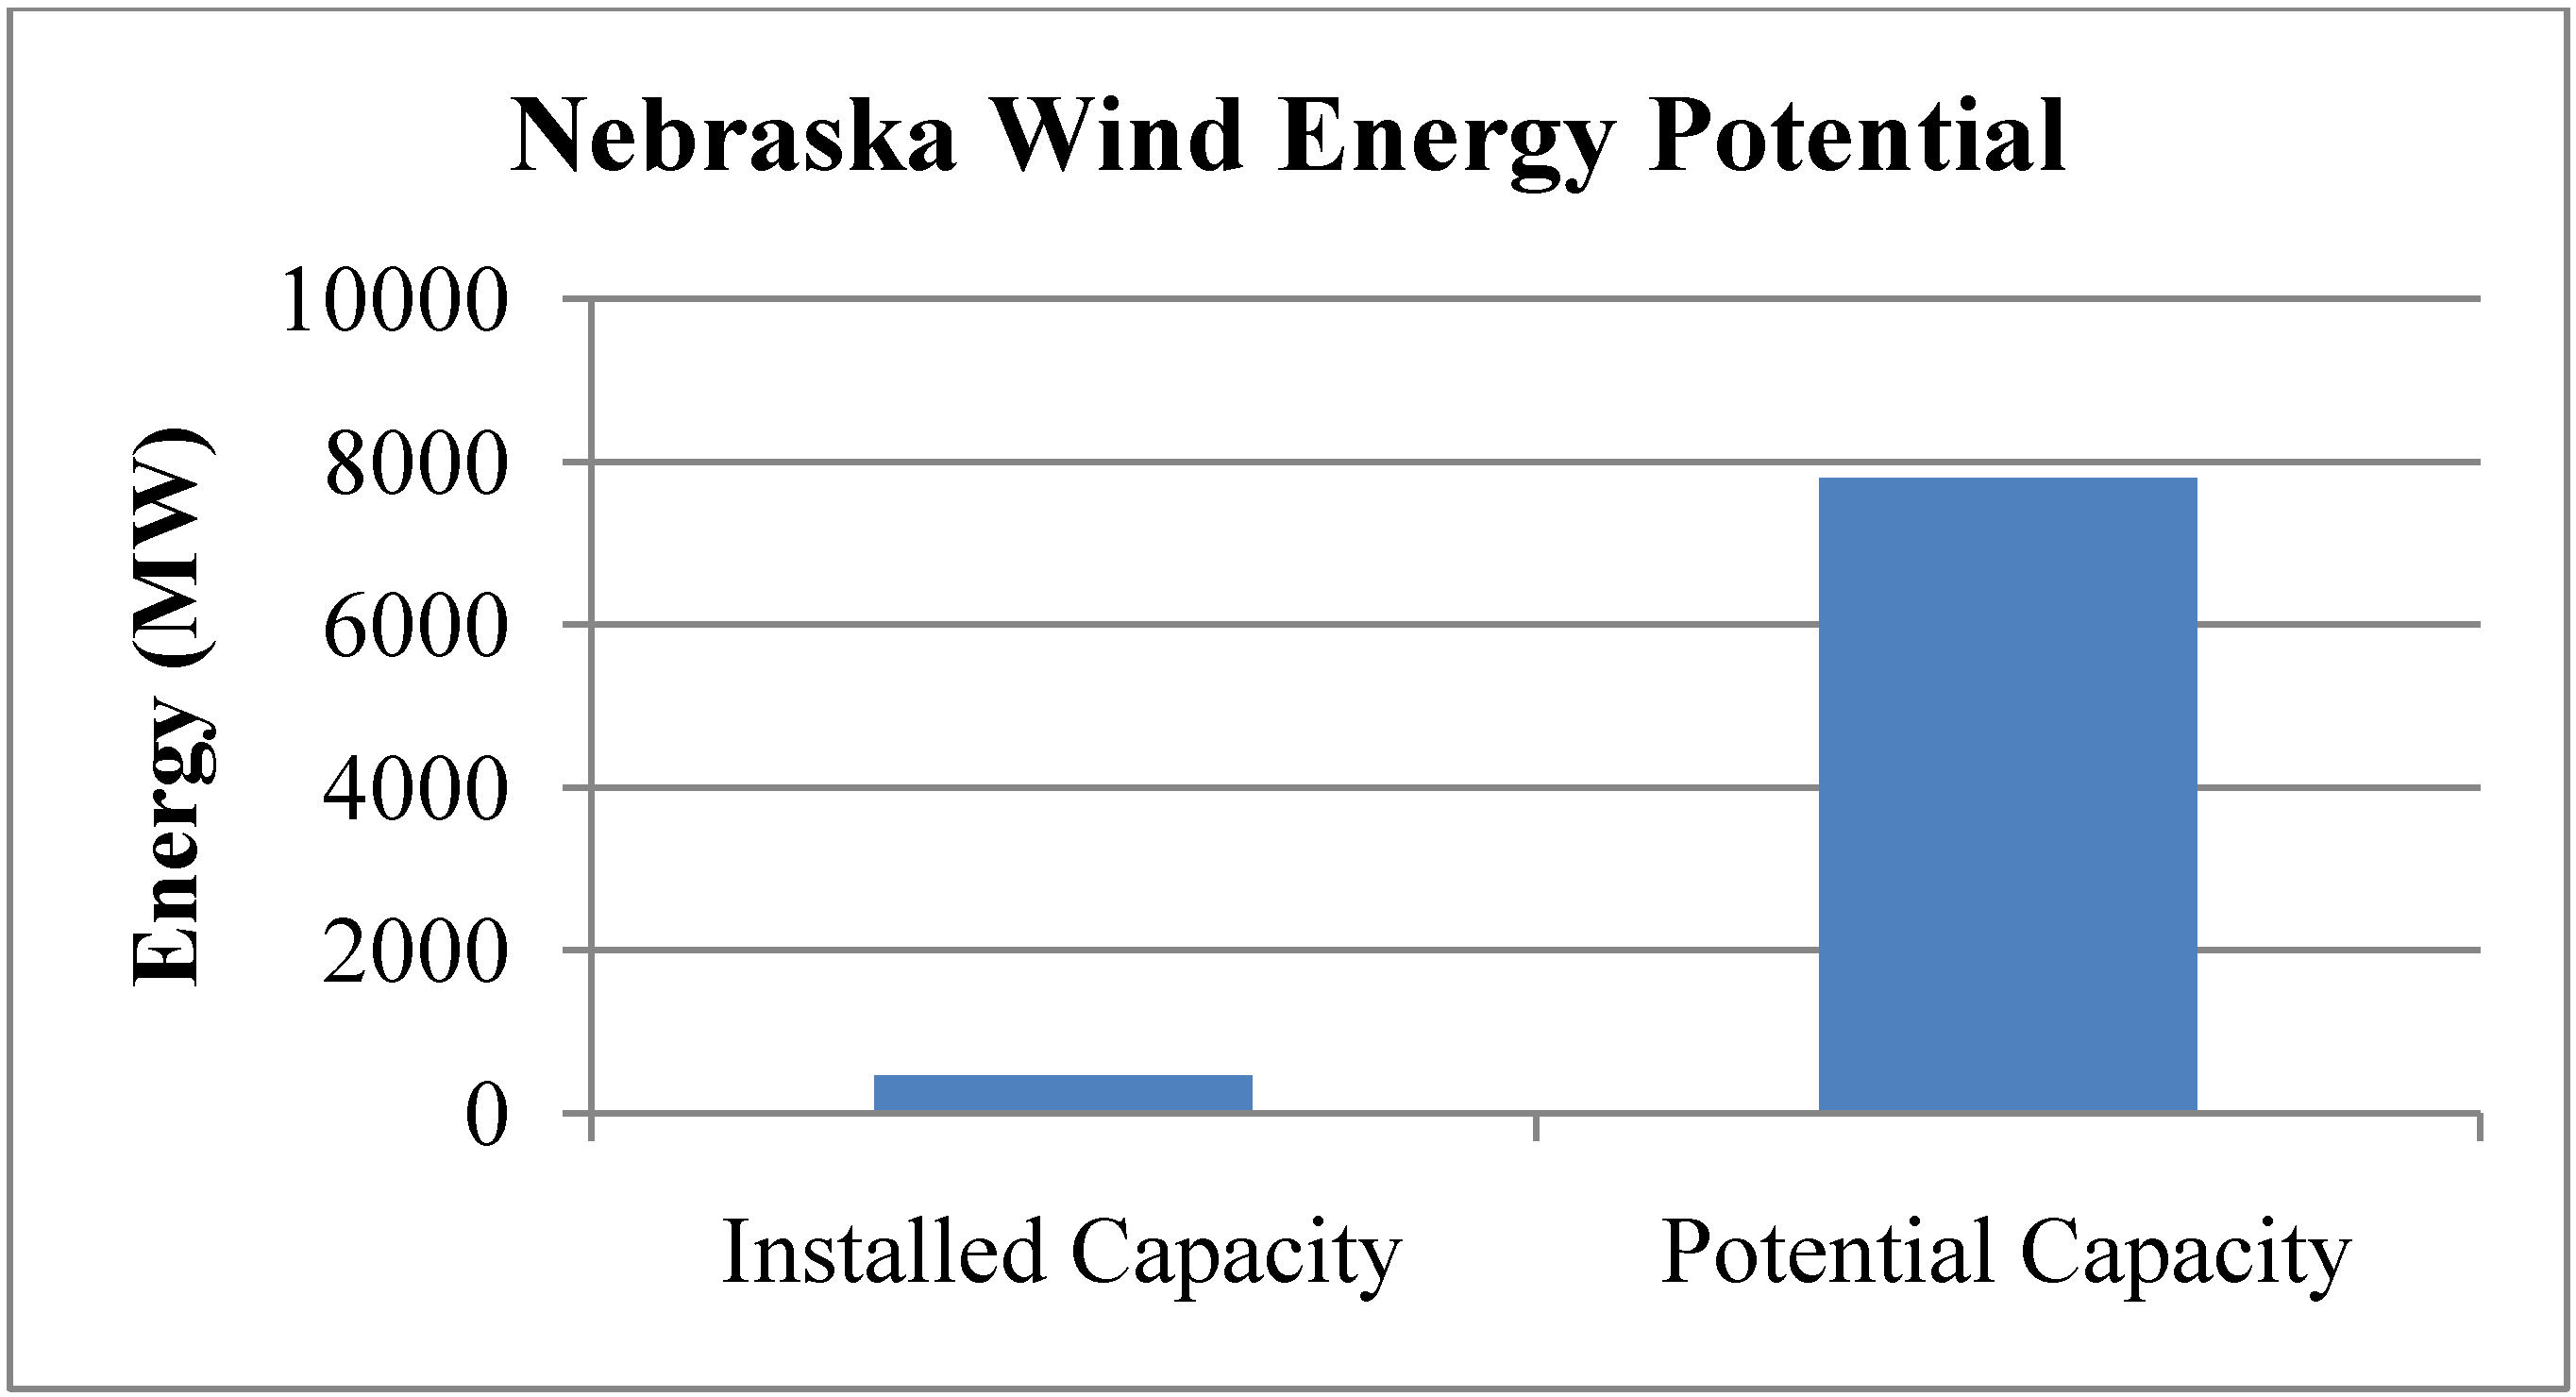
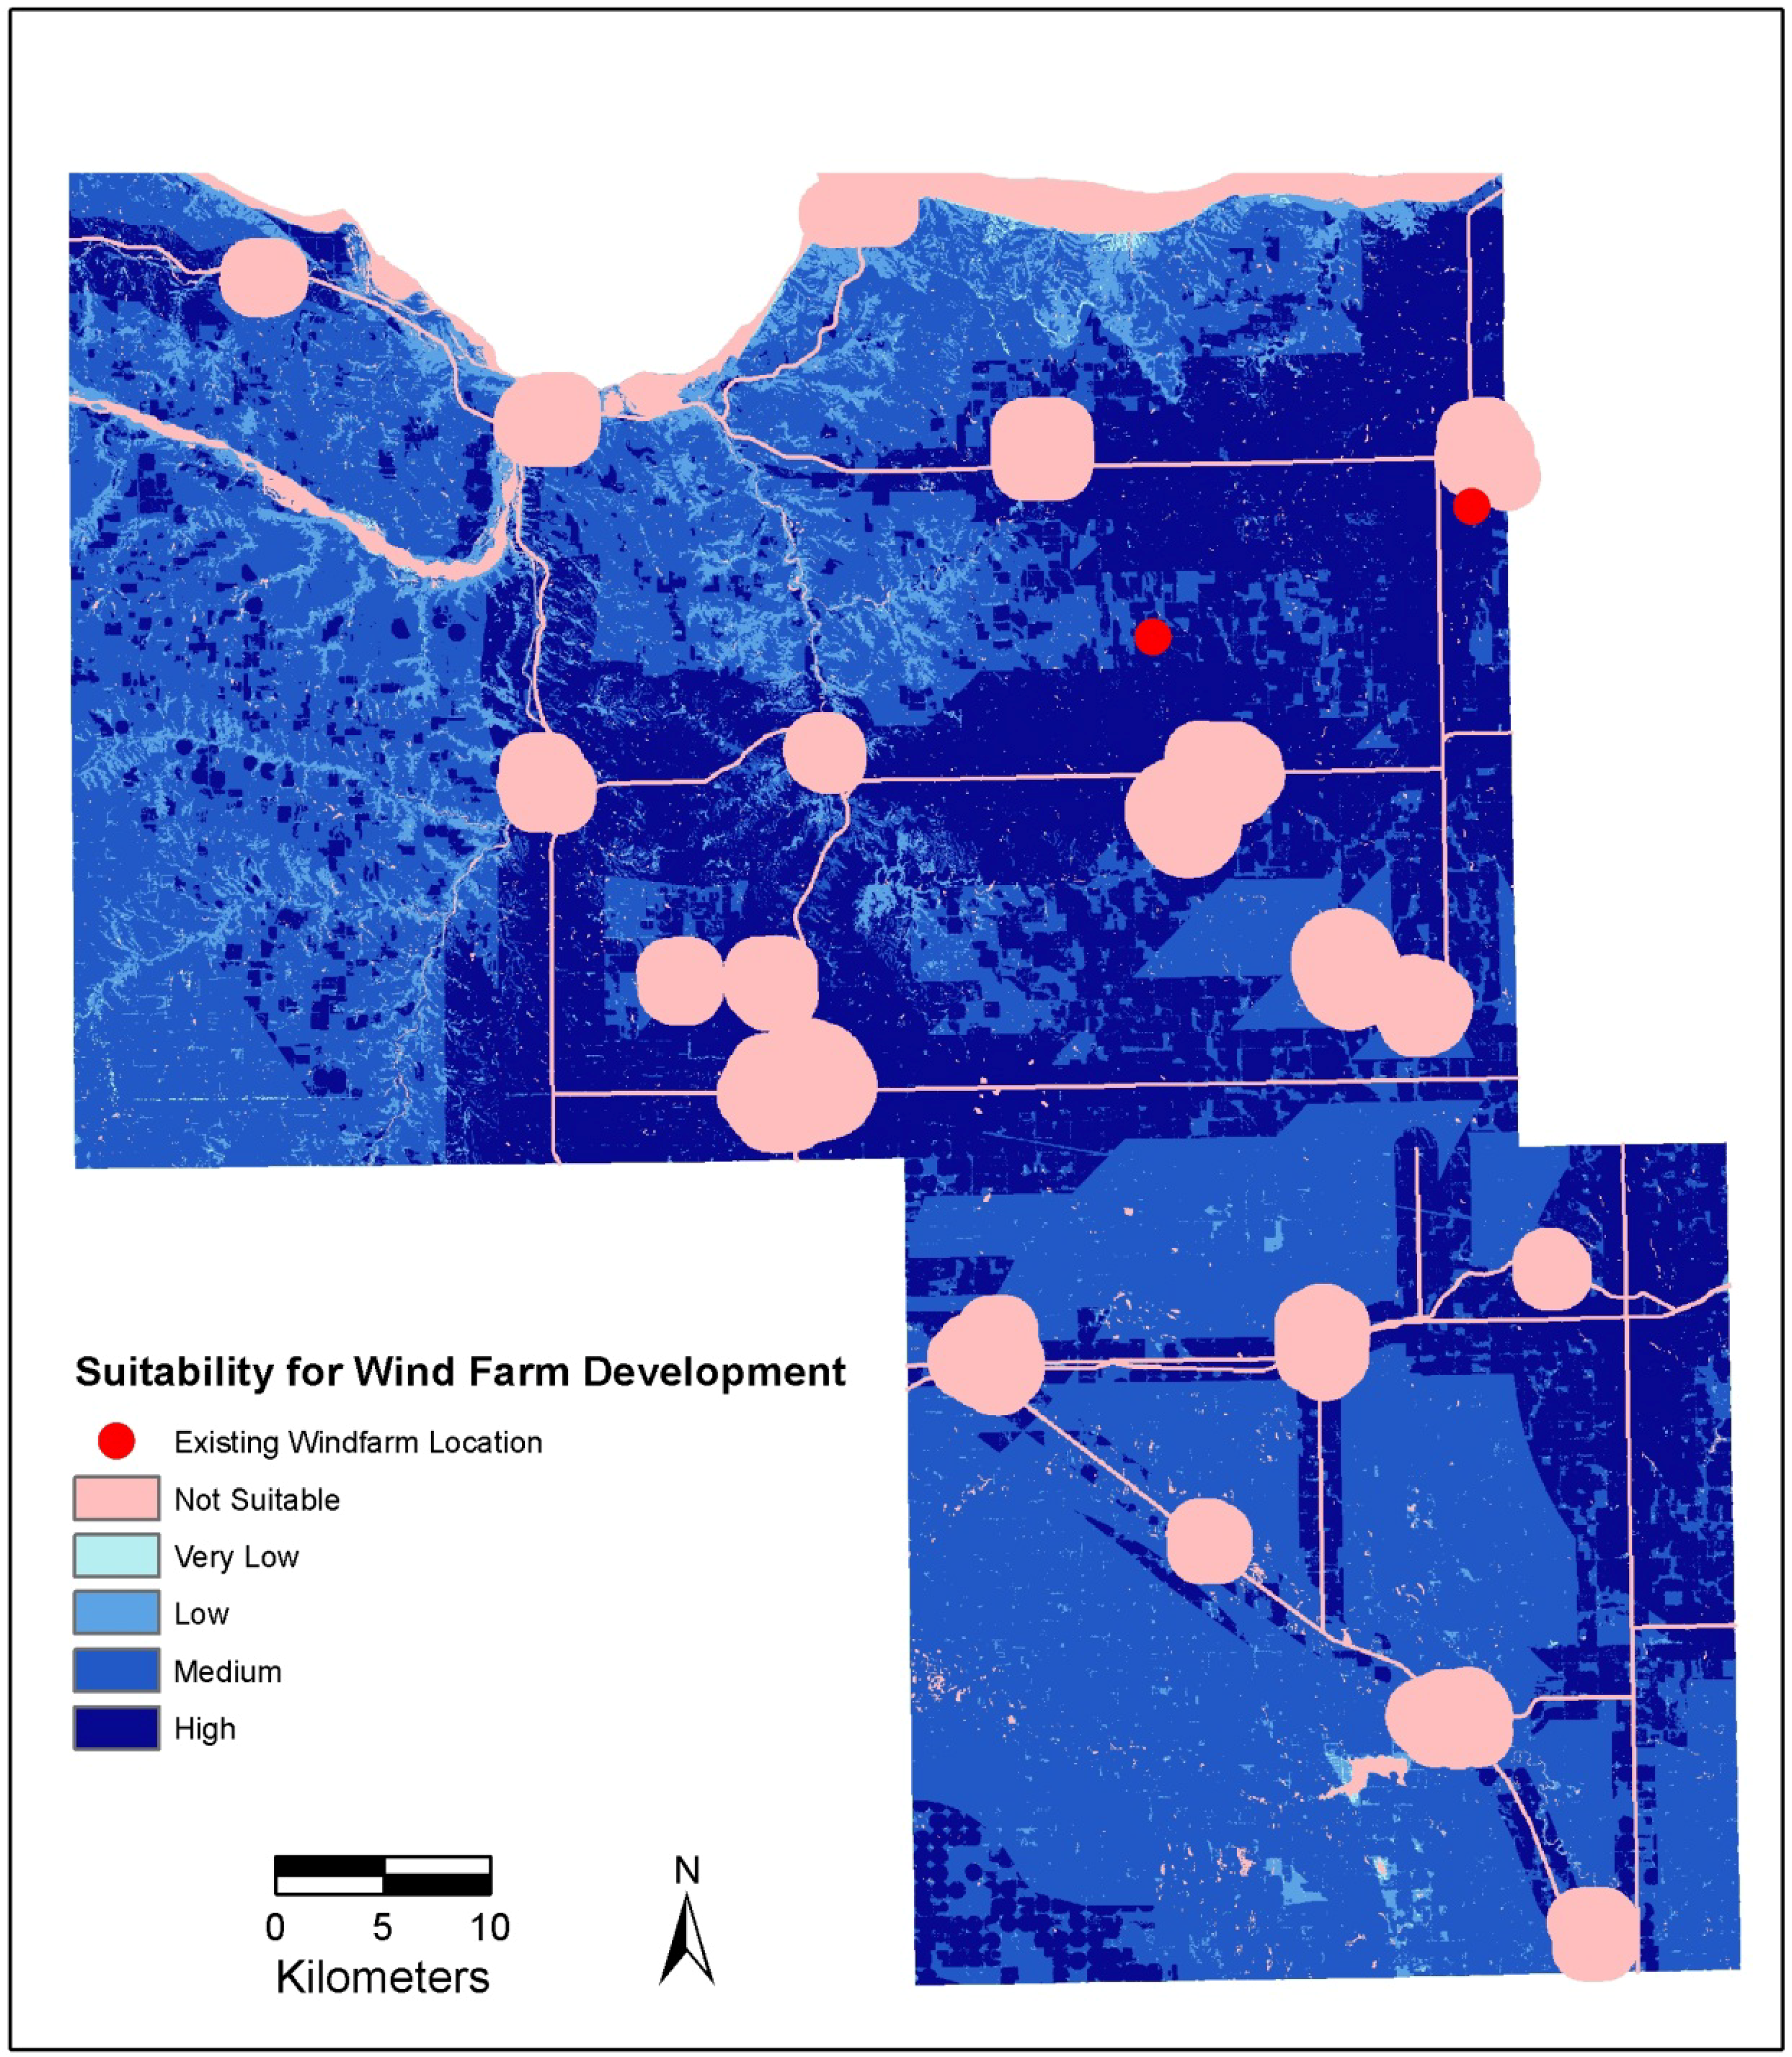
3. Results and Discussions

4. Conclusions
Author Contributions
Conflicts of Interest
References
- Aydin, N.Y.; Kentel, E.; Duzgun, S. GIS-based environmental assessment of wind energy systems for spatial planning: A case study from western Turkey. Renew. Sustain. Energy Rev. 2009, 14, 364–373. [Google Scholar] [CrossRef]
- Herbert, G.M.; Iniyan, S.; Sreevalsan, E.; Rajapandian, S. A review of wind energy technologies. Renew. Sustain. Energy Rev. 2007, 11, 1117–1145. [Google Scholar] [CrossRef]
- Delucchi, M.A.; Jacobson, M.Z. Meeting the world’s energy needs entirely with wind, water, and solar power. Bull. Atomic Sci. 2013, 69, 30–40. [Google Scholar] [CrossRef]
- Wiser, R.; Bolinger, M. Annual Report on U.S. Wind Power Installation, Cost, and Performance Trends: 2007; Office of Energy Efficiency and Renewable Energy, US Department of Energy: Oak Ridge, TN, USA, 2008. [Google Scholar]
- Natural Resources Defense Council. Renewable Energy for America-Nebraska. 2014. Available online: http://www.nrdc.org/energy/renewables/nebraska.asp (accessed on 3 February 2014).
- US Department of Energy. Nebraska 50-meter Wind Map. 2014. Available online: http://www.windpoweringamerica.gov/maps_template.asp?stateab=ne (accessed on 1 March 2014). [Google Scholar]
- Rodman, L.C.; Meentemeyer, R.K. A geographic analysis of wind turbine placement in Northern California. Energy Policy 2006, 34, 2137–2149. [Google Scholar] [CrossRef]
- Nebraska Energy Association. Wind Energy Generation in Nebraska. 2014. Available online: http://www.neo.ne.gov/statshtml/89.htm (accessed on 3 February 2014). [Google Scholar]
- Baban, S.M.J.; Parry, T. Developing and applying a GIS-assisted approach to locating wind farms in the UK. Renew. Energy 2001, 24, 59–71. [Google Scholar]
- Van Haaren, R.V.; Fthenakis, V. GIS-based wind farm site selection using spatial multi-criteria analysis (SMCA): Evaluating the case for New York State. Renew. Sustain. Energy Rev. 2011, 15, 3332–3340. [Google Scholar] [CrossRef]
- Janke, J.R. Multicriteria GIS modeling of wind and solar farms in Colorado. Renew. Energy 2010, 35, 2228–2234. [Google Scholar] [CrossRef]
- Van Hoesen, J.; Letendre, S. Evaluating potential renewable energy resources in Poultney, Vermont: A GIS-based approach to supporting rural community energy planning. Renew. Energy 2010, 35, 2114–2122. [Google Scholar] [CrossRef]
- Grassi, S.; Chokani, N.; Abhari, R.S. Large scale technical and economical assessment of wind energy potential with a GIS tool: Case study Iowa. Energy Policy 2012, 45, 73–85. [Google Scholar] [CrossRef]
- Yue, C.D.; Wang, S.S. GIS-based evaluation of multifarious local renewable energy sources: A case study of the Chigu area of southwestern Taiwan. Energy Policy 2006, 34, 730–742. [Google Scholar]
- High Plains Regional Climate Center. Historical Climate Data Summaries. Available online: http://www.hprcc.unl.edu/data/historical/ (accessed on 3 February 2014).
- National Renewable Energy Laboratory. Wind Energy Resource Atlas of the United States. Available online: http://rredc.nrel.gov/wind/pubs/atlas/ (accessed on 3 February 2014).
- US Geological Survey. National Elevation Dataset. Available online: http://viewer.nationalmap.gov/viewer/ (accessed on 3 February 2014).
- Tegou, L.I.; Polatidis, H.; Haralambopoulos, D.A. Environmental management framework for wind farm siting: Methodology and case study. J. Environ. Manag. 2010, 91, 2134–2147. [Google Scholar] [CrossRef]
- National Renewable Energy Laboratory. Wind Data. Available online: http://www.nrel.gov/gis/data_wind.html (accessed on 3 February 2014).
- Nebraska Department of Natural Resources. Land Use Data. Available online: http://dnr.nebraska.gov/land-use-data (accessed on 3 February 2014).
- US Census Bureau. TIGER Products. Available online: https://www.census.gov/geo/maps-data/data/tiger.html (accessed on 3 February 2014).
- US Fish and Wildlife Service. USFWS National GIS Data. Available online: http://www.fws.gov/gis/data/national/index.html#NWI (accessed on 3 February 2014).
- Jenks, G.F. The data model concept in statistical mapping. Int. Yearb. Cartogr. 1967, 7, 186–190. [Google Scholar]
- Christidis, T.; Law, J. Mapping Ontario’s wind turbines: Challenges and limitations. ISPRS Int. J. Geo-Inf. 2013, 2, 1092–1105. [Google Scholar] [CrossRef]
© 2014 by the authors; licensee MDPI, Basel, Switzerland. This article is an open access article distributed under the terms and conditions of the Creative Commons Attribution license (http://creativecommons.org/licenses/by/3.0/).
Share and Cite
Miller, A.; Li, R. A Geospatial Approach for Prioritizing Wind Farm Development in Northeast Nebraska, USA. ISPRS Int. J. Geo-Inf. 2014, 3, 968-979. https://doi.org/10.3390/ijgi3030968
Miller A, Li R. A Geospatial Approach for Prioritizing Wind Farm Development in Northeast Nebraska, USA. ISPRS International Journal of Geo-Information. 2014; 3(3):968-979. https://doi.org/10.3390/ijgi3030968
Chicago/Turabian StyleMiller, Adam, and Ruopu Li. 2014. "A Geospatial Approach for Prioritizing Wind Farm Development in Northeast Nebraska, USA" ISPRS International Journal of Geo-Information 3, no. 3: 968-979. https://doi.org/10.3390/ijgi3030968