Article

Assessing Spatial Accessibility of Public and Private Residential Aged Care Facilities: A Case Study in Wuhan, Central China

1
School of Resource and Environmental Science, Wuhan University, 129 Luoyu Road, Wuhan 430079, China
2
Key Laboratory of Geographic Information System, Ministry of Education, Wuhan University, 129 Luoyu Road, Wuhan 430079, China
3
Collaborative Innovation Center for Geospatial Information Technology, Wuhan 430079, China
4
Faculty of Resource and Environmental Science, Hubei University, Wuhan 430062, China
5
Faculty of Resource and Environmental Science, Henan Agricultural University, Zhengzhou 450002, China
*
Author to whom correspondence should be addressed.
ISPRS Int. J. Geo-Inf. 2017, 6(10), 304; https://doi.org/10.3390/ijgi6100304
Submission received: 4 September 2017 / Revised: 13 October 2017 / Accepted: 13 October 2017 / Published: 16 October 2017

Abstract

:
In the increasingly serious aging China, aged service is the provision of one of the most urgent and important public services to citizens, and private facilities has become an important service force with the aged service market opening in China. This study aims to explore the spatial variation in the accessibility of residential aged care facilities (RACFs) and compared the service capacity of public RACFs and private RACFs. It facilitates RACFs to be allocated rationally in the future and achieve the equalization of aged services. A village-level analysis of spatial access to public and private RACFs by the multi-catchment sizes Gaussian two-step floating catchment area (MCSG2SFCA) method was conducted through a case study in Wuhan City in Central China. The major results are as follows: (1) the accessibility of RACFs in urban areas is better than that in rural areas; (2) the public RACFs still dominate aged care services but the role of private RACFs is important as well; (3) in developed urban areas, the accessibility to private RACFs surpasses that of public ones, and the situation is opposite in rural areas; (4) the capacity of aged care services in Wuhan is not high, meanwhile there is remarkable regional disparity. The accessibility of RACFs in Wuhan is not satisfactory, and there is a significant gap between urban and rural areas. The private RACFs have significantly improved the urban capacity of aged care services, but the role in rural areas is still very weak.

1. Introduction

In 1982, the Vienna World Assembly on Aging acknowledged that when the senior population proportion (aged 65 and above) is more than 7%, the country or region would enter a seriously aging society. China has been an aging country since 1999. It is anticipated that the aging ratio will reach up to 35% in 2050, which would make China the most aged country in the world [1]. The growth of the elderly population has created a huge demand for aged services. However, the aged service capacity in many areas of China has not been able to meet the growing needs of the elderly, and the imbalance between urban and rural aged services capacity varies greatly. In this context, aged service industry has rapidly developed in many metropolises in China in recent years. In this study, residential care refers to long-term care given to old population aged 65 and above in a residential setting (mainly incl. home, community or institutional care facilities) rather than at their homes. Compared to the aged care facilities at home and in the community, the institutional aged care facilities can provide large-scale and better aged services. However, the allocation of institutional aged care facilities also require more government policy support and capital input, and the allocation of institutional aged care facilities is the special issue to be valued for the government to make aged service plan. In this paper, the residential aged care facilities (RACFs) only refers to institutional aged care facilities.
To alleviate the problem of aging and facilitate the development of the aged care services industry, the Chinese governments have created planning policies to relieve pension pressure. The State Council issued The Construction Plan of Social Aged care System (2011–2015) in 2011. The plan says the Chinese government will give full play to the basic role of the market to allocate resources, break trade restrictions, open the social aging market, and support social forces to set up all kinds of aged care facilities [2,3]. As an important part of public service, aged service has long been supported by government financial input in China, which needs a large amount of government finance. However, with the development of the market economy, more and more private capital has entered the field of aged care service. The development of private RACFs can save government expenditure and improve the service system for the aged and has made great contributions to the improvement of aged care services. Therefore, in China, which has already opened the aged service market, it is necessary to understand the development and service capacity of private RCFs supported by private capital through a quantitative research.
As the most crucial metropolis in Central China, Wuhan has a comparatively higher degree of aging population than the national level. This makes the aging problem severer. The proportion of people aged 65 and above in Wuhan increased from 8.71% to 13.01% from 2005 and 2015 (Figure 1). If this growth rate remains, Wuhan will enter the ranks of Severe Aging Cities in 2020 [4]. The municipal government has issued the Spatial Layout Planning of Residential aged care facilities in Wuhan (2012–2020), which proposed that the aged care service configure ration in Wuhan in 2015 is “90-5-5”. Specifically, “90-5-5” represents the aged modes’ proportions respectively accounting for 90% (home care), 5% (community care) and 5% (institutional care). Moreover, the ratio of care facilities will be increased to 6% in 2020 [5]. Considering the increasing demand, there will be a greater number of new public and private RACFs coming into service.
According to the aged service survey conducted by the Wuhan Municipal Bureau of Civil Affairs in 2013 [6], 84.7% of the elderly in Wuhan choose home care for aged service, about 40% of them are empty nest (live with no children around) or solitary (live alone). Only 2.9% of the elderly choose institutional care. The proportion of the choice of institutional aged care was significantly lower than the target of 5% set by the government. When choosing the aged care service, 80.3% of the elderly in Wuhan do not want to leave the present living environment. In addition to the cost, the space separation from original living environment caused by the distance is an important reason for the elderly not choose institutional care. Therefore, the new RACFs should be built close to the elderly living place, so as to improve the proportion of institutional care for aged service. For the decision-makers, how to provide the elderly with more convenient and accessible care services is an important issue for the layout planning of RACFs.
From the perspective of convenience and cost-effectiveness, “aging in place” is a popular term in current aging policy and has been extensively discussed in various studies [7,8,9]. Policy-makers argued that “aging in place” provided a better sense of belonging and acquaintance for older people [10]. Wiles (2012) proved that aging in place was desirable for individuals as it offers greater independence, autonomy, and social network [11]. In the field of environmental gerontology, Lawton and Wahl analyzed the relationship between the elderly’s personal attributes (including health, income, education, and social status) and the social environment [10,12,13]; Iwarsson (2007) applied a research framework to the home environment and healthy aging in five European countries [14]; Oswald (2010) studied the physical and social environment of home and neighborhoods at the subjective and objective levels [15]. These studies on aging-in-place show that a familiar social environment can create better care for the aged. Wu and his team researched the development of China’s RACFs, they argued that the RACFs to stay too far from the elderly would resulted the elderly break-away from the original living circle, and even fragmented their contacts with other age groups [16]. “Aging in place” requires that the aged services provided by RACFs should be nearby and convenient.
The RACFs’ location, transportation convenience, and time cost of visiting families and friends are the important factors when choosing a RACF [17]. The spatial distribution of RACFs is also an important context for the elderly when choosing facilities for aged care service. High accessibility and proximity of RACFs enable older persons to live in a more familiar, comfortable, and responsive environment. The convenience might better facilitate their children’s access to visit them and also falls in the line with “aging in place”. Cheng quantitatively analyzed the spatial accessibility of RACFs in Beijing by the shortest distance and the improved two-step floating catchment area (2SFCA) method by Wang and Luo [18], Yan and Tao conducted micro-simulation and layout optimization studies on the allocation of RACFs in Beijing [19,20]. However, there is still insufficient empirical research on the quantitative analysis of the spatial accessibility of RACFs in China, especially with the lack of analysis of the equalization of urban–rural aged services and the development of the private RACFs in China after the opening of aged service market from the perspective of a geographer.
Public facilities play a vital role in meeting the increasing material and cultural needs of people and improving the quality of life. Therefore, the fair allocation of public service facilities has become an important goal for the policymakers in planning the layout of public facilities [21,22]. Spatial accessibility is the most common method to measure the spatial distribution of public facilities [23,24]. The assessment of the spatial accessibility of RACFs helps to identify the scarce areas of the aged service and measure the fairness of the spatial layout of the RACFs effectively, and provides supports for the equalization of the basic pension services.
The common methods to measure spatial accessibility are the shortest path approach [25], the proportion method [26,27], the kernel density method [28,29], the gravity-based model [30] and 2SFCA method [31,32]. Among these, the 2SFCA method is the most developed and widely used. The advantages of this method not only involve distance cost but also take the scale of supply and demand into account [31,33,34]. The early 2SFCA method did not consider the effect of distance decay on facility accessibility in the study area [35]. Luo and Qi proposed an enhanced 2SFCA method (E2SFCA) where the research area was divided into several specific areas and given corresponding weights [36]. Some scholars made further improvements to the model, such as adding the kernel density formula [28] or the Gauss formula [37] to reflect the effect of distance decay. Different from other functions, the changes of distance decay of Gauss function meets with the normal distribution curve, which is more consistent with people’s spatial choice behavior. It has been applied in spatial accessibility assessment of health care facilities [37], green spaces [38] and employment [39], and made a better evaluation results. To improve the assessment results, this paper selects different effective service areas according to the different scales of RACFs, adds the Gauss function to the 2SFCA model to reflect distance decay, and proposes the multi-catchment sizes Gaussian two-step floating catchment area (MCSG2SFCA) method to assess the spatial accessibility public and private RACFs.
This study is implemented with a specific focus on the city of Wuhan and assessed the spatial accessibility of RACFs by the MCSG2SFCA method. Compared with the previous research, this paper has mainly improved in the following aspects: (1) data of better quality are adopted. The traffic network data obtained from the results of the First National Census of Geographical Conditions, which has higher spatial resolution and more comprehensive road network (mainly incl. highways, provincial roads, county roads, township roads etc.). The population data at a smaller scale of village level and then the positions of the village committee instead of simple geographic centroids to represent the population locations were more accurate; (2) a modified 2SFCA method. This paper selects different effective service areas according to the different scales of RACFs, and adds the Gauss function to the 2SFCA mode to improve the method to get better accuracy; (3) a comprehensive introduction of the service capabilities of public and private RACFs. Through the comparison of accessibility of public and private RACFs, we introduced the contribution of private RACFs for the supply capacity of regional aged service to readers and provide political implications for the spatial layout planning of RACFs.

2. Methods

2.1. Study Area and Data Preparation
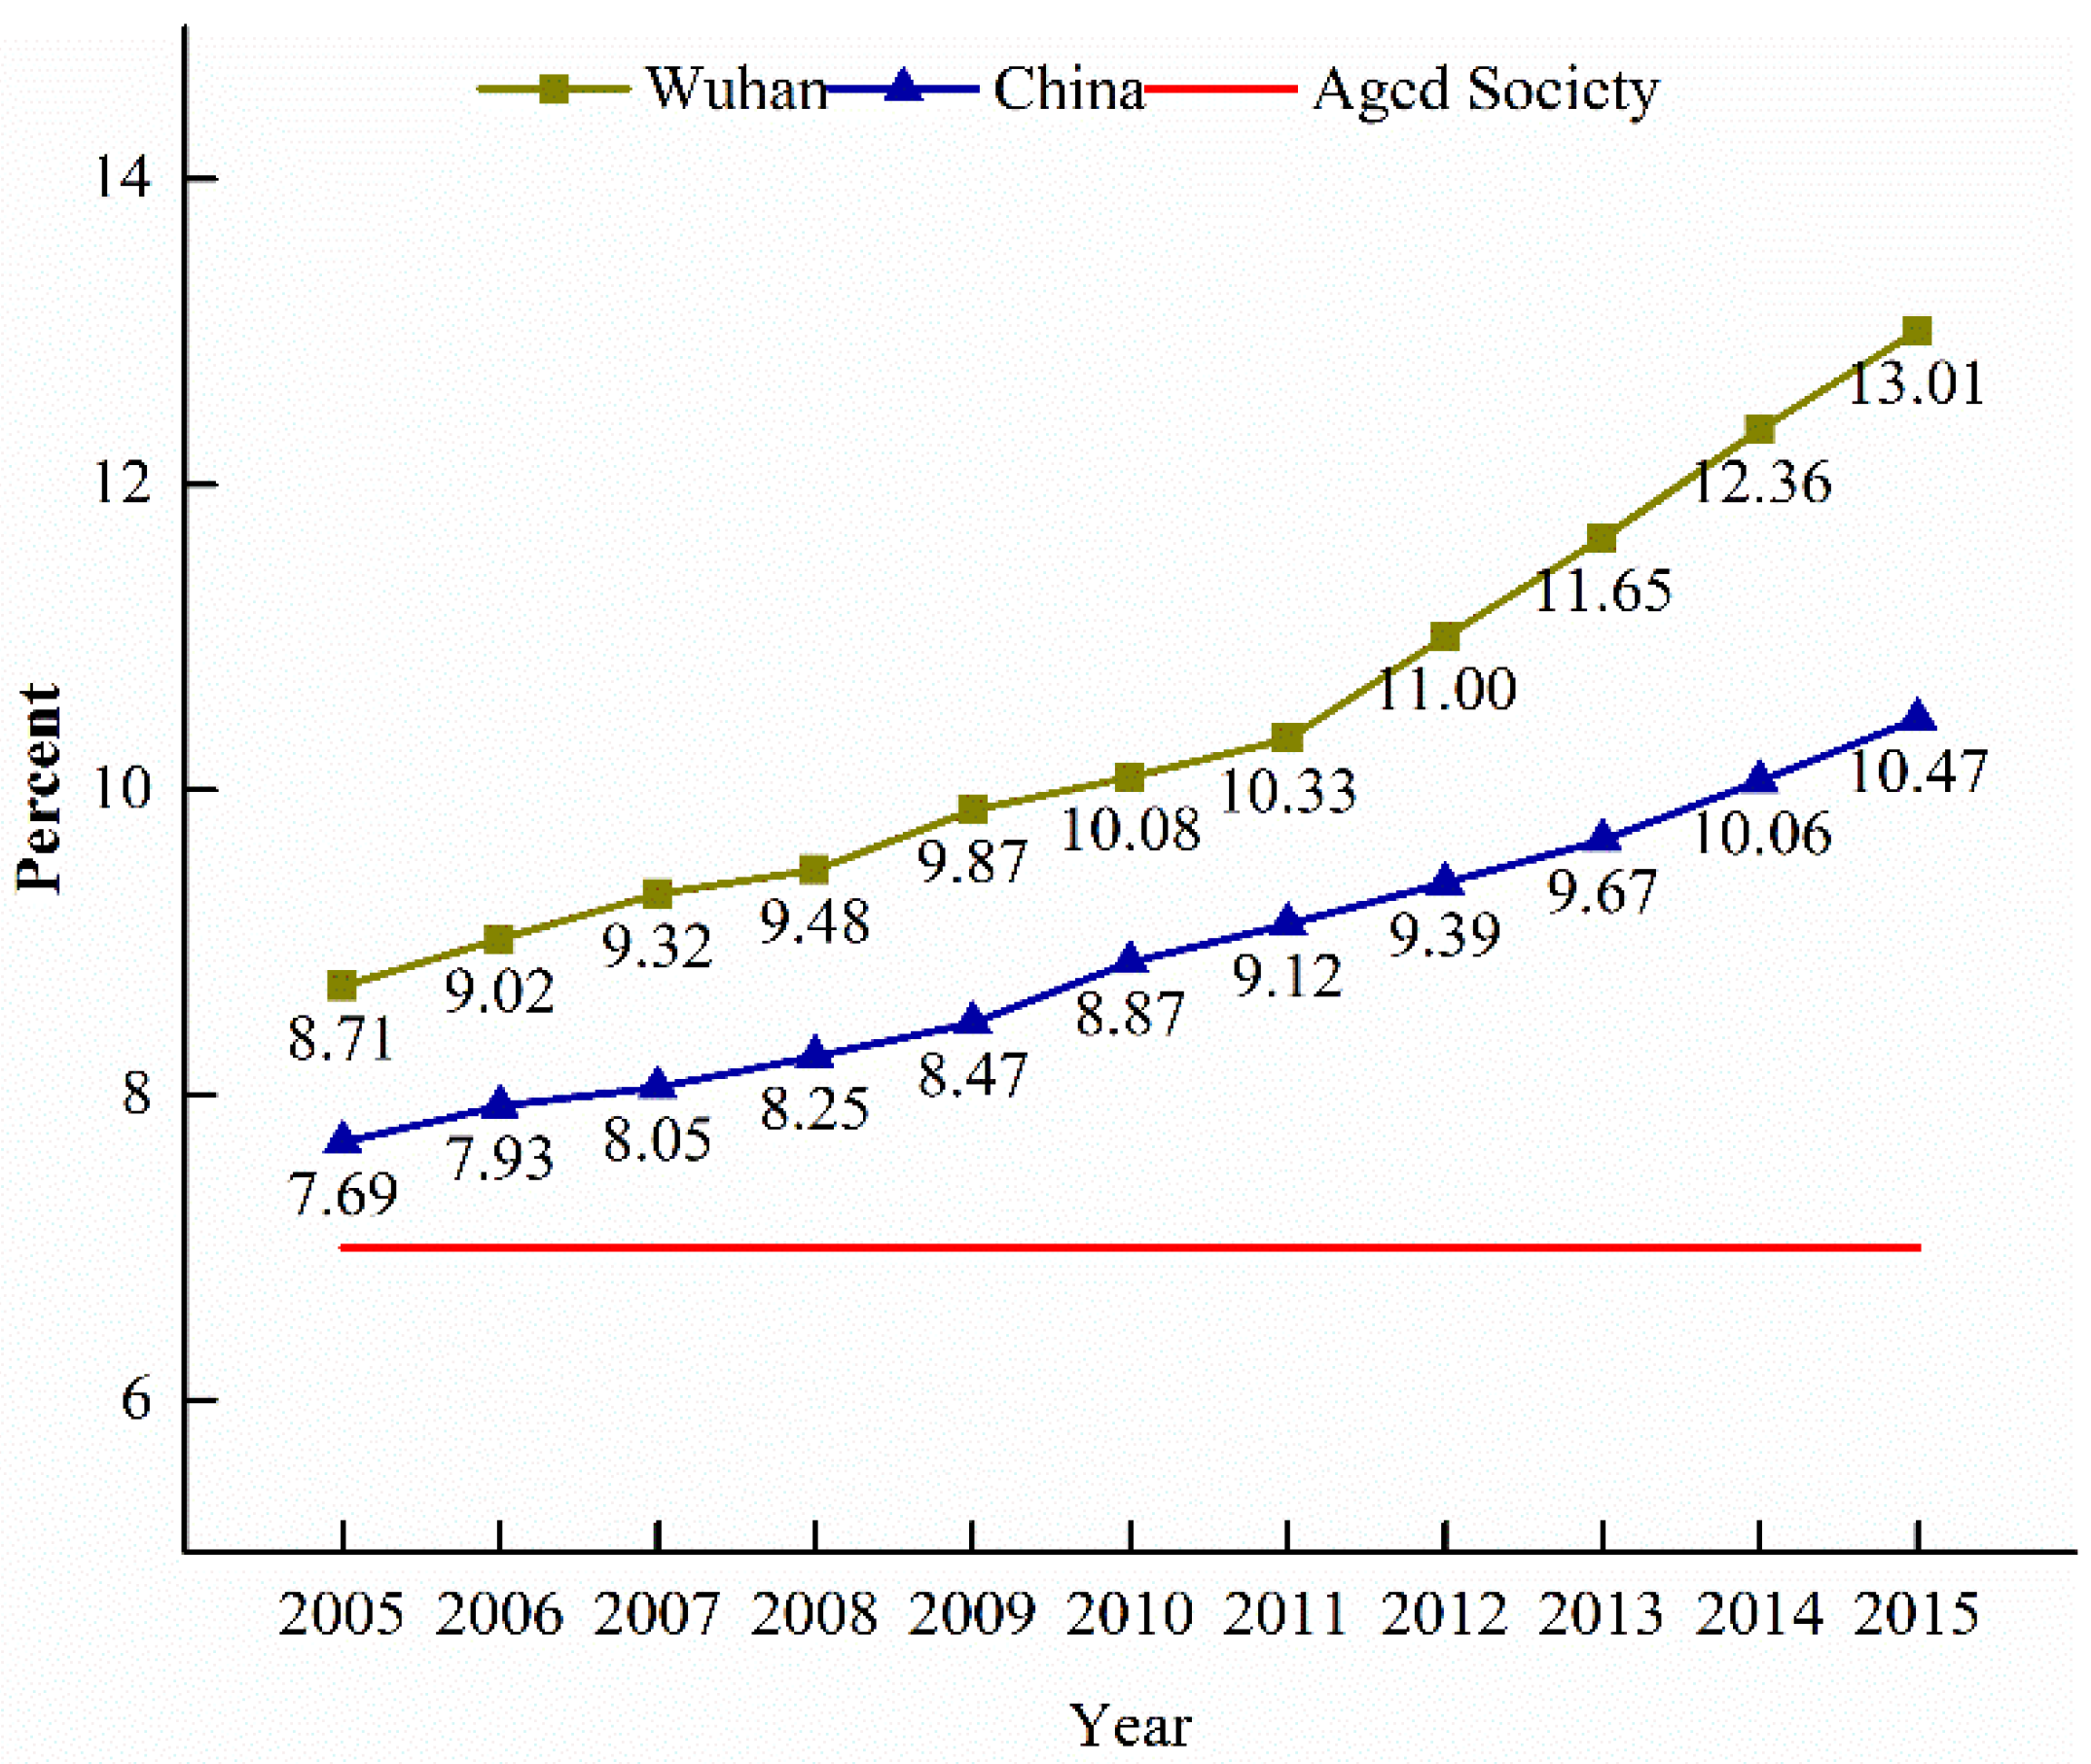
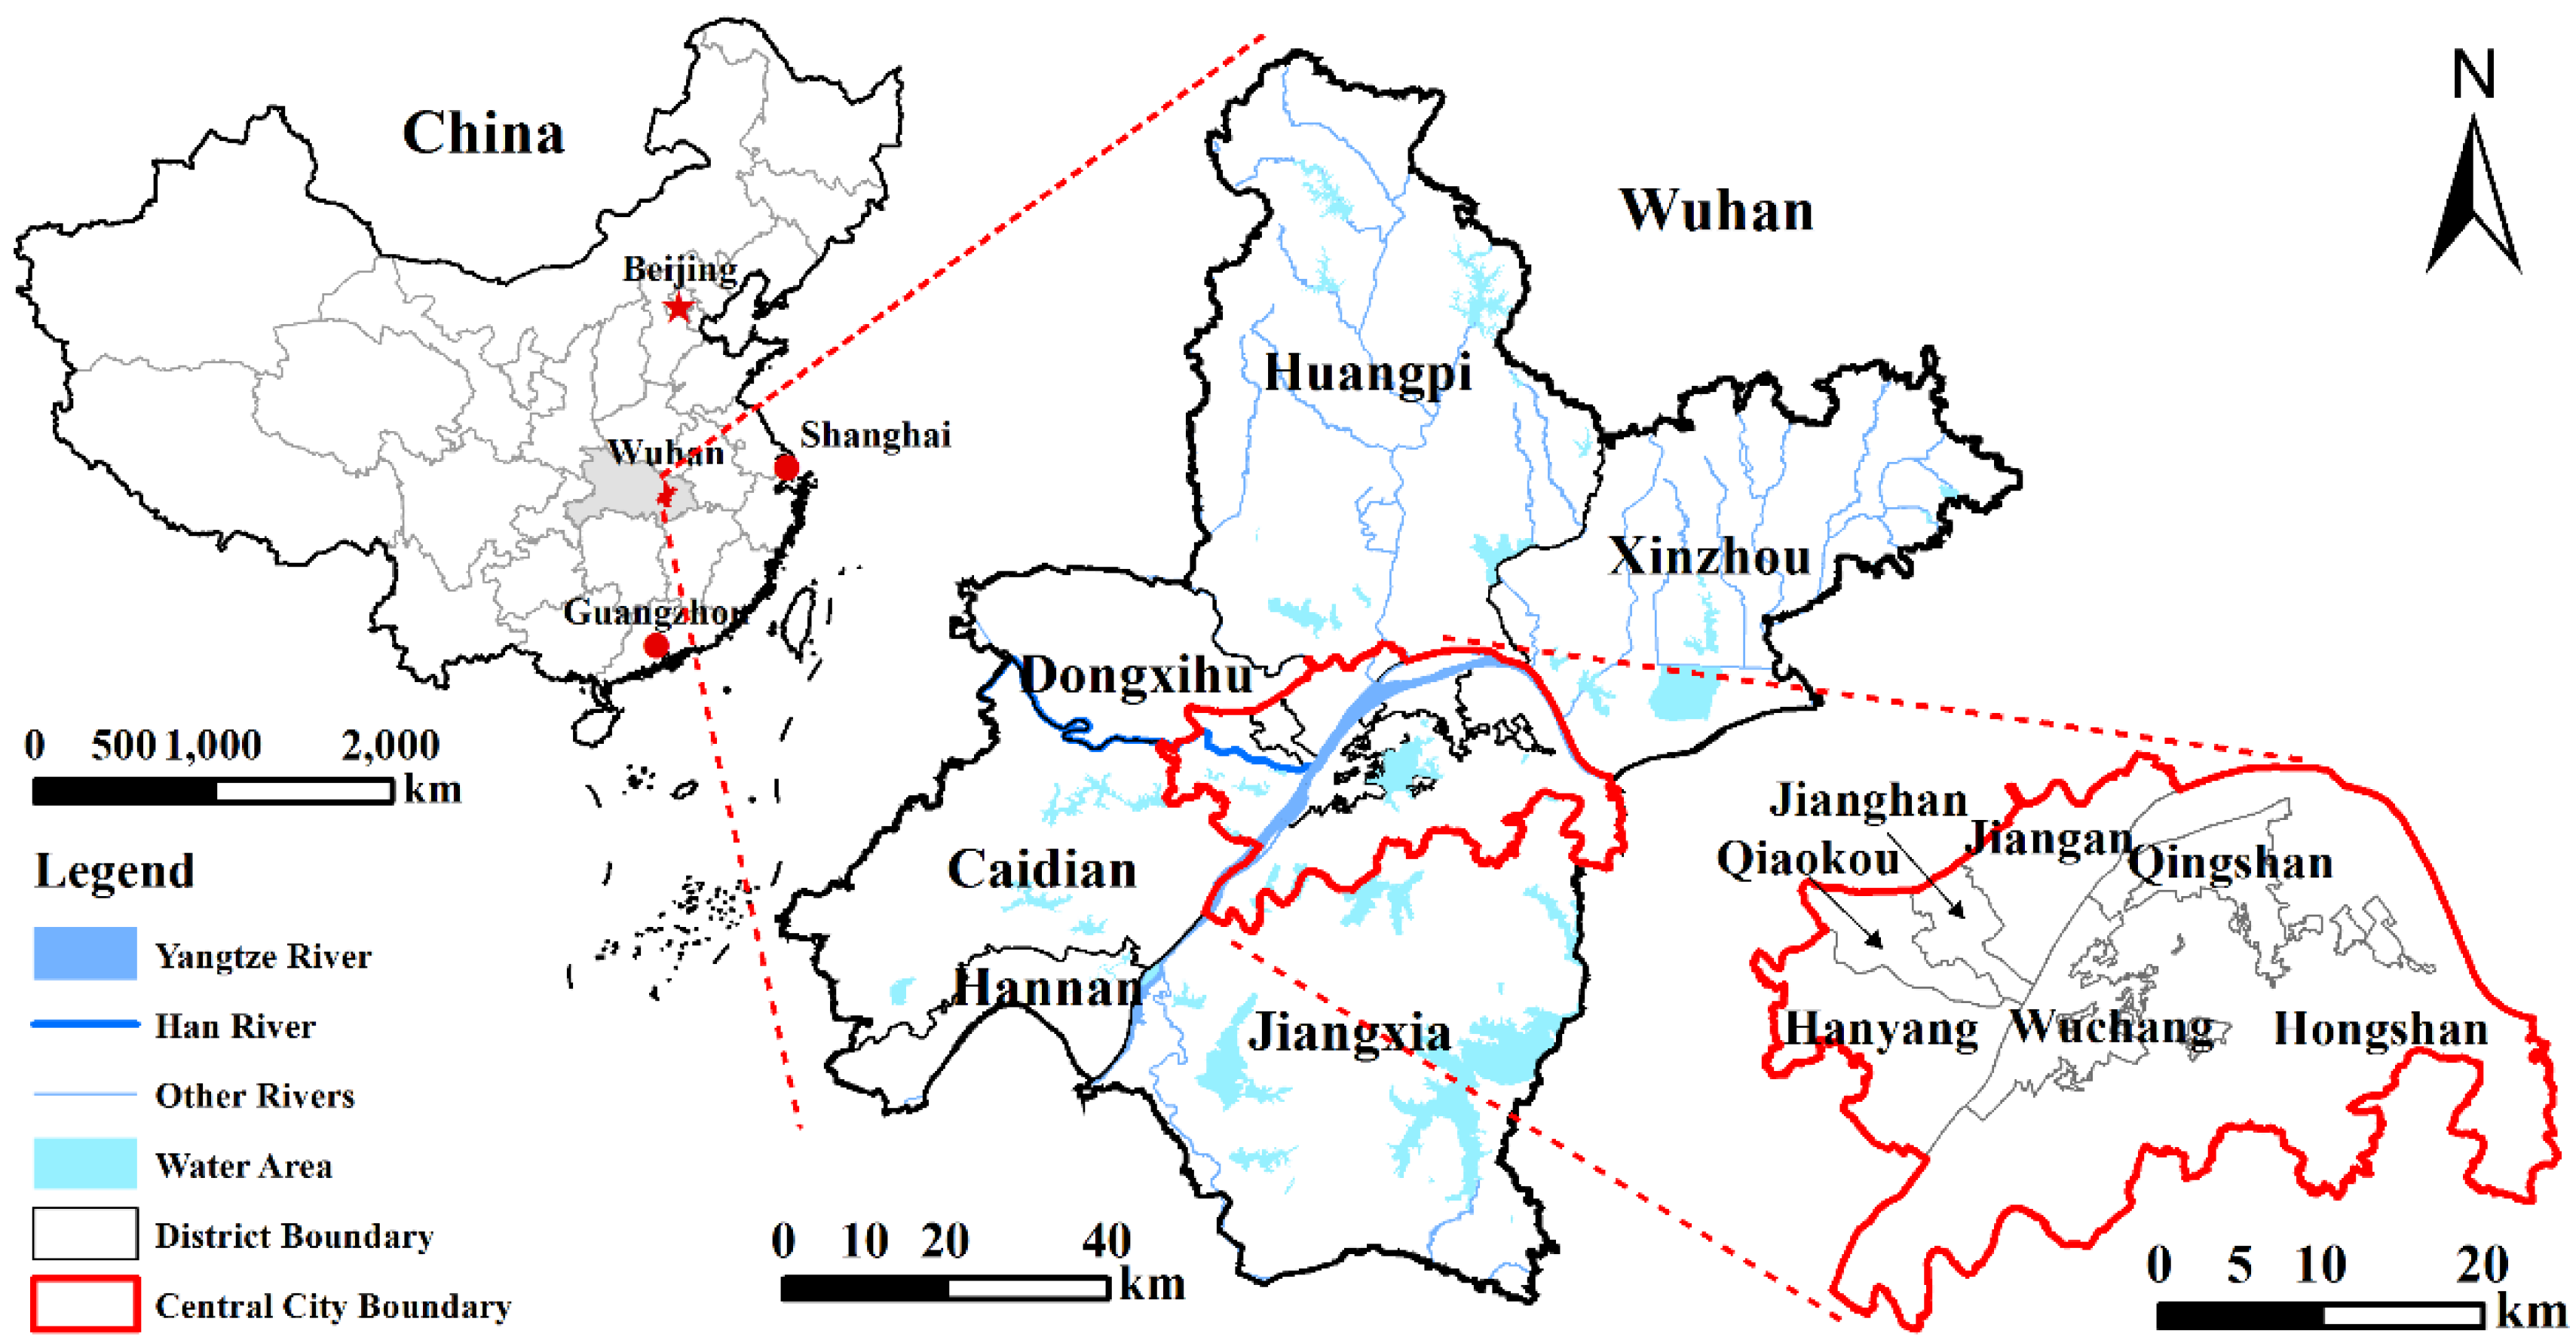
2.1.1. Study Area

Wuhan is the capital of Hubei Province located in Central China (29°58′–31°22′ N and 113°41′–115°05′ E). The intersection of the Yangtze River (the longest river in Asia and the third longest one in the world) and the Hanjiang River (the largest tributary of the Yangtze) is in the central city. Wuhan covers an area of 8596.2 km2, which includes a central city area of 863 km2. As the political, economic, cultural, educational, financial, and transportation center of Central China, Wuhan is experiencing rapid economic growth and urbanization. In 2014, the population was 10.61 million, among which the non-agricultural population accounted for 67.6%. Furthermore, its GDP is 1006.95 billion RMB [40]. Wuhan is the largest and most populous city in Central China and consists of 13 administrative districts: seven districts in the central city, with six districts in its suburbs (Figure 2). The central city’s local residents are basically a non-agricultural population, while the majority of suburban residents are farmers. In this study, Wuhan is divided into two parts: the urban area (i.e., the central city) and rural areas (i.e., the suburbs).

2.1.2. Data Preparation

Spatial accessibility assessment involves three factors: supply, demand and distance. Accordingly, the data used for the assessment of the spatial accessibility of RACFs in Wuhan includes three categories: aged population (aged 65 and above in this study), RACFs, and traffic network. The smaller the spatial statistical units are utilized, the more detailed spatial features can be revealed, meanwhile, the assessments of spatial accessibility can be more reliable [41].This study applied the village-level spatial unit, in other words, China’s smallest administrative unit as the aged population statistical unit.

Aged Population

The aged population data were used to measure the demand for aged care services in the accessibility assessment. The demographic data in this study were derived from the Sixth National Census and the household registration of Public Security Departments in 2013. Population locations were represented by the positions of the village committee in the results of the first national census of geographical conditions. Referring to previous studies [18], Wuhan’s village-level aged population was calculated from the total population (household registration) by multiplying the proportion of the aged population in each township (sixth national census).

Residential Aged Care Facilities (RACFs)
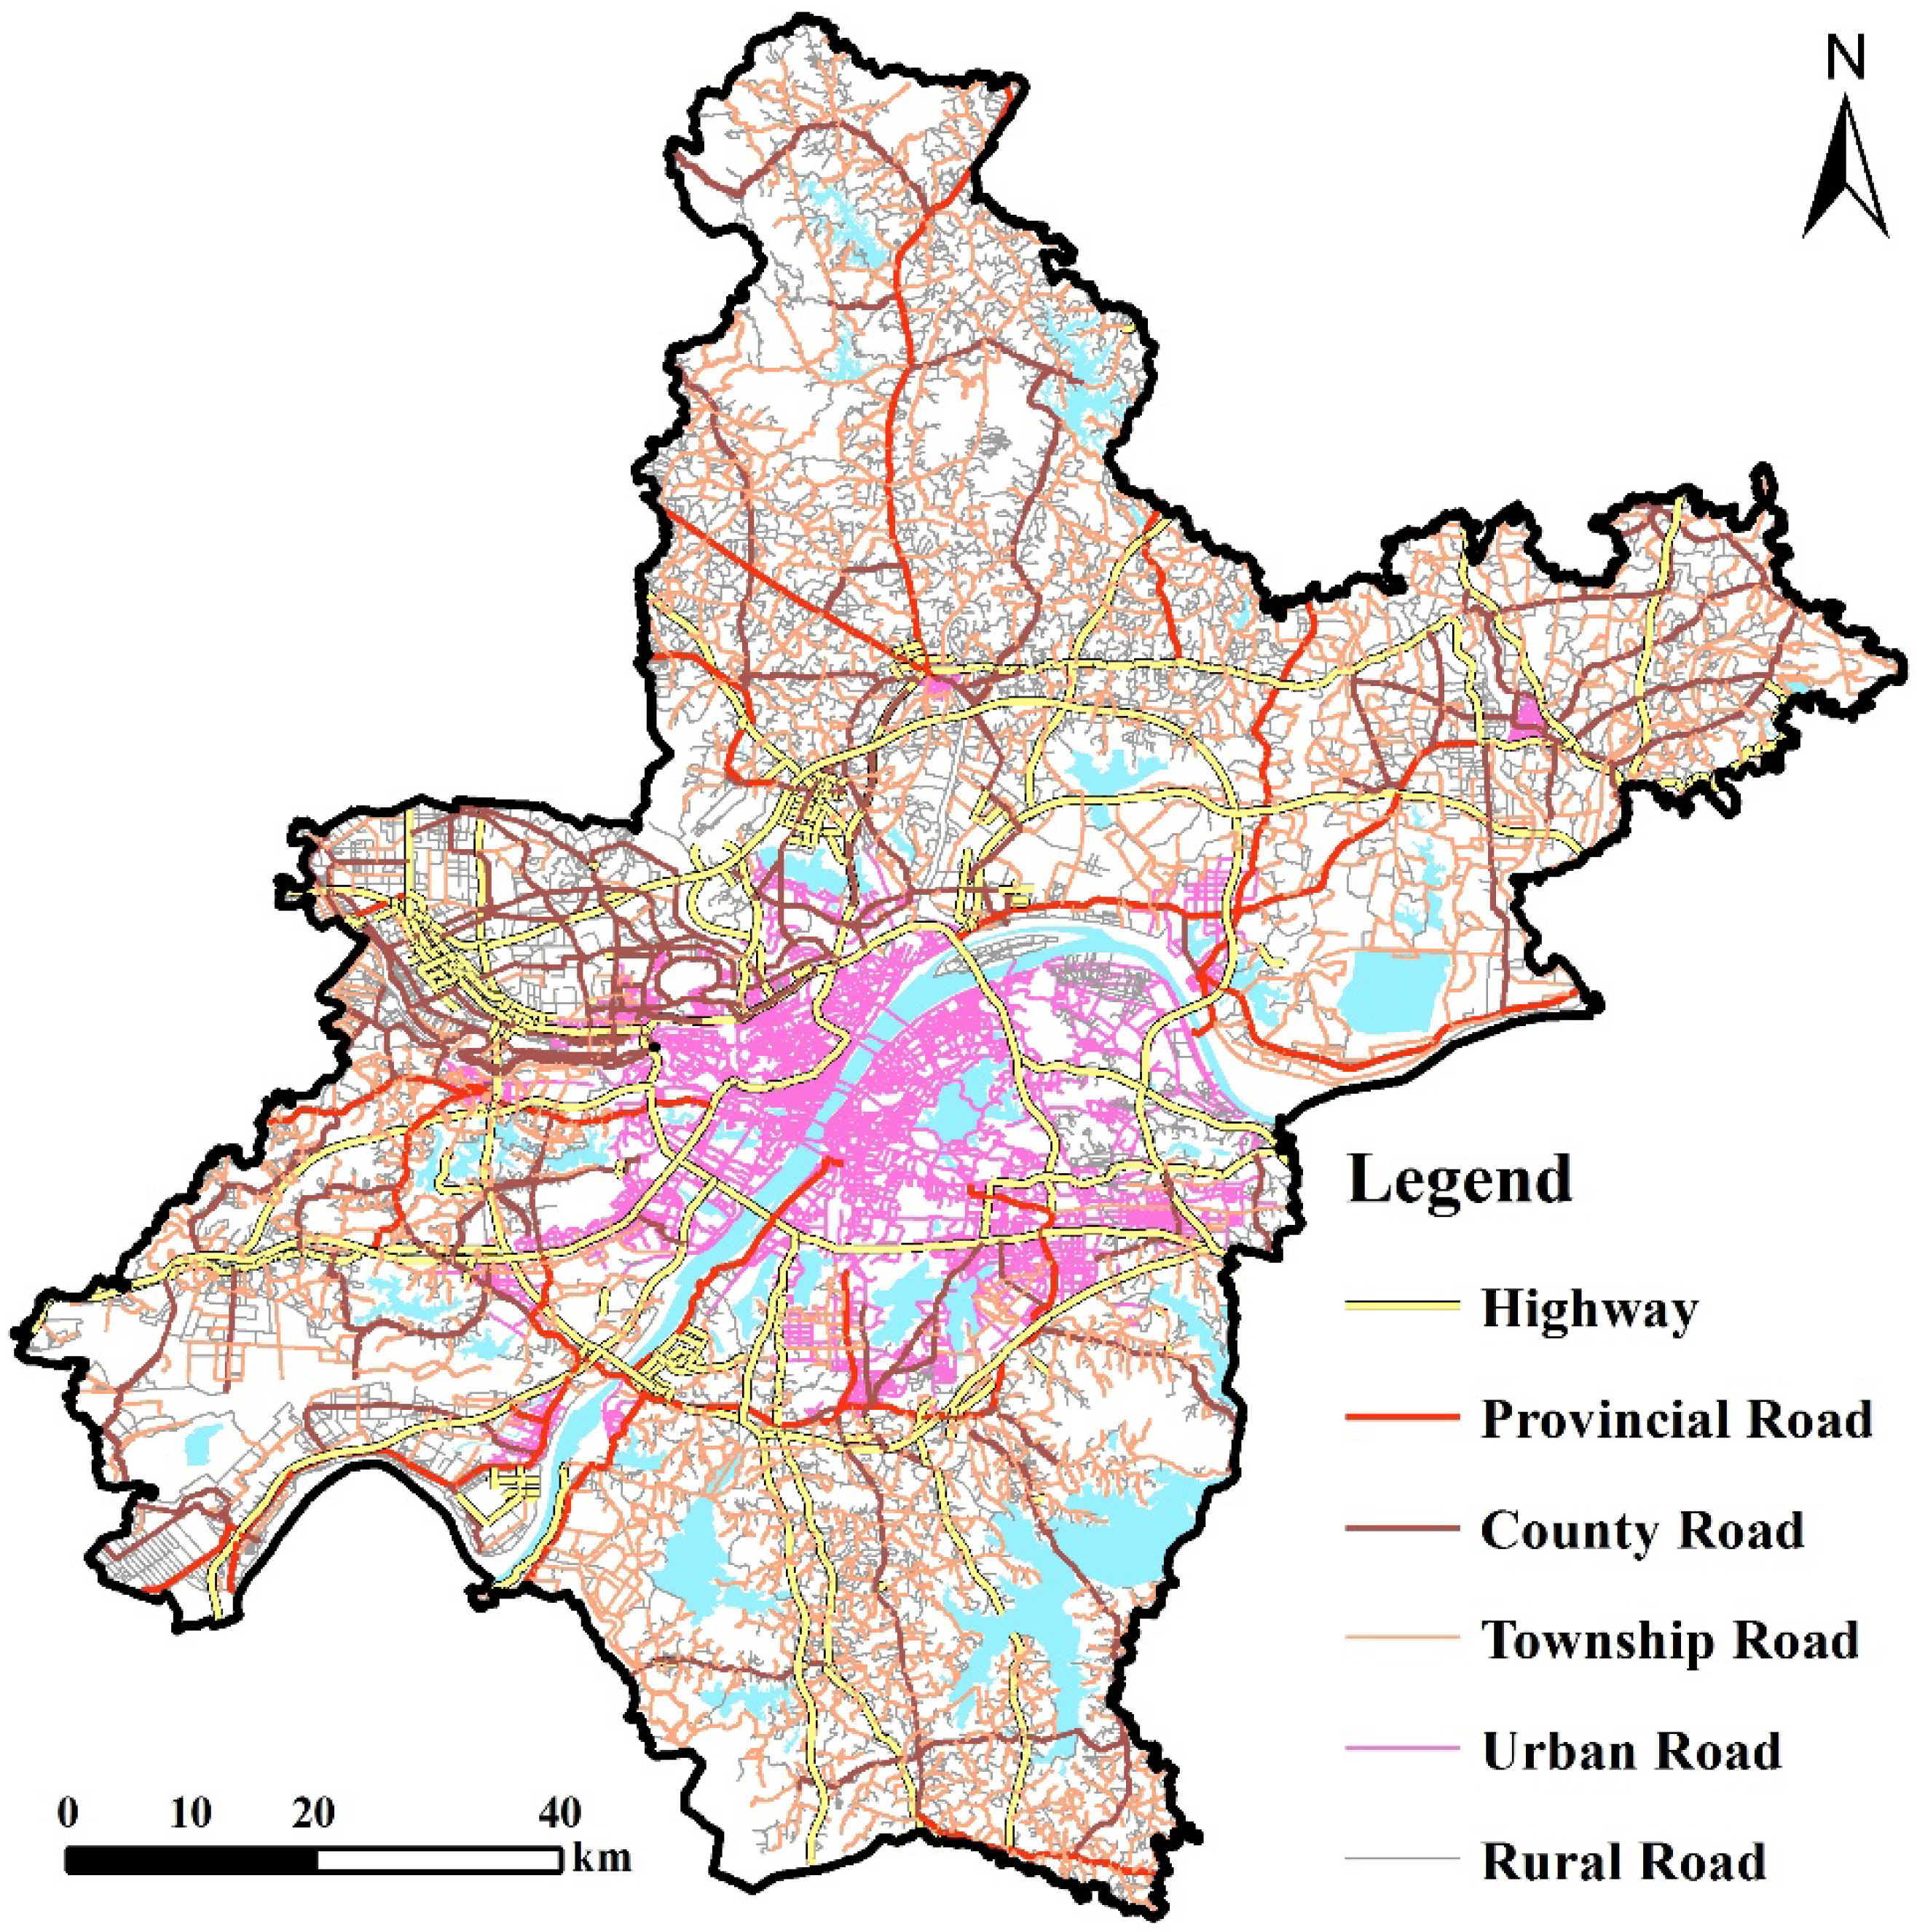
The supply of aged care services in the accessibility assessment was measured by the number of beds available in the RACFs of the targeted area. Wuhan’s RACFs have many forms, mainly including welfare homes and nursing homes. The RACFs data (with attributes of names, addresses, and ownership) were collected from the Wuhan Civil Affairs Bureau (WCAB) on its website [42]. The latest data were updated in May 2016. The number of beds was obtained from the relevant departments of the Civil Affairs Bureau. We collected 94 public RACFs and 142 private RACFs.

Traffic Network

The traffic network data were used to calculate the time cost to measure the distance between the points of supply and demand. The data were taken from the results of the First National Census of Geographical Conditions (FNCGC). The acquired road data have a higher spatial resolution and the spatial distribution of all kinds of roads is very dense. The main types of roads are highways, provincial roads, county roads, township roads, rural roads and urban roads (see Figure 3). The time cost was employed to measure the distance between the locations of supply and demand. According to China’s highway technical standards and the Annual Report on Traffic Development in Wuhan [43], the standard speed is separately set at 60 km/h for highways, 40 km/h for provincial highways, 30 km/h for county roads, 20 km/h for township roads, 15 km/h for rural roads and 25 km/h for urban roads.

2.2. Methods

2.2.1. MCSG2SFCA Method

Based on the number of beds and the Design Code for Buildings of Elderly Facilities issued by Ministry of Housing and Urban–rural Development [44], the RACFs were divided into three types: large (Beds ≥ 300), medium (300 > Beds ≥ 100) and small (Beds < 100).
The service distance threshold of RACFs depends on facility type and research area characteristics. Based on the traffic network in Wuhan and the speed of different grade roads, the O-D cost matrix was established by using ArcGIS network analysis tool, and the shortest time distance of each residential area to RACFs was calculated. The maximum, minimum and average time distance of each residential area to the shortest RACFs were 51.6 min, 1.3 min and 22.3 min respectively. Referring to the research on spatial accessibility distance threshold, Dang (2013) and Ren (2014) use the average service distance and the 1–2 times distance of optimum service range as the analysis time distance threshold respectively [45,46]. Considering the different use of RACFs and other facilities (such as shopping, park, hospitals, etc.), the trip frequency of RACFs is smaller, a relatively large distance threshold can be used. Therefore, this paper uses the approximate value (50 min) of the maximum time distance of each residential area to the shortest RACFs as the service distance threshold of the medium RACFs. 100 and 25 min were used for the large and small RACFs, respectively (Table 1). Then the spatial accessibility scores of the RACFs were calculated according to Equations (1)–(4).
The MCSG2SFCA method to calculate the spatial accessibility of RACFs is as follows:
Step 1, for each RACF in K-level type located in point j, compute the RACFs beds to the aged population ratio Rkj within its catchment area (Equation (1)):
R k j = S j i ( d i j d 0 ) P i G ( d i j , d 0 )
where d0 is the service distance threshold of k-level type RACFs, dij is the time distance from the village located at point i to the RACF located at point j, Sj is the number of beds in the RACF j, Pi is the number of aged population of the village i, and G(dij, d0) is the distance decay coefficient computed by the following Gaussian function (Equation (2)):
G ( d i j , d 0 ) = { e 1 2 × ( d i j d 0 ) 2 e 1 2 1 e 1 2 if   d i j d 0 0 if   d i j > d 0  
Step 2, for each demand (aged population) unit located in point i, a new catchment area is created for different levels of RACFs. Compute its accessibility Ai by summing up the beds of each RACF in the all levels to aged population ratio Rki within the catchment area (Equation (3)):
A i = k = 1 3 l ( d i j < d 0 ) R k l × G ( d i j , d 0 )
where dij is the time distance between i and l.

2.2.2. Contribution of Public or Private RACFs

In order to make a contrast of service capacity between public RACFs and private RACFs better, it is necessary to quantitatively calculate the contribution of public or private RACFs to the capacity of aged services. The formula is as follows (Equations (4) and (5)):
C p u b = A p u b A p u b + A p r i
C p r i = A p r i A p u b + A p r i
where Cpub and Cpri is the contribution of public RACFs and private RACFs, Apub and Apri is the accessibility score of public RACFs and private RACFs.

3. Results

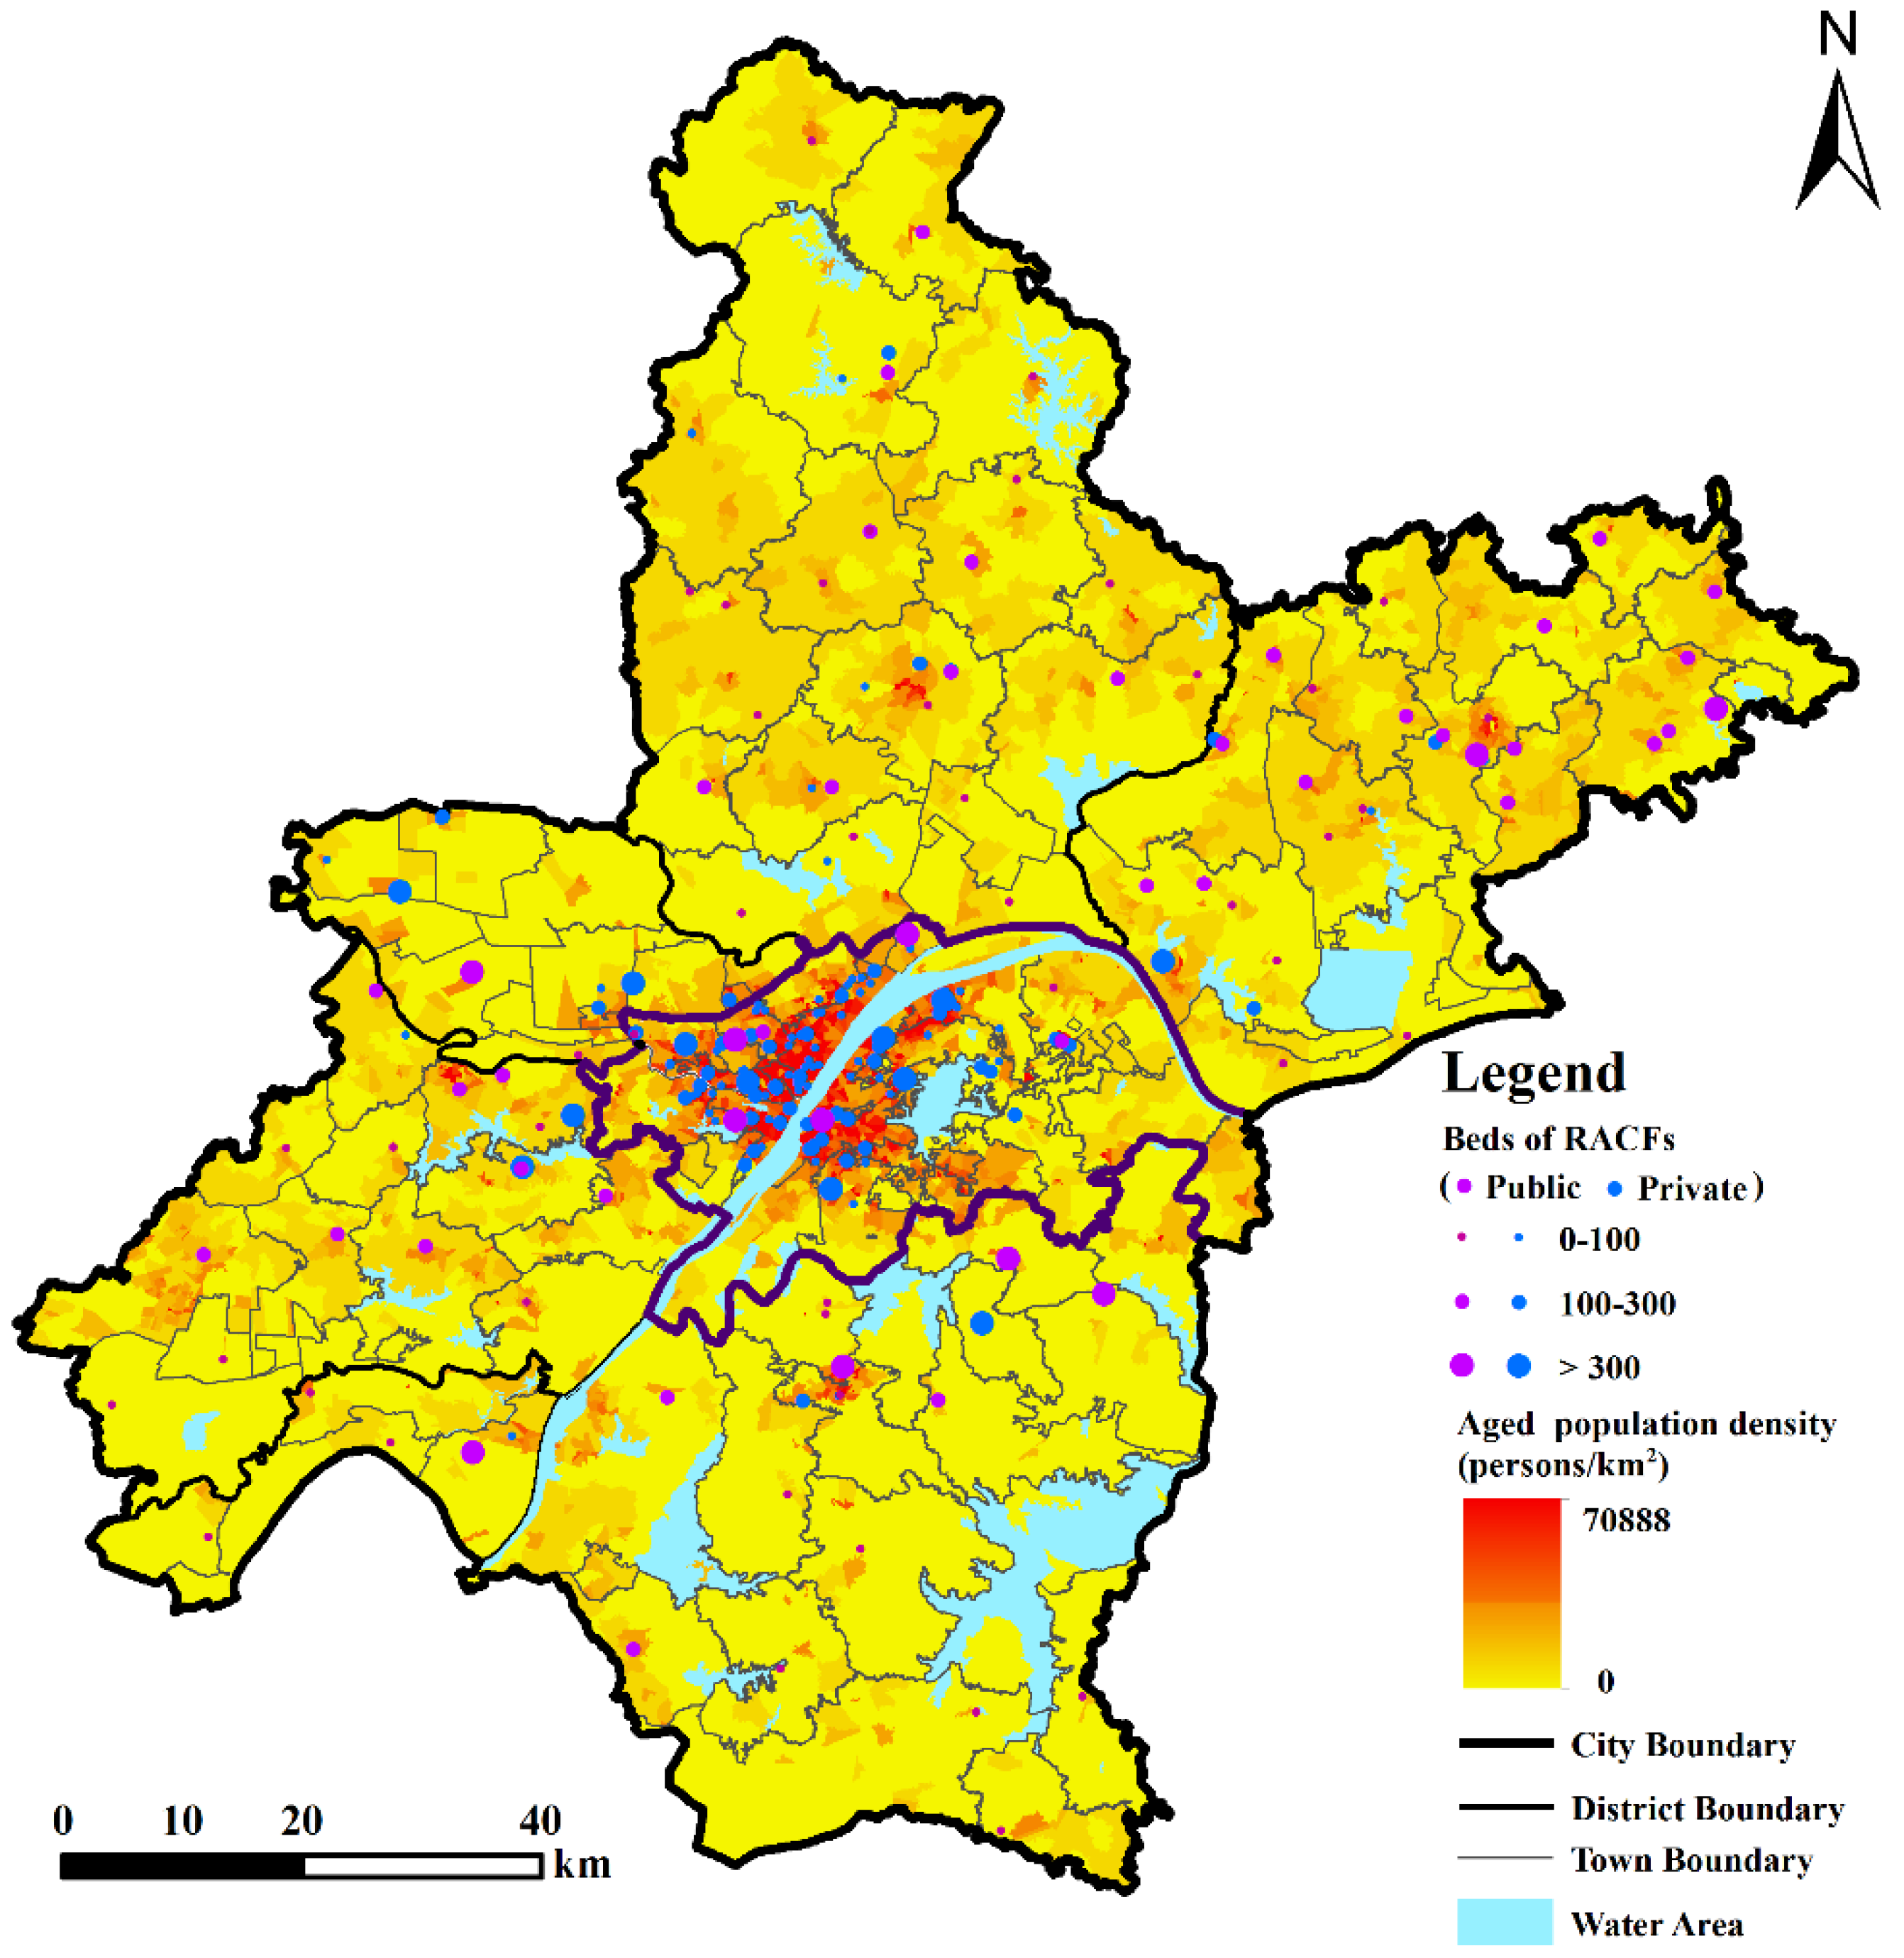
3.1. Distribution of Aged Population and Residential Aged Care Facilities

As the RACFs are targeted at the aged population, the spatial distribution of the aged population reflects the demand of aged care services and is an important reference factor for the allocation of RACFs [18]. As shown in Figure 4, the distribution pattern of the aged population in Wuhan is such that the central city area is dense and its suburbs are sparse. The aged population density in Wuhan is 140 persons per km2. The central city aged population density is 798 persons per km2, and the suburban aged population density is 64 people per km2. The huge variation in the spatial distribution of the aged population is a prima facie argument for the reasonable allocation of residential care resources.
The RACFs are mainly concentrated in the central city, and the number of RACFs is significantly reduced in the suburbs. An obvious phenomenon is that many new and larger RACFs are located in the suburbs, and the distribution of new RACFs tends to be suburbanized. The public RACFs in Wuhan have a city–district–subdistrict (township) multi–level system, and their distribution is relatively balanced throughout the various regions. The distribution of private RACFs is mainly in the central city, while that of other areas (especially the rural areas in the outer suburbs) is normally sporadic. There is a large gap between the number of beds in different RACFs, the largest RACFs having 3200 beds, and the smallest one just 22 beds. The facilities in the central city are generally large, while the facilities in rural areas are smaller.

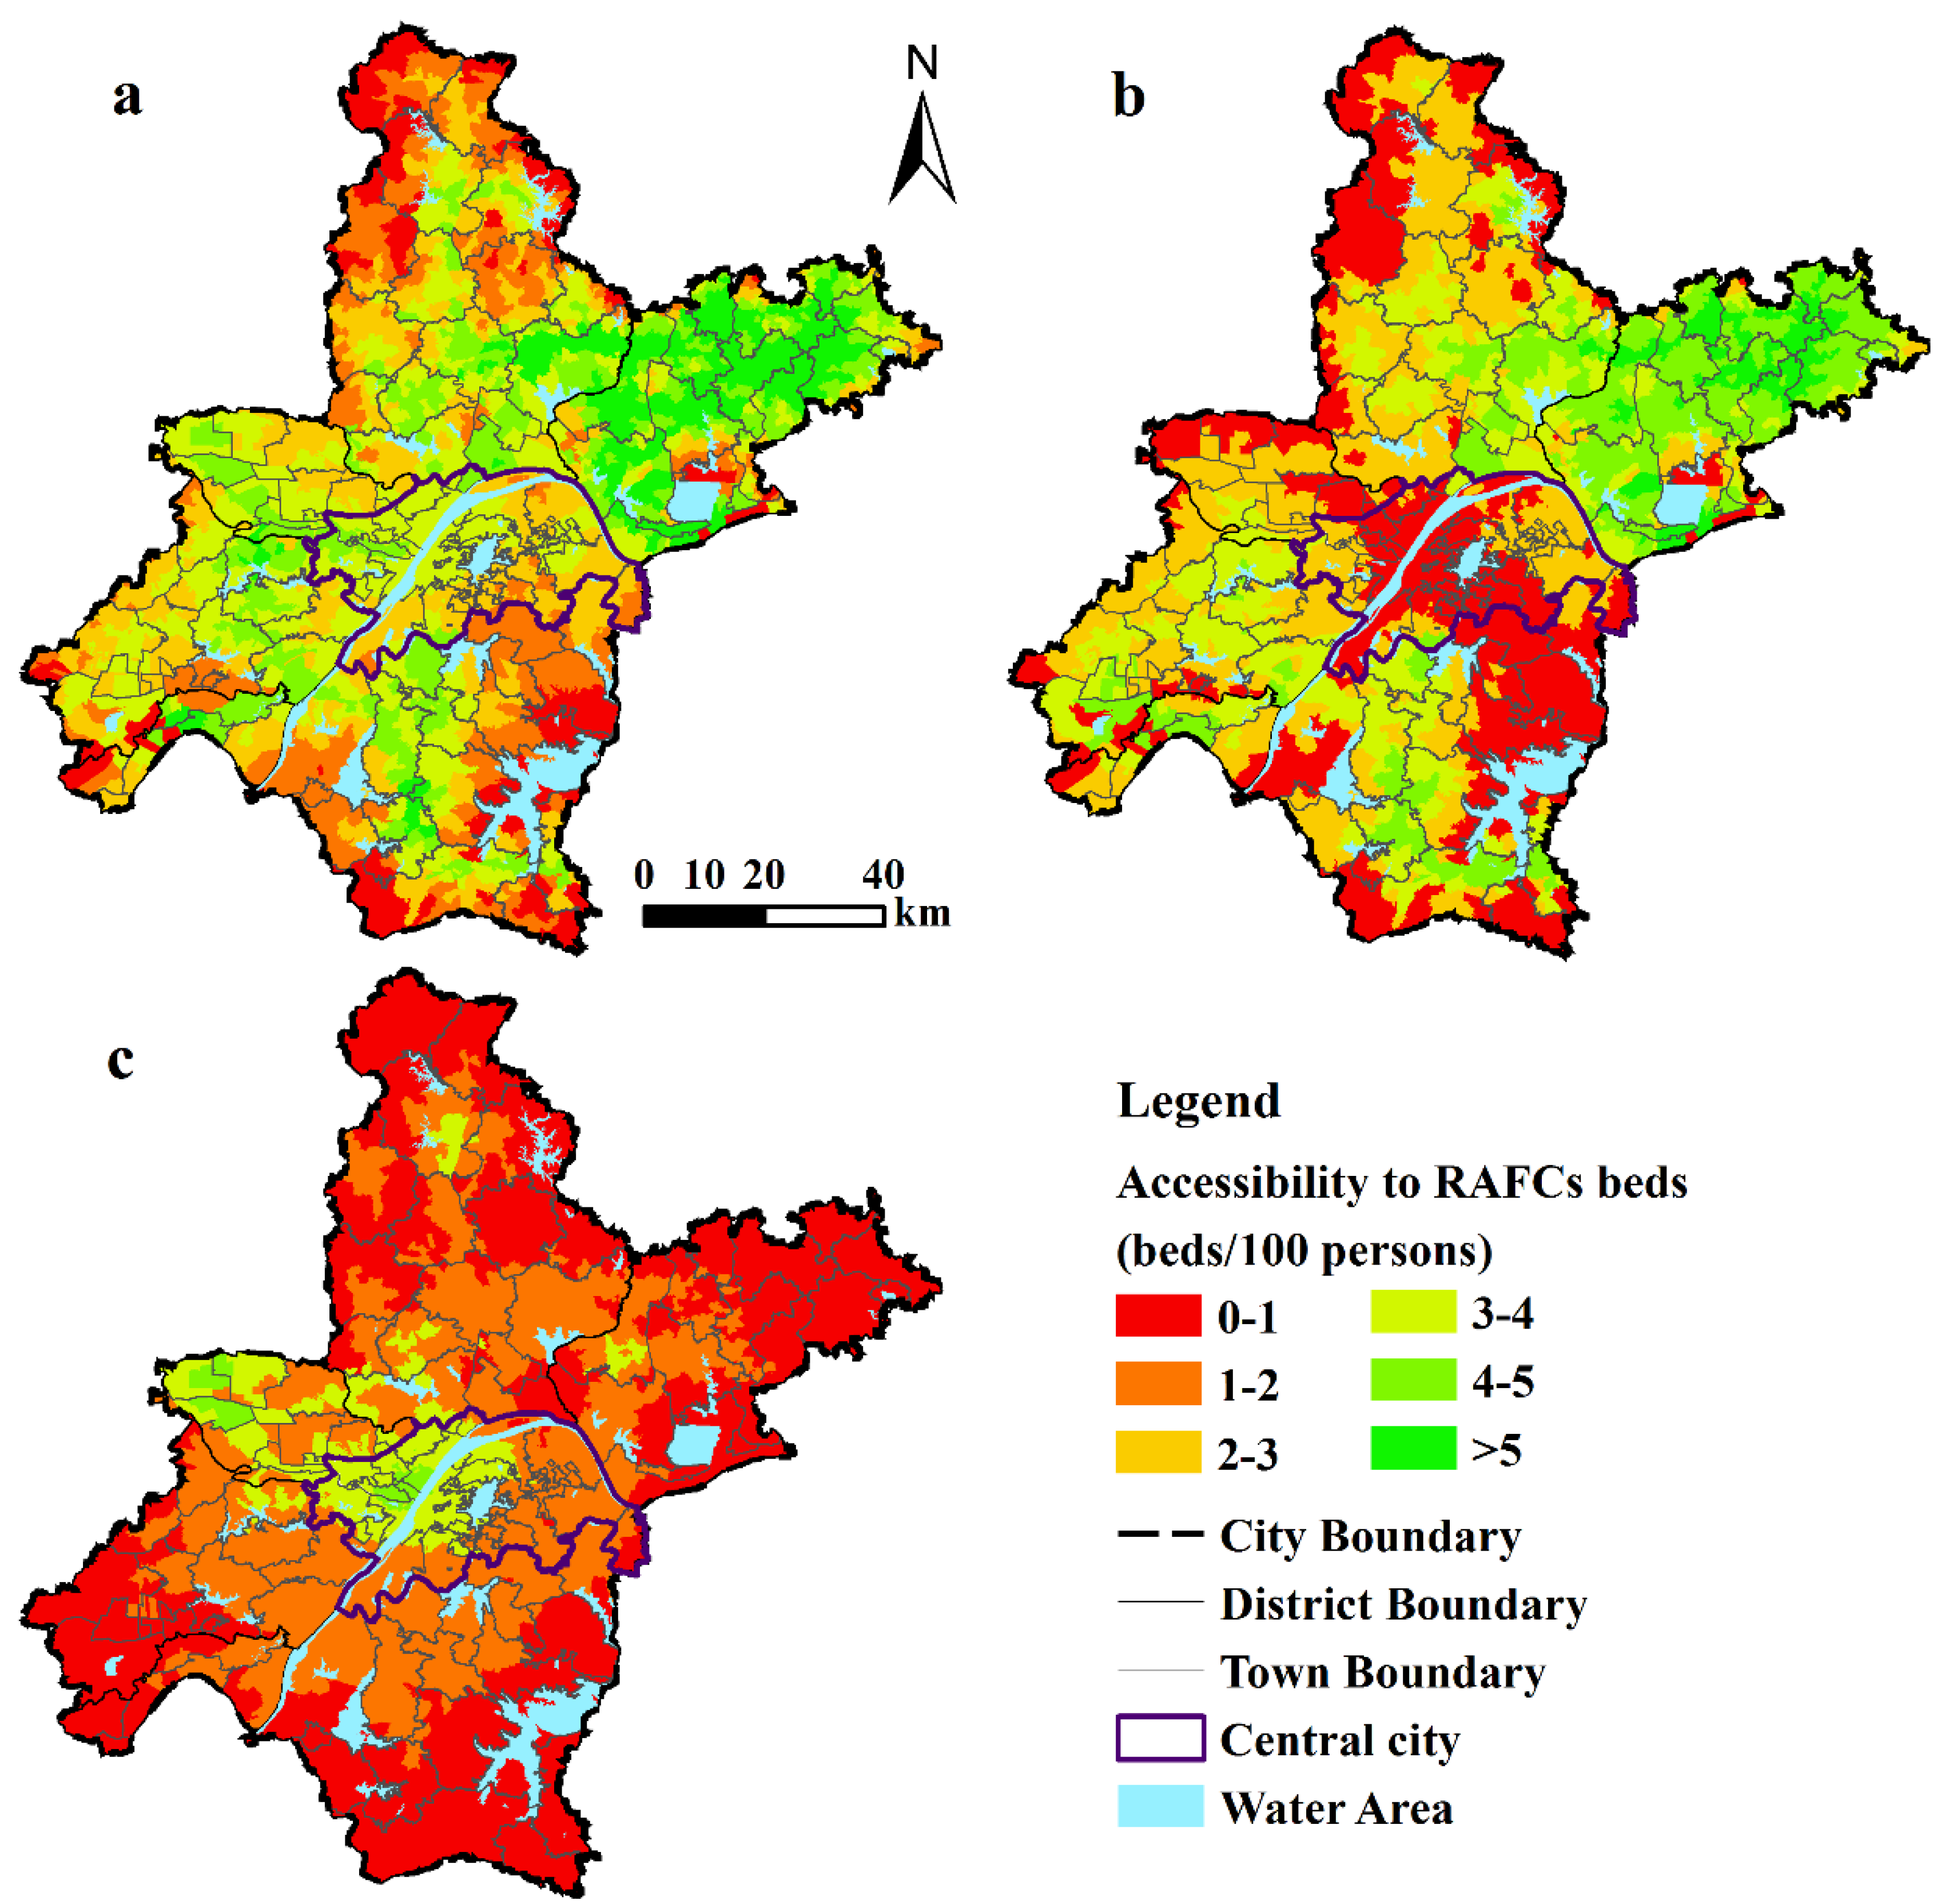
3.2. Spatial Pattern of Accessibility of RACFs

Based on the MCSG2SFCA method, the average score of the spatial accessibility to RACFs is 0.0341 in Wuhan; for understandable reasons, it can be expanded to explain that there are 3.41 RACFs beds available for every 100 elderly people. The distribution of the spatial accessibility of the RACFs has an obvious spatial difference (Figure 5). The spatial accessibility of RACFs is higher in the middle and lower in the north and south of Wuhan (Figure 5a). Compared with Figure 4 and Figure 5, the Xinzhou District is not only richer in regional care facility resources, but also lower in aged population density than the central city. Therefore, a higher accessibility score is obtained. Lower areas are mainly remotely rural areas located in the north of the Huangpi District and the south of the Jiangxia District, owing to insufficient RACFs and inconvenient traffic conditions.
Figure 5b shows that the accessibility of public RACFs in the central city is as low as in remote rural areas. The accessibility of public RACFs in the surrounding areas of the city is higher, especially the values in the northeast suburbs have spiking peaks. The accessibility of private RACFs is higher in the central city and shows a decreasing pattern from the city center outwards. The distribution trend of private RACFs is highly consistent in Figure 4, which reflects that the distribution of private RACFs is mainly affected by the aged population distribution. Figure 5b,c together enable us to distinguish the great differences between accesses to public and private RACFs. That is, the accessibility of private RACFs is lower than that of public RACFs in most areas.

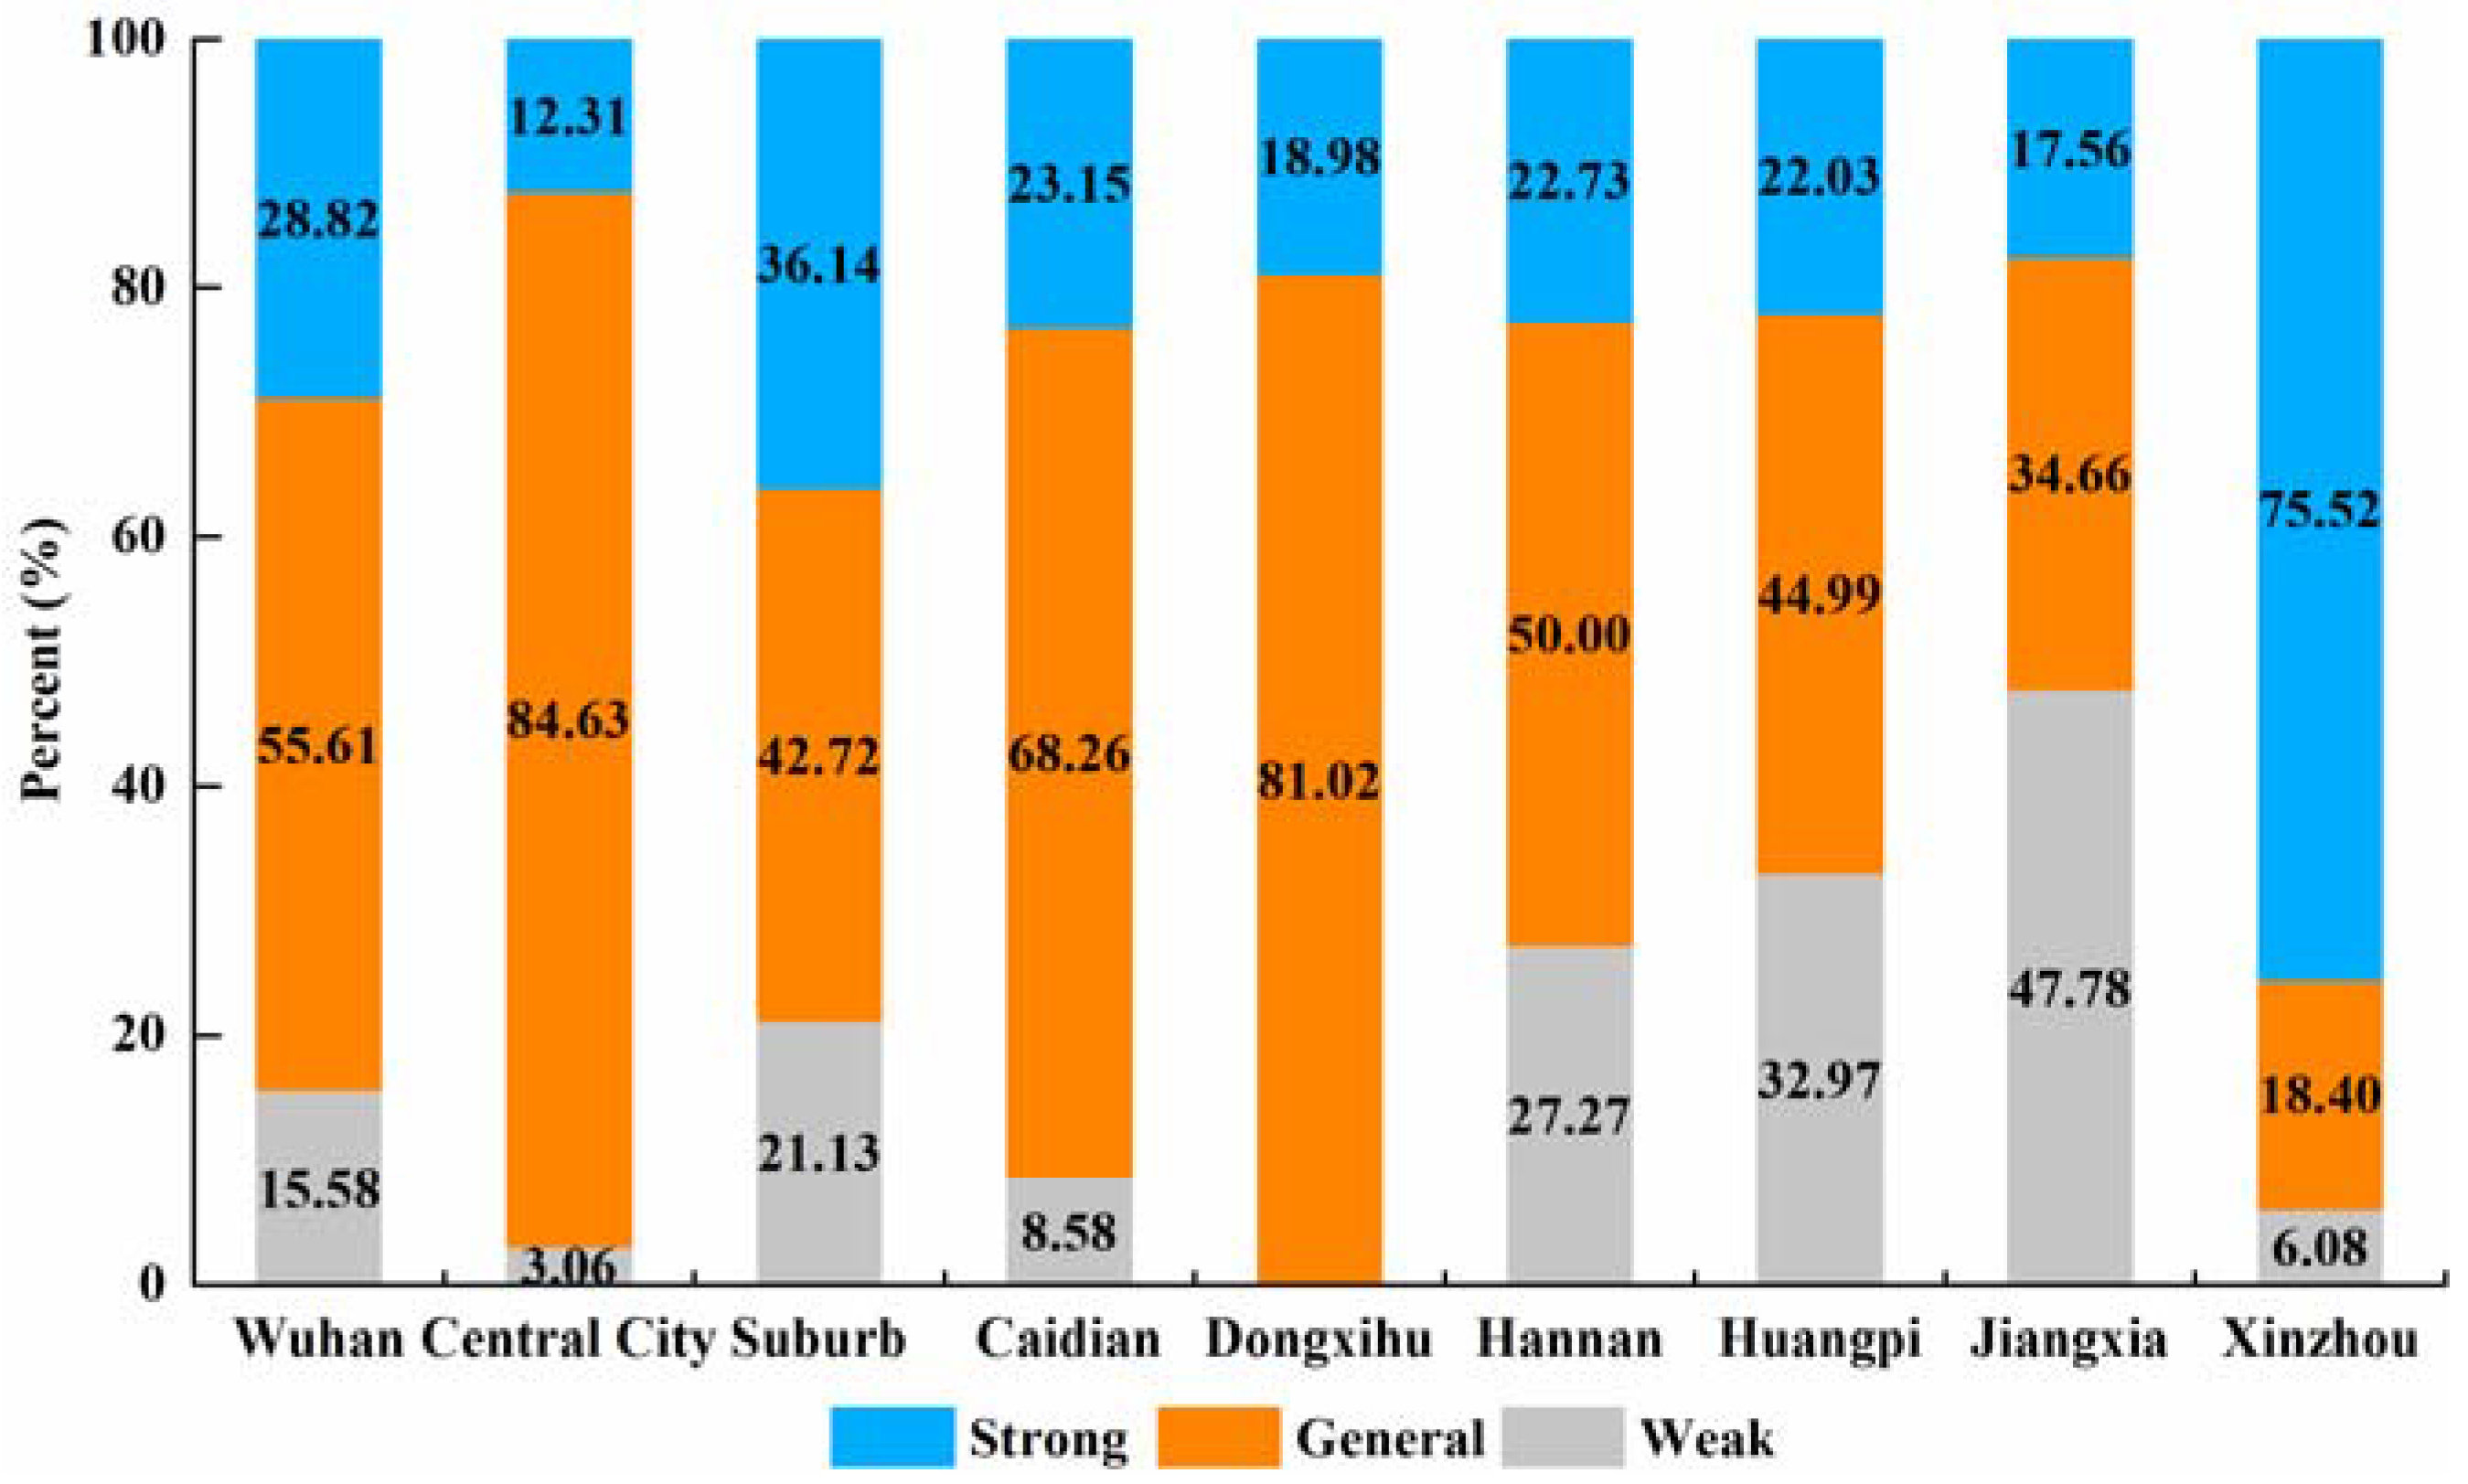
3.3. Aged Care Service Capability Analysis

In accordance with international standards that the number of RACFs beds per thousand elderly people is usually 40 to 50, and 40 RACFs beds per 1000 elderly people is the target set by the Ministry of Civil Affairs of China in 2020. That is, if the number of beds accessible to each 100 elderly people exceeds 4, it means that it is close to or reaching the goal set by Wuhan government (5 beds per 100 elderly people) with strong aged care service capability. On the basis of the analysis results of the MCSG2SFCA method, we classified the capacity of the aged care services in all areas in Wuhan into three levels: strong, general and weak levels based on the index of the number of beds accessible to each 100 elderly people (Strong: >4, General: 2–4, Weak: <2).
The proportion of strong, general and weak areas in Wuhan are 28.82%, 55.61% and 15.58%, respectively (Figure 6). The strong level areas fail to account for a larger proportion. That is, most parts of Wuhan have not yet reached the goal of aged care set by the government for 2015, without satisfying the need of the overall capacity of aged care services in Wuhan. In the central city, 84.63% of the region’s aged care service capacity is at the general level. The proportion of the areas with strong and weak aged care service capability only accounts for 12.31% and 3.06%. The internal differences are minor and relative equalization of aged care services can be achieved in most areas.
In the suburbs the proportion of strong areas is 36.14%, higher than that of the central city. There are a large number of villages in the suburbs, where the RACFs are located but the aged population density is much lower than that of the central city. This means that they can get a higher spatial accessibility than most of the central city. However, the areas with a weak level are also more in suburbs, accounting for 21.13%. This is much higher than that of the central city, where there are still a large number of underserved areas needed to enhance the capacity of aged care services. The gap between the regional aged care service capacity in rural areas is obvious. In the suburbs of the Xinzhou, Dongxihu, and Caidian districts, the aged care service capacity is better than in the outer suburbs of the Hannan, Huangpi, and Jiangxia districts. In the future, it should build more residential aged care facilities in suburbs and maintain optimization and upgradation to achieve a balanced development of public service facilities.

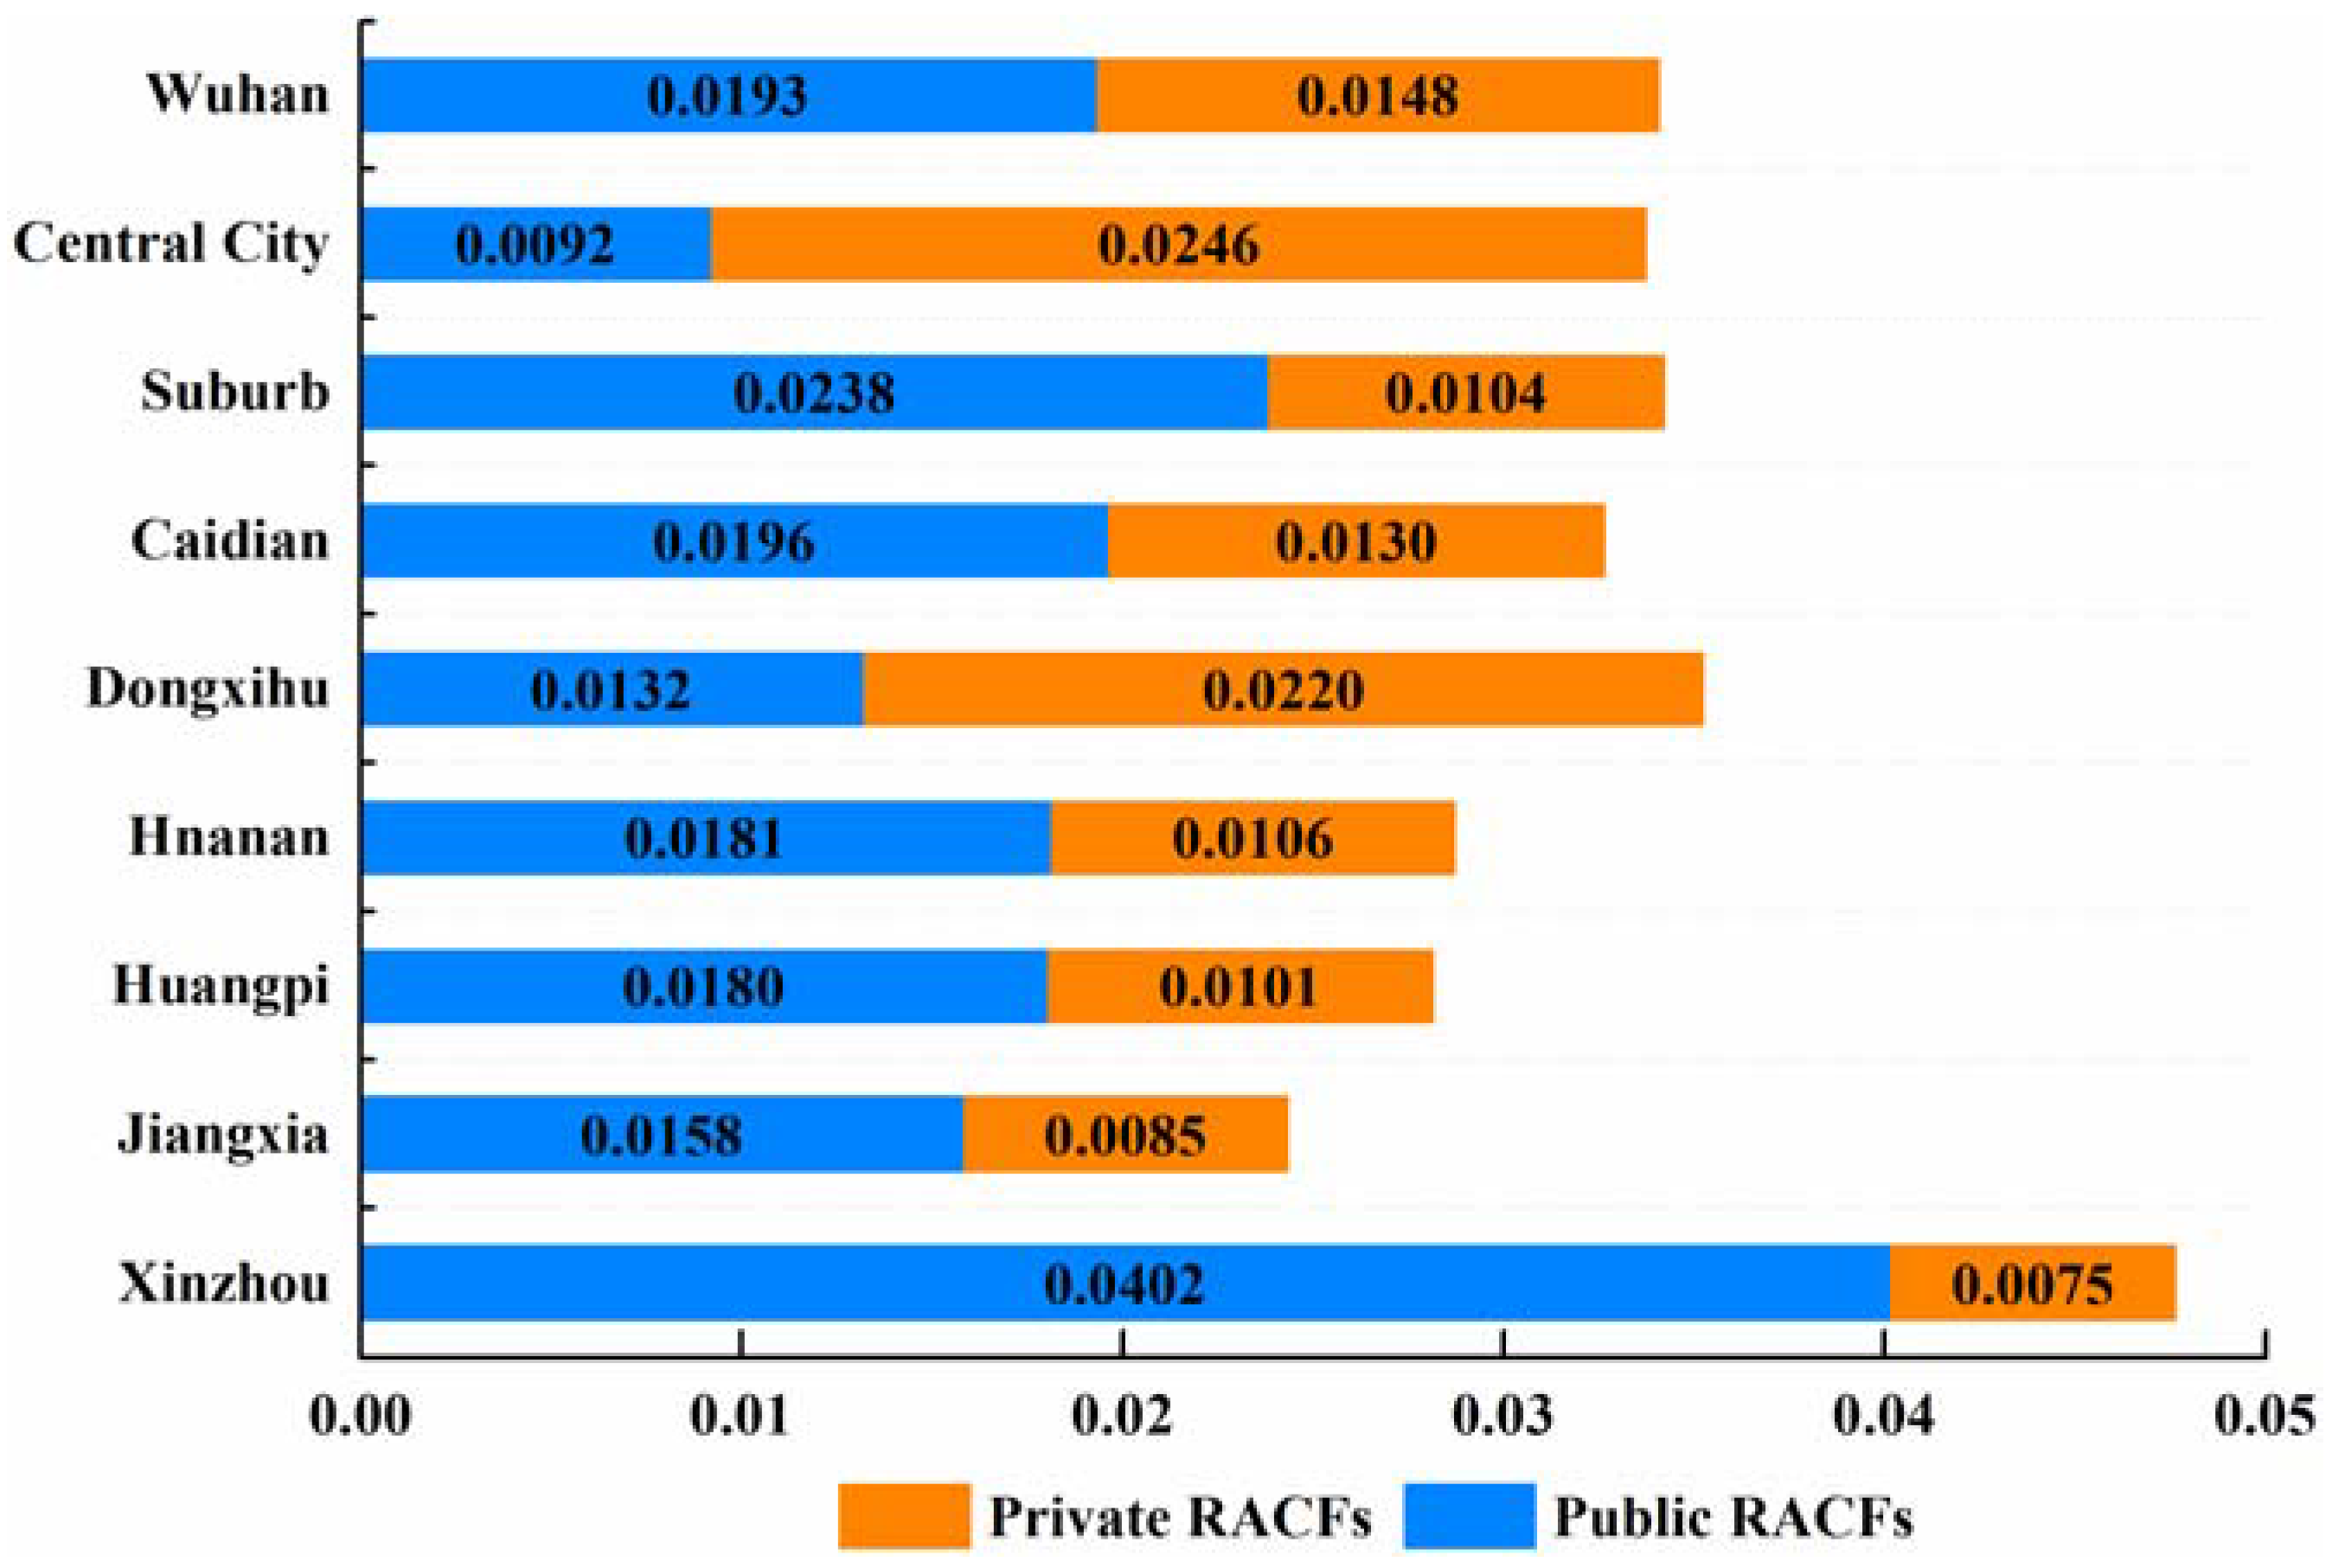
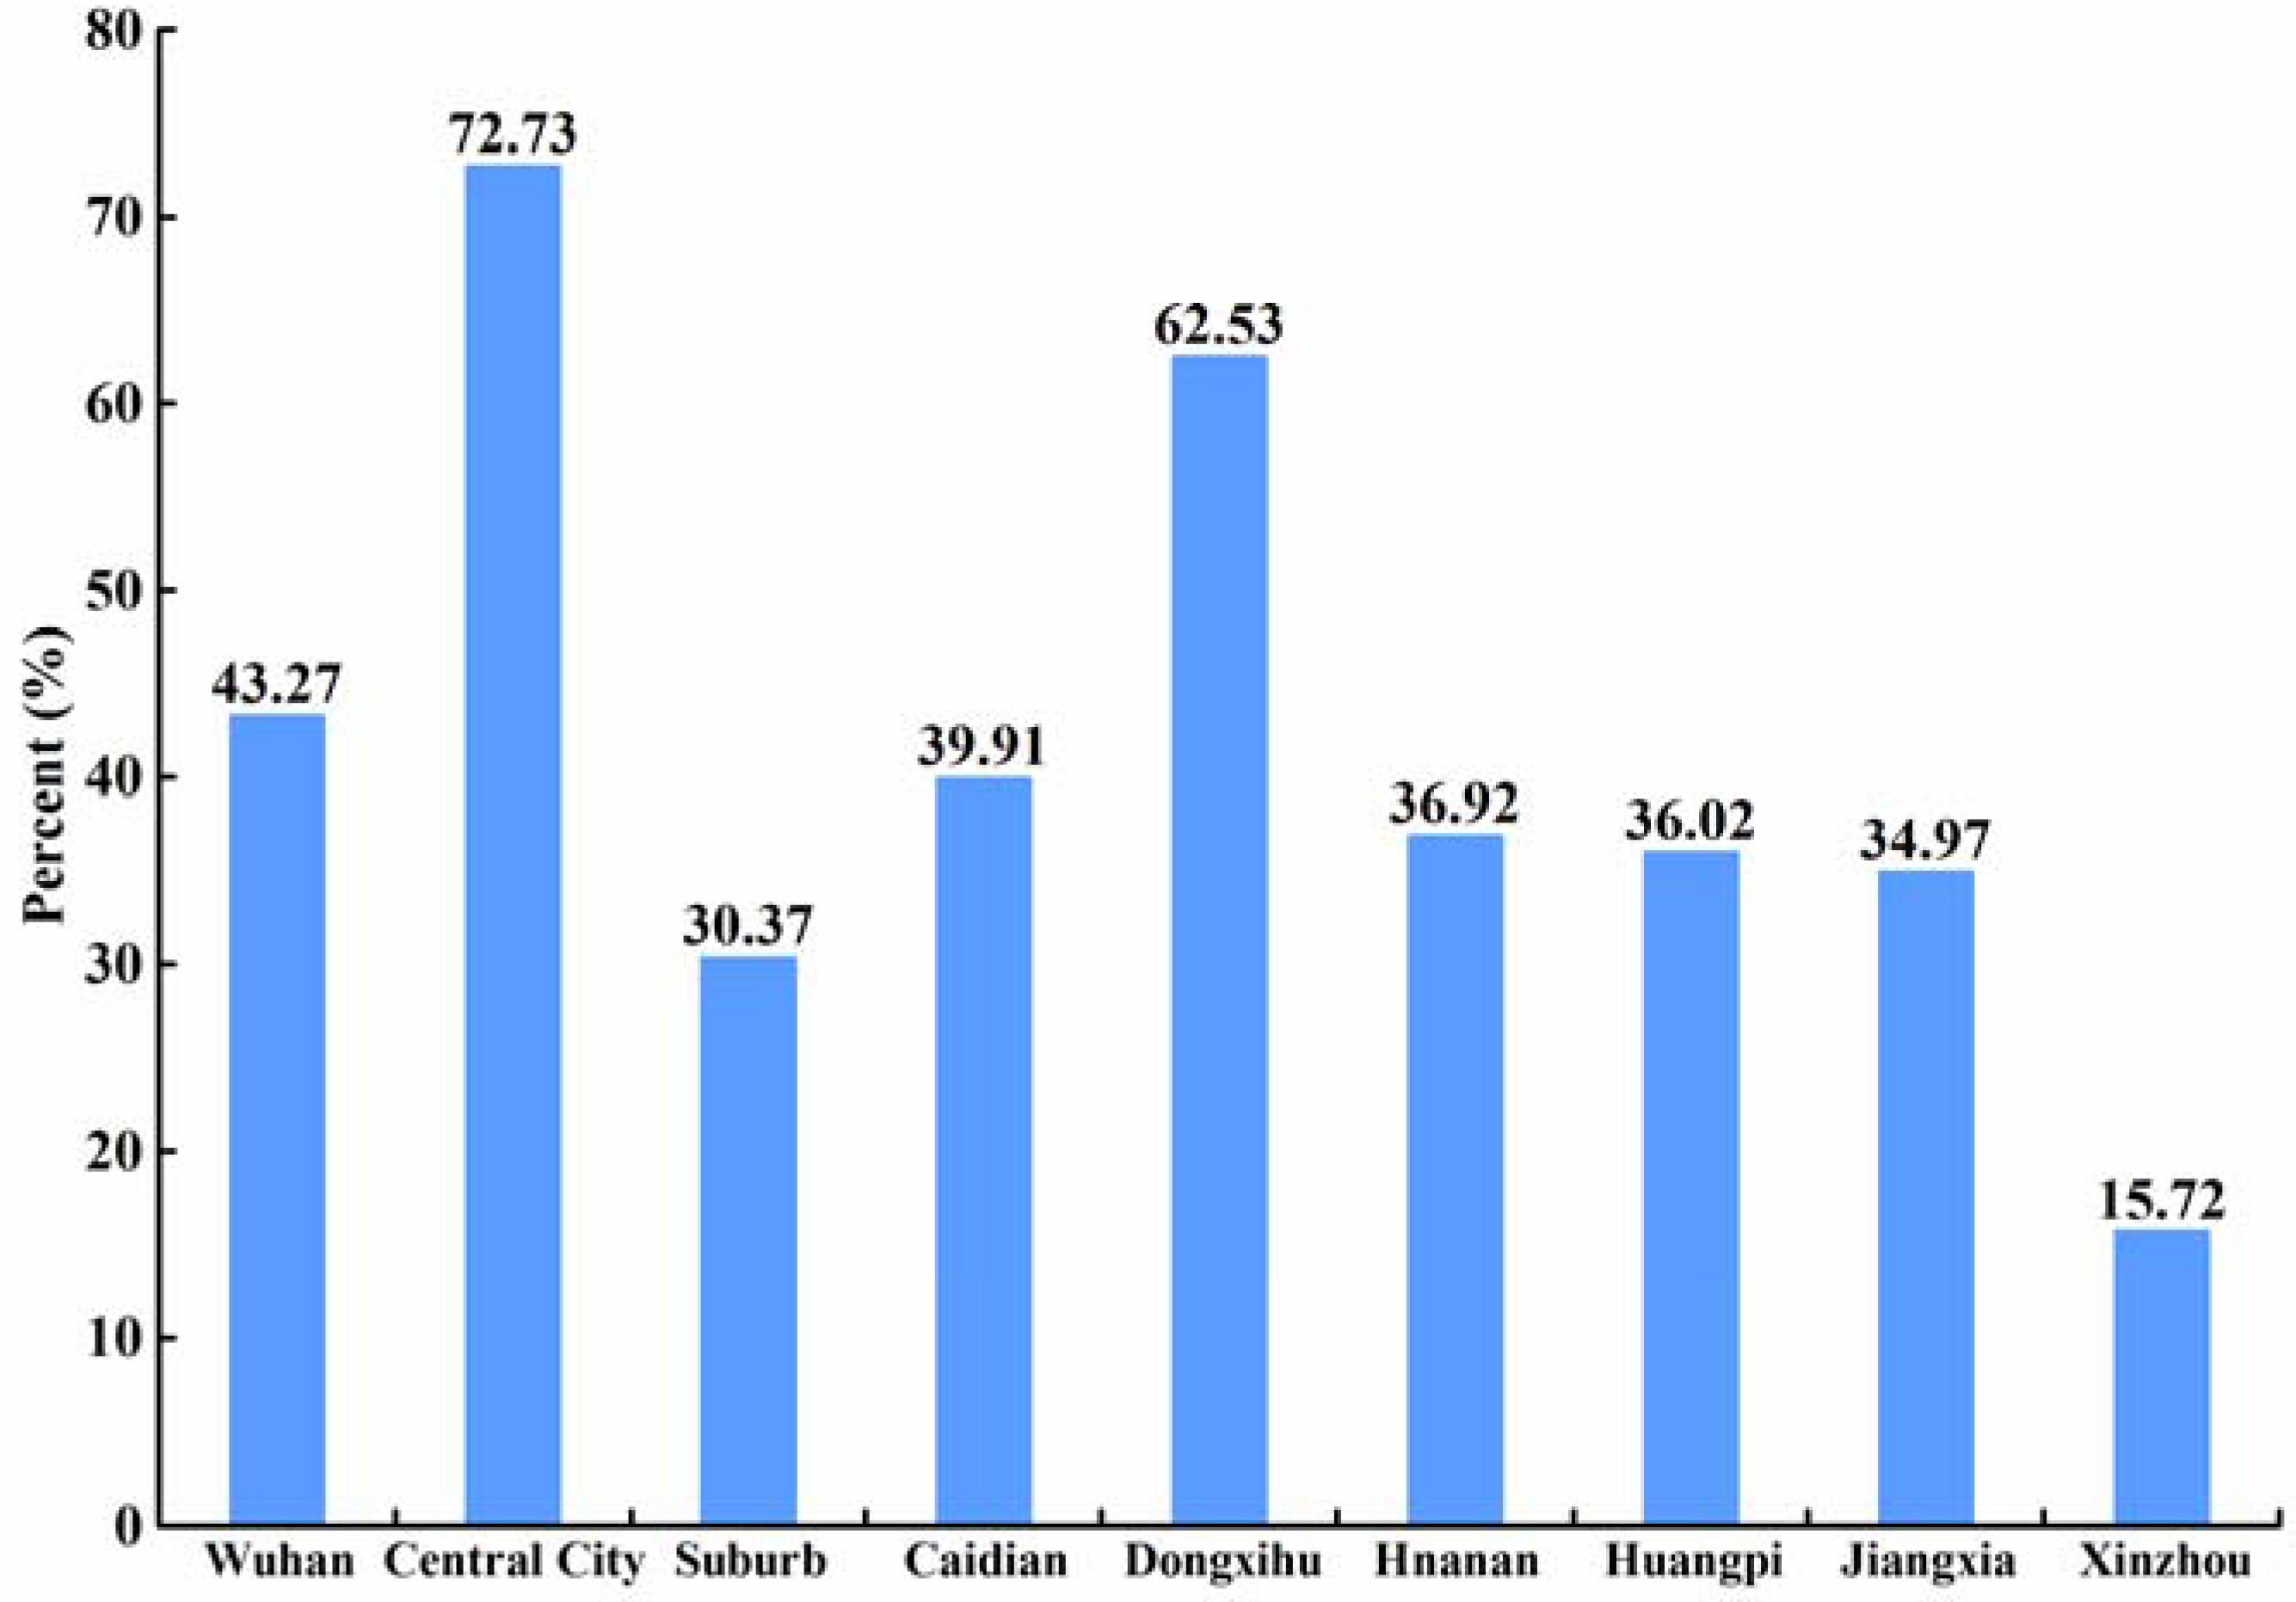
3.4. Difference Between Public and Private RACFs

The accessibility of public RACFs and private RACFs in different regions shows great differences (see Figure 7). The average accessibility score of public RACFs in Wuhan is 0.0193, which is higher than that of private RACFs (0.0148). The gap is insignificant but the spatial variation between regions is obvious. In most parts of Wuhan, public RACFs still have a more important influence on aged care services than private RACFs, however, private RACFs are not merely a supplement to public RACFs, but play an important role in the aged care service system. The contrast is striking between the accessibility of public and private RACFs in the central city and suburbs. The central city is rich in private aged care service resources, the accessibility score of private RACFs is 2.67 times that of public ones, which means that the elderly services provided by the private RACFs in central city could be much more convenient, and easily accepted by local residents. On the contrary, the average accessibility score of public RACFs in the suburbs is 0.0238, significantly higher than that of private ones (0.0104). In the rural areas with a low capacity of aged care services, the elderly mainly rely on public RACFs and the function of private RACFs is weak. Different parts of the suburbs also vary. In the Dongxihu District, the private RACFs have a higher spatial accessibility score than the public RACFs, while all the other areas are lower and vary by different degrees, especially the private RACFs in the Jiangxia and Xinzhou districts, which have the lowest contribution to the accessibility of all RACFs.

4. Discussion

4.1. The Spatial Disparity in Accessibility of RACFs

The spatial accessibility of all RACFs is higher in the central city and lower in the suburbs. The central city contains the leading areas of economic development in Wuhan, while the suburban areas are relatively underdeveloped. This indicates that a region’s economic development has a certain degree of influence on the accessibility of its RACFs, which is consistent with the results of other studies [18]. According to the results, the number of available beds in RACFs per 100 elderly people in Wuhan is only 3.37; that is over 91.43% of the village-level units have not yet reached the goal (5 beds per 100 elderly people) set by the Wuhan government for 2015. Overall, the integral capacity of aged care services in Wuhan is relatively low. The development of urban–rural aged care services is imbalanced and obvious regional disparity exists. The government departments should intervene to fill the gap between urban and rural areas by taking substantial measures (including making market-oriented, regulatory policies, or planning tools).
The distribution of spatial accessibility of the public RACFs is characterized by being higher in the suburbs of central Wuhan, and lower in the central city and the marginal rural areas, this is largely a result of the allocation system of public resources. In China, the development of public RACFs mainly relies on local financial support. In general, the government-guided allocation of public RACFs is based on the principle of regional fairness to ensure that each region can enjoy basic public services equally [47]. Limited by the government’s financial input, in most cases, each administrative unit can only be allocated one public RACF. The disadvantages of this type of allocation are the lack of market positioning and consideration of service demand and traffic. Thus, the allocation mode of public RACFs limits the opportunities of choosing public RACFs service in certain elderly-intensive urban areas and certain inaccessible rural areas.
The spatial accessibility of private RACFs decreases from the central city to the outer suburbs, mainly due to the changes in aged population density. The nature of private RACFs is pursuing profit and the spatial distribution of private RACFs is guided by market demand. In other words, the market rules have a significant effect on the allocation of private RACFs [48]. The central city’s dense aged population, high living standards, and consumption capacity have attracted most private RACFs. Due to the lack of market economy condition, the outlook for the development of private RACFs in rural areas is not optimistic. To make up for the insufficiency of aged care service resources of RACFs in rural areas, the government should encourage private capital to invest in the pension industry by a variety of measures (such as provide land and reduce taxes) to facilitating the development of private RACFs in rural areas.

4.2. The Influence of Private RACFs

This study is the first attempt to do a comparative analysis of the development of public and private RACFs in China. Figure 8 shows that the proportion of private RACFs designated for aged care service in Wuhan is 43.27%, slightly lower than that of public RACFs. Owing to the existence of the private RACFs, the mean accessibility score has increased from 0.0193 (only public) to 0.0341 (both public and private). This indicates that the private RACFs have played an important role in aged care services, which could be an important pillar of the policy-making for market-oriented development of the aged services industry. The contribution of private RACFs has a marked difference in urban and rural areas. Private RACFs play a prominent role in the central city. Its proportion of aged care services has exceeded the public RACFs and reached 72.73%. Private RACFs have become urban residents’ first choice for aged care services. However, due to lack of private aged care service resources, the proportion of private RACFs is merely 30.37% in the suburbs. In most parts of the suburban areas (except the Dongxihu District), the proportion of private RACFs is lower than the public RACFs. Especially in the Xinzhou District, the proportion of private RACFs takes only 15.72%. Overall, private RACFs have remarkably improved the level of aged care services in urban areas, while its influence is very weak in rural areas. Namely, private RACFs still have a great potential to play an important role in aged care services in the future.

4.3. Implications for the Allocation of RACFs

The gap between urban and rural aged care services in Wuhan is gradually widened with the population booming, the economy growing, and resident income rising. This urban–rural gap is disadvantageous to rural development and social equity, and incurs unusual difficulties for Wuhan in balancing urban and rural development. To this end, the effective integration of urban–rural aged care resources and the rational allocation of RACFs are considered. In this paper, several implications for urban and rural development policy can be obtained by comprehensively analyzing the spatial accessibility assessment of RACFs.
Establish a multi-level public RACFs system provides a variety of aged care service choice. In the central city, the spatial accessibility of the RACFs is not as high as the aged population density, especially the accessibility of public RACFs is low. The capacity of the aged care services in the central city has not kept pace with its economic development. In general, the services provided by public RACFs that are invested and owned by the states are often cheaper and more easily accepted by low-income older people. In the future, it is necessary to increase investment to improve the city-district-township-community multi-level public aged care service system in the central city and emphasize the planning of community-level public RACFs to provide a variety of options for the residents and expand the service coverage of public RACFs.
This study indicates the necessity of strengthening the construction of RACFs in rural areas and encouraging the development of private RACFs. The empty-nesters whose children are not around are becoming an increasingly large group in China's rural areas, therefore, the demand for facilities care services keeps growing [49]. In rural areas of Wuhan, the aged care service resources are scarce, especially the lack of private RACFs. Thus, it is urgent to increase the number of RACFs and improve the availability of aged care services. Therefore, the local government should optimize the aged care services, increase financial support for rural RACFs, and improve the quality of services. The market can acutely capture the needs for various kinds of care services for the elderly, and provide appropriate services through fair market competition. The governments should make efforts to develop private RACFs, and reforming the public residential aged care service system.
The integration of various aged service resources facilitates the aged service system. In this sense, it is essential to integrate institutional care services with home care services and community care services. Compared with the service of the centralized institutional care, the continuity and comprehensive services in the familiar community is more suitable for the elderly psychological and service needs. With the rapid development of the aged care service, it is necessary to promote the integrated development of the institutional, community and home care services.

4.4. Limitations

This paper only analyzes the current situation of the spatial accessibility of RACFs, the rationality of the spatial distribution of the RACFs should be evaluated and put forward an optimization scheme for further research so as to provide the direct and effective suggestions for the RACFs allocation plan. It only uses the aged population (aged 65 and above) to estimate the demand. More practical or accurate estimation should be done. For example, if the majority consumer of RACFs are aged 75 and above but only a few of aged 65–75 consumers, the demand estimation should change correspondingly. However, it be difficult to perform.

5. Conclusions

Spatial accessibility assessment has become an important tool for the decision making of regional public service provision and planning [50,51]. The MCSG2SFCA method is proposed to assess the spatial accessibility of public and private RACFs in Wuhan. The spatial distribution of RACFs is introduced and the aged care service capacity of different regions is analyzed in this study. It is noteworthy that, in terms of the marketization of the elderly services industry in China, this paper has analyzed the role public and private RACFs play in aged care services from the perspective of the urban–rural difference and the results provide sufficient information support for the future allocation of aged care service resources.
The main conclusions in this study are: (1) the overall capacity of aged care services in Wuhan is not satisfactory. This is far from reaching the goals of aged care service set by local government, especially in rural areas. That is, the capacity of facilities care service is still weak. Wuhan needs to continue to increase the number of RACFs and beds, and achieve reasonable allocation of aged care service resources; (2) social capital plays an important role in improving the capacity of aged care services. The more developed a region is, the higher the degree of marketization of aged care services. For the allocation of aged care services resources in future, we should strengthen market-oriented planning and gradually make the development of non-governmental forces to become the main body of the aged care service industry; (3) the characteristics of aged care services in urban and rural regions are strikingly different. In urban areas aged care services are based on private resources and in rural areas the aged care services based on public resources. The capacity of elderly services of urban areas is higher than that of rural areas. The development of urban–rural aged care services is imbalanced. It needs an integration of urban–rural aged care resources and rational allocation of RACFs, and a gradual realization of the equalization and balanced development of urban–rural aged care services.

Acknowledgments

The authors wish to thank Wuhan Land Resources and Planning Bureau and Wuhan Civil Affairs Bureau for providing the research data. In addition, the authors appreciate research funding from National key R & D Project: the unified representation, aggregation and visual mining of big geographic data (ID 2017YFB0503601) and. National Natural Science Foundation: knowledge mining and application of multi-scale clustering (ID 41771432).

Author Contributions

Enxiang Cai and Yaolin Liu conceived and designed the experiments; Ying Jing, Lei Zhang and Jiwei Li helped in date analysis; Ying Jing and Chaohui Yin helped in language correction; Enxiang Cai and Yaolin Liu wrote the paper.

Conflicts of interests

The authors declare no conflict of interest. The funding sponsors had no role in the design of the study; in the collection, analyses, or interpretation of data; in the writing of the manuscript, and in the decision to publish the results.

References

  1. Zeng, Y. Toward deeper research and better policy for healthy aging—Using the unique data of Chinese longitudinal healthy longevity survey. China Econ. J. 2012, 5, 131. [Google Scholar] [CrossRef] [PubMed]
  2. The State Council the Construction Plan of Social Elderly Care System (2011–2015). Available online: http://www.gov.cn/zwgk/2011–12/27/content_2030503.htm (accessed on 3 December 2016).
  3. National Health and Family Planning Commission Implementation Opinions on Encouraging Private Capital to Participate in The Development of Elderly Care Service Industry. Available online: http://www.nhfpc.gov.cn/jtfzs/s3581c/201502/501ddc3de0e44b899e2cc53369225478.shtml (accessed on 4 December 2016).
  4. Hubei Province Working Committee on Aging Analysis on the situation of population aging in Wuhan city in 2013. Available online: http://www.hbllw.cn/html/2015/llyj_0709/17232.html (accessed on 9 July 2015).
  5. Wuhan Land Resources and Planning Bureau Spatial Layout Planning of Residential Care Facilities in Wuhan (2012–2020). Available online: http://www.mlr.gov.cn/zwgk/ghjh/201408/t20140813_1326862.htm (accessed on 15 March 2017).
  6. Wuhan Municipal Bureau of Civil Affairs Survey on the aged service in Wuhan. Available online: http://hb.qq.com/a/20130415/000786.htm (accessed on 10 October 2017).
  7. Zhou, S.; Xie, M.; Kwan, M. Ageing in place and ageing with migration in the transitional context of urban China: A case study of ageing communities in Guangzhou. Habitat Int. 2015, 49, 177–186. [Google Scholar] [CrossRef]
  8. Kim, K.; Gollamudi, S.S.; Steinhubl, S. Digital technology to enable aging in place. Exp. Gerontol. 2017, 88, 25–31. [Google Scholar] [CrossRef] [PubMed]
  9. World Health Organization Global Age-Friendly Cities Project. Available online: www.who.int./ageing/age_friendly_cities_network (accessed on 10 October 2017).
  10. Wahl, H.W.; Iwarsson, S.; Oswald, F. Aging well and the environment: Toward an integrative model and research agenda for the future. Gerontologist 2012, 52, 306–316. [Google Scholar] [CrossRef] [PubMed]
  11. Wiles, J.L.; Leibing, A.; Guberman, N.; Reeve, J.; Allen, R.E.S. The Meaning of “Aging in Place” to Older People. Gerontologist 2012, 52, 357–366. [Google Scholar] [CrossRef] [PubMed]
  12. Lawton, M.P.; Simon, B. Ecology of social relationship in housing for elderly. Gerontologist 1968, 8, 108. [Google Scholar] [CrossRef] [PubMed]
  13. Sanchez Gonzalez, D. Environmental Gerontology: Making Meaningful Places in Old Age; Springer Publishing Company: New York, NY, USA, 2013. [Google Scholar]
  14. Iwarsson, S.; Wahl, H.; Nygren, C.; Oswald, F.; Sixsmith, A.; Sixsmith, J.; Szeman, Z.; Tomsone, S. Importance of the home environment for healthy aging: Conceptual and methodological background of the European ENABLE-AGE project. Gerontologist 2007, 47, 78–84. [Google Scholar] [CrossRef] [PubMed]
  15. Oswald, F.; Jopp, D.; Rott, C.; Wahl, H. Is aging in place a resource for or risk to life satisfaction? Gerontologist 2011, 51, 238–250. [Google Scholar] [CrossRef] [PubMed]
  16. Wu, Y.; Wang, L.; Kong, W.; Dong, P.; Yang, X. The Chinese Pension Institution Development Research. Sci. Res. Aging 2015, 3, 13–24. [Google Scholar]
  17. Cheng, Y. Residential Care for Elderly People in Beijing, China: A Study of the Relationship between Health and Place. Ph.D. Thesis, Queen’s University, Kingston, ON, Canada, 2010. [Google Scholar]
  18. Cheng, Y.; Wang, J.E.; Rosenberg, M.W. Spatial access to residential care resources in Beijing, China. Int. J. Health Geogr. 2012, 11, 32. [Google Scholar] [CrossRef] [PubMed]
  19. Yan, B.Q.; Gao, X.L.; Ji, J. Micro simulation and planning policies analysis for urban elderly care facilities: Take Beijing as an example. Prog. Geogr. 2015, 34, 1586–1597. [Google Scholar]
  20. Tao, Z.L.; Cheng, Y.; Dai, T.Q.; Li, X. Spatial optimization of residential care facility locations in 2020 in Beijing: Maximum equity in accessibility. Prog. Geogr. 2015, 34, 1609–1616. [Google Scholar]
  21. Dadashpoor, H.; Rostami, F.; Alizadeh, B. Is inequality in the distribution of urban facilities inequitable? Exploring a method for identifying spatial inequity in an Iranian city. Cities 2016, 52, 159–172. [Google Scholar] [CrossRef]
  22. Wang, F.; Tang, Q. Planning toward equal accessibility to services: A quadratic programming approach. Environ. Plan. B 2013, 40, 195–212. [Google Scholar] [CrossRef]
  23. Smoyer-Tomic, K.E.; Hewko, J.N.; Hodgson, M.J. Spatial accessibility and equity of playgrounds in Edmonton, Canada. Can. Geogr. 2004, 48, 287–302. [Google Scholar] [CrossRef]
  24. Lin, K.; Lu, Y.Q.; Liu, J.; Zhang, L.; Wang, T.N. Assessment of fair space of public product based on accessibility: A case of Yizheng city. Geogr. Res. 2009, 28, 215–224. [Google Scholar]
  25. Kaczynski, A.T.; Potwarka, L.R.; Saelens, B.E. Association of park size, distance, and features with physical activity in neighborhood parks. Am. J. Public Health 2008, 98, 1451–1456. [Google Scholar] [CrossRef] [PubMed]
  26. Connor, R.A.; Hillson, S.D.; Krawelski, J.E. Competition, professional synergism, and the geographic distribution of rural physicians. Med. Care 1995, 33, 1067–1078. [Google Scholar] [CrossRef] [PubMed]
  27. Schonfeld, H.K.; Heston, J.F.; Falk, I.S. Numbers of physicians required for primary medical care. N. Engl. J. Med. 1972, 286, 571–576. [Google Scholar] [CrossRef] [PubMed]
  28. Guagliardo, M.F. Spatial accessibility of primary care: Concepts, methods and challenges. Int. J. Health Geogr. 2004, 3, 3. [Google Scholar] [CrossRef] [PubMed] [Green Version]
  29. Yang, D.; Goerge, R.; Mullner, R. Comparing GIS-based methods of measuring spatial accessibility to health services. J. Med. Syst. 2006, 30, 23–32. [Google Scholar] [CrossRef] [PubMed]
  30. Hilisdon, M.; Panter, J.; Foster, C.; Jones, A. The relationship between access and quality of urban green space with population physical activity. Public Health 2006, 120, 1127–1132. [Google Scholar] [CrossRef] [PubMed]
  31. Radke, J.; Mu, L. Spatial Decompositions, Modeling and Mapping Service Regions to Predict Access to Social Programs. Geogr. Inf. Sci. 2000, 2, 105–112. [Google Scholar] [CrossRef]
  32. Luo, W.; Wang, F.H. Measures of spatial accessibility to health care in a GIS environment: Synthesis and a case study in the Chicago region. Environ. Plan. B 2003, 30, 865–884. [Google Scholar] [CrossRef]
  33. McGrail, M.R. Spatial accessibility of primary health care utilising the two step floating catchment area method: An assessment of recent improvements. Int. J. Health Geogr. 2012, 11, 50. [Google Scholar] [CrossRef] [PubMed]
  34. Song, P.; Zhu, Y.J.; Mao, X.; Li, Q.; An, L. Assessing Spatial Accessibility to Maternity Units in Shenzhen, China. PLoS ONE 2013, 8. [Google Scholar] [CrossRef] [PubMed]
  35. Wang, F.H. Measurement, Optimization, and Impact of Health Care Accessibility: A Methodological Review. Ann. Assoc. Am. Geogr. 2012, 102, 1104–1112. [Google Scholar] [CrossRef] [PubMed]
  36. Luo, W.; Qi, Y. An enhanced two-step floating catchment area (E2SFCA) method for measuring spatial accessibility to primary care physicians. Health Place 2009, 15, 1100–1107. [Google Scholar] [CrossRef] [PubMed]
  37. Dai, D. Black residential segregation, disparities in spatial access to health care facilities, and late-stage breast cancer diagnosis in metropolitan Detroit. Health Place 2010, 16, 1038–1052. [Google Scholar] [CrossRef] [PubMed]
  38. Dai, D. Racial/ethnic and socioeconomic disparities in urban green space accessibility: Where to intervene? Landsc. Urban Plan 2011, 102, 234–244. [Google Scholar] [CrossRef]
  39. Wang, Q.; Xiu, C.; Wei, Y.; Zhang, L. Evaluation of job accessibility of Shengyang using Guassian based 2-step floating catchment area method. Hum. Geogr. 2015, 2, 78–82. [Google Scholar]
  40. Wuhan Municipal Government the Administrative Institutions of Wuhan City. Available online: http://www.wuhan.gov.cn/whszfwz/xwxx/whgl/201411/t20141109_13853.html (accessed on 10 December 2016).
  41. Gao, Y.; He, Q.S.; Liu, Y.L.; Zhang, L.Y.; Wang, H.F.; Cai, E.X. Imbalance in Spatial Accessibility to Primary and Secondary Schools in China: Guidance for Education Sustainability. Sustainability 2016, 8, 1236. [Google Scholar] [CrossRef]
  42. Wuhan Civil Affairs Bureau List of the Social Pension Institutions in Wuhan City. Available online: http://www.whmzj.gov.cn/mzdsj/index.aspx (accessed on 5 December 2016).
  43. Wuhan Land Resources and Planning Bureau Annual Report on Traffic Development in Wuhan. Available online: http://www.wpl.gov.cn/pc-0–51822.html (accessed on 5 December 2016).
  44. Ministry of Housing and Urban-Rural Development Design Code for Buildings of Elderly Facilities. Available online: http://www.mohurd.gov.cn/wjfb/201509/t20150910_224798.html (accessed on 12 December 2016).
  45. Dang, H.M. The Spatial Accessibility Research on Maternity Medical Resources: A Case of Six District Beijing. Master’s Thesis, Capital Normal University, Beijing, China, 2013. [Google Scholar]
  46. Ren, R.; Wang, Y.; He, Z.; Zhao, W. Research on Spatial Accessibility of Primary School Education Resources in Poverty Area Based On Modified Two-step Floating Catchment Area Method—A Case Study of Qian Jiang. Geomat. World 2014, 21, 22–28. [Google Scholar]
  47. The State Council the 12th Five-Year Plan for National Basic Public Service System. Available online: http://www.gov.cn/zwgk/2012-07/20/content_2187242.htm (accessed on 15 May 2017).
  48. Pan, J.; Zhao, H.Q.; Wang, X.L.; Shi, X. Assessing spatial access to public and private hospitals in Sichuan, China: The influence of the private sector on the healthcare geography in China. Soc. Sci. Med. 2016, 170, 35–45. [Google Scholar] [CrossRef] [PubMed]
  49. UNPF. State of World Population 2007; UNPF: New York, NY, USA, 2007. [Google Scholar]
  50. Ngui, A.N.; Apparicio, P. Optimizing the two-step floating catchment area method for measuring spatial accessibility to medical clinics in Montreal. BMC Health Serv. Res. 2011, 11, 1–12. [Google Scholar] [CrossRef] [PubMed]
  51. Kang, C. Spatial access to pedestrians and retail sales in Seoul, Korea. Habitat Int. 2016, 57, 110–120. [Google Scholar] [CrossRef]
Figure 1. The ratio of 65+ years old, China and Wuhan, 2005–2015. Data source: extracted from the National Bureau of Statistics website and Wuhan Statistical Yearbook.
Ijgi 06 00304 g001
Figure 2. Location and administrative districts of Wuhan.
Ijgi 06 00304 g002
Figure 3. Traffic network of Wuhan City.
Ijgi 06 00304 g003
Figure 4. Spatial distribution of aged population and RACFs in Wuhan.
Ijgi 06 00304 g004
Figure 5. Spatial accessibility to RACFs in Wuhan by the MCSG2SFCA method. (a) Accessibility to all RACFs; (b) Accessibility to public RACFs; (c) Accessibility to private RACFs.
Ijgi 06 00304 g005
Figure 6. Aged care service capability in Wuhan.
Ijgi 06 00304 g006
Figure 7. Average accessibility score to RACFs in Wuhan.
Ijgi 06 00304 g007
Figure 8. The proportion of private RACFs in the aged care service.
Ijgi 06 00304 g008
Table 1. Numbers and service area of different types of RACF in Wuhan, 2015.
TypeAll RACFs Public RACFs Private RACFsDistance Thresholds (d0)
T1 (Large)251312100
T2 (Medium)97415650
T3 (Small)114407425

