Monitoring Rural Water Points in Tanzania with Mobile Phones: The Evolution of the SEMA App


1
Department of Geo-Information Processing, Faculty of Geo-Information Science and Earth Observation, University of Twente, 7514 AE Enschede, The Netherlands
2
Department of Computer Sciences and Engineering, University of Dar es Salaam, 14113 Dar es Salaam, Tanzania
3
Department of Urban and Regional Planning and Geo-Information Management, Faculty of Geo-Information Science and Earth Observation, University of Twente, 7514 AE Enschede, The Netherlands
*
Author to whom correspondence should be addressed.
ISPRS Int. J. Geo-Inf. 2017, 6(10), 316; https://doi.org/10.3390/ijgi6100316
Submission received: 15 July 2017
/
Revised: 4 October 2017
/
Accepted: 16 October 2017
/
Published: 21 October 2017
(This article belongs to the Special Issue Innovative Geo-Information Tools for Governance)
Abstract
:Development professionals have deployed several mobile phone-based ICT (Information and Communications Technology) platforms in the global South for improving water, health, and education services. In this paper, we focus on a mobile phone-based ICT platform for water services, called Sensors, Empowerment and Accountability in Tanzania (SEMA), developed by our team in the context of an action research project in Tanzania. Water users in villages and district water engineers in local governments may use it to monitor the functionality status of rural water points in the country. We describe the current architecture of the platform’s front-end (the SEMA app) and back-end and elaborate on its deployment in four districts in Tanzania. To conceptualize the evolution of the SEMA app, we use three concepts: transaction-intensiveness, discretion and crowdsourcing. The SEMA app effectively digitized only transaction-intensive tasks in the information flow between water users in villages and district water engineers. Further, it resolved two tensions over time: the tension over what to report (by decreasing the discretion of reporters) and over who should report (by constraining the reporting “crowd”).
1. Introduction
Sustaining a functional rural water supply infrastructure has been a challenge in Sub-Saharan Africa [1]. In Tanzania, nearly half of rural water points are not functional [2] and about 20% of newly constructed water points become non-functional within one year. Rural citizens soon return to traditional, unimproved water sources and endanger their health and well-being [3].
The Ministry of Water monitors the implementation and performance of rural water supply in Tanzania, as an integral part of its mission. In the past, the Ministry calculated the rural water service coverage based on an assumed number of 250 water users per constructed rural water point. In 2009, the Ministry recognized that actual water “coverage rates may very well be lower than those reported by routine data […]. Without a reliable baseline that takes into account functionality and (more importantly) a means to keep this updated, it is impossible to track the net progress in expanding rural water supply service coverage or, more importantly, to determine actual access rates.” [4]. The Ministry’s acknowledgement that rural water supply data must include the functionality of water points—”Functional”, “Non Functional”, and “Functional Needs Repair”—marks a pivotal moment for the rural water supply sector. In 2010, the Ministry commissioned the Water Point Mapping System (WPMS), a web-based, nation-wide information system featuring the entire dataset of geo-tagged water points and their functionality status. However, without an effective updating mechanism, the system cannot track the status of rural water points. Instead, it merely provides a static picture of Tanzanian water points at the time of the original survey.
Nevertheless, the WPMS marked the beginning of an information infrastructure for Rural Water Supply (RWS II) in Tanzania. Development partners, NGOs and researchers started to develop and test dashboards to visualize water points (e.g., the Water Dashboard, see http://opendata.go.tz/en/indicator/a2fab64e-47f7-11e5-847d-0e5e07bb5d8a) and mechanisms that allow district water engineers to update the water point status. Examples are the Big Results Now’s (BRN’s) updating mechanism based on Google docs and the Ministry of Water’s (MoW’s) updating mechanism based on pre-formatted and prefilled excel templates [5]. However, only two mechanisms have been developed so far in Tanzania to fill the reporting gap between the villages and the district water departments. The first was the paper-based updating mechanism developed and implemented in a few districts by WaterAid [6]. The second was the mobile phone-based platform, developed by our research team. Both aimed to be interoperable with the WPMS. Both make it possible for water users in villages to inform the District Water Engineer (DWE) about the functionality status of water points. The DWE would then report upwards to the ministry using the BRN or the Ministry of Water (MoW) updating mechanisms.
In this paper, we analyze and discuss the evolution of the mobile phone-based platform, called Sensors, Empowerment and Accountability in Tanzania (SEMA), after the project in which it has been developed. The main research for this paper was done under the Netherlands Organization for Scientific Research (NWO) funded integrated research project: Sensors, Empowerment and Accountability in Tanzania (SEMA); SEMA also means “tell me” in Kiswahili.
Most researchers compare mobile phone-based ICT platforms for improving water supply. For example, Welle, Williams and Pearce conducted the most recent cross-national comparison, which included eight such platforms, in three continents. Some platforms rely on crowdsourcing—water users or their institutional representatives reporting water service failures [7]. Others rely on either the government provider or Non-Government Organizations (NGOs) collecting data regularly. The novelty of our approach consists in observing and conceptualizing the evolution of the design of the front-end of a single platform, the SEMA app, over a long time. Between 2014 and 2017, we deployed three consecutive versions of the SEMA platform in four districts, and fine-tuned the software as we learned lessons from meetings with stakeholders in the rural water supply sector, in-depth interviews with villagers, Community Owned Water Supply Organizations (COWSOs) and district officials in the four districts.
We adapted two concepts from the literature on public services: transaction-intensiveness, discretion [8]. These allowed us to characterize tasks in information flows between citizens and government and judge how amenable they are to digitization. A third concept, “crowd-sourcing”, first championed as an effective strategy for open-source economic production, allowed us to model the distributed production of reports on rural water points.
The research question is “how has the usefulness of the SEMA app evolved over time?” and we will address this in terms of its changed functionality and user uptake. The objective of this paper is to show how the development of our mobile phone application has been influenced by the patterns of local organization. The rest of the paper is structured as follows. Section 2 highlights the crisis in the rural water supply and the development of the Rural Water Supply Information Infrastructure (RWS II), with its stakeholders and tasks. Section 3 presents the evolution of the SEMA App, its current architecture and its back-office. Section 4 describes the deployment of the SEMA app in practice and Section 5 discusses the lessons learnt from building the app and testing it with its users. We end with conclusions and recommendations in Section 6.
2. Empirical Context—The Rural Water Supply Information Infrastructure (RWS II)
The emerging RWS Information Infrastructure in Tanzania subsumes water policies and water sector programs, networked information systems, dashboard and updating mechanisms, geo-referenced data, organizational stakeholders and users.
2.1. Policies and Programs for Rural Water Supply
In the past 15 years, the Government of Tanzania changed the formal structure of rural water supply substantially, first through the National Water Policy (NAWAPO) [9] and later with the Water Sector Development Program (WSDP) (2006–2025). Under NAWAPO, “consultations and planning starts from the grass roots; implementation is at the most appropriate level, closest to the beneficiaries. User groups are not only responsible for operating, maintaining and sustaining the infrastructure; they are also responsible for planning and managing it for the entire water sector in Tanzania” [4]. Thus, a new village institution, COWSO, was formed to take the full responsibility for operating, maintaining and sustaining water points at the village level. The WSDP consolidates for the first time three sub-sector programs—water resources management, rural water supply, and urban water supply and sewerage—and provides a nation-wide vision and funding. The scale of the WSDP program brings with it a high degree of complexity and inflexibility, with more than 300 implementing agencies involved.
Because of the WSDP’s accountability requirements to donors, disbursement of funds must follow a long bureaucratic process of accountability, requiring upwards (vertical) reporting at each level of government, all the way from the village, to the district, and, finally, to the Ministry of Water. This leads to power struggles between different levels of government and a confusion regarding roles and responsibilities [10]. Another power struggle is ongoing between districts and village COWSOs around roles and responsibilities for water services. COWSOs should bear the full cost of Operation and Maintenance (O&M) and contribute 5% of the capital investment in rural water schemes, a strategy aiming at a greater sense of local ownership of water schemes. In practice, communities either refuse or cannot afford to contribute the part of the capital investment stipulated in the law [11].
2.2. Networked Information Systems
The Water Point Mapping System (WPMS) is part and parcel of the Water Sector Development Program. The World Bank and the Ministry of Water negotiated the blueprint for the WPMS and a local company carried it out from 2010 to 2013. The WPMS is an innovative web-based information system. It aims to make rural water point data accessible to the public and easily updateable by local governments. It provides in digital form the status of the rural water infrastructure to inform national planning and budgeting in the country. The local company performed four tasks: (1) nation-wide baseline data collection of all rural water points; (2) development of the web-based Water Point Mapping System (WPMS); (3) provision of recommendations for the integration of WPMS into the monitoring systems and practices of local governments; and (4) capacity building on the use and updating of the WPMS. The WPMS aims to improve the monitoring of performance of actors—do they fulfill their formal roles and act responsibly?—at different levels of government. Currently, the WPMS is not being used, and setting up a cost-effective updating mechanism for the collected rural water point data remains a significant challenge.
2.3. Key Stakeholders of Rural Water Supply and Main Actors in SEMA
District/ward/village officials: According to Section 38 of the National Water and Sanitation Act (2009), the district council (local government authority) has three main roles. First, district officials are responsible for mobilizing citizens and assisting them to form and register COWSOs. The registration of COWSOs is coordinated mainly by District Water Engineers (DWEs). They must prepare and submit quarterly reports to the Ministry of Water (MoW) and to the Prime Minister’s Office, Ministry of Regional Administration and Local Government (PMORALG) on the status and progress of the COWSO registration process in the district as well as copies of quarterly reports of registered COWSOs. Second, district officials must provide guidelines to COWSOs on the operation and maintenance of water projects and follow-up on their operation and maintenance. The district council must submit weekly reports to MoW and PMORALG on the implementation of new water projects. Ward Executive Officers (WEOs) are accountable to the DWE for water matters concerning their ward—an administrative area made up by a group of two or more villages. Village Executive Officers (VEOs) are accountable to the WEO for water matters concerning their village. Thus, accountability is hierarchically bureaucratic, from the village through the ward and the district up to central government.
Ward Councilors: Ward councilors are elected members of the district council. They represent citizens at the ward level and are elected every five years. They represent citizens’ interests at the district council. To be able to know the interests of citizens, councilors need to be informed about the status of affairs in their ward. For this purpose, they organize meetings with citizens of the ward to listen to their suggestions and complaints and inform them on relevant decisions of the district council.
Councilors oversee the district council in three different ways. They: (i) seek information on the plans, budgets and performance of the district; (ii) question the district on either the planning (allocation of resources) or implementation of district plans and budgets; and (iii) participate in decisions to sanction poor performing district staff. In order for councilors to get information on the allocation of resources for water projects, they need to scrutinize district plans and budgets. Councilors have the power to hire and fire district officials and thus can sanction their performance in the implementation of water projects. In practice, however, councilors’ sanctioning ability is limited [12].
Citizens: Citizens are responsible for contributing a portion of the capital investment for rural water projects. They participate in the design and planning of rural water projects including the choice of affordable and suitable technology [7]. Citizens attract resources for the investment of water projects. In practice, citizens can play this role both directly and through their representatives such as councilors and/or members of parliament. On the one hand, citizens demonstrate commitment (through contributing part of the capital investment through labor and/or cash) and ability to pay for the operation and maintenance of water projects. On the other hand, citizens can attract resources for water project by influencing councilors and/or members of parliament, who (councilors) have the role to approve district plans and budgets.
Citizens are those who are at the receiving end of the stick when water supply fails. They are represented by their elected officials. They also expect to be served by those officials. They are suffering and enduring the status quo. They find coping mechanisms to live with the status quo. We observe that they are not keen to report with a mobile phone themselves, but rather as active members in COWSOs.
COWSOs: COWSOs are responsible for the operation and management of water projects in rural areas. In principle, COWSO members operate and maintain water projects as volunteers, without payment. A COWSO works closely with the Ward Executive Officer (WEO) and Village Executive Officer (VEO) to ensure that the installed water projects are properly operated and maintained (by trained pump attendants), and to ensure that water users (villagers) pay full operation and maintenance costs (establish and maintain the water funds). Theoretically, COWSOs are required to report to the District Water Engineer (DWE) on a quarterly basis [13], particularly when they receive financial assistance (grants or loans) from the district council, a provision in constitutions of many COWSOs. In practice, the DWE does not receive regular reports from COWSOs, except when they report water point breakdowns.
2.4. Towards a Changed Infrastructure: Typification of Tasks and Crowdsourcing
Transaction intensiveness and discretion: We draw on the framework of Pritchett and Woolcock (2004) and the World Bank (2016), who distinguish between discretionary and transaction-intensive elements in key services to citizens, and adapt it to micro-level tasks of decision making. Transaction-intensive tasks require a large number of transactions, involving face-to-face contacts between district officials, village water technicians, COWSO members, and citizens, for example a water technician detecting a broken water point and reporting to the COWSO secretary. Discretionary tasks involve decisions based on information that “is important but inherently imperfectly specified and incomplete, and entails extensive professional or informal context-specific knowledge” [6], for examples, a village assembly agreeing to contribute funds for repair of a water point, or a district official approving a COWSO’s request for funds are discretionary tasks.
Transaction-intensive tasks are easily amenable to digitization, while discretionary tasks are not because the actor’s decisions cannot be mechanized. Non-discretionary and transaction-intensive tasks can easily be codified in computer programs [14]. Tasks that are neither discretionary nor transaction-intensive are lasting dispositions [15], but digitization does not apply to them. They include the systematic preference of villagers to meetings for distribution of food for hunger relief and to attending funerals rather than COWSO meetings. Table 1 shows the relationship between task characteristics and amenability to digitization.
Crowd-sourcing is a typical way to perform non-discretionary tasks. Tasks that, for instance, are too transaction intensive to digitize due to the limitations of computational power or tasks for which no or not enough digital data exist to answer a question. Feature recognition from photographs is one of these tasks. The human eye is very well equipped to spot anomalies or specific occurrences in pictures more quickly than algorithm driven computers nowadays can. In some cases, knowledge is missing or data are not available to perform a task. In that case, distributing the question at hand to the “crowd” can offer solutions. In many cases, these tasks are the equivalent of mechanical-Turk: simple transactions that together serve a purpose.
To assess which tasks in SEMA could be crowd-sourced, we first conducted a detailed study of the actual flow of information between the water user, who detects the status of a water point, until the district water engineer repairs it [16]. Within the detailed information flow, we identified 88 micro-tasks, which we assembled in six clusters—detecting, reporting, diagnosing, mobilizing funds, purchasing spare parts, and fixing the water point. Our analysis showed that only two of those clusters—i.e., detecting and reporting—had tasks that were transaction-intensive and low in discretion, and therefore amenable to digitization. Therefore, detecting and reporting have been at the core of all successive versions of the SEMA app software.
SEMA uses crowd-sourcing for these tasks through actively approaching COWSO members to report on the status of water points. The question to “simply report” whether a water point is—”Functional”, “Non Functional” or “Functional Needs Repair”—is however much more discretionary than it seems. Functionality depends on many aspects. A reporter needs to assess whether water quality, level of improvement/safety, water quantity and accessibility of the water point are in order before a decision can be taken on its functionality status. For a COWSO member these tasks are more discretionary than for water point enumerators. COWSO members are familiar with the context in which the water point is operating. They decide to mark a water point as functional as it has only broken down recently and repairs are under way, or, although it is not currently providing water, the water point customarily provides water again later in the day.
In order for crowd-sourcing to be useful in the case of SEMA the discretionary context needed to be removed as much as possible. If crowd-sourced data on functionality status is frequent and consistent the volume of “binary” (functional/non-functional) reports will present a trend of service delivery over years. In the app design we have, in different deployments, tested how we should formulate the tasks for the “crowd” to become as much non-discretionary as possible. For instance, through asking “is the water point providing water today” we get a less discretional answer than asking “is the water point functional today”. Likewise, we can ask questions about water quality and quantity. By asking the right questions we reduced discretion and increased the amenability to digitize the reporting on water point functionality.
3. The SEMA App and Its Back-Office
3.1. Evolution of the App
The SEMA App is a mobile-based software developed by programmers at UDSM and UT for the purpose of enabling ordinary Tanzanian citizens to report on the status of their water points. The evolution of the (front-end) software is characterized by three dimensions, namely technology, routine and performance. By technology we mean the architecture under which the respective versions of the software run, the processing of data, communication and interface between mobile users and databases. The routine dimension is defined by the steps which the users perform to interact with the software when reporting, such as logging onto the system, language selection, etc. The performance dimension gives the quantitative measures of various parameters, including time and cost. Each of these dimensions is presented for various critical moments when the software evolved from one version to another.
3.1.1. Technology
The aim of the project was to develop the app for simple feature phones as they are more commonly available than smartphones in our project area, but, as the development on Android phones was more straightforward, this was started first. Later, the development on feature phones was started. Table 2 lists the main elements in the evolvement of three versions of the mobile app.
The development on Android continued for two reasons: (1) to keep a working mobile app to test the back office; and (2) to be able to support the use of Android phones in the future in case these become more widely used. After only seven months of its first release, the App developed to its next version (SEMA App Ver.2.0) in August 2014. Updates were now sent through Short Message Service (SMS) [17] using normal text-based phones. In this version, a dialogue style was simulated on the mobile phone, as is common for phone services, such as credit queries and mobile money transactions. While this version makes use of Unstructured Supplementary Service Data (USSD) technology [18], the SEMA App simulated the dialog style only. The major drawback here is that it took up to 30 min for the reporter to get a reply from the server.
In the third (and current) release of the App (SEMA App Ver. 3.0, see Figure 1), a real USSD is used as opposed to the simulated USSD in the second version; that is, users can now directly dial a short code to start interaction with the back-end system. Furthermore, the USSD gateway was hosted by a local Mobile Operator and the communication was accomplished by two major servers (the backend at the university, and the USSD gateway at the local mobile operator). Finally, the current version uses both XML (status data) and JSON (baseline data) file formats/technologies for importing data to the SEMA backend database system. The Extensible Markup Language (XML) and JavaScript Object Notation (JSON) are both data exchange languages, of which the latter is gaining more popularity amongst web developers.
3.1.2. (User) Routine
The SEMA App Ver.1.0 was the Android application which was running only on a smartphone. Due to Internet connectivity issues in the rural areas and the fact that smartphones were beyond reach for ordinary citizens, the app was only tested by researchers and never used by the reporters. However, this allowed us to develop and test menu items and their interaction with the server-side database internally.
The SEMA App Ver. 2.0 had the users trigger the system for reporting by sending a keyword (WATER) to a normal mobile number. This number changed frequently and programmers had to request for a different number from the provider when the previously assigned one could not be used. After sending the keyword successfully, a response message would request users to select a language (English or Kiswahili), and then users would be prompted to log on to the system by providing a password. This (logging on) was repeated every time a user wanted to report status (Very transaction-intensive; unconstrained crowdsourcing). The reporting loop would then allow the reporter to select the status of a water point under report from the following choices: functional, non-functional or need repair (discretion totally under the reporter). Users were also given an option to provide textual description (even more discretion granted to the user).
A variation of the same version (SEMA App Ver. 2.0), reporting was triggered by users sending the keyword (WATER) to a non-mobile number (15573) since in this release; the (simulated) USSD gateway was hosted in a different server. There was no longer an option to select a language, as Swahili was the preference language. The user would then be prompted to enter a password, and in this release, would do that at the first login instance only (Medium-constrained crowdsourcing). The reporting loop allowed the user to make a selection of the status of a Water Point (WP), but the option for textual description was removed.
The current release of the App (SEMA App Ver. 3.0) allows users to directly dial a real USSD code (*150*50*25#) to trigger the system. No password is required as only (institutional) registered users (by SEMA Administrator) can access the system (highly-constrained crowdsourcing). No language selection option in this release either; Swahili is the only one used. Initially, the App was designed under the assumption that users could systematically distinguish the status of a WP within the three categories, i.e., functional, non-functional and need repair. In this release, users receive a series of challenging questions regarding the WP under reporting, and based on the responses the system determines the actual status of the WP. (Low discretion granted to users. The only discretion users have is binary, to answer a “yes” or “no” to the presented questions). Moreover, there is no option for users to give a textual description about the reported WP.
3.1.3. Performance
There have also been remarkable milestones of the App over its evolution journey in the context of performance. Initially, it took about three minutes to complete one reporting cycle with SEMA App Ver. 1.0, which had a cost of TZS 1200/= ($0.52990). The App also supported all mobile operators (Vodacom, Tigo and Airtel). In the subsequent release (Ver. 2.0), it took between two minutes to hours (even days) to complete one reporting cycle, which was highly dependent on the network load at the time of reporting. This was due to the Web API hosting server. The cost for completing one reporting cycle using this (second) version of the App was TZS. 300/= ($0.13248); a remarkable decrease by a fourth from the first release. The App also supported all mobile operators as in the first release. In SEMA App version 3.0, it takes as less as half a minute to complete one reporting cycle, depending on the speed of the reporter in responding to questions. This version supports only Airtel and Vodacom providers, and costs TZS. 92/= ($0.03974) per one cycle of reporting for Vodacom users but is free for Airtel users.
3.2. Current Architecture
3.2.1. Mobile App
It should be noted that before embarking into re-inventing another mobile app for capturing information system, a survey and thorough evaluation of existing software was conducted to assess their readiness for this context. The evaluated apps included: Akvo FLOW (see http://www.akvo.org) and mWater (see www.mwater.co). These two applications are Android based application that work on smartphones. However, in our context, the users in the rural areas do not own smartphones and Internet access is very limited. Thus, re-using these apps in our context was not appropriate due to the nature of the context.
The intended users of the Mobile app were COWSO members in the rural areas where Internet bandwidth is not available. Therefore, the only possible technologies that can be used in the rural settings were SMS and Unstructured Supplementary Service Data (USSD). However, due to slow communication when SMS is used, USSD was then choses as the most suitable technology in the rural areas. The Mobile application was carefully designed and appropriate technology was chosen. Specially, PHP programming language was chosen as the language for implementing the application where a MySQL database management used system and the system was hosted on Ubuntu Linux operating system powered server. USSD is a Global System for Mobile (GSM) communication technology [19] that is used to send text between a mobile phone and an application program in the network. Specifically, USSD, sometimes referred to as “Quick Codes” or “Feature codes”, is a protocol used by GSM cellular telephones to communicate with the service provider’s computers. USSD can be used for WAP browsing, prepaid callback service, mobile-money services, location-based content services, menu-based information services, and as part of configuring the phone on the network. USSD messages create a real-time connection during a USSD session and the connection remains open, allowing a two-way exchange of a sequence of data. This makes USSD more responsive than services that use SMS. In our situation, USSD was the appropriate technology because it enables the identification of the users by registering their mobile numbers, assigning a water point to a reporter by mapping a water point record to a mobile number and updating a water point functionality status.
The mechanism of capturing the coordinates of the water point at that time was by using a Trimble GPS receiver that was very much complicated to record, read and data can only be transferred from the GPS to the water points mapping system (see Section 3.2.2) by a few GIS experts. This also was looked at, and an Android Application that works on Smartphone, which captures coordinates and water point photos then transfer the data straight to the WPIS API, was developed. Prior to the SEMA project the Ministry of Water had already developed a Water Points Mapping database system and had already envisioned a paper-based updating mechanism, which works in such a way that a COWSO member initiates the process and submits a report to the Village Executive Officer (VEO), the VEO then passes on the report to the Ward Executive Officer (WEO) who submits the same report to the District Water Engineer (DWEs). The DWE then submits the report to the Ministry of Water where the paper report would be transcribed into the WPM database system. The mobile updating mechanisms developed here is an improvement of the already existing practices. It is more efficient because data are passed on electronically, and hence its originality can be tracked.
3.2.2. Back-Office and Dashboard
Figure 2 presents a schema diagram of the innovations for implementing a Water Services Information Infrastructure as envisioned in this project. The whole network of the Apps developed was code named Sensors, Empowerment and Accountability (SEMA). At the beginning of the project, it was envisioned that a mobile reporting tool cannot exist on its own, rather it is a part of a larger information infrastructure which involves existing installed base. In Figure 2, the national Water Points Mapping System (WPMS) is represented by the cylindrical icon at the top left corner. This houses all the registered water points of the Ministry of Water. Even though the ultimate goal was to update the WPMS system, this ministry system was not equipped with Web API function, a technology that could have enabled it to be connected with a mobile tool. Hence, it was necessary to build up a staging database system to be integrated with the mobile tool which is represented by the DHIS2 WPMS icon. Water point data then would flow from the reporters who are using the USSD mobile application in the Feature phone, to a USSD gateway at a mobile operator represented by the SEMA USSD APP icon to the DHIS2. Since the DHIS2 database has a Web API feature, this opened up the opportunity for the system to be integrated with other systems such as the national Water Dashboard, Mobile dashboards that can be used by the Ward Executive Officers (WEOs), Village Executive Officer (VEOs) and the Councilors in the wards. In addition, the DHIS2 WPMS can be updated using an Android App for registering new water points. The dashboard also allows to calculate spatial measure, such as the distance from each health facility to the nearest water point and to compute water scarcity in an area by calculating the distance to the nearest water point for each cell in a raster layer.
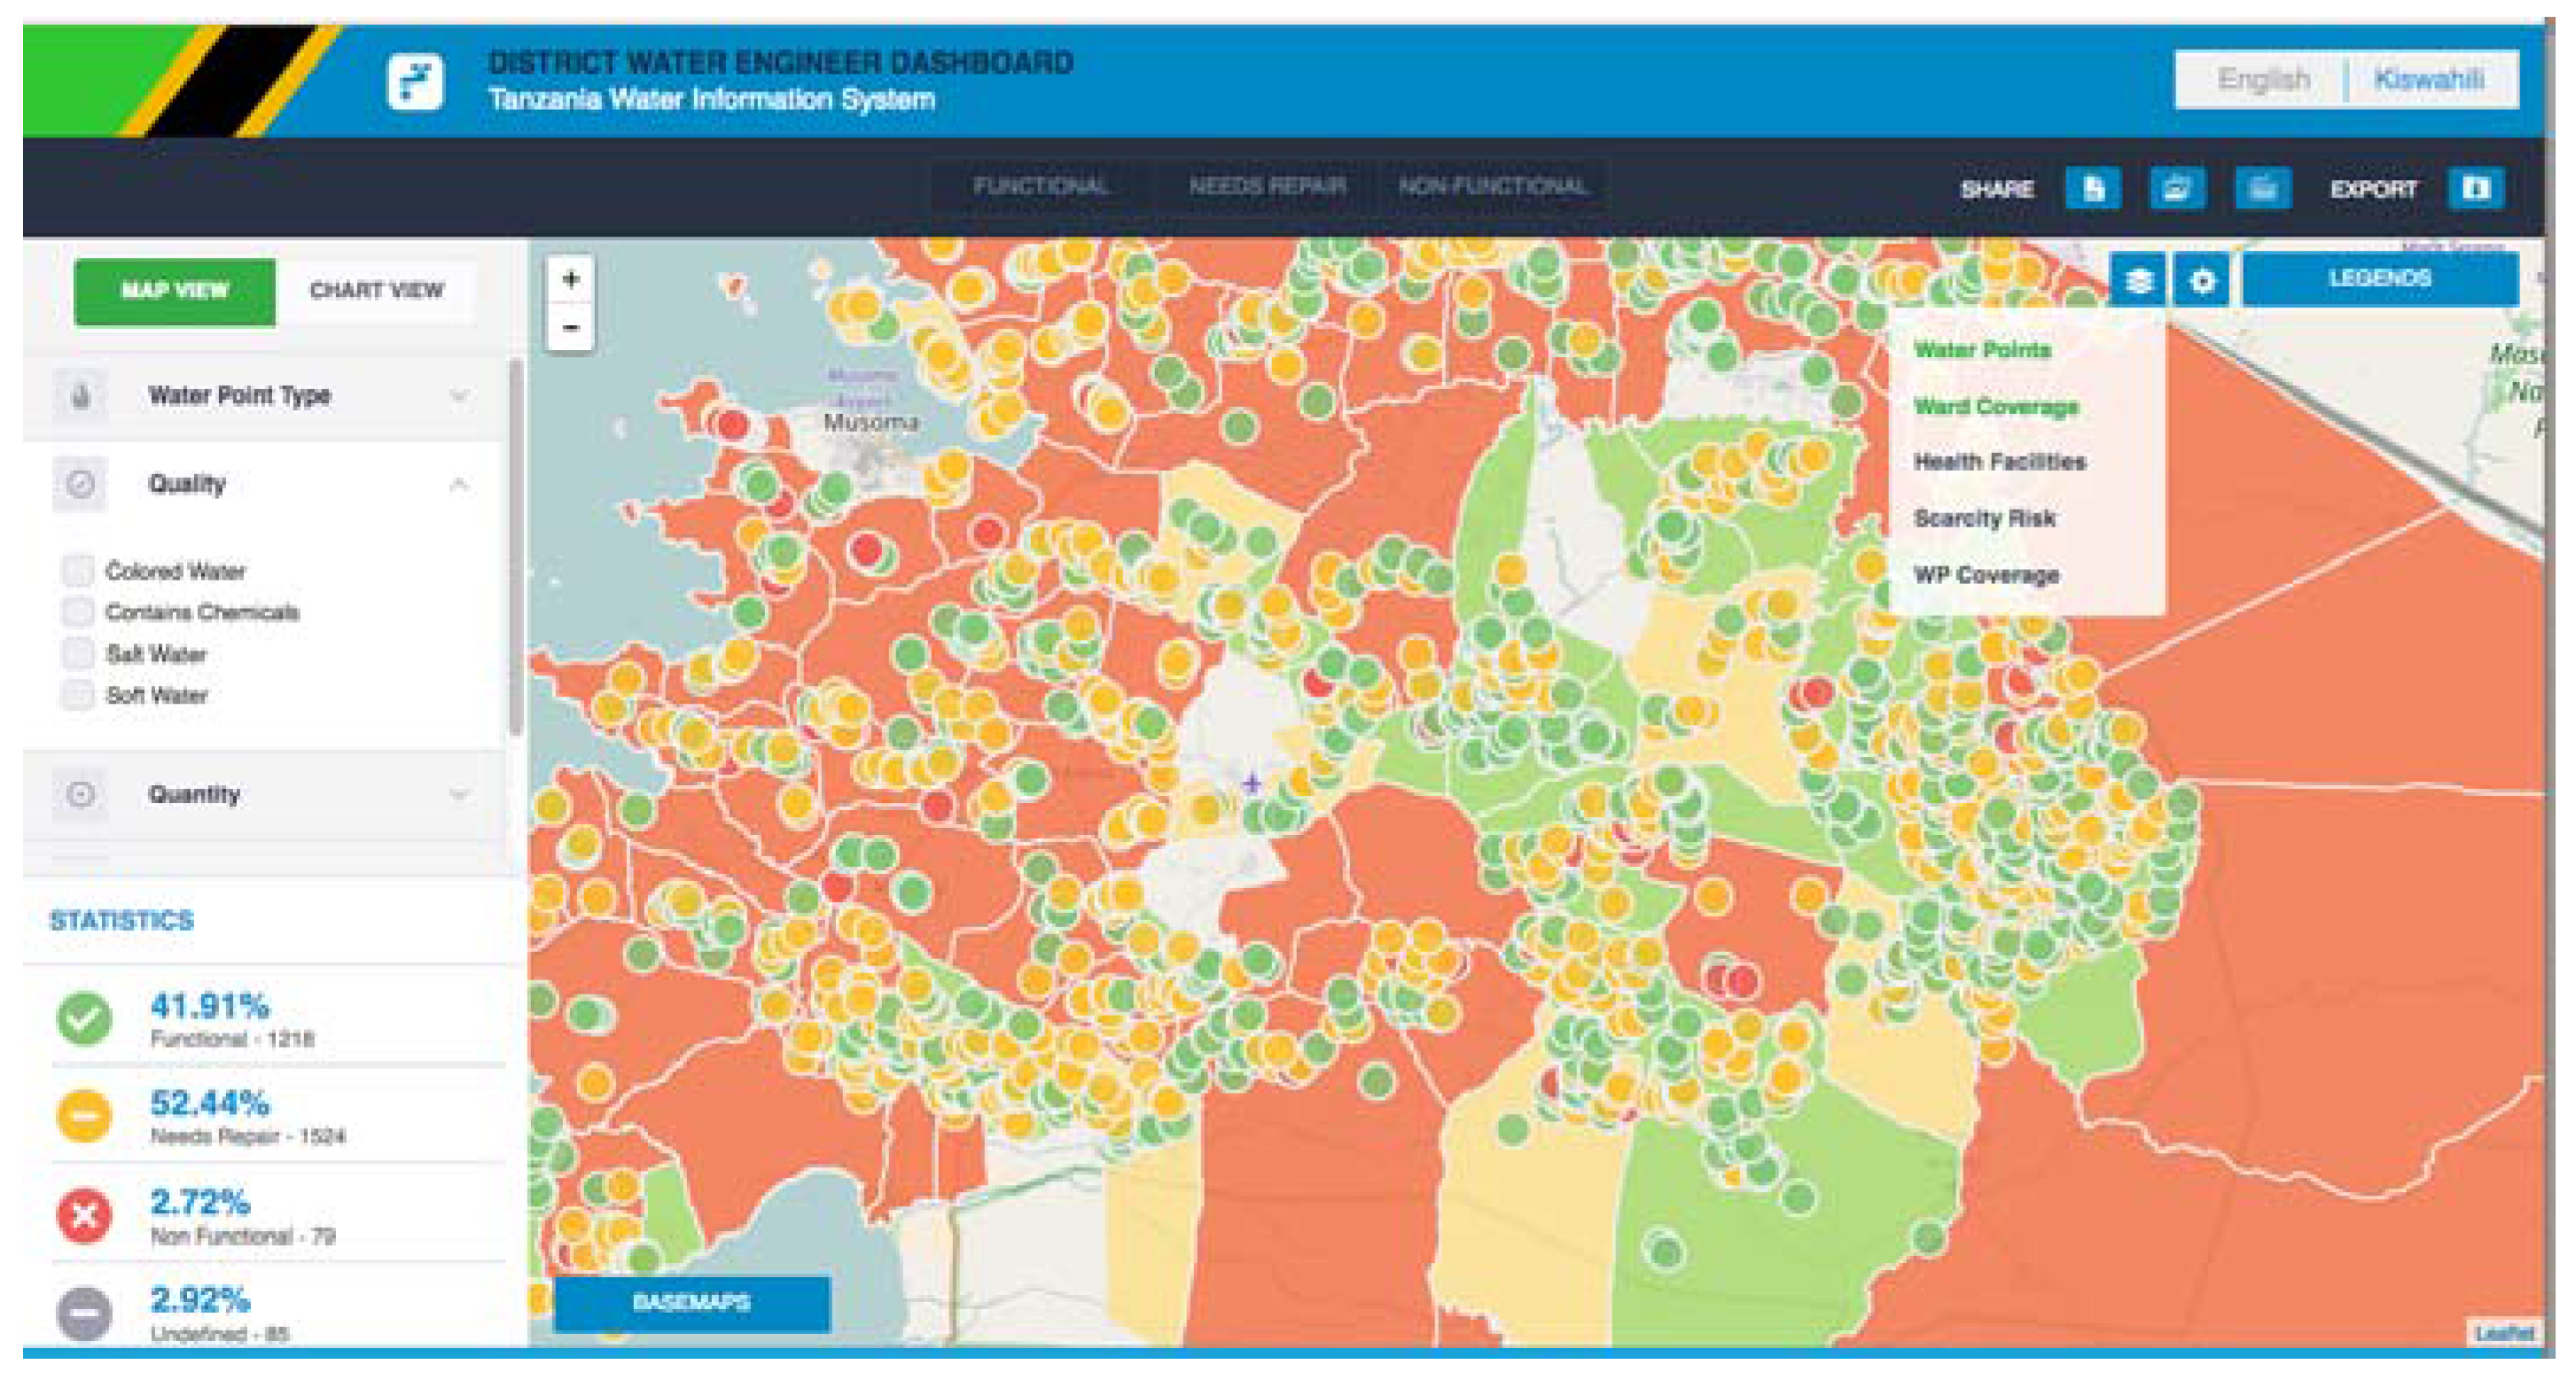
As presented in Figure 3, the dashboard improves the analysis of the data captured in the SEMA infrastructure by implementing advanced features such as water coverage, scarcity analysis and the distance between a nearby water point and other social services such as a health center.
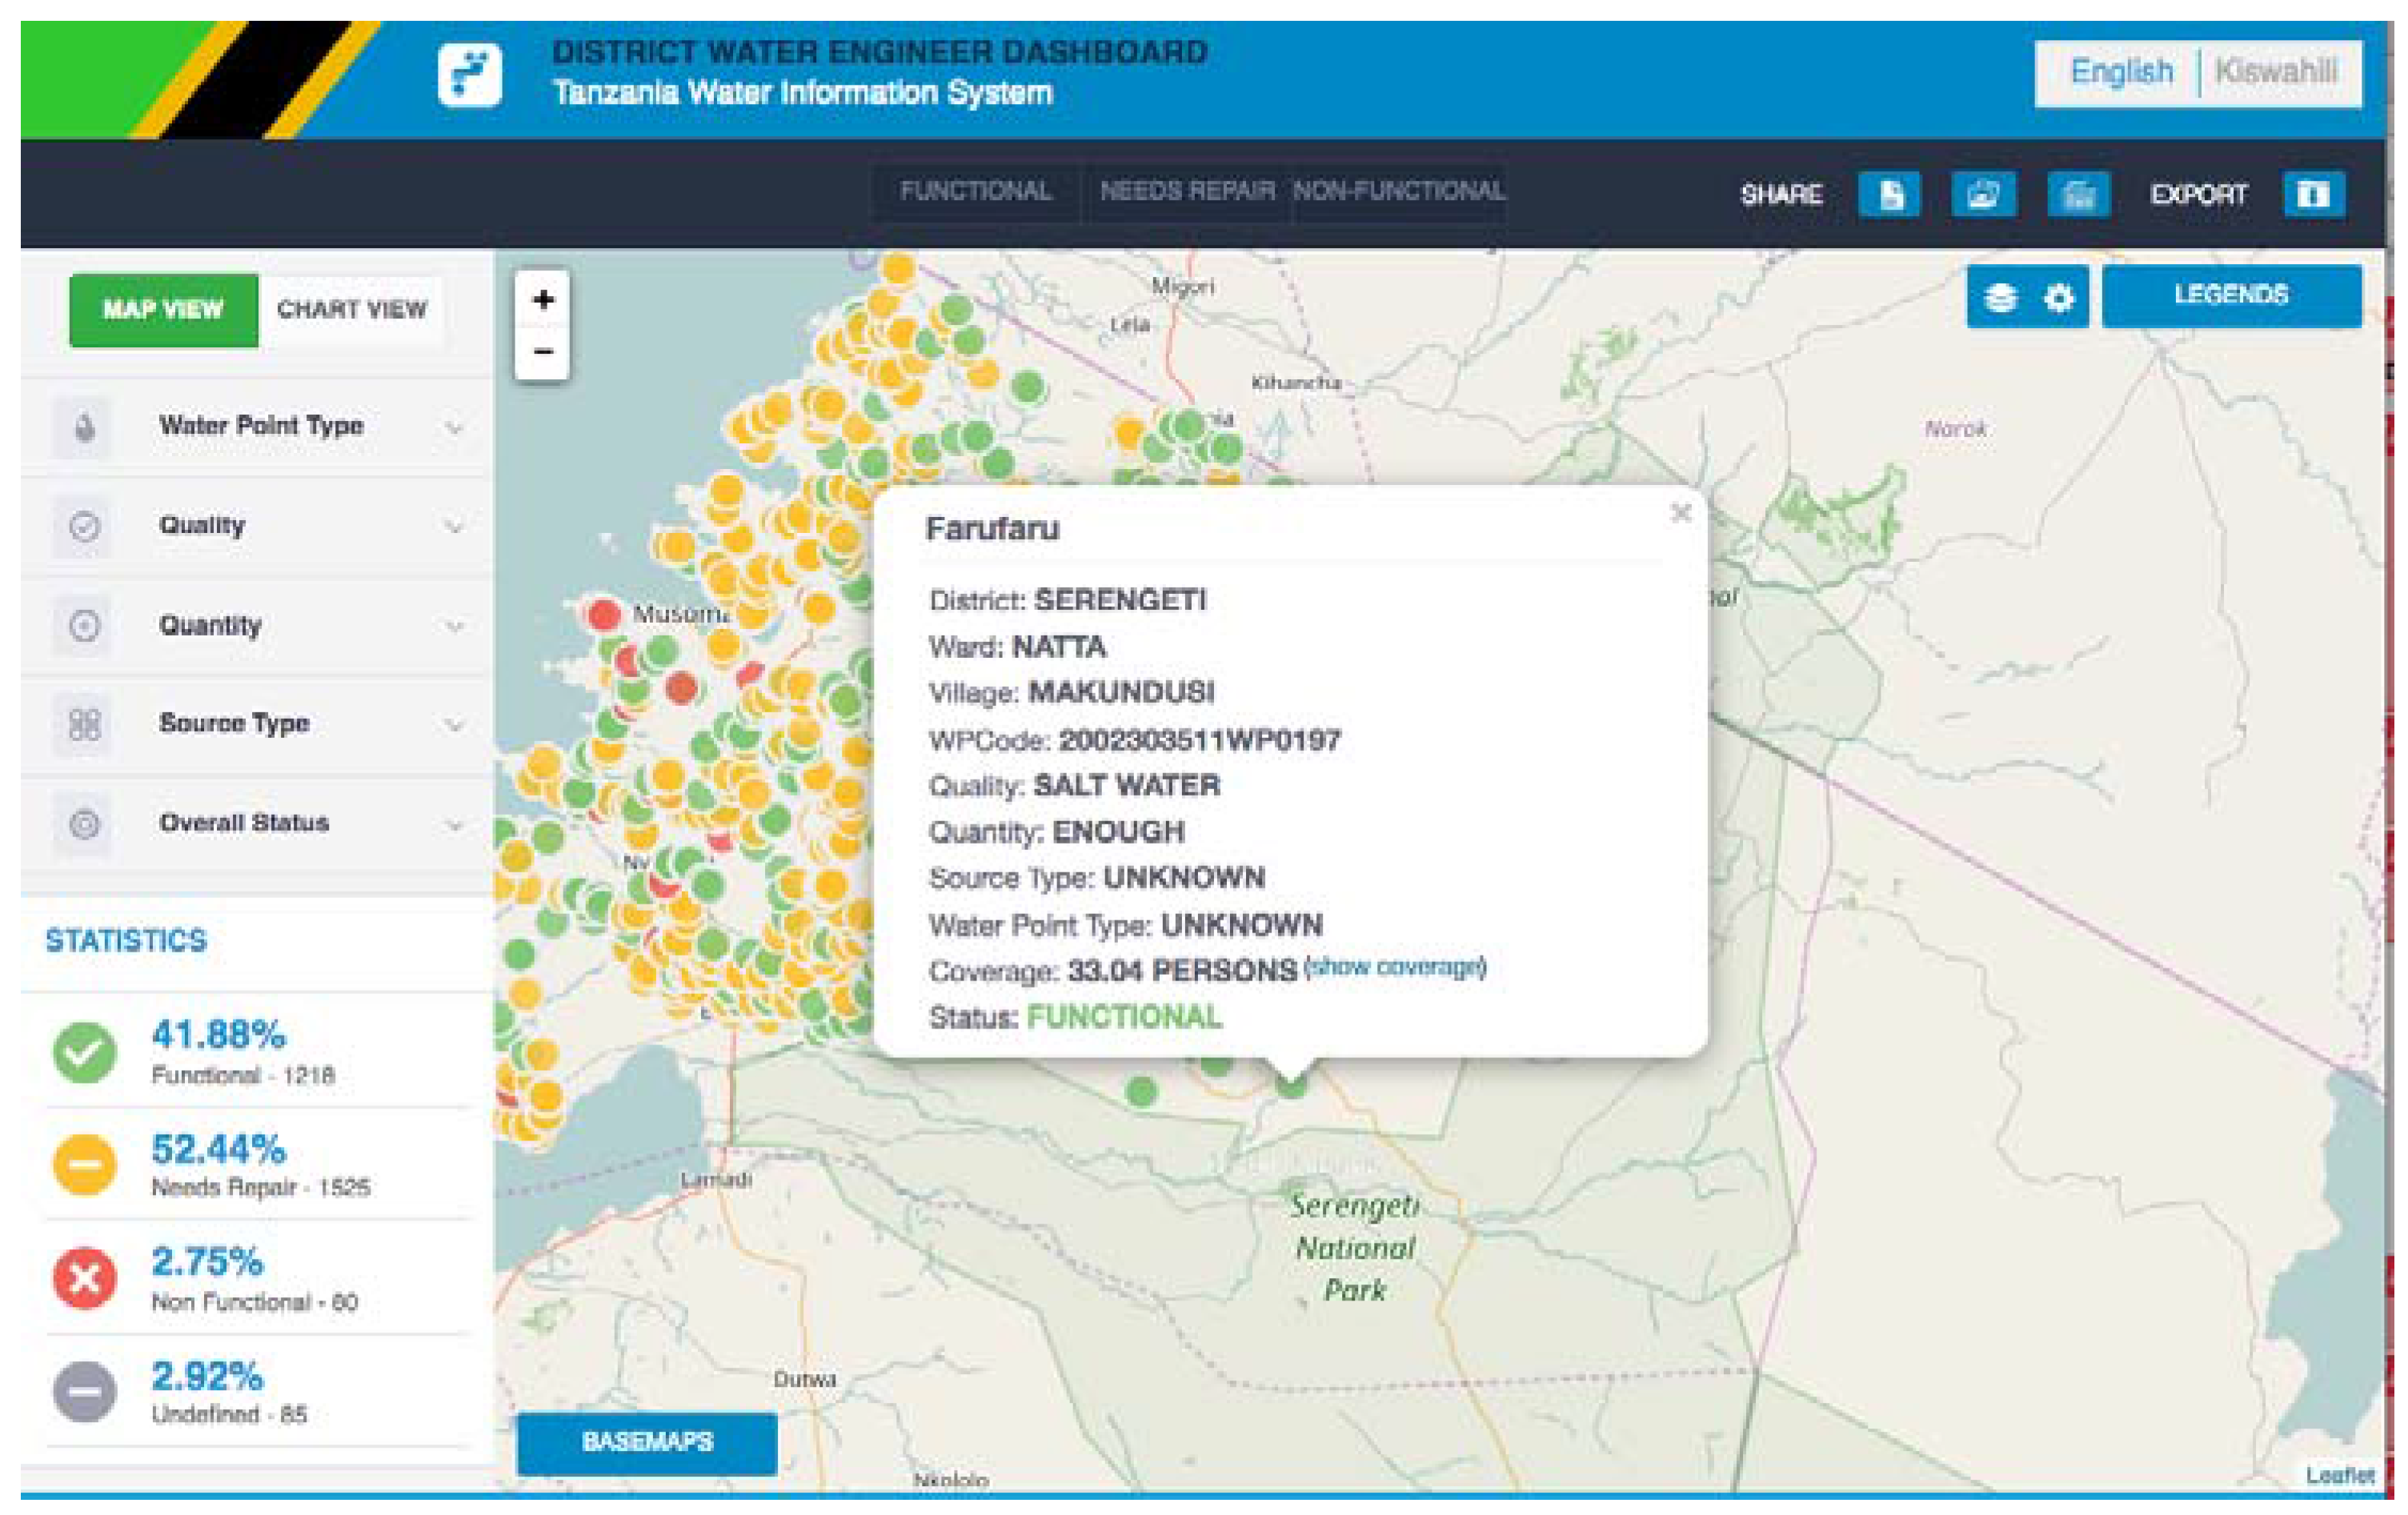
Figure 4 represents a District water engineer’s dashboard fetching data from the SEMA App database (i.e., DHIS2 WPMS) dynamically, using lightweight dashboard technologies that can work on smartphones.
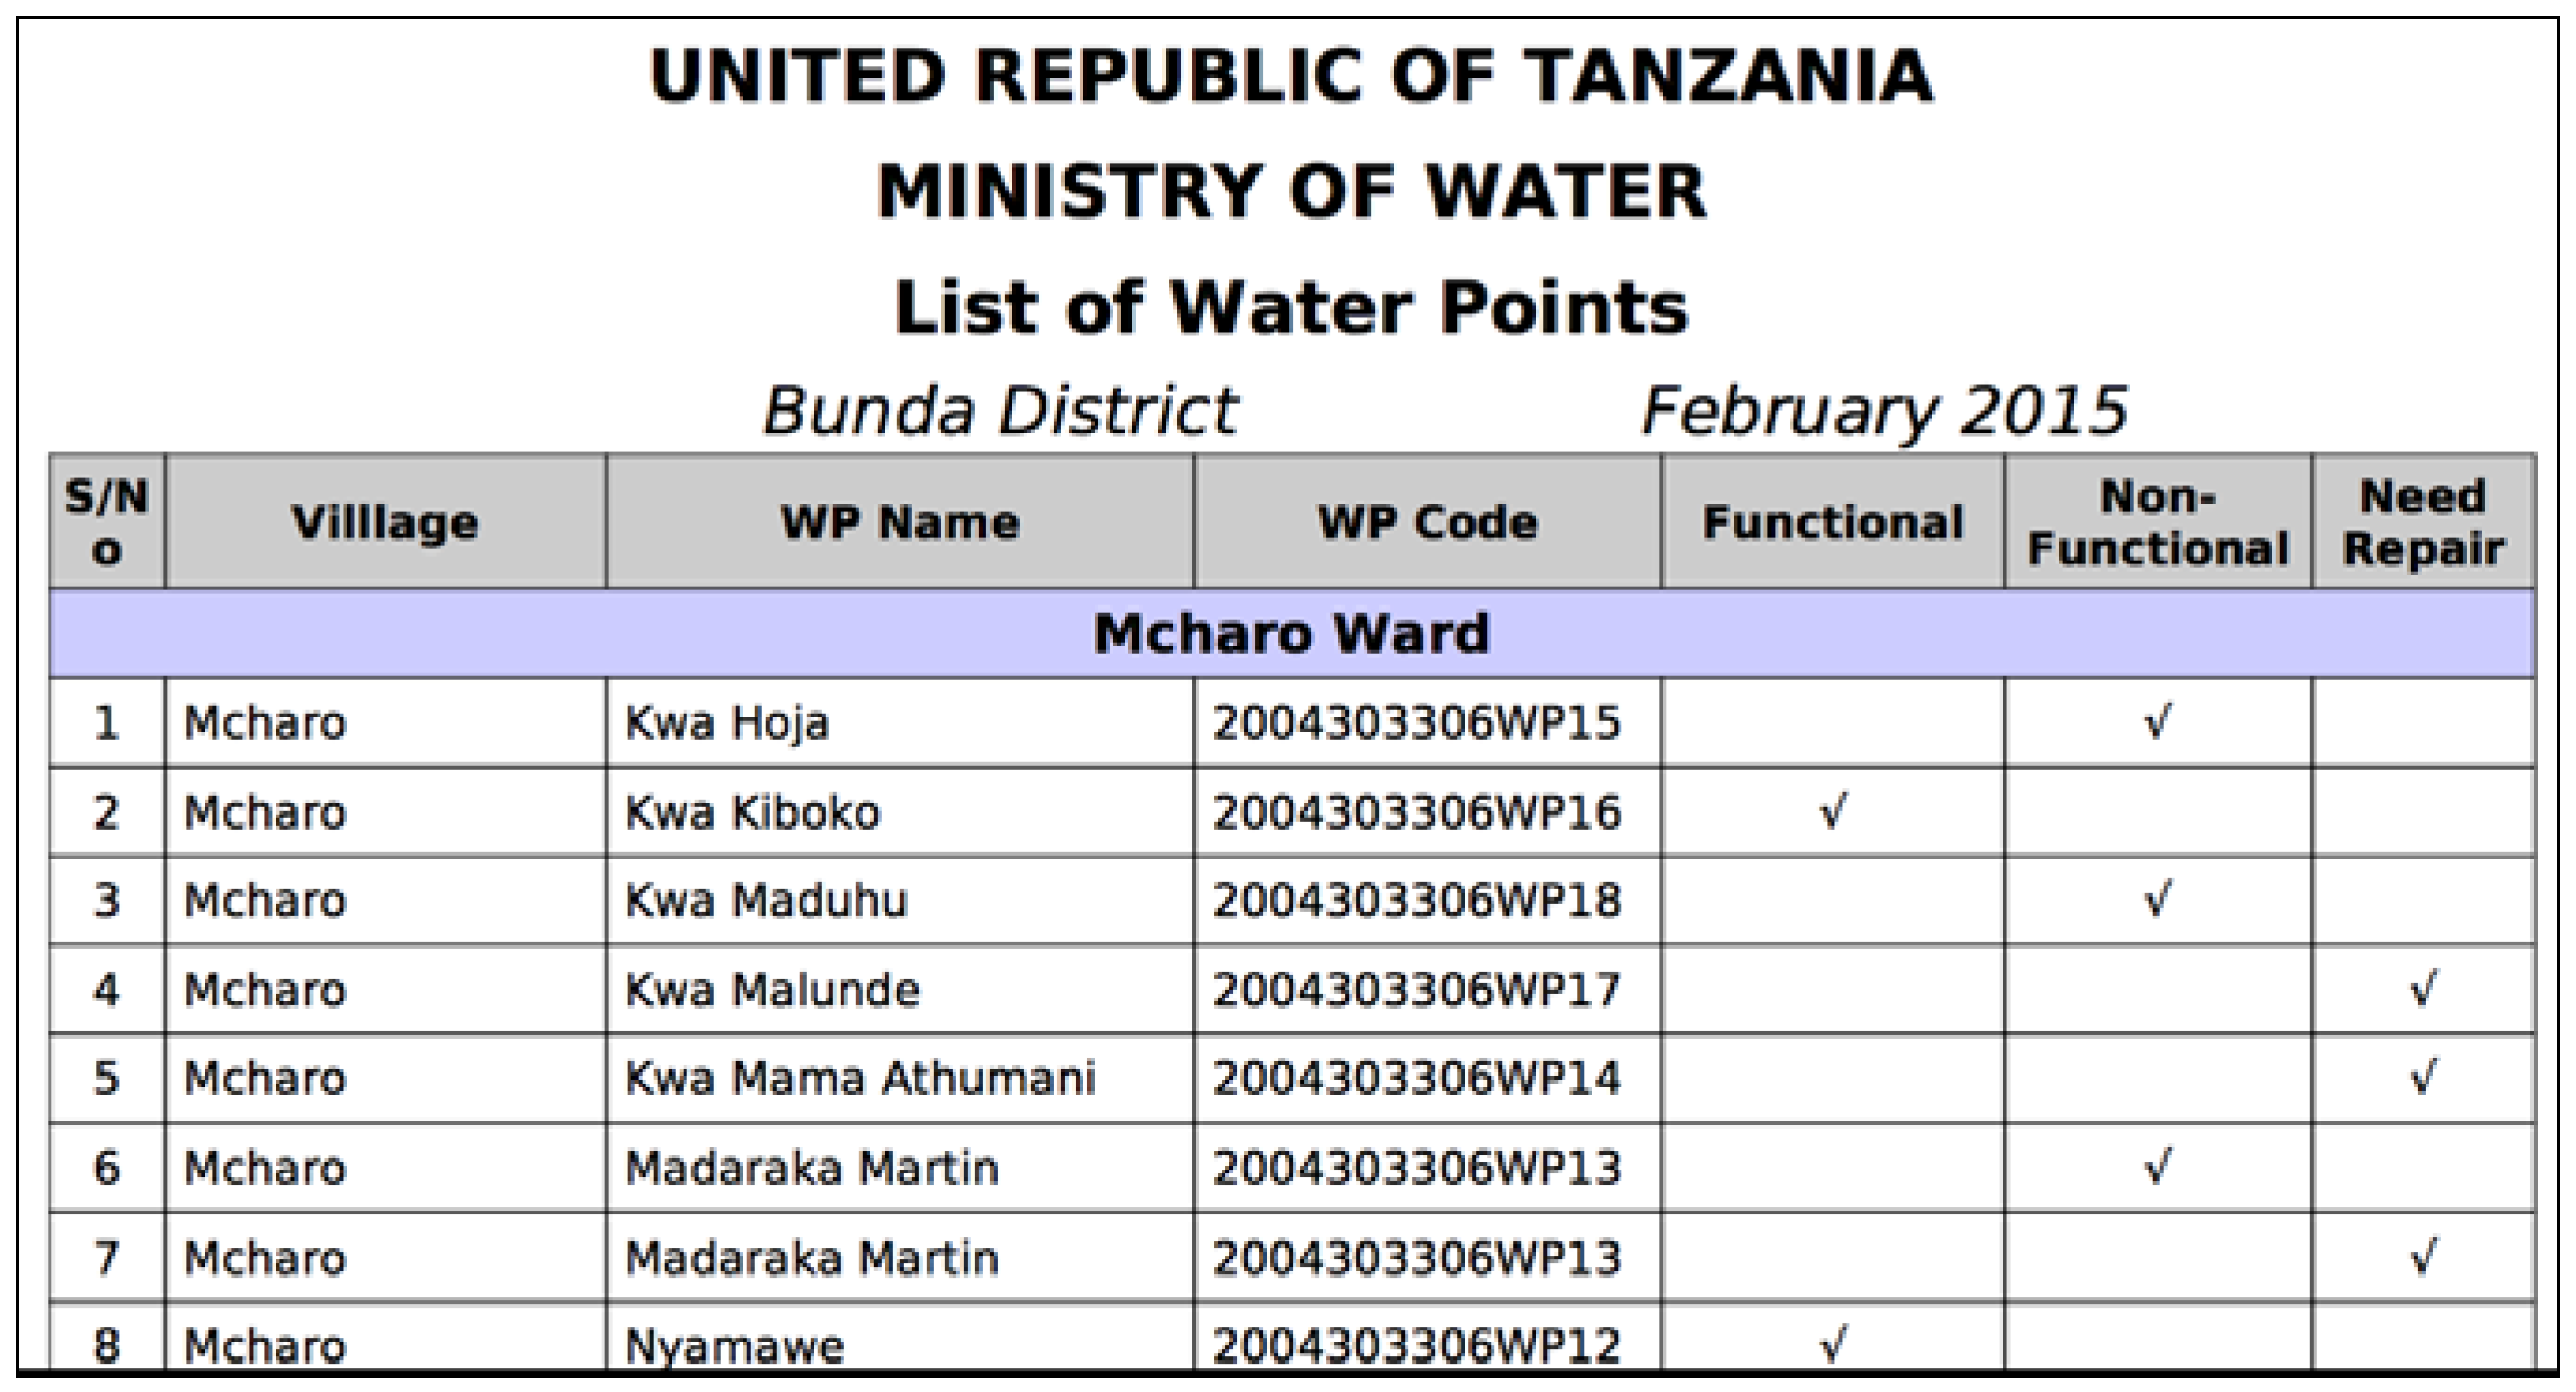
The SEMA App infrastructure also has the capacity to produce standardized reports that can be used in official reporting and sharing the data. Figure 5 presents a standard report which lists all water points in the district with their respective status in a particular given period.
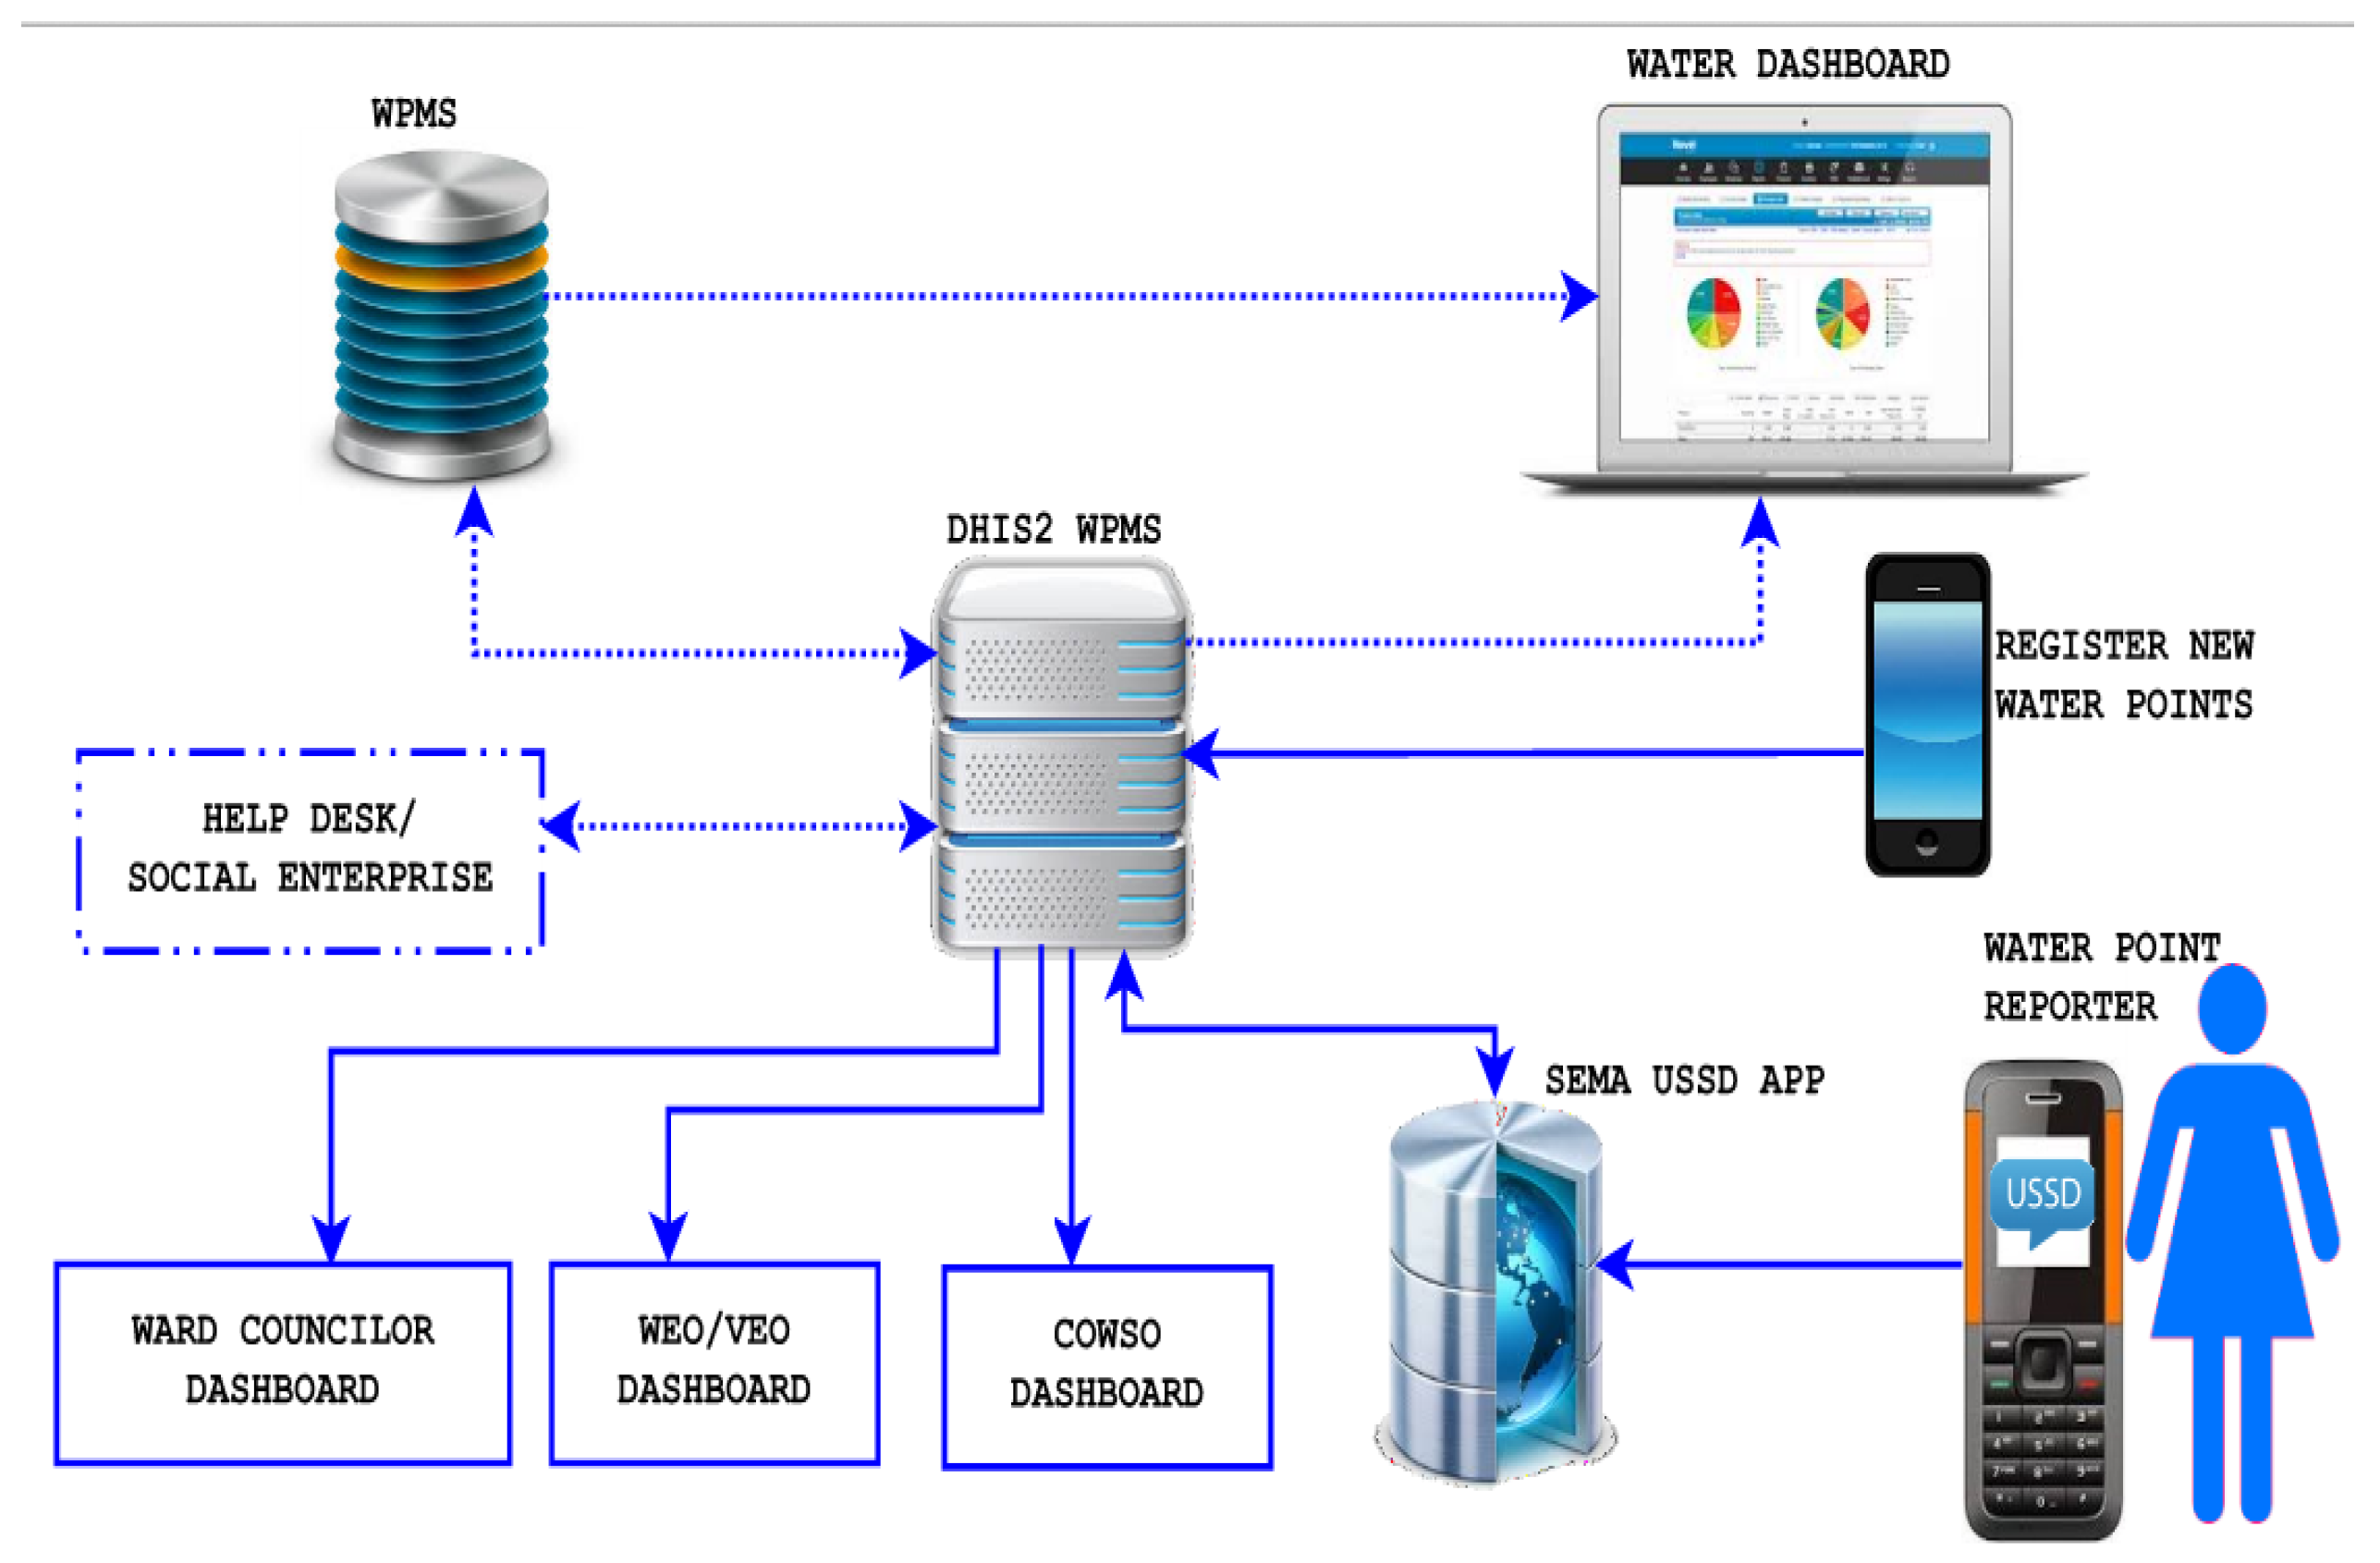
The actual deployment of the system is depicted in Figure 6, which shows a description of data flow in the system and can be summarized as follows:
- User dials a short code (the project used *150*50*25#) and sends a special text to operator
- Short code operator forwards the message to a USSD URL server
- USSD APP Server processes the message and stores the values to a local database
- SEMA WPIS API Server receives data values as Web API from a local USSD server
These reports can then be accessed by registered users at the Ministry of Water and Irrigation, Regional Water Engineer (RWE), Village Executive Officer (VEO), Ward Executive Officer (WEO) and COWSOs (Community Owned Water Supply Organizations).
3.2.3. Context Model
The aim of context modeling in SEMA is to generate, store, analyze and create value for human-sensed data. A major segment of SEMA deals with analyzing and creating value for data through a proper handling of context. The idea is to improve our understanding of and ability to analyze the content generated by the reporters, also referred to as human sensors, who use a mobile app to report the status of water points. The preferred strategy is to use a combination of semantic and geovisual analytics techniques. A linked-data approach has been put into place for the deployment of a context-based system labeled as SEMAntics (a blend of the words SEMA and Semantics) (see [20]). It uses an ontology which contains concepts and relationships between them, relevant to the domain of SEMA [21,22] and was built through a number of interviews and discussions between project partners and with experts in the field.
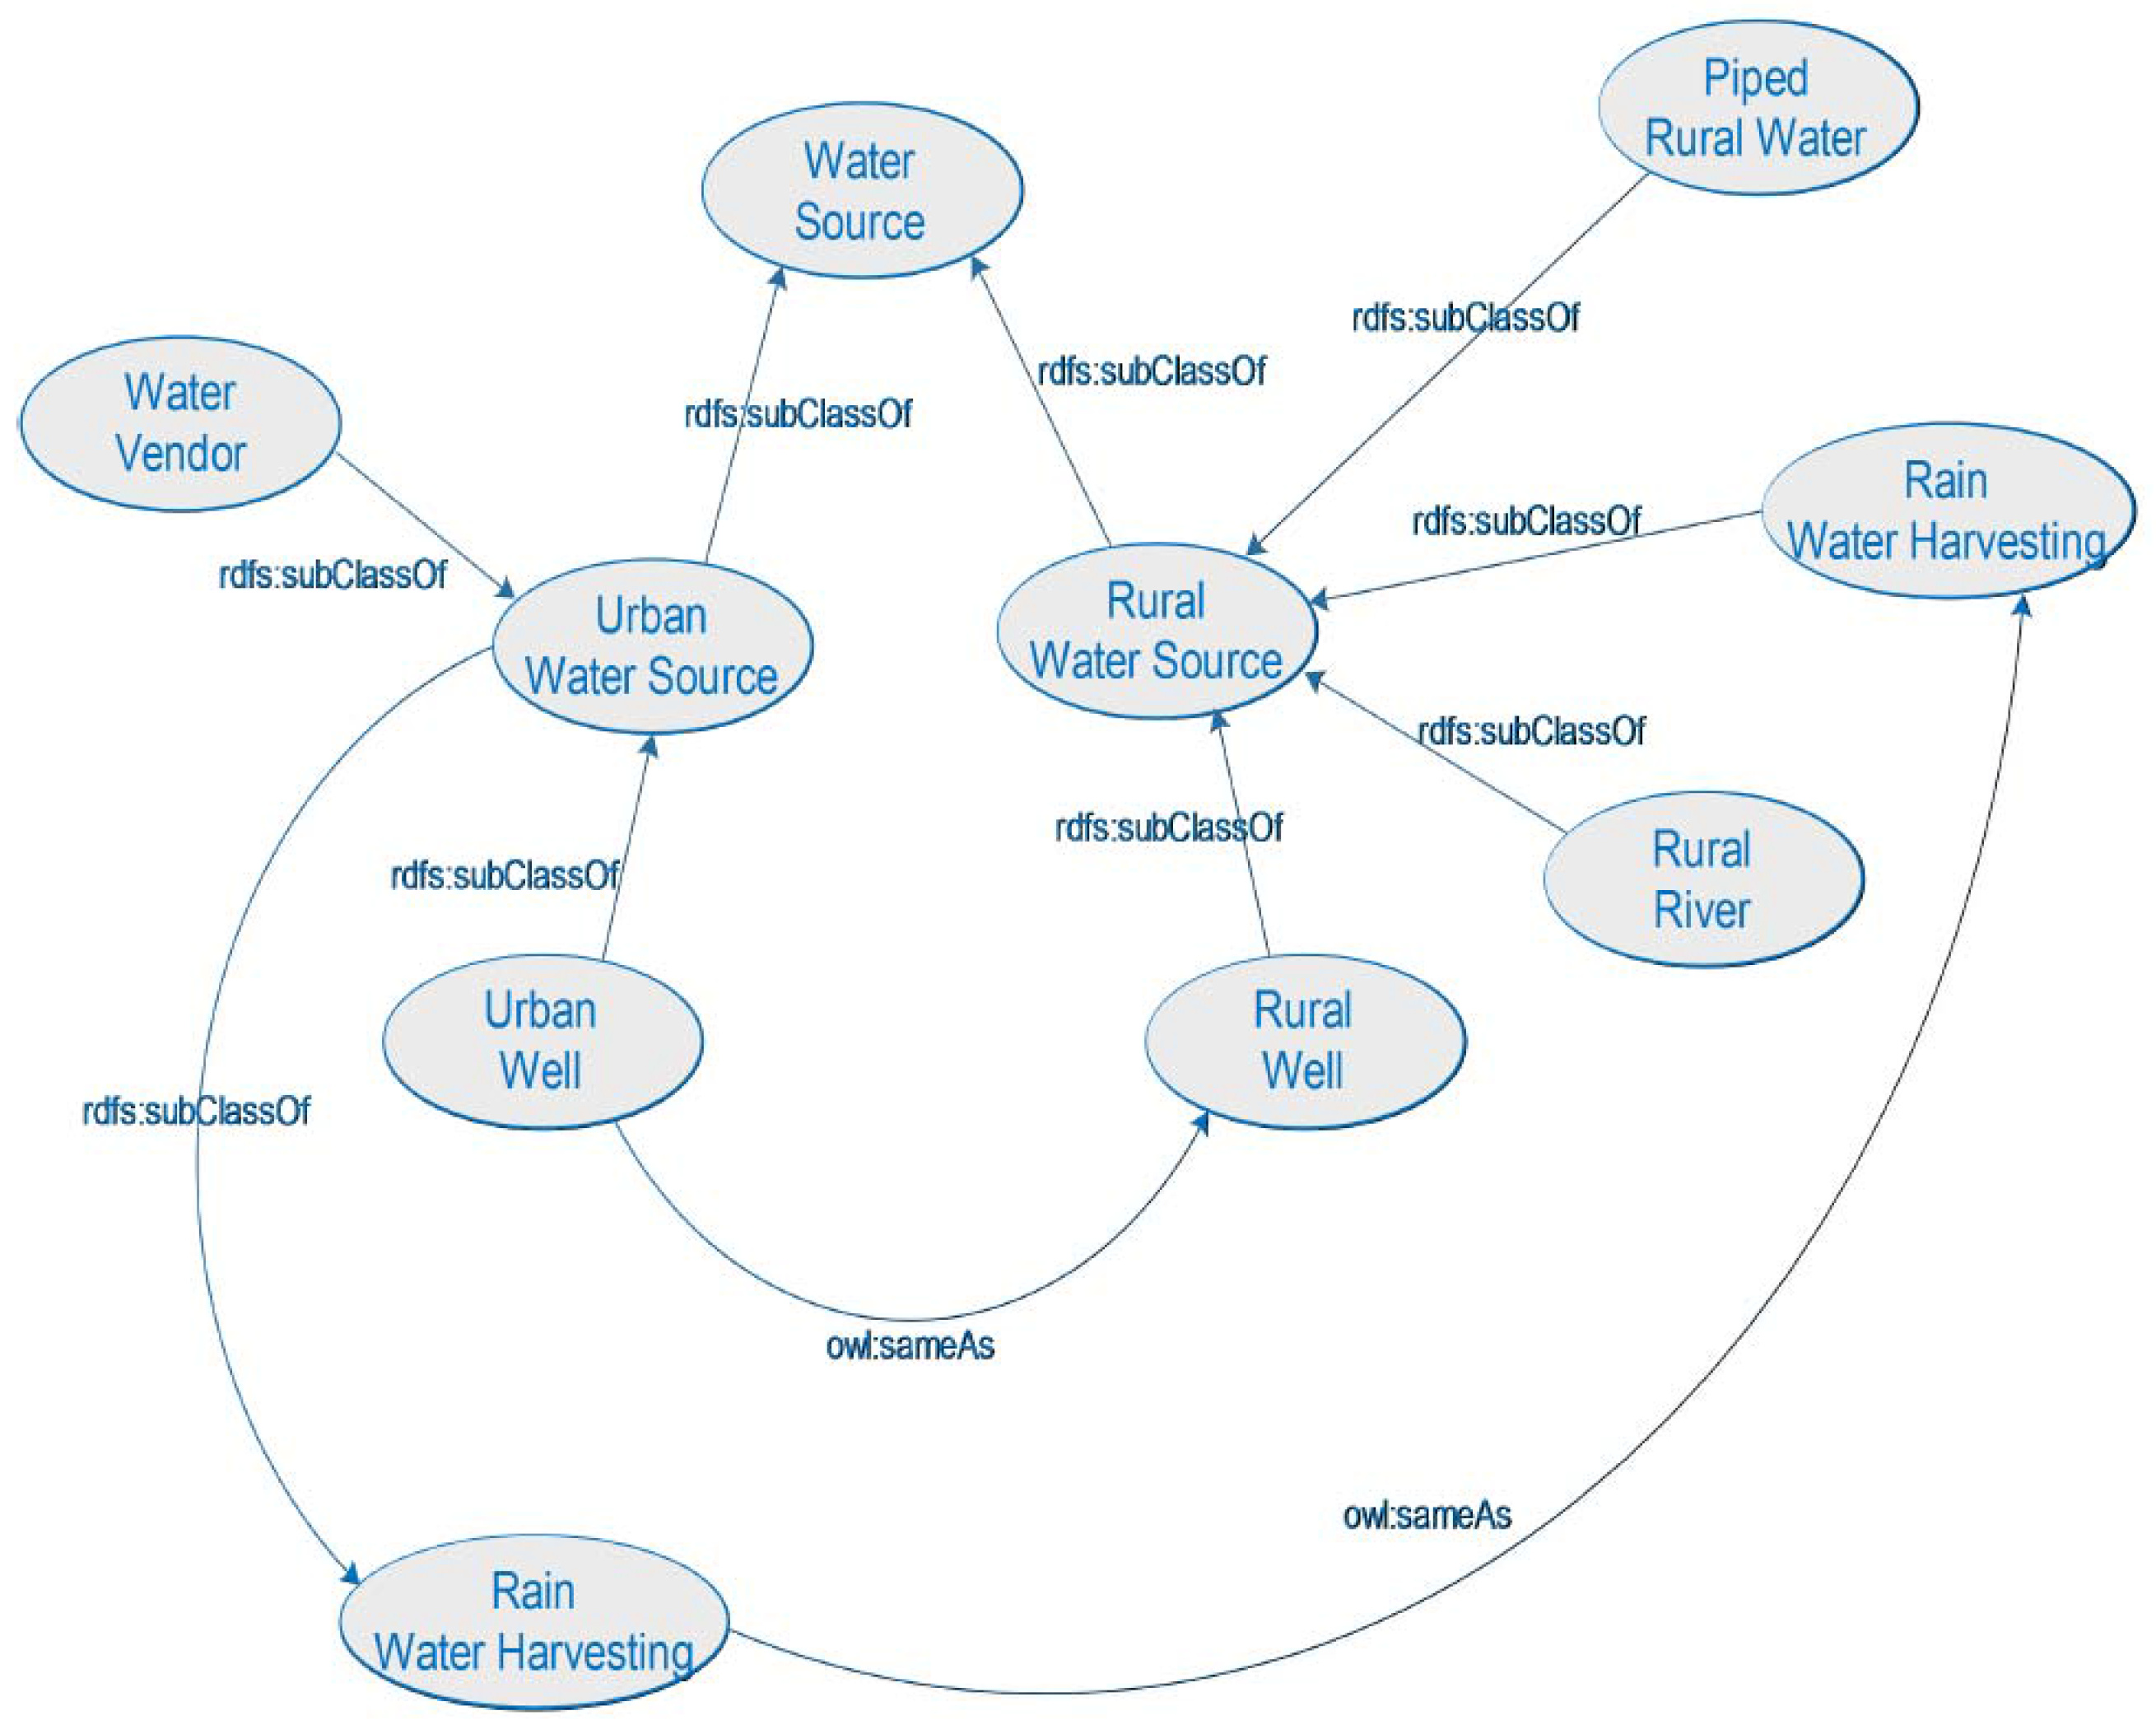
The application of the SEMAntics system is made by formulating competency questions whose answers require the use of contextual relationships. It is important to create a match between concepts of sub-domains within the SEMA ontology such as the urban/rural water sources or formal/informal sectors. The SEMA reporting system focuses on the status of only rural water points, which can be linked with the status of urban water points from other data sources. Figure 7 showcases the linkage of identical concepts in rural and urban domains and derived classes as super concepts.
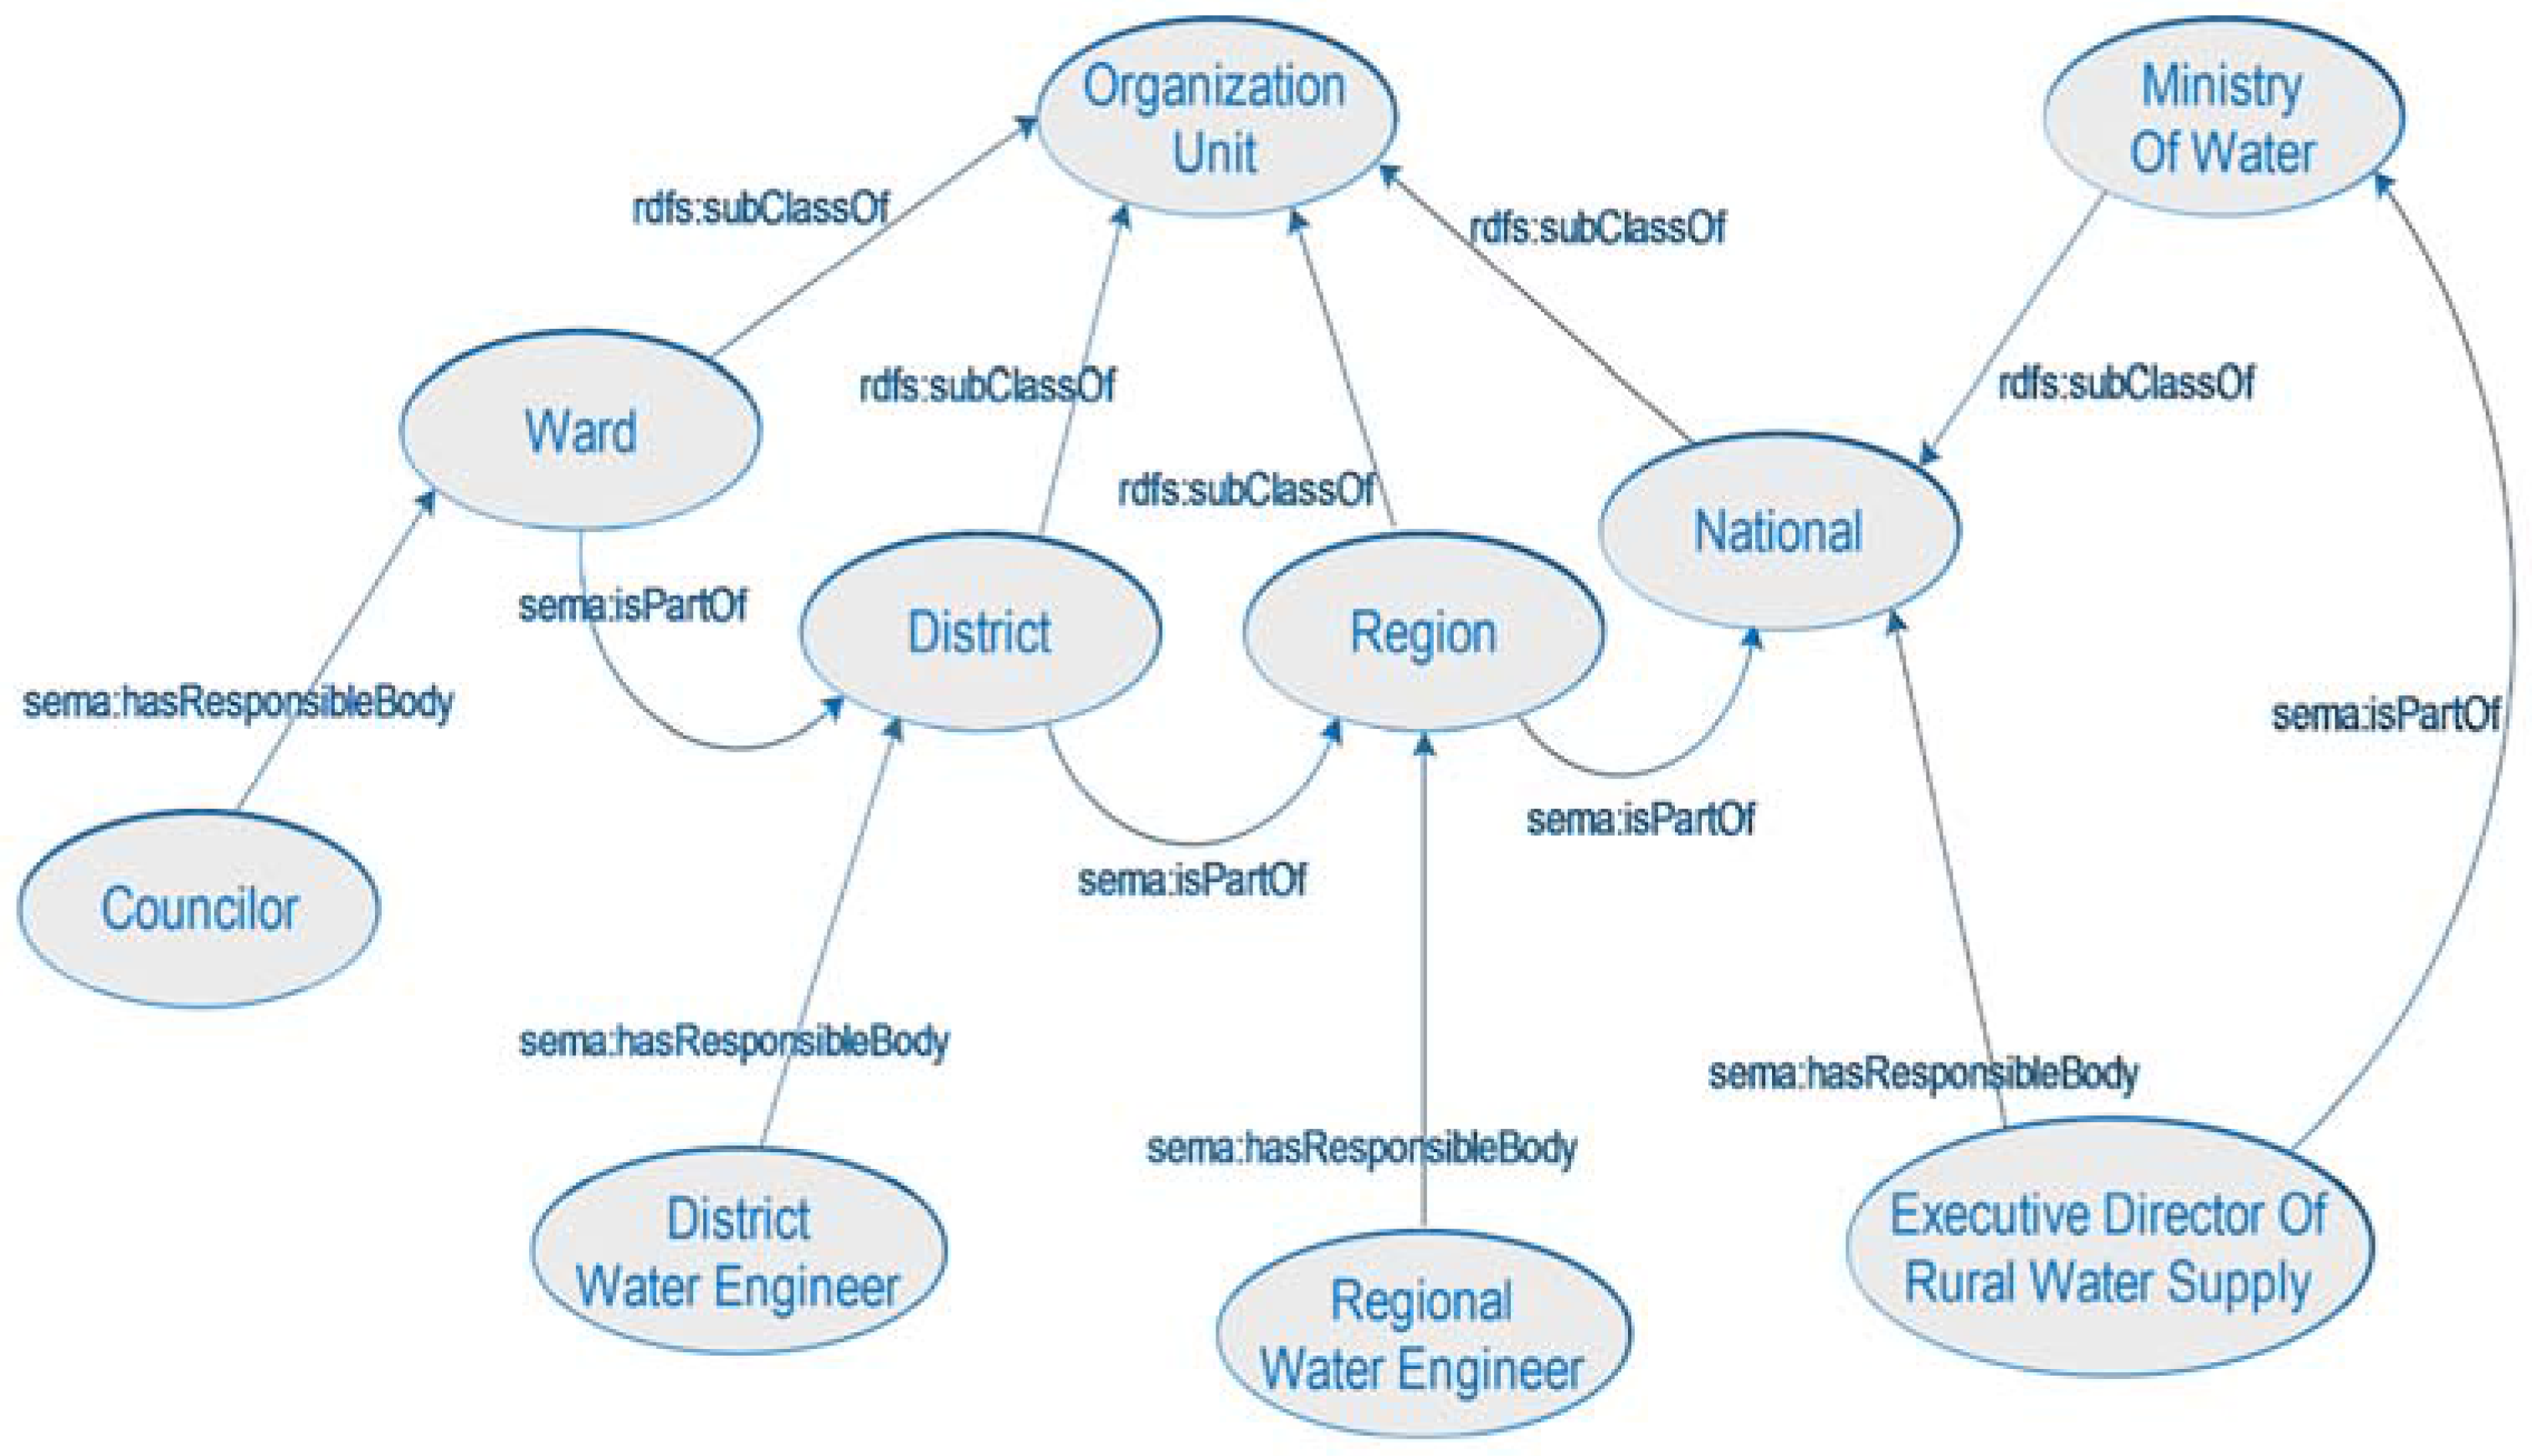
The innovation in this part of the project is the integrated and formalized capture of technical and social aspects and the integration of geographic information. We built a software prototype, which can answer basic but non-trivial queries such as: “Provide a list of functional rural water points in Bunda district”. As in our data sources the water points are not initially classified as “rural”, the ontology enforces a hierarchy with super/sub class relationships in such conceptualization and facilitates the answering of such queries, which cannot be easily realized with a traditional GIS-backend. Obviously, as the ontology is expended, more sophisticated query types can be handled. Figure 8 shows for example the conceptualization of administrative responsibilities, which allows us to couple water points to managers.
In the course of our research project it became evident that we cannot expect large amounts of reports as was originally anticipated on, due to the social structures in Tanzania. As a measure to be still able to test our methods, the system has been adapted to specific queries of known users and involve more institutional data. The SEMAntics system has been initially tested in combination with the DHIS2 system, which forms the backbone for the storage and retrieval of (non-contextual) information gathered with the mobile app.
4. Deployment
4.1. Registration of Users
The reporting technology uses a USSD Technology and a SEMA based DHIS2 platform. Since the application is a USSD based app, it works on both smartphones and feature phones. To be able to report Water Point functionality using the system, a reporter has to be registered in the SEMA system. Information required during registration included: full name of reporters, their mobile numbers and physical home address or location. These details are then assigned to (a) particular water point(s) relating to the reporter.
If the reporter changes a mobile number, loses his/her SIM Card or mobile phone and does not use the same number again, s/he has to report so that the new number can be registered into the system, otherwise s/he will not be able to report. Reporters are also urged to report if they move from the initial assigned area (relocation, marriage or travel) and are unable to report on water point functionality so that a new reporter can be assigned for those water points.
Once a user is added in the system, upon dialing a short code *150*50*25#, a list of assigned water points would appear on their mobile screen, followed by a series of questions. The reporter is required to answer all the questions accurately, and, at the end, the reporter will get automatic feedback that the submission was successful. The SEMA system allows for users with Airtel and Vodacom mobile numbers to register. For Airtel subscribers, reporting is free of charge while reporting for Vodacom subscribers SMSs are charged at a cost of TZS. 92/=. The platform that is used, DHIS2, allows for broadcast or bulk SMSs module that facilitates sending of SMS to all registered users. This function of the system enables the DWEs to remind reporters to send their monthly due reports as well calling them for training sessions.
4.2. Training of Users
Once registration of reporters was completed, the project team conducted village-to-village training for the reporters so as to enable them to be able to use the system (see Figure 9). Training was conducted in all four districts: Bunda, Morogoro Rural, Mufindi and Njombe; by UDSM, UT together with SNV Netherlands Development Organisation. SNV was responsible for coordinating the events, i.e., inception meetings and training workshops. UDSM was responsible for registering users (reporters) in the system and conducting training to reporters on the use of mobile phones for reporting.
These training workshops were preceded by a one-day inception meeting which involved water stakeholders (DWEs, VEOs, WEOs, COWSOs and citizens) in the particular district. The inception meetings were useful in sensitizing people on the importance of water, water conservation and paying for water. It also served as a platform for open discussion to address challenges in the water sector and provide recommendations for improvement.
The workshops were conducted in either or both of the two modes, which are: Training of Trainers (ToT) workshops and one-to-one reporters training. The ToT workshop involved training representative trainers (usually VEOs) who will later be required to train other water point reporters in various villages in the district. Furthermore, during the training the engineers at the DWE office in Bunda were also taught on the use of the District Dashboard part of the system. This dashboard can be used to obtain monthly reports of water point status based on what has been reported.
One-to-one training of reporters focused on training village reporters. This involved project members moving from one village to another, gathering all registered reporters in the area and training them on how to report on the status of water points using their mobile phones. The reporters also had the opportunity to ask questions and address any reporting challenges that they envisage.
The project team has identified, trained and assigned 1899 reporters to the 3078 WPs to facilitate timely reporting of the functionality status of WPs.
4.3. First Results
The project team worked with registered reporters from the districts to collect and update the information into the system. We have older data, but they are inconsistent and contaminated with test data. From 2016, we have, at least for Bunda district, a full year of information. From the number of reporters and the number of water points (shown in Table 3), it is evident that in Bunda our reporters were responsible for more water points per person than in the other three districts.
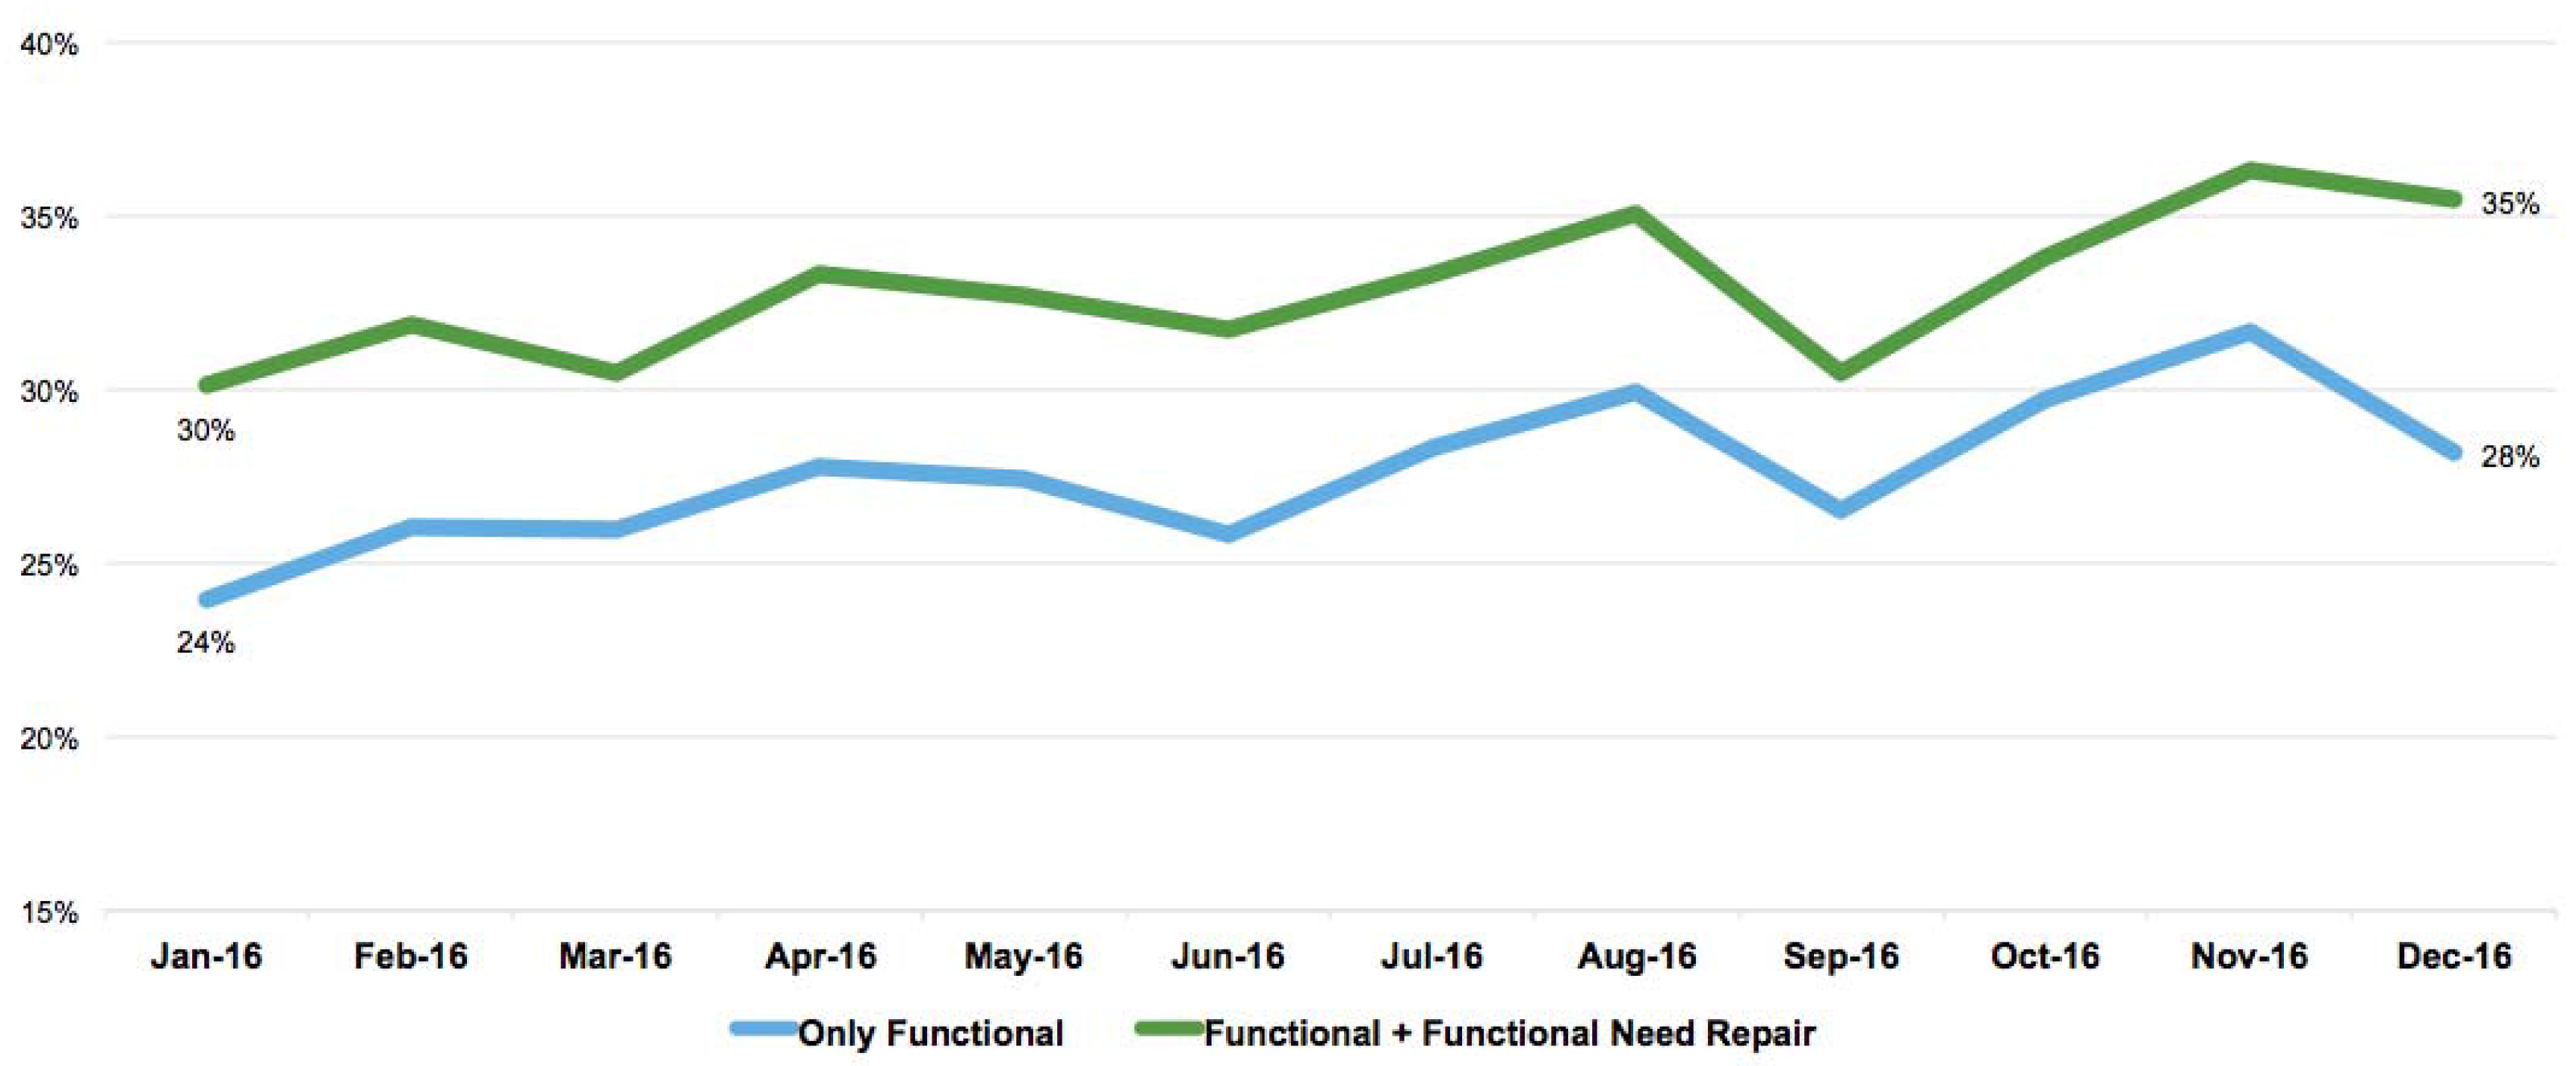
The longer reporters are active, it seems the more new water points are being registered in the WPMS, see Figure 10. It supported our belief in the importance of having intensive interaction with the local population in order to get full insight into the situation on the ground.
Table 4 shows the Consistency of Reports in terms of the number of reporters that on average report each month. It shows that, for Bunda, more than half of the reporters report each month, but, if we look at the percentage of WPs that are reported each month, we see this is less than half.
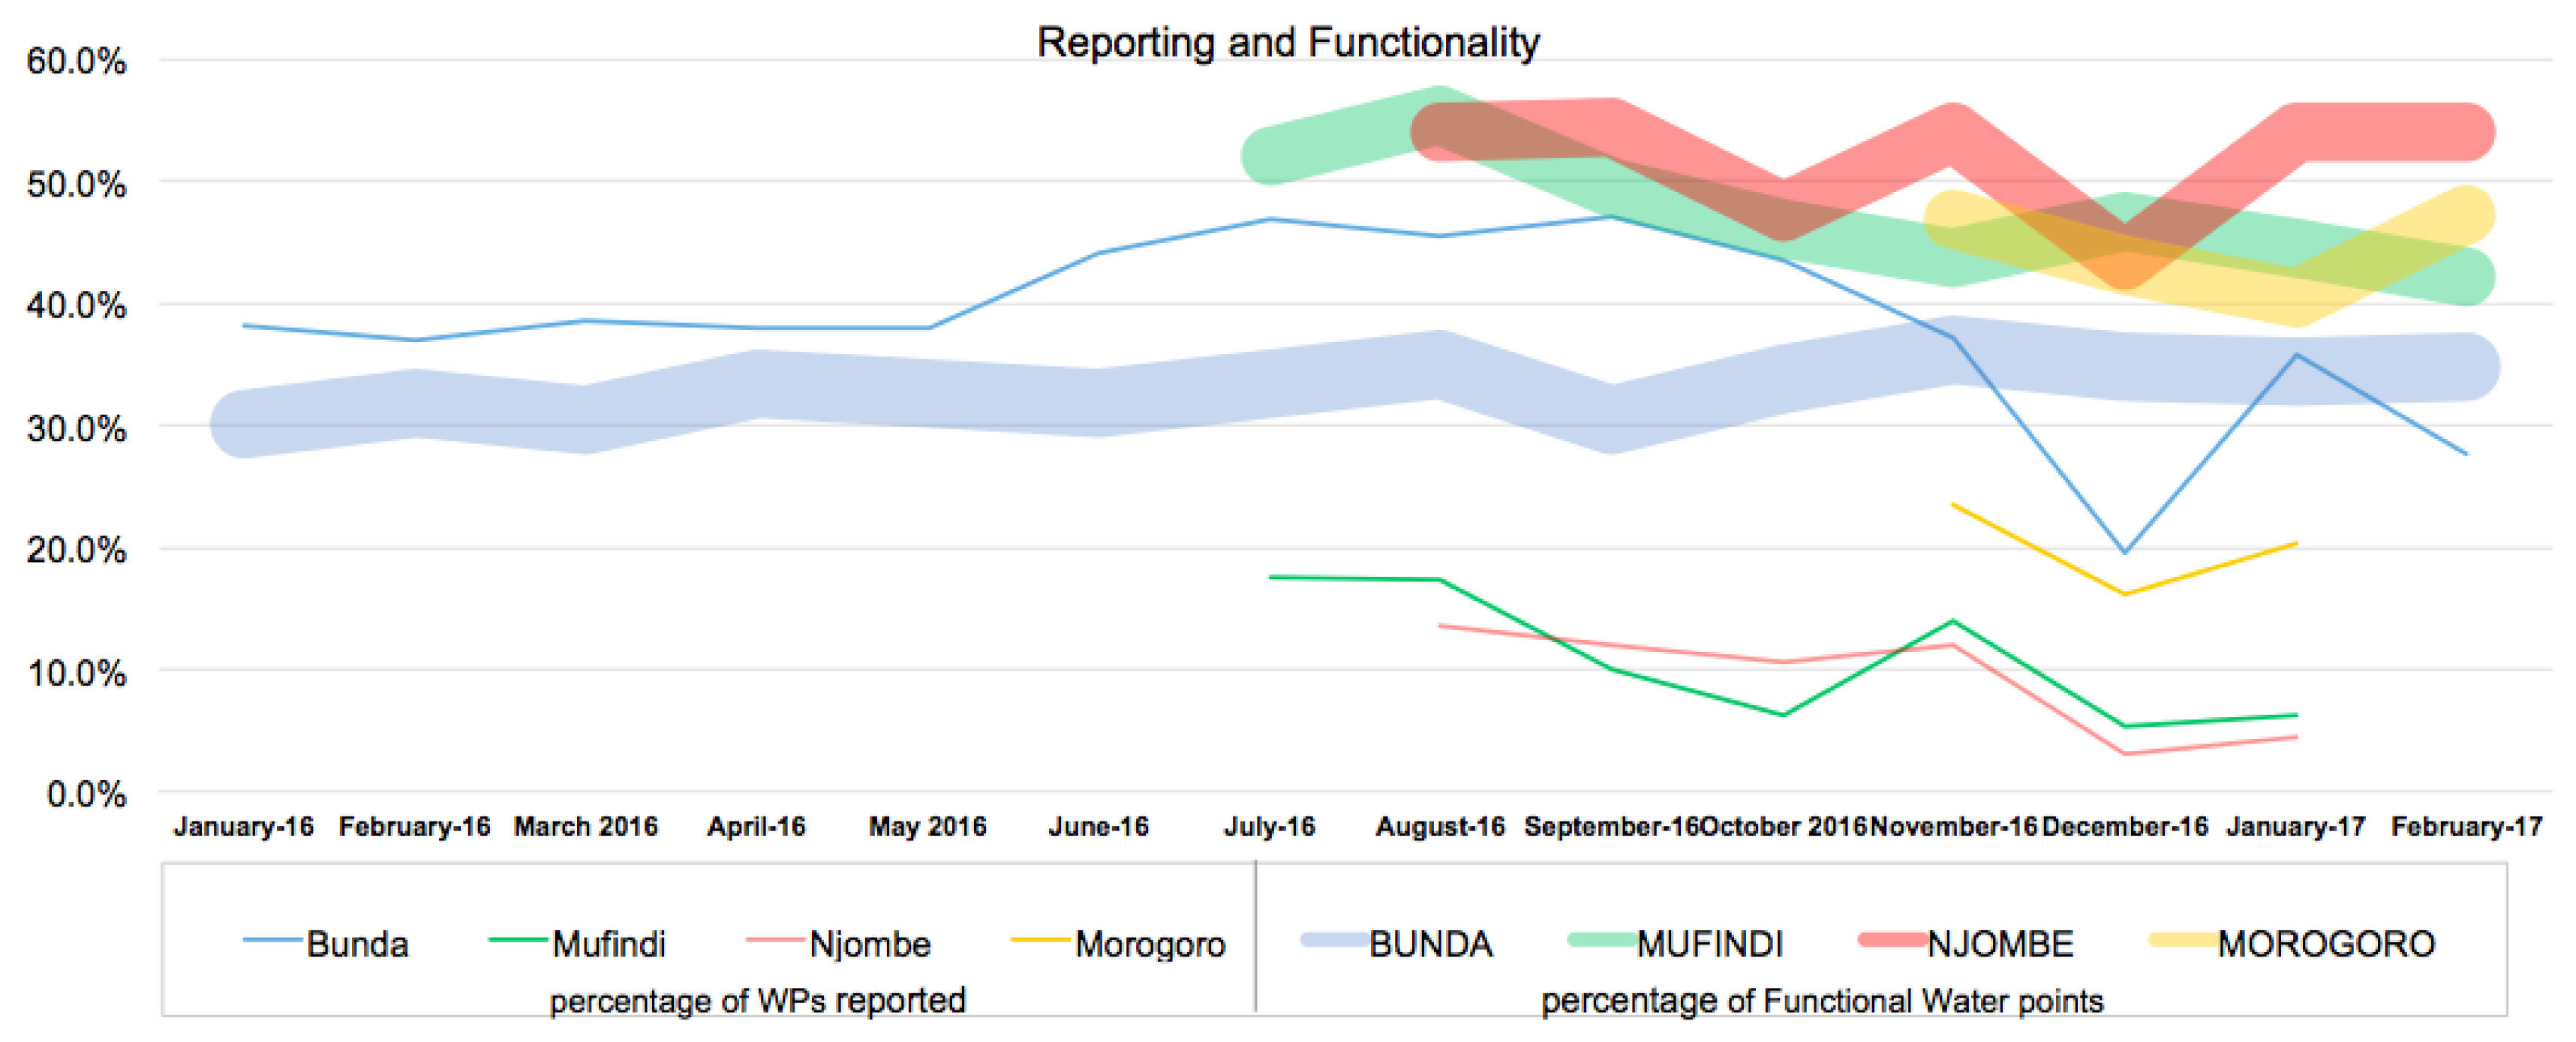
A breakthrough (or obstacle). Sustainable but still need a helpdesk: Figure 11 is a graph showing what happens if the system and back office do not function. Notice the dip in almost all thin lines in December 2016. In December 2016, the contract of the Helpdesk technical staff was ended. Here, there was no technical support available and reporters were not contacted to make their monthly report. However, people continued to report in the absence of the Helpdesk operators whose primary job was to send monthly reminder as well as assisting to remind the short code to dial.
4.4. Cost Estimation
As the result of experiences in the field and having setup the system in practice, we estimate the costs for a working system as in Table 5. In addition to the technical costs, to cater for database system administration and user support, the salary for two helpdesk officers (also known as system administrators) completes the total cost. The current salary rates are $625 per month for a university graduate IT officer. Hence, the total salary costs p.a. is 625 × 2 × 12 = $15,000.
5. Discussion
5.1. Lessons Learned—Observations from the Field
Through the implementation of this project, some valuable take away lessons were noted. Even though the tool can work as expected, many other socio-technical reasons can hamper the reporting behavior of the registered reporters. Some reporters do not own mobile phones, especially female reporters, instead they rely on inserting their SIM cards to others phones and hence the SIM cards are subject to be misplaced frequently. In addition, there were cases of lost SIM Cards due to stolen and broken phones, in which case it takes some time for reporters to restore their mobile numbers and the reporting process gets interrupted. Due to poor network coverage in some villages, reporters needed to travel to reach the network in specific locations. Due to this inconvenience, some reporters end up skipping some reporting periods. As quite some reports were hampered by inconsistent water point names (many relate to the nearest landmark), it is important to involve the reporters in the naming process.
The reporting behavior is very much tied to the fact that a reporter is using the respective water points assigned to them and that they are follow a short training. When a report moves away due to various reasons including marriage, the reporter stops the reporting. Institutionalizing the process and thus guaranteeing continuity needs the involvement of the VEO and/or COWSO leadership and the support by a back-office helpdesk for matters such as re-registration, swapping mobile numbers and reminding the reporters. It was learned further that, developing the back-office system was not a one-off event but evolved as time needs arises. For example, after using the system for sometime, it was requested to add a management report which showed who was reporting for which water point with a respective mobile number. This helped to remind only those who did not report rather than calling for all the reporters.
5.2. SEMA App in a Changed Rural Water Supply Information Infrastructure
Delivery of key services entails taking into consideration the numerous implementation requirements of these services. Generally, each type of service requires a number of tasks to be carried out for the service to be efficiently delivered. These tasks depend on the structure of incentives facing providers and recipients, which in turn depends on five key elements of service delivery: resources, information, decision-making, delivery-mechanisms and accountability (Pritchett and Woolcock 2004). Research shows that these elements involve tasks that can be characterised as in Table 1. They may require either numerous (transaction-intensive) or few (non transaction-intensive) processes. Furthermore, the tasks may be based on routine processes in which the actors do not necessarily require exercising intensive judgment (non-discretionary), while on the other hand actors may be required to exercise a high level of judgment (discretionary) [6,23]. We will now translate these characteristics into our case of monitoring water points (see also Table 6 and compare with Table 1).
We begin with the process of Setting water coverage targets (including water policy), which is a discretionary and non-transaction intensive element of water service provision. Why is it non-transaction intensive? Only a few experts from the respective government agent and Development Partners get together in a closed session and decide what should be the water coverage targets for the next years. Why is it discretionary? These few (smart) people make their decision about water targets based on information that is imperfectly specified and incomplete. They use their judgment and extensive professional and context-specific knowledge, i.e., they use their discretion.
Repairing water taps is a discretionary and transaction-intensive element of water service provision. Why is it discretionary? Expert judgment is required to decide which part is broken, why, where a spare part can be found, how much it costs, how and when to replace it, etc. Why is it transaction-intensive? Thousands of repairmen need to be contacted, mobilized together with resources, and transported to the spot to fix the tap. Repairing water taps is the peskiest element of water service provision.
Procedures and Rules is a non-discretionary and non-transaction intensive element of water service provision. Why is it non-discretionary? No expert judgment is required to follow the already available rules and procedures. Why is it non-transaction intensive? Setting procedures and rules simply entails dictating the one by one procedures of how things should be done, and once they are set and approved, they are simply there to be adhered to.
Monitoring water taps is a non-discretionary and transaction intensive element of water service provision. Why is it non-discretionary? A human observer can normally inspect any of the thousands of water taps and confirm that at the moment of observation it was not functioning. No expert knowledge and difficult judgment is required. Why is t transaction-intensive? Thousands upon thousands of observers are needed to perform this task and to contact dozens of District Water Engineers to inform them about the water tap status. In the context of this project, this “side” of the matrix can easily be “digitized” using an ICT tool, as will be discussed in later sections.
In their literature, Ndaw [24] and Welle [7] presented a number of ICT tools across various countries in the WASH and water sectors, respectively, in which experiences in the use of ICT solutions in the WASH sector are presented. We map the tools (Table 7) onto the elements of key services characterization matrix. Based on this mapping, all tools described in the literature appear to be non-discretionary, while some are transaction-intensive and others are non-transaction intensive.
We observe that there are several tools that provide information directly from village to ministry, while SEMA operates between villagers and district, and as such is going with the grain as meant in [25,16], or, in other words, follows the patterns of local organization.
We conclude that many tools do not seem to have any sort of evolutionary characteristic, with which digital transformation could be achieved. Within the matrix, we also map the initial SEMA App tool (Version 1), in which users had to exercise a lot of discretion in order to report the status of their water points. Gradually, this discretion is removed from the users, leading to subsequent versions of the App (App evolution). Obviously, this is one way to increase the validity and reliability of the data collection. Another way is the involvement of alternative data sources, such as in-situ water sensors, but this is considered to be beyond this project. It should be noted that most of these sensors measure water flow and cannot identify the type of problem in case of malfunctioning water point as is done in our case.
The creation of the SEMA software cannot be seen as just an academic exercise. The SEMA App has been developed in close cooperation with stakeholders, the Ministry of Water being one of the most important one, and following the change of needs over time. In addition, the uptake of the software has been supported by training the intended users.
6. Conclusions and Challenges for the Future
The development of the SEMA App has shed light on socio-technical lessons related to software development, system deployment strategies and organizational change behavior. Software do evolve to address the intended problems and appropriate technology used to develop the software solution matters. In this project, the software technologies adopted to develop the initial solutions of the SEMA App were not appropriate. This calls for a thorough requirements and systems analysis before engaging into the software development process. Specifically, the use of USSD technologies over Android technologies in the rural areas was more appropriate.
The SEMA project has succeeded to reduce the downtime for water point repairs as it facilitated surfacing of the downtime problems per water point in the rural areas. As a result, most of stakeholders were made to understand the magnitude of the problems and hence played their roles and responsibilities accordingly. In this way, the SEMA app amplified the voices of ordinary citizens who wished to hold administrators accountable for the delivery of water services. The application also helped to reduce the bureaucracies involved in data collection and reporting of water services information. In contrast to the approach of using professional surveyors in mapping the water points, this study informs that the baseline list of existing water points in the rural areas can only become be known through involving local communities. In the just four districts involved in this project, the project listed 157 water points, which were not listed in the ministry database.
The study concluded that not all water points were presented to the professional water points mapping team because the local communities were expecting to get new projects. Furthermore, local beliefs that show strangers their water points would make the water point non-functional and some believed the surveyor were of very high class to be shown aging and poor hygienic water points.
On the question whether rural communities would volunteer to report, this study concludes positive results when engaged to address social problems in their communities. In this project, 1899 reporters were engaged. It is in this process where reporters helped to identify more water points. This helped the District Water Engineers (DWEs) to update and complete their monthly reports as required by the Ministry of Water. The mobile reporting system has reduced the bureaucratic process of reporting functionality status. As previously, they used to write letters to inform the functionality status and allow traceable follow-ups on actions done on the reported WPs in the four districts.
Based on the study results and lessons learned, it is hereby recommended that, when implementing similar project, the project team should take initiatives to ensure that the district technicians are impacted with the essential technical skills by facilitating coaching and mentoring sessions by linking them with experienced technicians. The DWEs were also advised to facilitate the field learning sessions to enable them acquiring the new skills. Further recommendations are that verification of water point reporters confirm their willingness, capability and commitment to reporting water point functionality status should be done together with the project team and DWE team. The coaching and training session to the confirmed reporters on mobile reporting application system should be conducted as one of the project implementation activities. Any missing WPs were identified and added to the project baseline data, and they were also presented to the MoW for them to revise their data.
Acknowledgments
The main research for this paper was done under the NWO-WOTRO funded integrated research project: Sensors, Empowerment and Accountability in Tanzania (SEMA).
Author Contributions
Rob Lemmens, Juma Lungo, Yola Georgiadou and Jeroen Verplanke conducted desk research, fieldwork (including testing the SEMA App) and wrote the paper. Juma Lungo implemented the SEMA App.
Conflicts of Interest
The authors declare no conflict of interest.
References
- Giné, R.; Pérez-Foguet, A. Sustainability assessment of national rural water supply program in Tanzania. Natl. Resour. Forum 2008, 32, 327–342. [Google Scholar] [CrossRef] [Green Version]
- United Republic of Tanzania. The Water Sector Status Report 2013; Ministry of Water: Dar es Salaam, Tanzania, 2013.
- UNICEF/WHO. Progress on Sanitation and Drinking Water: 2015 Update and MDG Assessment; UNICEF and The World Health Organization: New York, NY, USA, 2015. [Google Scholar]
- United Republic of Tanzania. Water Sector Development Programme (2005–2025); Consolidated Report; Ministry of Water: Dar es Salaam, Tanzania, 2006.
- MoWI. Updating Manual for CDMT. 2015. Available online: http://www.maji.go.tz/sites/default/files/New_UPDATING%20MANUAL%20CDMT%20SEPTEMBER%202015.pdf (accessed on 18 October 2017).
- WaterAid. The Water Point Mapping Updating Methodology. 2010. Available online: http://www.wateraid.org/~/media/Publications/The-water-Point-mapping-updating-methodology.pdf (accessed on 18 October 2017).
- Welle, K.; Williams, J.; Pearce, J. ICTs Help Citizens Voice Concerns over Water—Or Do They? IDS Bull. 2016, 47, 41–51. [Google Scholar] [CrossRef]
- Pritchett, L.; Woolcock, M. Solutions When the Solution is the Problem: Arraying the Disarray in Development. World Dev. 2004, 32, 191–212. [Google Scholar] [CrossRef]
- United Republic of Tanzania. National Water Policy 2002; Ministry of Water: Dar es Salaam, Tanzania, 2002.
- Tilley, H. Unblocking Results: Rural Water in Tanzania; Overseas Development Institute: London, UK, 2013. [Google Scholar]
- Cleaver, F.; Toner, A. The evolution of community water governance in Uchira, Tanzania: The implications for equality of access, sustainability and effectiveness. Natl. Resour. Forum 2006, 30, 207–218. [Google Scholar] [CrossRef]
- Braathen, E.; Chaligha, A.; Odd-Helge, F. Local Governance, Finances and Service Delivery in Tanzania: A Summary of Findings from Six Councils; Norwegian Institute for Urban and Regional Research (NIBR): Oslo, Norway, 2005. [Google Scholar]
- United Republic of Tanzania. Tanzania Water Supply and Sanitation Act (2009); United Republic of Tanzania: Dar es Salaam, Tanzania, 2009.
- World Bank. World Development Report 2016: Digital Dividends; The World Bank: New York, NY, USA, 2016. [Google Scholar]
- Wacquant, L. Habitus. In International Encyclopedia of Economic Sociology; Becket, J., Milan, Z., Eds.; Routledge: London, UK, 2005. [Google Scholar]
- Nganyanyuka, K.; Martinez, J.; Lungo, J.H.; Verplanke, J.; Georgiadou, Y. Working with the grain: How amenable to digital transformation is the monitoring and repair of rural water points in Tanzania. Inf. Technol. Int. Dev. 2017, 13, 103–121. [Google Scholar]
- Wikipedia. SMS. 2017. Available online: https://en.wikipedia.org/wiki/SMS (accessed on 18 October 2017).
- Wikipedia. Unstructured Supplementary Service Data. 2017. Available online: https://en.wikipedia.org/wiki/Unstructured_Supplementary_Service_Data (accessed on 18 October 2017).
- Wikipedia. GSM. 2017. Available online: https://en.wikipedia.org/wiki/GSM (accessed on 18 October 2017).
- Tsega, H.; Lemmens, R.; Lungo, J.; Kraak, M.J. Towards a Smarter System for Human Sensor Web. In Proceedings of the IEEE International Conference on Pervasive Computing and Communications, PerCom’15, St. Louis, MO, USA, 23–27 March 2015; pp. 14–19. [Google Scholar]
- Tsega, H.; Lemmens, R.; Lungo, J.; Kraak, M.J. Urban Context Modelling for Human Sensor Web. In Proceedings of the N-AERUS XIV workshop, Enschede, The Netherlands, 12–14 September 2013. [Google Scholar]
- Wesselink, A.; Hoppe, R.; Lemmens, R. Not just a tool. Using context in the development of a mobile App for rural water supply in Tanzania. Water Altern. J. 2015, 8, 57–76. [Google Scholar]
- Pritchett, L. The World Bank and public-sector management: What next? Int. Rev. Adm. Sci. 2013, 79, 413–419. [Google Scholar] [CrossRef]
- Ndaw, M.F. Unlocking the Potential of Information Communications Technology to Improve Water and Sanitation Services; WSP Report on Water & Sanitation Program; The World Bank: Washington, DC, USA, 2015. [Google Scholar]
- Kelsall, T. Going with the Grain in African Development? Dev. Policy Rev. 2008, 26, 627–655. [Google Scholar] [CrossRef]
Figure 1.
SEMA App version 3.
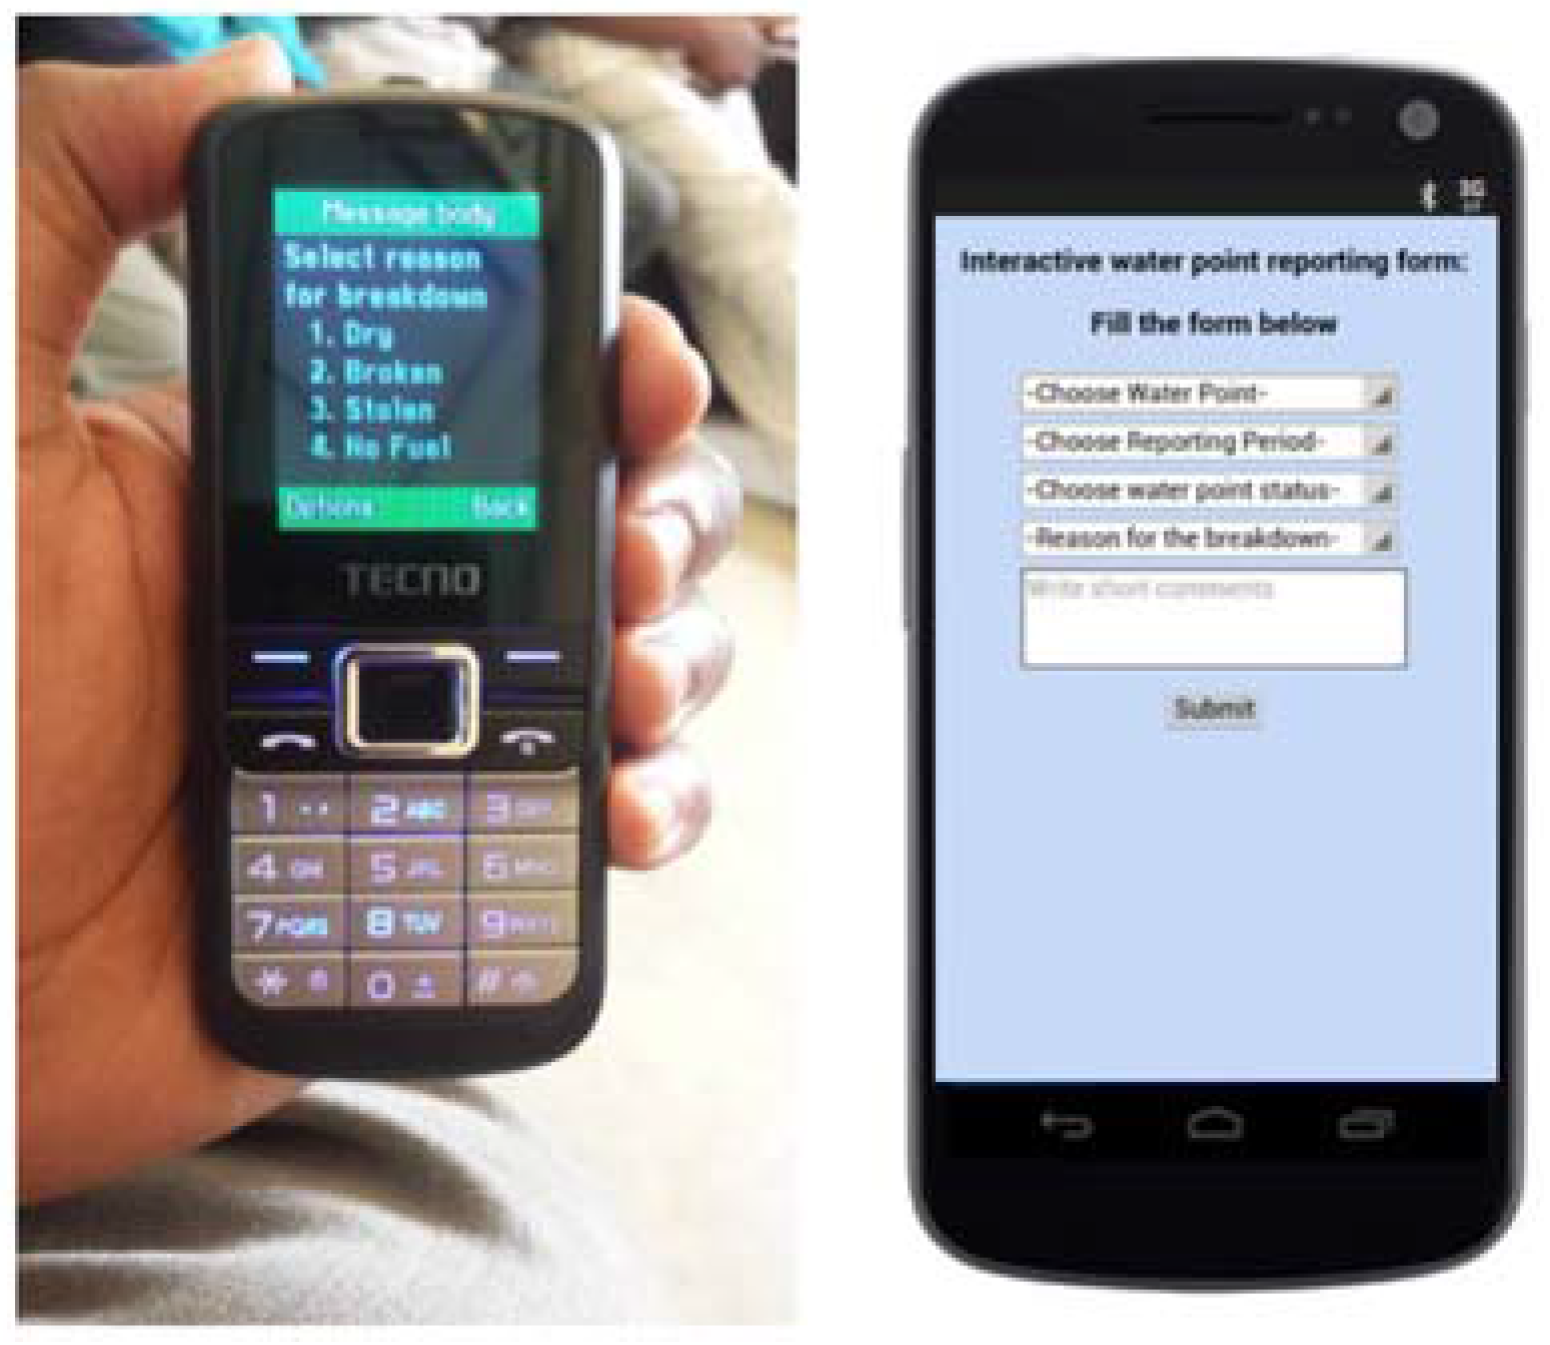
Figure 2.
Architecture of the SEMA Water Services Information Infrastructure.

Figure 3.
DWE dashboard that make use of the SEMA infrastructure to present data dynamically.

Figure 4.
DWE responsive dashboard for Smartphones and Desktops.

Figure 5.
SEMA standard report.

Figure 6.
The Mobile reporting system showing the flow of information.
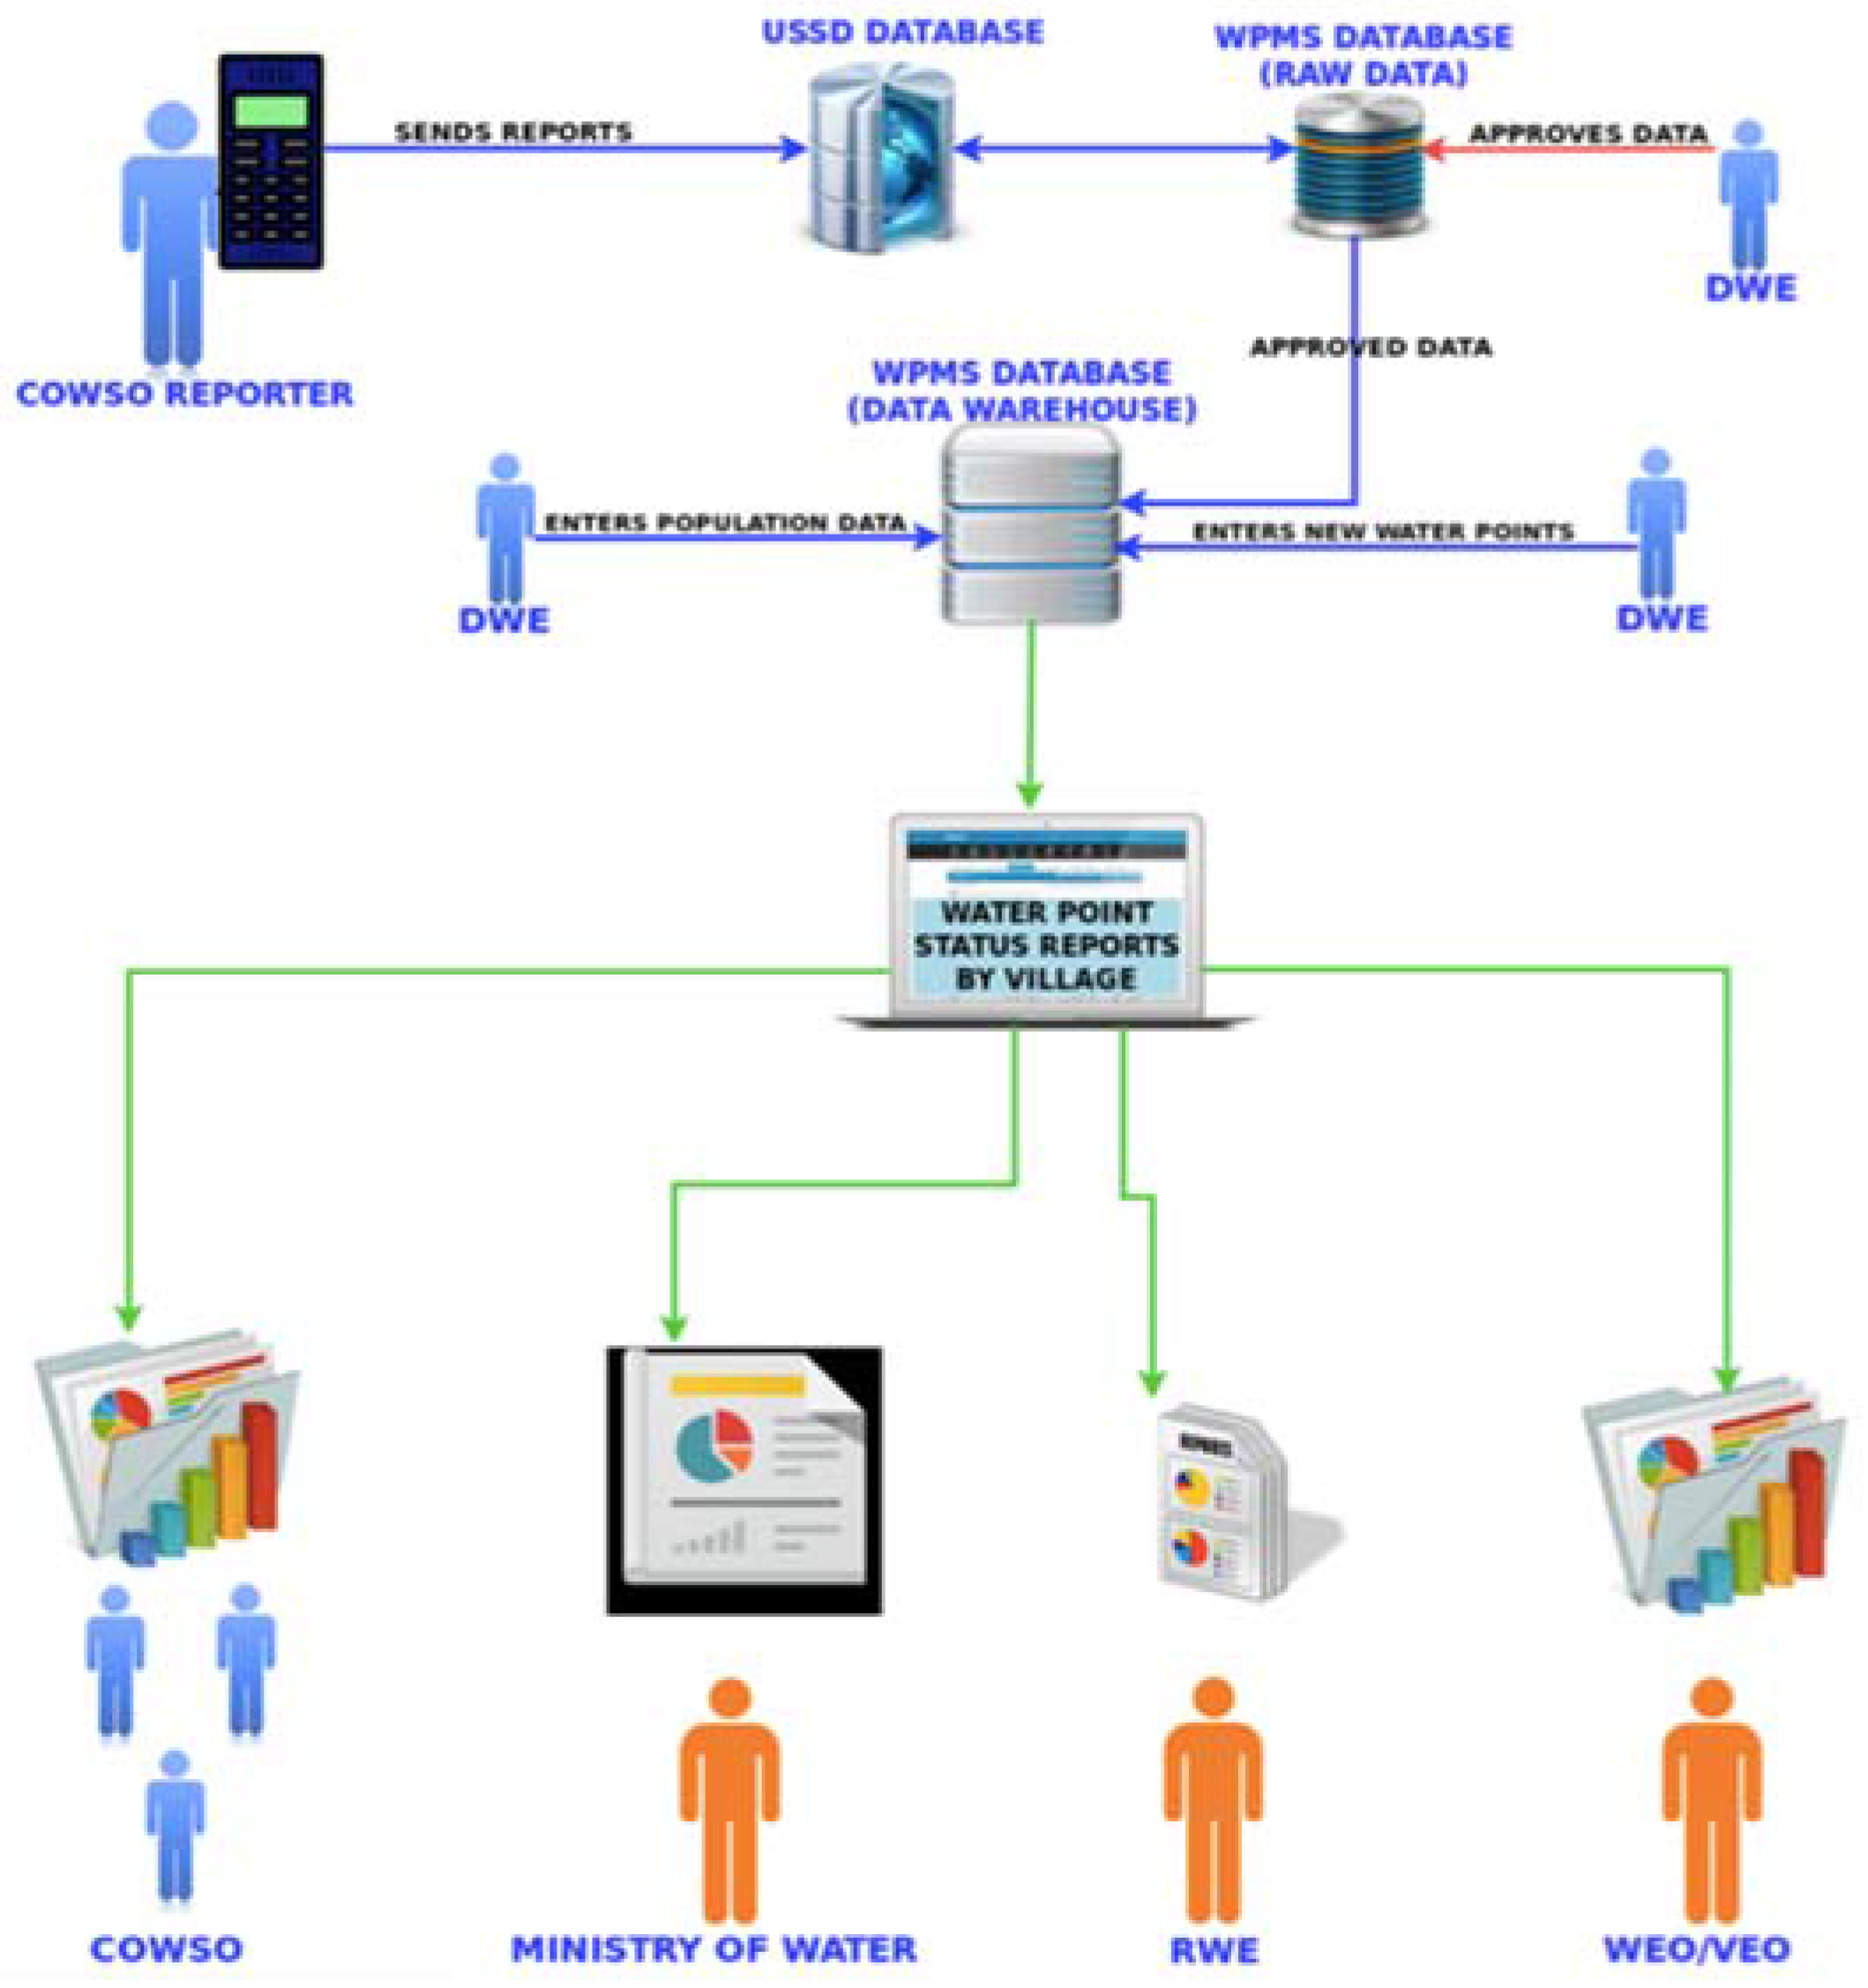
Figure 7.
An example of Cross-sectional concepts for SEMA’s Water Source Reports.

Figure 8.
An example of administrative concepts for SEMA’s Water Source Reports.

Figure 9.
(Left) Trainers’ workshop in Bunda in December 2015; and (Right) Training of Reporters in Kolero village in Morogoro.
Figure 9.
(Left) Trainers’ workshop in Bunda in December 2015; and (Right) Training of Reporters in Kolero village in Morogoro.
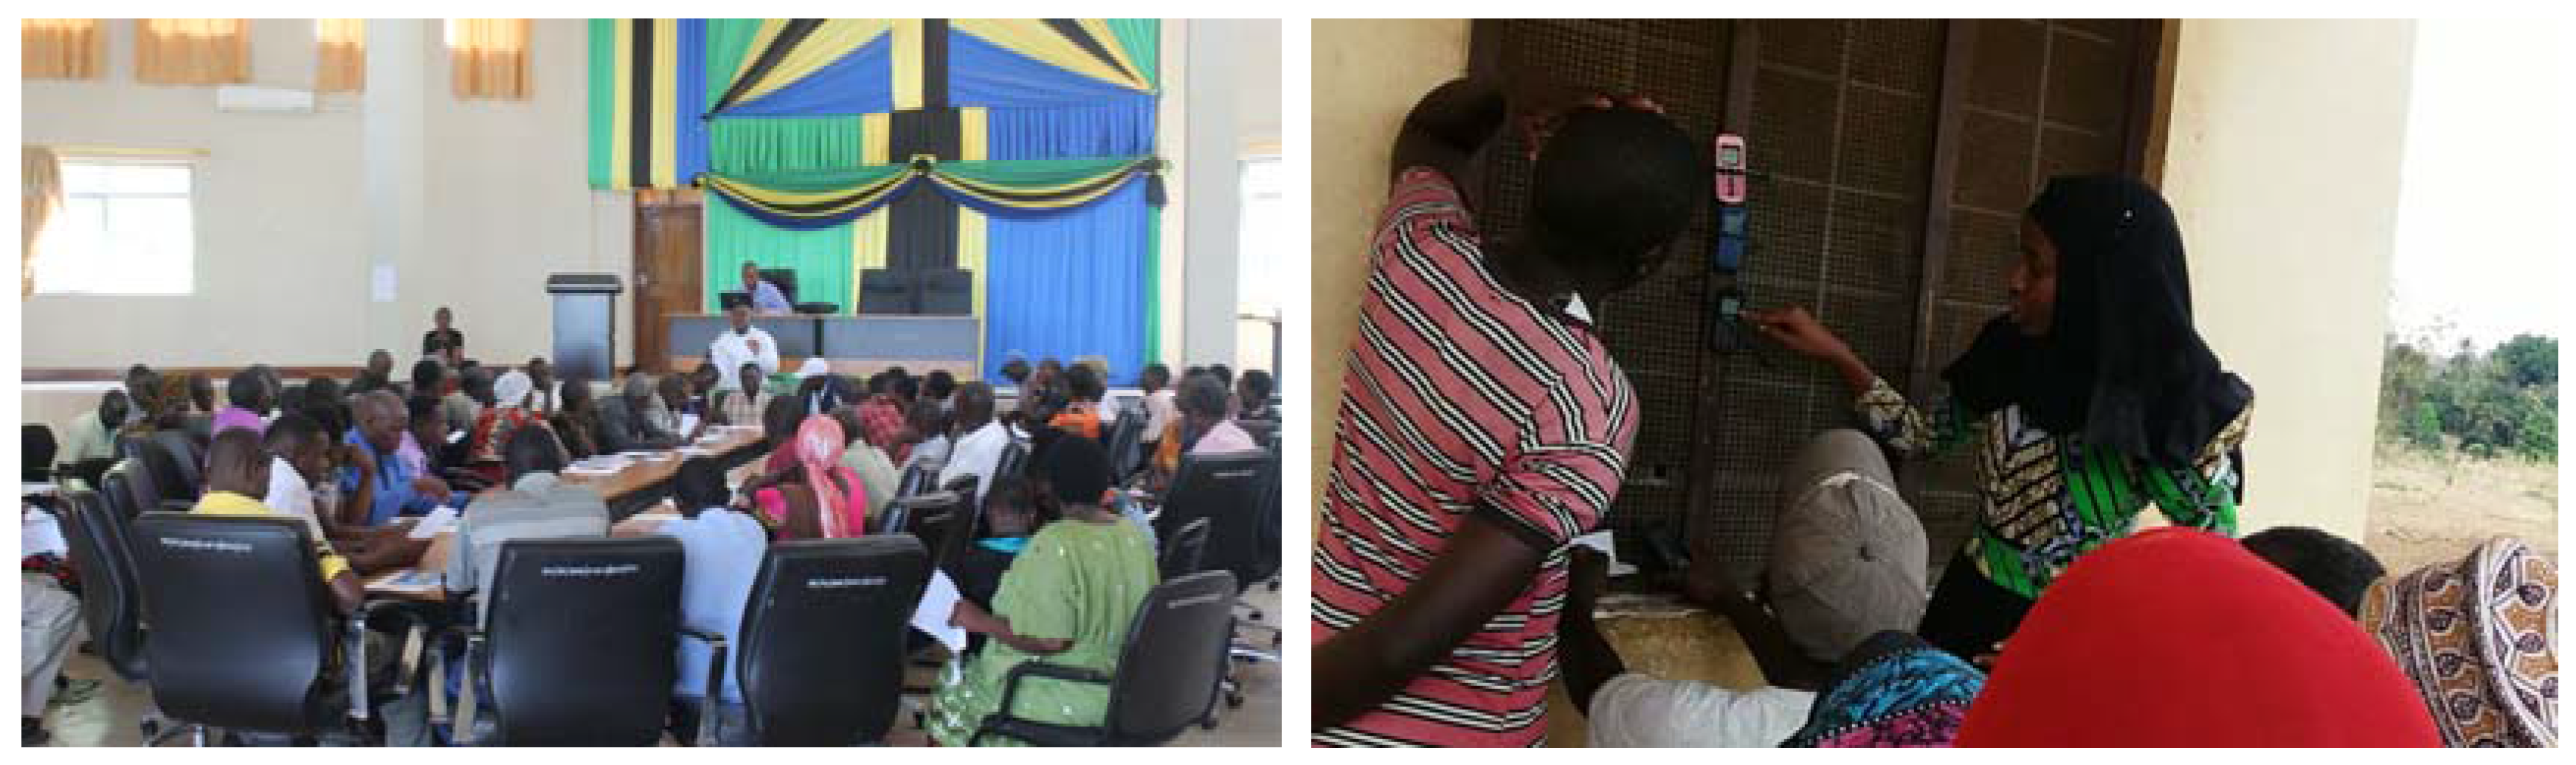
Figure 10.
Functionality of water points in Bunda, showing a steady increase over the year 2016.

Figure 11.
Water Point (WP) Reporting status in the districts.


Table 1.
Tasks and their amenability to improvement through digitization.
| Transaction-Intensive | Non Transaction-Intensive | |
|---|---|---|
| Discretionary | Less amenable to improvement through digitization | Not amenable to improvement through digitization |
| Non-discretionary | Highly amenable to improvement through digitization | Lasting dispositions |
Table 2.
SEMA Mobile App versions and characteristics.
| SEMA App Version | Release Date | Technology | Platforms | Performance | Costs | Usability |
|---|---|---|---|---|---|---|
| 1 | January 2014 | Android | Smart phone with Android OS | Internet requirement | Internet connection costs for reporter | Text menu-driven |
| 2 | August 2014 | USSD simulation by SMS | All types of mobile phones | One-way and slow communication | SMS costs for reporter | Free-text based |
| 3 | February 2015 | USSD | All types of mobile phones | Fast real-time session based communications | No cost for reporter | Coded menu-driven |
Table 3.
Registered WP in each district.
| Bunda | Mufindi | Njombe | Morogoro | |
|---|---|---|---|---|
| #WP (SEMA) (March 2017) | 808 | 840 | 748 | 681 |
| #WPs MoW (July 2015) | 648 | 720 | 712 | 701 |
| #Villages | 103 | 121 | 46 | 150 |
| #Registered reporters | 315 | 506 | 542 | 536 |
| Start date of reporting | January 2016 | July 2016 | August 2016 | November 2016 |
| #Months of reporting | 13 | 6 | 5 | 3 |
Table 4.
Percentage of consistency of reporters per district.
| District | #Reporters | Consistency of Reports | % Airtel Users | #Reports | #Reports per Reporter | #Reports per Month | Consistency of Reports per Month per WP |
|---|---|---|---|---|---|---|---|
| Bunda | 316 | 54% | 66% | 4364 | 25 | 312 | 39% |
| Mufindi | 506 | 19% | 5% | 771 | 8 | 96 | 13% |
| Njombe | 535 | 12% | 97% | 461 | 7 | 66 | 9% |
| Morogoro | 405 | 31% | 6% | 512 | 4 | 128 | 19% |
Table 5.
Annual cost of SEMA in four districts. The total cost per water point per year is US$9.95 (at the time of writing 22,049 Tanzanian Shilling).
Table 5.
Annual cost of SEMA in four districts. The total cost per water point per year is US$9.95 (at the time of writing 22,049 Tanzanian Shilling).
| Item | Cost in $ per Year for 2400 Water Points |
|---|---|
| System hosting (SEMA database system) | 2640 |
| Mobile application hosting (USSD App) | 1800 |
| USSD short-code | 2000 |
| Bulk SMS dissemination | 650 |
| Website hosting | 1800 |
| Helpdesk of 2 staff | 15,000 |
| Total | 23,890 |
Table 6.
Tasks and their amenability to improvement through digitization (SEMA case).
| Transaction-Intensive | Non Transaction-Intensive | |
|---|---|---|
| Discretionary | Repairing water taps | Setting water coverage targets |
| Non-discretionary | Monitoring water taps | Procedures and Rules |
Table 7.
Conceptualization of SEMA App versions.
| Unconstrained Crowdsourcing | Medium-Constrained Crowdsourcing | Highly-Constrained Crowdsourcing | (Future) Institutionalized “Crowdsourcing” at MoW | |
|---|---|---|---|---|
| Lots of discretion granted to reporters | SEMA V_1.0 -User reports with password at every login instance. -User reports on whether WP is F, NF, NR. -Additional text description. -Choice EN/SWA. | |||
| Medium discretion granted to reporters | SEMA V_2.0 -User reports with password at first login instance. -User reports whether WP is F, NF, NR. -Only SWA. | |||
| Low discretion granted to reporters | Human Sensor Web Zanzibar -Anybody can report. -Report on: Yes or No water. -Additional text description. -Only EN. | SEMA V_3.0 -Only users registered by SEMA administrator can trigger reporting. -User reports on elemental attributes of WP (water flow, water quality, etc.). -APP calculates F, NF, NR. -Only SWA. -Commercial gateway. | ||
| (Future) Zero discretion granted to reporters | SEMA V_4.0 -Only users registered by MoW can trigger reporting. -User reports on elemental attributes of WP (water flow, water quality, finances, etc.). -APP calculates F, NF, NR? -Only SWA. -MOW verifies the validity of reports. -Government (TCRA) gateway. |
© 2017 by the authors. Licensee MDPI, Basel, Switzerland. This article is an open access article distributed under the terms and conditions of the Creative Commons Attribution (CC BY) license (http://creativecommons.org/licenses/by/4.0/).
Share and Cite
MDPI and ACS Style
Lemmens, R.; Lungo, J.; Georgiadou, Y.; Verplanke, J. Monitoring Rural Water Points in Tanzania with Mobile Phones: The Evolution of the SEMA App. ISPRS Int. J. Geo-Inf. 2017, 6, 316. https://doi.org/10.3390/ijgi6100316
AMA Style
Lemmens R, Lungo J, Georgiadou Y, Verplanke J. Monitoring Rural Water Points in Tanzania with Mobile Phones: The Evolution of the SEMA App. ISPRS International Journal of Geo-Information. 2017; 6(10):316. https://doi.org/10.3390/ijgi6100316
Chicago/Turabian StyleLemmens, Rob, Juma Lungo, Yola Georgiadou, and Jeroen Verplanke. 2017. "Monitoring Rural Water Points in Tanzania with Mobile Phones: The Evolution of the SEMA App" ISPRS International Journal of Geo-Information 6, no. 10: 316. https://doi.org/10.3390/ijgi6100316
Note that from the first issue of 2016, this journal uses article numbers instead of page numbers. See further details here.