Next Issue
Volume 6, December
Previous Issue
Volume 6, October


ISPRS Int. J. Geo-Inf., Volume 6, Issue 11 (November 2017) – 59 articles

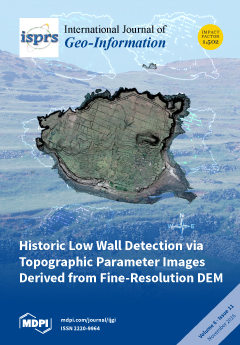
Cover Story (view full-size image): We apply rapid landscape line detection to extract historic vegetable garden walls based on topographic information from a LiDAR-derived high-resolution digital elevation model (DEM). The spatial information on slope, curvature, and openness enables the identification of the location of anthropogenic landscape features. Three rapid processes used in this study include the derivation of topographic parameters, line extraction and aggregation. Results show that wall line detection with multiple topographic parameter images is a simple means of obtaining essential historic wall feature information. The aggregation of three individual detection results from slope, curvature, and openness increases the accuracy of identification of historic anthropogenic features. Further research will consider the unmanned aerial vehicle for collecting point clouds and spectral information of image photos. View the paper
  • Issues are regarded as officially published after their release is announced to the table of contents alert mailing list.
  • You may sign up for e-mail alerts to receive table of contents of newly released issues.
  • PDF is the official format for papers published in both, html and pdf forms. To view the papers in pdf format, click on the "PDF Full-text" link, and use the free Adobe Reader to open them.
Order results
Result details
Select all
Export citation of selected articles as:
23990 KiB  
Article
Geo-Environmental Estimation of Land Use Changes and Its Effects on Egyptian Temples at Luxor City
by Abdelaziz Elfadaly, Osama Wafa, Mohamed A. R. Abouarab, Antonella Guida, Pier Giorgio Spanu and Rosa Lasaponara
ISPRS Int. J. Geo-Inf. 2017, 6(11), 378; https://doi.org/10.3390/ijgi6110378 - 22 Nov 2017
Cited by 25 | Viewed by 7004
Abstract
Over the years, the Egyptian temples at Luxor city have been intensely investigated, but most of these studies just focused on the classical sides of the archaeological and historical descriptions. Many of the environmental problems are the inevitable results of the unplanned urban [...] Read more.
Over the years, the Egyptian temples at Luxor city have been intensely investigated, but most of these studies just focused on the classical sides of the archaeological and historical descriptions. Many of the environmental problems are the inevitable results of the unplanned urban crawling around the monuments temples. This paper aims at assessing the environmental changes around some temples of Luxor City using remote sensing and GIS techniques. In particular, a historical database made up of Corona and Landsat TM data have been investigated along with the new acquisitions of Quickbird 2 and Sentinel 2. Results from our investigation highlighted rapid changes in urban and agricultural areas, which adversely affected the Egyptian monumental temples causing serious degradation phenomena. Using the information obtained from our RS&GIS based analysis, mitigation strategies have been also identified for supporting the preservation of the archaeological area. Full article
Show Figures

Figure 1

4763 KiB  
Article
A Virtual Geographic Environment for Debris Flow Risk Analysis in Residential Areas
by Lingzhi Yin, Jun Zhu, Yi Li, Chao Zeng, Qing Zhu, Hua Qi, Mingwei Liu, Weilian Li, Zhenyu Cao, Weijun Yang and Pengcheng Zhang
ISPRS Int. J. Geo-Inf. 2017, 6(11), 377; https://doi.org/10.3390/ijgi6110377 - 22 Nov 2017
Cited by 26 | Viewed by 4766
Abstract
Emergency risk assessment of debris flows in residential areas is of great significance for disaster prevention and reduction, but the assessment has disadvantages, such as a low numerical simulation efficiency and poor capabilities of risk assessment and geographic knowledge sharing. Thus, this paper [...] Read more.
Emergency risk assessment of debris flows in residential areas is of great significance for disaster prevention and reduction, but the assessment has disadvantages, such as a low numerical simulation efficiency and poor capabilities of risk assessment and geographic knowledge sharing. Thus, this paper focuses on the construction of a VGE (virtual geographic environment) system that provides an efficient tool to support the rapid risk analysis of debris flow disasters. The numerical simulation, risk analysis, and 3D (three-dimensional) dynamic visualization of debris flow disasters were tightly integrated into the VGE system. Key technologies, including quantitative risk assessment, multiscale parallel optimization, and visual representation of disaster information, were discussed in detail. The Qipan gully in Wenchuan County, Sichuan Province, China, was selected as the case area, and a prototype system was developed. According to the multiscale parallel optimization experiments, a suitable scale was chosen for the numerical simulation of debris flow disasters. The computational efficiency of one simulation step was 5 ms (milliseconds), and the rendering efficiency was approximately 40 fps (frames per second). Information about the risk area, risk population, and risk roads under different conditions can be quickly obtained. The experimental results show that our approach can support real-time interactive analyses and can be used to share and publish geographic knowledge. Full article
Show Figures

Figure 1

6232 KiB  
Article
An Automated Processing Algorithm for Flat Areas Resulting from DEM Filling and Interpolation
by Xingwei Liu, Ning Wang, Jingli Shao and Xuefeng Chu
ISPRS Int. J. Geo-Inf. 2017, 6(11), 376; https://doi.org/10.3390/ijgi6110376 - 21 Nov 2017
Cited by 17 | Viewed by 4444
Abstract
Correction of digital elevation models (DEMs) for flat areas is a critical process for hydrological analyses and modeling, such as the determination of flow directions and accumulations, and the delineation of drainage networks and sub-basins. In this study, a new algorithm is proposed [...] Read more.
Correction of digital elevation models (DEMs) for flat areas is a critical process for hydrological analyses and modeling, such as the determination of flow directions and accumulations, and the delineation of drainage networks and sub-basins. In this study, a new algorithm is proposed for flat correction/removal. It uses the puddle delineation (PD) program to identify depressions (including their centers and overflow/spilling thresholds), compute topographic characteristics, and further fill the depressions. Three different levels of elevation increments are used for flat correction. The first and second level of increments create flows toward the thresholds and centers of the filled depressions or flats, while the third level of small random increments is introduced to cope with multiple threshold conditions. A set of artificial surfaces and two real-world landscapes were selected to test the new algorithm. The results showed that the proposed method was not limited by the shapes, the number of thresholds, and the surrounding topographic conditions of flat areas. Compared with the traditional methods, the new algorithm simplified the flat correction procedure and reduced the final elevation increments by 5.71–33.33%. This can be used to effectively remove/correct topographic flats and create flat-free DEMs. Full article
(This article belongs to the Special Issue Leading Progress in Digital Terrain Analysis and Modeling)
Show Figures

Figure 1

4284 KiB  
Article
A 3D Digital Cadastre for New Zealand and the International Opportunity
by Trent Gulliver, Anselm Haanen and Mark Goodin
ISPRS Int. J. Geo-Inf. 2017, 6(11), 375; https://doi.org/10.3390/ijgi6110375 - 21 Nov 2017
Cited by 15 | Viewed by 6711
Abstract
New Zealand has a legal 3D cadastre, and has done since the inception of its cadastral survey and tenure systems around 150 years ago. However, the digital representation of the cadastre is 2D with 3D situations handled via static plan, section and elevation [...] Read more.
New Zealand has a legal 3D cadastre, and has done since the inception of its cadastral survey and tenure systems around 150 years ago. However, the digital representation of the cadastre is 2D with 3D situations handled via static plan, section and elevation images and supporting textual information. Work is currently underway to develop a 3D digital cadastre that will enable the 3D spatial extents of property rights, restrictions and responsibilities to be captured, validated, lodged, integrated with existing data, visualised, and made available for use in other systems. This article presents the approach that is being promoted by regulators of New Zealand’s cadastral survey system in discussions with suppliers of land administration systems. Previous research concluded that the most appropriate way for New Zealand to develop a 3D digital cadastre is to build upon its existing system. The 2D digital cadastre would continue to be the default layer with 3D situations incorporated as and where necessary. To enable this requires a new approach to handling parcels defined in 3D. The representation of a 3D parcel as a spatial object is being proposed to allow parcels limited in height to be integrated into the digital cadastre and subsequently maintained. While the authors discuss how New Zealand’s digital cadastre may be transitioned to 3D, it is suggested that the generic nature of spatial objects could be applied to other jurisdictions. For this reason, the international appeal of the approach is considered as other jurisdictions and providers of software applications may benefit from New Zealand’s efforts. Full article
(This article belongs to the Special Issue Research and Development Progress in 3D Cadastral Systems)
Show Figures

Figure 1

23175 KiB  
Article
Spatio-Temporal Series Remote Sensing Image Prediction Based on Multi-Dictionary Bayesian Fusion
by Chu He, Zhi Zhang, Dehui Xiong, Juan Du and Mingsheng Liao
ISPRS Int. J. Geo-Inf. 2017, 6(11), 374; https://doi.org/10.3390/ijgi6110374 - 21 Nov 2017
Cited by 11 | Viewed by 4030
Abstract
Contradictions in spatial resolution and temporal coverage emerge from earth observation remote sensing images due to limitations in technology and cost. Therefore, how to combine remote sensing images with low spatial yet high temporal resolution as well as those with high spatial yet [...] Read more.
Contradictions in spatial resolution and temporal coverage emerge from earth observation remote sensing images due to limitations in technology and cost. Therefore, how to combine remote sensing images with low spatial yet high temporal resolution as well as those with high spatial yet low temporal resolution to construct images with both high spatial resolution and high temporal coverage has become an important problem called spatio-temporal fusion problem in both research and practice. A Multi-Dictionary Bayesian Spatio-Temporal Reflectance Fusion Model (MDBFM) has been proposed in this paper. First, multiple dictionaries from regions of different classes are trained. Second, a Bayesian framework is constructed to solve the dictionary selection problem. A pixel-dictionary likehood function and a dictionary-dictionary prior function are constructed under the Bayesian framework. Third, remote sensing images before and after the middle moment are combined to predict images at the middle moment. Diverse shapes and textures information is learned from different landscapes in multi-dictionary learning to help dictionaries capture the distinctions between regions. The Bayesian framework makes full use of the priori information while the input image is classified. The experiments with one simulated dataset and two satellite datasets validate that the MDBFM is highly effective in both subjective and objective evaluation indexes. The results of MDBFM show more precise details and have a higher similarity with real images when dealing with both type changes and phenology changes. Full article
Show Figures

Figure 1

7864 KiB  
Article
Optimizing Cruising Routes for Taxi Drivers Using a Spatio-Temporal Trajectory Model
by Liang Wu, Sheng Hu, Li Yin, Yazhou Wang, Zhanlong Chen, Mingqiang Guo, Hao Chen and Zhong Xie
ISPRS Int. J. Geo-Inf. 2017, 6(11), 373; https://doi.org/10.3390/ijgi6110373 - 19 Nov 2017
Cited by 24 | Viewed by 6946
Abstract
Much of the taxi route-planning literature has focused on driver strategies for finding passengers and determining the hot spot pick-up locations using historical global positioning system (GPS) trajectories of taxis based on driver experience, distance from the passenger drop-off location to the next [...] Read more.
Much of the taxi route-planning literature has focused on driver strategies for finding passengers and determining the hot spot pick-up locations using historical global positioning system (GPS) trajectories of taxis based on driver experience, distance from the passenger drop-off location to the next passenger pick-up location and the waiting times at recommended locations for the next passenger. The present work, however, considers the average taxi travel speed mined from historical taxi GPS trajectory data and the allocation of cruising routes to more than one taxi driver in a small-scale region to neighboring pick-up locations. A spatio-temporal trajectory model with load balancing allocations is presented to not only explore pick-up/drop-off information but also provide taxi drivers with cruising routes to the recommended pick-up locations. In simulation experiments, our study shows that taxi drivers using cruising routes recommended by our spatio-temporal trajectory model can significantly reduce the average waiting time and travel less distance to quickly find their next passengers, and the load balancing strategy significantly alleviates road loads. These objective measures can help us better understand spatio-temporal traffic patterns and guide taxi navigation. Full article
(This article belongs to the Special Issue Geospatial Big Data and Urban Studies)
Show Figures

Figure 1

14366 KiB  
Article
A Representation Method for Complex Road Networks in Virtual Geographic Environments
by Peibei Zheng, Hong Tao, Songshan Yue, Mingguang Wu, Guonian Lv and Chuanlong Zhou
ISPRS Int. J. Geo-Inf. 2017, 6(11), 372; https://doi.org/10.3390/ijgi6110372 - 18 Nov 2017
Cited by 1 | Viewed by 4314
Abstract
Road networks are important for modelling the urban geographic environment. It is necessary to determine the spatial relationships of road intersections when using maps to help researchers conduct virtual urban geographic experiments (because a road intersection might occur as a connected cross or [...] Read more.
Road networks are important for modelling the urban geographic environment. It is necessary to determine the spatial relationships of road intersections when using maps to help researchers conduct virtual urban geographic experiments (because a road intersection might occur as a connected cross or as an unconnected bridge overpass). Based on the concept of using different map layers to organize the render order of each road segment, three methods (manual, semi-automatic and mask-based automatic) are available to help map designers arrange the rendering order. However, significant efforts are still needed, and rendering efficiency remains problematic with these methods. This paper considers the Discrete, Crossing, Overpass, Underpass, Conjunction, Up-overlap and Down-overlap spatial relationships of road intersections. An automatic method is proposed to represent these spatial relationships when drawing road networks on a map. The data-layer organization method (reflecting road grade and elevation-level information) and the symbol-layer decomposition method (reflecting road covering order in the vertical direction) are designed to determine the rendering order of each road element when rendering a map. In addition, an “auxiliary-drawing-action” (for drawing road segments belonging to different grades and elevations) is proposed to adjust the rendering sequences automatically. Two experiments are conducted to demonstrate the feasibility and efficiency of the method, and the results demonstrate that it can effectively handle spatial relationships of road networks in map representations. Using the proposed method, the difficulty of rendering complex road networks can be reduced. Full article
Show Figures

Figure 1

5659 KiB  
Article
Deriving Ephemeral Gullies from VHR Image in Loess Hilly Areas through Directional Edge Detection
by Xin Yang, Wen Dai, Guoan Tang and Min Li
ISPRS Int. J. Geo-Inf. 2017, 6(11), 371; https://doi.org/10.3390/ijgi6110371 - 18 Nov 2017
Cited by 11 | Viewed by 5135
Abstract
Monitoring ephemeral gullies facilitates water planning and soil conservation. Artificial interpretation based on high spatial resolution images is the main method for monitoring ephemeral gullies in large areas; however, this method is time consuming. In this study, a semiautomatic method for extracting ephemeral [...] Read more.
Monitoring ephemeral gullies facilitates water planning and soil conservation. Artificial interpretation based on high spatial resolution images is the main method for monitoring ephemeral gullies in large areas; however, this method is time consuming. In this study, a semiautomatic method for extracting ephemeral gullies in loess hilly areas based on directional edge detection is proposed. First, the area where ephemeral gullies developed was extracted because the weak trace of ephemeral gullies in images can hardly be detected by most image detectors, which avoided the noise from other large gullies. Second, a Canny edge detector was employed to extract all edges in the image. Then, those edges along the direction where ephemeral gullies developed were searched and coded as candidate ephemeral gullies. Finally, the ephemeral gullies were identified through filtering of pseudo-gullies by setting the appropriate length threshold. Experiments in three loess hilly areas showed that accuracy ranged from 38.18% to 85.05%, completeness ranged from 82.35% to 92.86%, and quality ranged from 35.29% to 79.82%. The quality of the remote sensing images highly affected the results. The accuracy was significantly improved when the image was used with less grass and shrubs. The length threshold in directional searching also affected the accuracy. A small threshold resulted in additional noise and disconnected gullies, whereas a large threshold disregarded the short gullies. A reasonable threshold can be obtained through the index of quality. The threshold also exhibits a strong relationship with the average length of ephemeral gullies, and this relationship can help obtain the optimum threshold in the hilly area of the Northern Loess Plateau of China. Full article
Show Figures

Figure 1

93107 KiB  
Article
An Integrated Spatial Clustering Analysis Method for Identifying Urban Fire Risk Locations in a Network-Constrained Environment: A Case Study in Nanjing, China
by Zelong Xia, Hao Li and Yuehong Chen
ISPRS Int. J. Geo-Inf. 2017, 6(11), 370; https://doi.org/10.3390/ijgi6110370 - 17 Nov 2017
Cited by 7 | Viewed by 5204
Abstract
The spatial distribution of urban geographical events is largely constrained by the road network, and research on spatial clusters of fire accidents at the city level plays a crucial role in emergency rescue and urban planning. For example, by knowing where and when [...] Read more.
The spatial distribution of urban geographical events is largely constrained by the road network, and research on spatial clusters of fire accidents at the city level plays a crucial role in emergency rescue and urban planning. For example, by knowing where and when fire accidents usually occur, fire enforcement can conduct more efficient aid measures and planning department can work out more reasonable layout optimization of fire stations. This article proposed an integrated method by combining weighted network-constrained kernel density estimation (NKDE) and network-constrained local Moran’s I (ILINCS) to detect spatial cluster pattern and identify higher-risk locations of fire accidents. The proposed NKDE-ILINCS weighted a set of crucial non-spatial attributes of point events and links, and considered the impact factors of road traffic states, intersection roads and fire severity in NKDE to reflect real urban environment. This method was tested using the fire data in 2015 in Nanjing, China. The results demonstrated that the method was appropriate to detect network-constrained fire cluster patterns and identify high–high road segments. Besides, the first 14 higher-risk road segments in Nanjing are listed. These findings of this case study enhance our knowledge to more accurately observe where fire accidents usually occur and provide a reference for fire departments to improve emergency rescue effectiveness. Full article
(This article belongs to the Special Issue Urban Environment Mapping Using GIS)
Show Figures

Figure 1

16294 KiB  
Article
Mapping and Analyzing Stream Network Changes in Watonwan River Watershed, Minnesota, USA
by Fei Yuan, Phillip Larson, Roman Mulvihill, Devon Libby, Jessica Nelson, Tyler Grupa and Rick Moore
ISPRS Int. J. Geo-Inf. 2017, 6(11), 369; https://doi.org/10.3390/ijgi6110369 - 17 Nov 2017
Cited by 2 | Viewed by 4535
Abstract
Much of the Watonwan River tributary system to the upper Mississippi River basin (UMR), and the fluvial systems to which it drains, are listed as impaired under the United States Environmental Protection Agency Clean Water Act303(d) and/or by the Minnesota Pollution Control Agency. [...] Read more.
Much of the Watonwan River tributary system to the upper Mississippi River basin (UMR), and the fluvial systems to which it drains, are listed as impaired under the United States Environmental Protection Agency Clean Water Act303(d) and/or by the Minnesota Pollution Control Agency. In addition, eutrophic conditions and excessive sedimentation rates exist in Lake Pepin, a riverine lake to which the UMR drains. Thus, understanding the hydrogeomorphic change throughout the UMR is vital in order to establish appropriate efforts to mitigate environmental hazards downstream. This study attempts to evaluate hydrogeomorphic change at the watershed scale in the Watonwan River watershed between 1855 and the near present. Historical plat maps, digital elevation models (DEMs), aerial images, soil/topographic characteristics, land-use change, and field surveys are analyzed. Surficial hydrologic features digitized from historical plat maps are compared with contemporary stream networks extracted from high-resolution DEMs. Scale effects are investigated using multi-resolution (1 m, 3 m, 8.5 m, and 30 m) DEMs, with 8.5 m DEMs being ideal for watershed scale analysis, and 1–3 m DEMs being ideal for subwatershed analysis. There has been a substantial hydrogeomorphic change in the watershed since 1855, but most significantly, we interpret that the highest rates of erosion occur in the eastern watershed, where knickzone propagation has produced substantial relief. Full article
Show Figures

Figure 1

5143 KiB  
Article
Using Visual Exploratory Data Analysis to Facilitate Collaboration and Hypothesis Generation in Cross-Disciplinary Research
by Xiaogang Ma, Daniel Hummer, Joshua J. Golden, Peter A. Fox, Robert M. Hazen, Shaunna M. Morrison, Robert T. Downs, Bhuwan L. Madhikarmi, Chengbin Wang and Michael B. Meyer
ISPRS Int. J. Geo-Inf. 2017, 6(11), 368; https://doi.org/10.3390/ijgi6110368 - 16 Nov 2017
Cited by 23 | Viewed by 8465
Abstract
Massive open data resources are changing the way that people do science. To make use of those data resources, data science methods and technology can be leveraged by stakeholders of various disciplines. The objective of this paper is to present our experience of [...] Read more.
Massive open data resources are changing the way that people do science. To make use of those data resources, data science methods and technology can be leveraged by stakeholders of various disciplines. The objective of this paper is to present our experience of using visual exploratory data analysis as a method to facilitate collaboration and hypothesis generation in geoscience research. The research team consisted of both geoscientists and computer scientists. A use case-driven, iterative approach was applied to create a collaborative and communicative environment. Through several rounds of use case analysis and technological development, a data visualization pilot system was created for studying the co-relationships between chemical elements and mineral species. The exploratory data analyses conducted in those use case studies led to several research hypotheses for future work. This research illustrates the usefulness of exploratory data analysis for hypothesis generation in a data science process. Although the presented project is in geoscience, the discussed method and experience can also be translated into other disciplines. Full article
Show Figures

Figure 1

20325 KiB  
Article
Comparison and Evolution of Extreme Rainfall-Induced Landslides in Taiwan
by Chunhung WU
ISPRS Int. J. Geo-Inf. 2017, 6(11), 367; https://doi.org/10.3390/ijgi6110367 - 16 Nov 2017
Cited by 13 | Viewed by 4371
Abstract
This study analyzed the characteristics of, and locations prone to, extreme rainfall-induced landslides in three watersheds in Taiwan, as well as the long-term evolution of landslides in the Laonong River watershed (LRW), based on multiannual landslide inventories during 2003–2014. Extreme rainfall-induced landslides were [...] Read more.
This study analyzed the characteristics of, and locations prone to, extreme rainfall-induced landslides in three watersheds in Taiwan, as well as the long-term evolution of landslides in the Laonong River watershed (LRW), based on multiannual landslide inventories during 2003–2014. Extreme rainfall-induced landslides were centralized beside sinuous or meandering reaches, especially those with large sediment deposition. Landslide-prone strata during extreme rainfall events were sandstone and siltstone. Large-scale landslides were likely to occur when the maximum 6-h accumulated rainfall exceeded 420 mm. All of the large-scale landslides induced by short-duration and high-intensity rainfall developed from historical small-scale landslides beside the sinuous or meandering reaches or in the source area of rivers. However, most of the large-scale landslides induced by long-duration and high-intensity rainfall were new but were still located beside sinuous or meandering reaches or near the source. The frequency density of landslides under long-duration and high-intensity rainfall was larger by one order than those under short-duration rainfall, and the β values in the landslide frequency density-area analysis ranged from 1.22 to 1.348. The number of downslope landslides was three times larger than those of midslope and upslope landslides. The extreme rainfall-induced landslides occurred in the erosion gullies upstream of the watersheds, whereas those beside rivers were downstream. Analysis of the long-term evolution of landslides in the LRW showed that the geological setting, sinuousness of reaches, and sediment yield volume determined their location and evolution. Small-scale landslides constituted 71.9–96.2% of the total cases from 2003 to 2014, and were more easily induced after Typhoon Morakot (2009). The frequency density of landslides after Morakot was greater by one order than before, with 61% to 68% of total landslides located in the downslope. Small-scale landslides not beside the rivers disappeared within four years, whereas those beside rivers or located in the source areas either developed into large-scale landslides or slowly disappeared. Large-scale landslides caused by Morakot were either combined from several historical small-scale landslides in the river source areas or located beside the sinuous or meandering reaches. The probabilities of landslide recurrence in the LRW during the next 5, 10, and 20 years were determined to be 7.26%, 9.16%, and 10.48%, respectively, and those beside the rivers were 10.47%, 13.33%, and 15.41%, respectively. Full article
Show Figures

Figure 1

15172 KiB  
Article
Accuracy Assessment of Landform Classification Approaches on Different Spatial Scales for the Iranian Loess Plateau
by Tanja Kramm, Dirk Hoffmeister, Constanze Curdt, Sedigheh Maleki, Farhad Khormali and Martin Kehl
ISPRS Int. J. Geo-Inf. 2017, 6(11), 366; https://doi.org/10.3390/ijgi6110366 - 16 Nov 2017
Cited by 41 | Viewed by 6249
Abstract
An accurate geomorphometric description of the Iranian loess plateau landscape will further enhance our understanding of recent and past geomorphological processes in this strongly dissected landscape. Therefore, four different input datasets for four landform classification methods were used in order to derive the [...] Read more.
An accurate geomorphometric description of the Iranian loess plateau landscape will further enhance our understanding of recent and past geomorphological processes in this strongly dissected landscape. Therefore, four different input datasets for four landform classification methods were used in order to derive the most accurate results in comparison to ground-truth data from a geomorphological field survey. The input datasets in 5 m and 10 m pixel resolution were derived from Pléiades stereo satellite imagery and the “Shuttle Radar Topography Mission” (SRTM), and “Advanced Spaceborne Thermal Emission and Reflection Radiometer” (ASTER GDEM) datasets with a spatial resolution of 30 m were additionally applied. The four classification approaches tested with this data include the stepwise approach after Dikau, the geomorphons, the topographical position index (TPI) and the object based approach. The results show that input datasets with higher spatial resolutions produced overall accuracies of greater than 70% for the TPI and geomorphons and greater than 60% for the other approaches. For the lower resolution datasets, only accuracies of about 40% were derived, 20–30% lower than for data derived from higher spatial resolutions. The results of the topographic position index and the geomorphons approach worked best for all selected input datasets. Full article
Show Figures

Figure 1

23225 KiB  
Article
An Ensemble Model for Co-Seismic Landslide Susceptibility Using GIS and Random Forest Method
by Suchita Shrestha, Tae-Seob Kang and Madan Krishna Suwal
ISPRS Int. J. Geo-Inf. 2017, 6(11), 365; https://doi.org/10.3390/ijgi6110365 - 16 Nov 2017
Cited by 23 | Viewed by 7118
Abstract
The Mw 7.8 Gorkha earthquake of 25 April 2015 triggered thousands of landslides in the central part of the Nepal Himalayas. The main goal of this study was to generate an ensemble-based map of co-seismic landslide susceptibility in Sindhupalchowk District using model comparison [...] Read more.
The Mw 7.8 Gorkha earthquake of 25 April 2015 triggered thousands of landslides in the central part of the Nepal Himalayas. The main goal of this study was to generate an ensemble-based map of co-seismic landslide susceptibility in Sindhupalchowk District using model comparison and combination strands. A total of 2194 co-seismic landslides were identified and were randomly split into 1536 (~70%), to train data for establishing the model, and the remaining 658 (~30%) for the validation of the model. Frequency ratio, evidential belief function, and weight of evidence methods were applied and compared using 11 different causative factors (peak ground acceleration, epicenter proximity, fault proximity, geology, elevation, slope, plan curvature, internal relief, drainage proximity, stream power index, and topographic wetness index) to prepare the landslide susceptibility map. An ensemble of random forest was then used to overcome the various prediction limitations of the individual models. The success rates and prediction capabilities were critically compared using the area under the curve (AUC) of the receiver operating characteristic curve (ROC). By synthesizing the results of the various models into a single score, the ensemble model improved accuracy and provided considerably more realistic prediction capacities (91%) than the frequency ratio (81.2%), evidential belief function (83.5%) methods, and weight of evidence (80.1%). Full article
Show Figures

Graphical abstract

7836 KiB  
Article
Multiple Feature Hashing Learning for Large-Scale Remote Sensing Image Retrieval
by Dongjie Ye, Yansheng Li, Chao Tao, Xunwei Xie and Xiang Wang
ISPRS Int. J. Geo-Inf. 2017, 6(11), 364; https://doi.org/10.3390/ijgi6110364 - 16 Nov 2017
Cited by 37 | Viewed by 4310
Abstract
Driven by the urgent demand of remote sensing big data management and knowledge discovery, large-scale remote sensing image retrieval (LSRSIR) has attracted more and more attention. As is well known, hashing learning has played an important role in coping with big data mining [...] Read more.
Driven by the urgent demand of remote sensing big data management and knowledge discovery, large-scale remote sensing image retrieval (LSRSIR) has attracted more and more attention. As is well known, hashing learning has played an important role in coping with big data mining problems. In the literature, several hashing learning methods have been proposed to address LSRSIR. Until now, existing LSRSIR methods take only one type of feature descriptor as the input of hashing learning methods and ignore the complementary effects of multiple features, which may represent remote sensing images from different aspects. Different from the existing LSRSIR methods, this paper proposes a flexible multiple-feature hashing learning framework for LSRSIR, which takes multiple complementary features as the input and learns the hybrid feature mapping function, which projects multiple features of the remote sensing image to the low-dimensional binary (i.e., compact) feature representation. Furthermore, the compact feature representations can be directly utilized in LSRSIR with the aid of the hamming distance metric. In order to show the superiority of the proposed multiple feature hashing learning method, we compare the proposed approach with the existing methods on two publicly available large-scale remote sensing image datasets. Extensive experiments demonstrate that the proposed approach can significantly outperform the state-of-the-art approaches. Full article
Show Figures

Figure 1

3635 KiB  
Article
A Hybrid Parallel Spatial Interpolation Algorithm for Massive LiDAR Point Clouds on Heterogeneous CPU-GPU Systems
by Hongyan Wang, Xuefeng Guan and Huayi Wu
ISPRS Int. J. Geo-Inf. 2017, 6(11), 363; https://doi.org/10.3390/ijgi6110363 - 16 Nov 2017
Cited by 9 | Viewed by 3730
Abstract
Nowadays, heterogeneous CPU-GPU systems have become ubiquitous, but current parallel spatial interpolation (SI) algorithms exploit only one type of processing unit, and thus result in a waste of parallel resources. To address this problem, a hybrid parallel SI algorithm based on a thin [...] Read more.
Nowadays, heterogeneous CPU-GPU systems have become ubiquitous, but current parallel spatial interpolation (SI) algorithms exploit only one type of processing unit, and thus result in a waste of parallel resources. To address this problem, a hybrid parallel SI algorithm based on a thin plate spline is proposed to integrate both the CPU and GPU to further accelerate the processing of massive LiDAR point clouds. A simple yet powerful parallel framework is designed to enable simultaneous CPU-GPU interpolation, and a fast online training method is then presented to estimate the optimal decomposition granularity so that both types of processing units can run at maximum speed. Based on the optimal granularity, massive point clouds are continuously partitioned into a collection of discrete blocks in a data processing flow. A heterogeneous dynamic scheduler based on the greedy policy is also proposed to achieve better workload balancing. Experimental results demonstrate that the computing power of the CPU and GPU is fully utilized under conditions of optimal granularity, and the hybrid parallel SI algorithm achieves a significant performance boost when compared with the CPU-only and GPU-only algorithms. For example, the hybrid algorithm achieved a speedup of 20.2 on one of the experimental point clouds, while the corresponding speedups of using a CPU or a GPU alone were 8.7 and 12.6, respectively. The interpolation time was reduced by about 12% when using the proposed scheduler, in comparison with other common scheduling strategies. Full article
Show Figures

Figure 1

11301 KiB  
Article
A Dynamic Spatiotemporal Analysis Model for Traffic Incident Influence Prediction on Urban Road Networks
by Chun Liu, Shuhang Zhang, Hangbin Wu and Qiang Fu
ISPRS Int. J. Geo-Inf. 2017, 6(11), 362; https://doi.org/10.3390/ijgi6110362 - 16 Nov 2017
Cited by 10 | Viewed by 4704
Abstract
Traffic incidents have a broad negative impact on both traffic systems and the quality of social activities; thus, analyzing and predicting the influence of traffic incidents dynamically is necessary. However, the traditional geographic information system for transportation (GIS-T) mostly presents fundamental data and [...] Read more.
Traffic incidents have a broad negative impact on both traffic systems and the quality of social activities; thus, analyzing and predicting the influence of traffic incidents dynamically is necessary. However, the traditional geographic information system for transportation (GIS-T) mostly presents fundamental data and static analysis, and transportation models focus predominantly on some typical road structures. Therefore, it is important to integrate transportation models with the spatiotemporal analysis techniques of GIS to address the dynamic process of traffic incidents. This paper presents a dynamic spatiotemporal analysis model to predict the influence of traffic incidents with the assistance of a GIS database and road network data. The model leverages a physical traffic shockwave model, and different superposition situations of shockwaves are proposed for both straight roads and road networks. Two typical cases were selected to verify the proposed model and were tested with the car-following model and real-world monitoring data. The results showed that the proposed model could successfully predict traffic effects with over 60% accuracy in both cases, and required less computational resources than the car-following model. Compared to other methods, the proposed model required fewer dynamic parameters and could be implemented on a wider set of road hierarchies. Full article
Show Figures

Figure 1

22937 KiB  
Article
Ground Deformation Detection Using China’s ZY-3 Stereo Imagery in an Opencast Mining Area
by Wenmin Hu, Lixin Wu, Wei Zhang, Bin Liu and Jiaxing Xu
ISPRS Int. J. Geo-Inf. 2017, 6(11), 361; https://doi.org/10.3390/ijgi6110361 - 16 Nov 2017
Cited by 10 | Viewed by 5108
Abstract
Detection and extraction of mining-induced ground deformation can be used to understand the deformation process and space distribution and to estimate the deformation laws and trends. This study focuses on the application of ground deformation detection and extraction combined with digital surface model [...] Read more.
Detection and extraction of mining-induced ground deformation can be used to understand the deformation process and space distribution and to estimate the deformation laws and trends. This study focuses on the application of ground deformation detection and extraction combined with digital surface model (DSM), derived from China’s ZiYuan-3 (ZY-3) satellite stereo imagery and the advanced spaceborne thermal emission and reflection radiometer global digital elevation model (ASTER GDEM) data. A district covering 200 km2 around the west open-pit mine in Fushun of Liaoning Province, a city located in Northeast China, is chosen as the study area. Regional overall deformation, typical region deformation, and topographical profile deformation are extracted to analyze the distribution and the link between the regional ground deformations. The results show that the mean elevation has already increased by 3.12 m from 2010 to 2015; 71.18% of this area is deformed, and 22.72% of this area has an elevation variation of more than 10 m. Four districts of rising elevation and three districts of descending elevation are extracted. They are deformed with distinct elevation and volume changes. The total area with distinct rising elevation (>15 m) is about 8.44 km2, and the change in volume is 2.47 × 10⁸ m3. However, the total area with distinct descending elevation (<−10 m) is about 6.12 km2, and the change in volume is 2.01 × 10⁸ m3. Moreover, the deformation in the local mining area has expanded to the surrounding areas. Experiments in the mining area demonstrate that ground deformation, especially acute deformation such as large fractures or landslides, can be monitored using DSMs derived from ZY-3 satellite stereo images. Full article
Show Figures

Figure 1

1907 KiB  
Article
Evaluation of Empirical and Machine Learning Algorithms for Estimation of Coastal Water Quality Parameters
by Majid Nazeer, Muhammad Bilal, Mohammad M. M. Alsahli, Muhammad Imran Shahzad and Ahmad Waqas
ISPRS Int. J. Geo-Inf. 2017, 6(11), 360; https://doi.org/10.3390/ijgi6110360 - 15 Nov 2017
Cited by 29 | Viewed by 5761
Abstract
Coastal waters are one of the most vulnerable resources that require effective monitoring programs. One of the key factors for effective coastal monitoring is the use of remote sensing technologies that significantly capture the spatiotemporal variability of coastal waters. Optical properties of coastal [...] Read more.
Coastal waters are one of the most vulnerable resources that require effective monitoring programs. One of the key factors for effective coastal monitoring is the use of remote sensing technologies that significantly capture the spatiotemporal variability of coastal waters. Optical properties of coastal waters are strongly linked to components, such as colored dissolved organic matter (CDOM), chlorophyll-a (Chl-a), and suspended solids (SS) concentrations, which are essential for the survival of a coastal ecosystem and usually independent of each other. Thus, developing effective remote sensing models to estimate these important water components based on optical properties of coastal waters is mandatory for a successful coastal monitoring program. This study attempted to evaluate the performance of empirical predictive models (EPM) and neural networks (NN)-based algorithms to estimate Chl-a and SS concentrations, in the coastal area of Hong Kong. Remotely-sensed data over a 13-year period was used to develop regional and local models to estimate Chl-a and SS over the entire Hong Kong waters and for each water class within the study area, respectively. The accuracy of regional models derived from EPM and NN in estimating Chl-a and SS was 83%, 93%, 78%, and 97%, respectively, whereas the accuracy of local models in estimating Chl-a and SS ranged from 60–94% and 81–94%, respectively. Both the regional and local NN models exhibited a higher performance than those models derived from empirical analysis. Thus, this study suggests using machine learning methods (i.e., NN) for the more accurate and efficient routine monitoring of coastal water quality parameters (i.e., Chl-a and SS concentrations) over the complex coastal area of Hong Kong and other similar coastal environments. Full article
Show Figures

Graphical abstract

76869 KiB  
Article
A New Recursive Filtering Method of Terrestrial Laser Scanning Data to Preserve Ground Surface Information in Steep-Slope Areas
by Mi-Kyeong Kim, Sangpil Kim, Hong-Gyoo Sohn, Namhoon Kim and Je-Sung Park
ISPRS Int. J. Geo-Inf. 2017, 6(11), 359; https://doi.org/10.3390/ijgi6110359 - 15 Nov 2017
Cited by 8 | Viewed by 4321
Abstract
Landslides are one of the critical natural hazards that cause human, infrastructure, and economic losses. Risk of catastrophic losses due to landslides is significant given sprawled urban development near steep slopes and the increasing proximity of large populations to hilly areas. For reducing [...] Read more.
Landslides are one of the critical natural hazards that cause human, infrastructure, and economic losses. Risk of catastrophic losses due to landslides is significant given sprawled urban development near steep slopes and the increasing proximity of large populations to hilly areas. For reducing these losses, a high-resolution digital terrain model (DTM) is an essential piece of data for a qualitative or a quantitative investigation of slopes that may lead to landslides. Data acquired by a terrestrial laser scanning (TLS), called a point cloud, has been widely used to generate a DTM, since a TLS is appropriate for detecting small- to large-scale ground features on steep slopes. For an accurate DTM, TLS data should be filtered to remove non-ground points, but most current algorithms for extracting ground points from a point cloud have been developed for airborne laser scanning (ALS) data and not TLS data. Moreover, it is a challenging task to generate an accurate DTM from a steep-slope area by using existing algorithms. For these reasons, we developed an algorithm to automatically extract only ground points from the point clouds of steep terrains. Our methodology is focused on TLS datasets and utilizes the adaptive principal component analysis–triangular irregular network (PCA-TIN) approach. Our method was applied to two test areas and the results showed that the algorithm can cope well with steep slopes, giving an accurate surface model compared to conventional algorithms. Total accuracy values of the generated DTMs in the form of root mean squared errors are 1.84 cm and 2.13 cm over the areas of 5252 m2 and 1378 m2, respectively. The slope-based adaptive PCA-TIN method demonstrates great potential for TLS-derived DTM construction in steep-slope landscapes. Full article
Show Figures

Figure 1

15514 KiB  
Article
Exploring Determinants of Housing Prices in Beijing: An Enhanced Hedonic Regression with Open Access POI Data
by Yixiong Xiao, Xiang Chen, Qiang Li, Xi Yu, Jin Chen and Jing Guo
ISPRS Int. J. Geo-Inf. 2017, 6(11), 358; https://doi.org/10.3390/ijgi6110358 - 15 Nov 2017
Cited by 53 | Viewed by 9821
Abstract
The housing market in Chinese metropolises have become inflated significantly over the last decade. In addition to an economic upturn and housing policies that have potentially fueled the real estate bubble, factors that have contributed to the spatial heterogeneity of housing prices can [...] Read more.
The housing market in Chinese metropolises have become inflated significantly over the last decade. In addition to an economic upturn and housing policies that have potentially fueled the real estate bubble, factors that have contributed to the spatial heterogeneity of housing prices can be dictated by the amenity value in the proximity of communities, such as accessibility to business centers and transportation hubs. In the past, scholars have employed the hedonic pricing model to quantify the amenity value in relation to structural, locational, and environmental variables. These studies, however, are limited by two methodological obstacles that are relatively difficult to overcome. The first pertains to difficulty of data collection in regions where geospatial datasets are strictly controlled and limited. The second refers to the spatial autocorrelation effect inherent in the hedonic analysis. Using Beijing, China as a case study, we addressed these two issues by (1) collecting residential housing and urban amenity data in terms of Points of Interest (POIs) through web-crawling on open access platforms; and (2) eliminating the spatial autocorrelation effect using the Eigenvector Spatial Filtering (ESF) method. The results showed that the effects of nearby amenities on housing prices are mixed. In other words, while proximity to certain amenities, such as convenient parking, was positively correlated with housing prices, other amenity variables, such as supermarkets, showed negative correlations. This mixed finding is further discussed in relation to community planning strategies in Beijing. This paper provides an example of employing open access datasets to analyze the determinants of housing prices. Results derived from the model can offer insights into the reasons for housing segmentation in Chinese cities, eventually helping to formulate effective urban planning strategies and equitable housing policies. Full article
(This article belongs to the Special Issue Urban Environment Mapping Using GIS)
Show Figures

Figure 1

52237 KiB  
Article
Visualization of Features in 3D Terrain
by Steve Dübel and Heidrun Schumann
ISPRS Int. J. Geo-Inf. 2017, 6(11), 357; https://doi.org/10.3390/ijgi6110357 - 14 Nov 2017
Cited by 7 | Viewed by 6909
Abstract
In 3D terrain analysis, topographical characteristics, such as mountains or valleys, and geo-spatial data characteristics, such as specific weather conditions or objects of interest, are important features. Visual representations of these features are essential in many application fields, e.g., aviation, meteorology, or geo-science. [...] Read more.
In 3D terrain analysis, topographical characteristics, such as mountains or valleys, and geo-spatial data characteristics, such as specific weather conditions or objects of interest, are important features. Visual representations of these features are essential in many application fields, e.g., aviation, meteorology, or geo-science. However, creating suitable representations is challenging. On the one hand, conveying the topography of terrain models is difficult, due to data complexity and computational costs. On the other hand, depicting further geo-spatial data increases the intricacy of the image and can lead to visual clutter. Moreover, perceptional issues within the 3D presentation, such as distance recognition, play a significant role as well. In this paper, we address the question of how features in the terrain can be visualized appropriately. We discuss various design options to facilitate the awareness of global and local features; that is, the coarse spatial distribution of characteristics and the fine-granular details. To improve spatial perception of the 3D environment, we propose suitable depth cues. Finally, we demonstrate the feasibility of our approach by a sophisticated framework called TedaVis that unifies the proposed concepts and facilitates designing visual terrain representations tailored to user requirements. Full article
(This article belongs to the Special Issue Leading Progress in Digital Terrain Analysis and Modeling)
Show Figures

Graphical abstract

1298 KiB  
Article
Web-Scale Normalization of Geospatial Metadata Based on Semantics-Aware Data Sources
by Cristiano Fugazza, Paolo Tagliolato, Luca Frigerio and Paola Carrara
ISPRS Int. J. Geo-Inf. 2017, 6(11), 354; https://doi.org/10.3390/ijgi6110354 - 13 Nov 2017
Cited by 6 | Viewed by 3752
Abstract
Geospatial metadata are largely denormalized inasmuch as resource descriptions typically accommodate property values as plain text. Hence, it is not possible to bring multiple references to the same entity (say, a keyword from a controlled vocabulary) under the same umbrella. This practice is [...] Read more.
Geospatial metadata are largely denormalized inasmuch as resource descriptions typically accommodate property values as plain text. Hence, it is not possible to bring multiple references to the same entity (say, a keyword from a controlled vocabulary) under the same umbrella. This practice is ultimately the main source for the heterogeneities in metadata descriptions by which geospatial discovery is hampered. In this paper, we elaborate on ex-post semantic augmentation of metadata, a technique generally referred to as semantic lift, which complements our previous research on semantic characterization of metadata via transparent association of uniform resource identifiers with metadata items at editing time. The latter is accomplished by means of a template-based metadata editor that can be tailored to any XML-based metadata schema. By repurposing the template language previously defined for metadata editing, we broaden the expressiveness of the former and integrate heterogeneous, XML-based resource descriptions in our semantics-aware metadata management workflow. URI-based indirection in metadata provision not only entails normalization of individual information items and allows one to overcome the aforementioned heterogeneities, but also elicits decentralized, multi-tenanted management of metadata. Full article
Show Figures

Figure 1

11901 KiB  
Article
A Post-Rectification Approach of Depth Images of Kinect v2 for 3D Reconstruction of Indoor Scenes
by Jichao Jiao, Libin Yuan, Weihua Tang, Zhongliang Deng and Qi Wu
ISPRS Int. J. Geo-Inf. 2017, 6(11), 349; https://doi.org/10.3390/ijgi6110349 - 13 Nov 2017
Cited by 34 | Viewed by 7888
Abstract
3D reconstruction of indoor scenes is a hot research topic in computer vision. Reconstructing fast, low-cost, and accurate dense 3D maps of indoor scenes have applications in indoor robot positioning, navigation, and semantic mapping. In other studies, the Microsoft Kinect for Windows v2 [...] Read more.
3D reconstruction of indoor scenes is a hot research topic in computer vision. Reconstructing fast, low-cost, and accurate dense 3D maps of indoor scenes have applications in indoor robot positioning, navigation, and semantic mapping. In other studies, the Microsoft Kinect for Windows v2 (Kinect v2) is utilized to complete this task, however, the accuracy and precision of depth information and the accuracy of correspondence between the RGB and depth (RGB-D) images still remain to be improved. In this paper, we propose a post-rectification approach of the depth images to improve the accuracy and precision of depth information. Firstly, we calibrate the Kinect v2 with a planar checkerboard pattern. Secondly, we propose a post-rectification approach of the depth images according to the reflectivity-related depth error. Finally, we conduct tests to evaluate this post-rectification approach from the perspectives of accuracy and precision. In order to validate the effect of our post-rectification approach, we apply it to RGB-D simultaneous localization and mapping (SLAM) in an indoor environment. Experimental results show that once our post-rectification approach is employed, the RGB-D SLAM system can perform a more accurate and better visual effect 3D reconstruction of indoor scenes than other state-of-the-art methods. Full article
(This article belongs to the Special Issue 3D Indoor Modelling and Navigation)
Show Figures

Figure 1

3612 KiB  
Article
Relationship between MRPV Model Parameters from MISRL2 Land Surface Product and Land Covers: A Case Study within Mainland Spain
by Patricia Arrogante-Funes, Carlos J. Novillo, Raúl Romero-Calcerrada, René Vázquez-Jiménez and Rocío N. Ramos-Bernal
ISPRS Int. J. Geo-Inf. 2017, 6(11), 353; https://doi.org/10.3390/ijgi6110353 - 10 Nov 2017
Cited by 4 | Viewed by 3808
Abstract
In this study, we showed that the multi-angle satellite remote sensing product, MISR L2 Land Surface (MIL2ASLS), which has a scale of 1.1 km, could be suitable for improving land-cover studies. Using seven images from this product, captured by the multi-angle imaging spectroradiometer [...] Read more.
In this study, we showed that the multi-angle satellite remote sensing product, MISR L2 Land Surface (MIL2ASLS), which has a scale of 1.1 km, could be suitable for improving land-cover studies. Using seven images from this product, captured by the multi-angle imaging spectroradiometer sensor (MISR), we explored the values reached by the three parameters (ρ0, Θ, and k) of the Rahman–Pinty–Verstraete model, which was modified by Martonchick (MRPV). Thereafter, we compared the values and behaviors shown in seven Co-ordination of Information on the Environment (CORINE) land cover categories, in the red and near infrared (NIR) bands, over the seven MISR orbits captured in 2006 for Mainland Spain. Furthermore, we used Normalized Difference Vegetation Index (NDVI), Leaf Area Index (LAI), and Fraction of Photosynthetically Active Radiation (FPAR) ancillary data and the illumination angles from the same pixels, which made up the images. These ancillary data were also provided by the MISR products. An inferential statistic test was performed to evaluate the relationship between each parameter–band combination, and the land cover in every MISR orbit used. The results suggested that the ρ0 parameters of this product seemed to be the most related to photosynthetic activity, and it should be comparable with the widely-used NDVI. On the other hand, the k and Θ parameter values were not related, or at least not entirely related, to the phenology of land coverage. These seemed to be more influenced by the anisotropy behavior of the studied land cover pixels. Additionally, we observed, by constructing analysis of variance, how the mean of each MRPV parameter–band differed statistically (p < 0.01) by land covers and orbits. This study suggested that the MISR MRPV model parameter data product has great potential to be used to improve land cover applications. Full article
Show Figures

Figure 1

2006 KiB  
Article
WLAN Fingerprint Indoor Positioning Strategy Based on Implicit Crowdsourcing and Semi-Supervised Learning
by Chunjing Song and Jian Wang
ISPRS Int. J. Geo-Inf. 2017, 6(11), 356; https://doi.org/10.3390/ijgi6110356 - 09 Nov 2017
Cited by 19 | Viewed by 4530
Abstract
Wireless local area network (WLAN) fingerprint positioning is an indoor localization technique with high accuracy and low hardware requirements. However, collecting received signal strength (RSS) samples for the fingerprint database is time-consuming and labor-intensive, hindering the use of this technique. The popular crowdsourcing [...] Read more.
Wireless local area network (WLAN) fingerprint positioning is an indoor localization technique with high accuracy and low hardware requirements. However, collecting received signal strength (RSS) samples for the fingerprint database is time-consuming and labor-intensive, hindering the use of this technique. The popular crowdsourcing sampling technique has been introduced to reduce the workload of sample collection, but has two challenges: one is the heterogeneity of devices, which can significantly affect the positioning accuracy; the other is the requirement of users’ intervention in traditional crowdsourcing, which reduces the practicality of the system. In response to these challenges, we have proposed a new WLAN indoor positioning strategy, which incorporates a new preprocessing method for RSS samples, the implicit crowdsourcing sampling technique, and a semi-supervised learning algorithm. First, implicit crowdsourcing does not require users’ intervention. The acquisition program silently collects unlabeled samples, the RSS samples, without information about the position. Secondly, to cope with the heterogeneity of devices, the preprocessing method maps all the RSS values of samples to a uniform range and discretizes them. Finally, by using a large number of unlabeled samples with some labeled samples, Co-Forest, the introduced semi-supervised learning algorithm, creates and repeatedly refines a random forest ensemble classifier that performs well for location estimation. The results of experiments conducted in a real indoor environment show that the proposed strategy reduces the demand for large quantities of labeled samples and achieves good positioning accuracy. Full article
Show Figures

Figure 1

5330 KiB  
Article
Conceptual Design of a Mobile Application for Geography Fieldwork Learning
by Xiaoling Wang, Corné P. J. M. Van Elzakker and Menno-Jan Kraak
ISPRS Int. J. Geo-Inf. 2017, 6(11), 355; https://doi.org/10.3390/ijgi6110355 - 09 Nov 2017
Cited by 11 | Viewed by 5806
Abstract
The use of mobile applications on smartphones has a vast potential to support learning in the field. However, all learning technologies should be properly designed. To this end, we adopt User-Centered Design (UCD) to design a mobile application, called GeoFARA (Geography Fieldwork Augmented [...] Read more.
The use of mobile applications on smartphones has a vast potential to support learning in the field. However, all learning technologies should be properly designed. To this end, we adopt User-Centered Design (UCD) to design a mobile application, called GeoFARA (Geography Fieldwork Augmented Reality Application), for university geography fieldwork. This paper is about the conceptual design of GeoFARA based on its use and user requirements. The paper first establishes a review of selected existing mobile AR applications for outdoor use, in order to identify the innovative aspects and the improvements of GeoFARA. Thereafter, we present the results of use and user requirements derived from (1) an online survey of the current use of tools in undergraduate geography fieldwork, (2) a field experiment in which the use of paper maps and a mobile mapping tool were compared, (3) investigations during a human geography fieldwork, (4) post-fieldwork surveys among undergraduates from two universities, (5) our use case, and (6) a use scenario. Based on these requirements, a conceptual design of GeoFARA is provided in terms of technical specifications, main contents, functionalities, as well as user interactions and interfaces. This conceptual design will guide the future prototype development of GeoFARA. Full article
Show Figures

Figure 1

4179 KiB  
Article
GIS-Based Evaluation of Spatial Interactions by Geographic Disproportionality of Industrial Diversity
by Jemyung Lee and Satoshi Hoshino
ISPRS Int. J. Geo-Inf. 2017, 6(11), 352; https://doi.org/10.3390/ijgi6110352 - 08 Nov 2017
Cited by 3 | Viewed by 4852
Abstract
Diversity of regional industry is regarded as a key factor for regional development, as it has a positive relationship with economic stability, which attracts population. This paper focuses on how the spatial imbalance of industrial diversity contributes to the population change caused by [...] Read more.
Diversity of regional industry is regarded as a key factor for regional development, as it has a positive relationship with economic stability, which attracts population. This paper focuses on how the spatial imbalance of industrial diversity contributes to the population change caused by inter-regional migration. This paper introduces a spatial interaction model for the Geographic Information System (GIS)-based simulation of the spatial interactions to evaluate the demographic attraction force. The proposed model adopts the notions of gravity, entropy, and virtual work. An industrial classification by profit level is introduced and its diversity is quantified with the entropy of information theory. The introduced model is applied to the cases of 207 regions in South Korea. Spatial interactions are simulated with an optimized model and their resultant forces, the demographic attraction forces, are compared with observed net migration for verification. The results show that the evaluated attraction forces from industrial diversity have a very significant, positive, and moderate relationship with net migration, while other conventional factors of industry, population, economy, and the job market do not. This paper concludes that the geographical quality of industrial diversity has positive and significant effects on population change by migration. Full article
Show Figures

Graphical abstract

2610 KiB  
Article
WebGIS and Geospatial Technologies for Landscape Education on Personalized Learning Contexts
by María Luisa De Lázaro Torres, Rafael De Miguel González and Francisco José Morales Yago
ISPRS Int. J. Geo-Inf. 2017, 6(11), 350; https://doi.org/10.3390/ijgi6110350 - 08 Nov 2017
Cited by 19 | Viewed by 5373
Abstract
The value of landscape, as part of collective heritage, can be acquired by geographic information systems (GIS) due to the multilayer approach of the spatial configuration. Proficiency in geospatial technologies to collect, process, analyze, interpret, visualize, and communicate geographic information is being increased [...] Read more.
The value of landscape, as part of collective heritage, can be acquired by geographic information systems (GIS) due to the multilayer approach of the spatial configuration. Proficiency in geospatial technologies to collect, process, analyze, interpret, visualize, and communicate geographic information is being increased by undergraduate and graduate students but, in particular, by those who are training to become geography teachers at the secondary education level. Some teaching experiences, using personalized learning, distance learning methodology, and GIS, focused on education aims to integrate students and enhance their understanding of the landscape are shown. Opportunities offered by WebGIS will be described, through quantitative tools and techniques that will allow this modality of learning and improve its effectiveness. Results of this research show that students, through geospatial technologies, learn the landscape as a diversity of elements, but also the complexity of physical and human factors involved. Several conclusions will be highlighted: (i) the contribution of geospatial training to education on the landscape and for sustainable development; (ii) spatial analysis as a means of skills acquisition regarding measures for landscape conservation; and (iii) expanding and applying acquired knowledge to other geographic spaces. Full article
Show Figures

Figure 1

3961 KiB  
Article
Working with Open BIM Standards to Source Legal Spaces for a 3D Cadastre
by Jennifer Oldfield, Peter Van Oosterom, Jakob Beetz and Thomas F. Krijnen
ISPRS Int. J. Geo-Inf. 2017, 6(11), 351; https://doi.org/10.3390/ijgi6110351 - 07 Nov 2017
Cited by 56 | Viewed by 6766
Abstract
Much work has already been done on how a 3D Cadastre should best be developed. An inclusive information model, the Land Administration Model (LADM ISO 19152) has been developed to provide an international framework for how this can best be done. This conceptual [...] Read more.
Much work has already been done on how a 3D Cadastre should best be developed. An inclusive information model, the Land Administration Model (LADM ISO 19152) has been developed to provide an international framework for how this can best be done. This conceptual model does not prescribe the technical data format. One existing source from which data could be obtained is 3D Building Information Models (BIMs), or, more specifically in this context, BIMs in the form of one of buildingSMART’s open standards: the Industry Foundation Classes (IFC). The research followed a standard BIM methodology of first defining the requirements through the use of the Information Delivery Manual (IDM ISO29481) and then translating the process described in the IDM into technical requirements using a Model View Definition (MVD), a practice to coordinate upfront the multidisciplinary stakeholders of a construction project. The proposed process model illustrated how the time it takes to register 3D spatial units in a Land Registry could substantially be reduced compared to the first 3D registration in the Netherlands. The modelling of an MVD or a subset of the IFC data model helped enable the creation and exchange of boundary representations of topological objects capable of being combined into a 3D legal space overview map. Full article
(This article belongs to the Special Issue Research and Development Progress in 3D Cadastral Systems)
Show Figures

Figure 1

Previous Issue
Next Issue
Back to TopTop