Article

Mixture Statistical Distribution Based Multiple Component Model for Target Detection in High Resolution SAR Imagery

1
Electronic Information School, Wuhan University, Wuhan 430072, China
2
State Key Laboratory for Information Engineering in Surveying, Mapping and Remote Sensing, Wuhan University, Wuhan 430079, China
3
Collaborative Innovation Center of Geospatial Technology, 129 Luoyu Road, Wuhan 430079, China
*
Author to whom correspondence should be addressed.
ISPRS Int. J. Geo-Inf. 2017, 6(11), 336; https://doi.org/10.3390/ijgi6110336
Submission received: 24 August 2017 / Revised: 29 September 2017 / Accepted: 30 October 2017 / Published: 2 November 2017

Abstract

:
This paper proposes an innovative Mixture Statistical Distribution Based Multiple Component (MSDMC) model for target detection in high spatial resolution Synthetic Aperture Radar (SAR) images. Traditional detection algorithms usually ignore the spatial relationship among the target’s components. In the presented method, however, both the structural information and the statistical distribution are considered to better recognize the target. Firstly, the method based on compressed sensing reconstruction is used to recover the SAR image. Then, the multiple component model composed of a root filter and some corresponding part filters is applied to describe the structural information of the target. In the following step, mixture statistical distributions are utilised to discriminate the target from the background, and the Method of Logarithmic Cumulants (MoLC) based Expectation Maximization (EM) approach is adopted to estimate the parameters of the mixture statistical distribution model, which will be finally merged into the proposed MSDMC framework together with the multiple component model. In the experiment, the aeroplanes and the electrical power towers in TerraSAR-X SAR images are detected at three spatial resolutions. The results indicate that the presented MSDMC Model has potential for improving the detection performance compared with the state-of-the-art SAR target detection methods.

1. Introduction

Target detection in Synthetic Aperture Radar (SAR) imagery is an important application in remote sensing research. With the increasing availability of spaceborne SAR images, effective techniques for object detection have become desirable. Numerous algorithms have been developed in response to the need for target detection in SAR imagery with different spatial resolutions.
In low spatial resolution SAR imagery, Constant False Alarm Rate (CFAR) [1,2], in which an adaptive threshold is adopted, has become the most widely used method. In [3], the statistical distribution of the background clutter is assumed to be Gaussian to obtain the adaptive threshold. Based on the contrast between the target and the background, the Generalized Likelihood Ratio (GLR) [4] method has also been proposed based on the clutter’s statistical distribution features to achieve an optimal solution under a Bayesian framework. In medium spatial resolution SAR imagery, linear targets, such as oceans and oil spills, can be detected using a Radon transform method [5,6]. To enhance the discrimination between the target and the background, Kaplan [7] proposed the Extended Fractal (EF) feature, which introduced the Hurst index to measure texture roughness at different scales. By contrast, Tello [8] utilized the different characteristics of a target in the spatial and frequency domains to improve the detection results. Wang [9] employed the sub-aperture correlation method for object detection in polarimetric SAR data. Moreover, the coherent spatial filtering scheme [10] takes advantages of a linear function that has demonstrated its validity in improving the ratio between the target and the clutter. Nevertheless, with the improvement of SAR systems, the object of interest is no longer limited to within several pixels, and more complex and rich information is provided. Therefore, researchers begin to focus more on SAR imagery with high spatial resolution.
In high-resolution SAR imagery with a pixel spacing of several meters, appearance variations in the same targets suggest that traditional detection algorithms are not suitable. Thus, Tan et al. proposed an adaptive aircraft-detection method based on a gradient textural saliency map in which a target’s morphological details, such as its structure and shape, could be resolved [11,12]. Huang et al. presented a new ship-detection method based on multi-scale heterogeneities with few parameters to be determined [13]. To draw on the advantages of the above methods, the rich information of a target, such as its texture, spatial relationship, shape and structure has been considered for better target-detection results in SAR imagery [14,15,16]. In [17], regional features were utilized to implement the global scattering center model-based region-to-point match scheme to improve the detection performance.
With respect to the different response of a target at different spatial resolutions, we design a multi-scale detector based on the part-based deformable model [18,19,20] for object detection. The target in the traditional detection result is usually labeled with a bounding box, and no attention is given to each component. For example, an airplane is generally composed of a head, an airframe, two wings and a tail. However, traditional methods have not investigated the latent information between the airplanes and its corresponding parts, which means that each component may not be located in the region of interest. Therefore, a multiple-component scheme inspired by the part-based deformable model is studied to describe the spatial relationships among each component. In the multiple-component model, the whole target is located by the root filter at coarse spatial resolution and the components are oriented by the corresponding part filters at high spatial resolution. Moreover, aiming to obtain rich structural information, we utilize mixture statistical distributions [21] to characterize each component, which is a useful method for object detection in high-resolution SAR images.
In this paper, the Mixture Statistical Distribution Based Multiple Component (MSDMC) model is constructed with the following procedures. In the preprocessing step, an Orthogonal Matching Pursuit (OMP) based Compressed Sensing (CS) [22,23] approach is responsible for suppressing the speckle noise, which helps to eliminate the heavy tails and the intra-class variance to reconstruct the SAR image. Then, a multiple-component model inspired by a part-based deformable model is introduced to describe structural relationships between the target and its components through a root filter and some part filters. The root filter derives the coarse-scale information of the target, and the part filters are applied to construct multiple components at fine spatial resolution. Furthermore, to model the statistical characteristics of the target, the mixture statistical distribution model is adopted and the Method of Logarithmic Cumulants (MoLC) based Expectation Maximization (EM) iteration approach is employed to estimate the parameters [24,25]. Finally, the mixture statistical distributions are incorporated into the multiple-component model to generate the MSDMC model through latent Support Vector Machine (SVM) learning procedures [26,27,28,29]. It is worth noting that the latent SVM approach utilizes training samples with labeled bounding boxes to generate the initial locations of the components through the gradient descent method. In the experiment, the data sets include two types of targets. In the airplane data set, the target-detection results of the statistical distribution-based CFAR method and the corresponding Single Distribution Based Multiple Component (SDMC) algorithms are compared to verify the effectiveness of the structure modeling. For the electrical power tower data set, the proposed method and contrastive methods, including the global scattering center model and the region-based method are tested, and the MSDMC model outperforms the other algorithms by achieving the highest detection rate and lowest false alarm rate.
This paper is organized as follows. Section 2 describes the fundamental principle of the multiple-component model for object detection in high spatial resolution SAR imagery. The complete framework of the MSDMC model is presented in Section 3. In Section 4, representative experiments of the proposed MSDMC algorithm and some comparative methods are conducted using TerraSAR-X SAR images, and detailed results and analysis are provided. Section 5 summarizes the final conclusion.

2. Multiple-Component Model for Target Detection

To improve the target-detection results in high-resolution SAR imagery, a multiple-component model is investigated to describe the spatial relationship among the different components and the target. Nevertheless, SAR imagery is usually contaminated by intense speckle noise, which greatly hinders image interpretation. Thus, the noise is preprocessed at the beginning so that the structure information can be better utilized. The compressed-sensing based reconstruction approach for SAR image denoising is presented in Section 2.1. Section 2.2 introduces the multiple-component model and then recommends a training method for the root filter and the part filters.

2.1. Preprocessing: Compressed Sensing-Based Reconstruction

Compressed Sensing (CS), including denoising, restoration and enhancement [30,31], is a fundamental theory for image reconstruction that has also been extensively applied in remote sensing research. CS is implemented to filter out the notorious speckle noise from high spatial resolution SAR imagery. The CS method is based on the principle that the original signal can be accurately recovered through sparse measurement in a certain transform domain. We briefly describe the CS-based reconstruction approach for denoising with the following steps:
Step 1
All the pixels in the detection window at a certain scale are transformed into the vector X, which is considered as a limited observation of the original signal.
Step 2
X is a linear combination of K basis vectors, whose corresponding coefficients represented by s, are nonzero while those of the other ( N K ) basis vectors are zero. Supposing that the signal X is sparse in the transform domain Ψ , then the sparse representation of signal X is presented using the following formula:
X = Ψ s ,
where Ψ is the orthogonal basis. s denotes the transform coefficients under the orthogonal basis Ψ and can be obtained by s = Ψ T X , where T denotes transposition. However, X from SAR imagery often contains multiplicative speckle noise ε in addition to the original signal X . Thus, we can obtain s by s = Ψ 1 ( ln X + ln ε ) .
Step 3
A stable observation matrix Φ , which is unrelated to Ψ , can be constructed to measure s. Then, the observation vector Y can be formed as:
m i n | | s | | 1 s . t . Y = Φ Ψ 1 ( ln X + ln ε ) = A C S ( ln X + ln ε ) ,
where the random observed Gaussian matrix Φ = M × N , where N is much larger than M. A C S is the information operator used to sense the noise ε , and the solution of Label (2) can be converted into a convex optimization problem. The norm minimization of l 1 is solved by the Orthogonal Matching Pursuit (OMP) algorithm. Finally, the signal X is obtained, and the speckle noise ε is filtered out.

2.2. Multiple Component Model

2.2.1. Description of the Multiple Component Model

In SAR imagery, the appearance of the same target can vary largely due to different incidence angles or topography conditions, making accurate target detection a challenge. However, the problem can be simplified by utilizing the common latent information shared by the target components [32,33,34]. For example, the wing of an airplane can be considered as a component, and its tail can be regarded as another. Thus, each of them can be detected separately rather than merely contouring the whole airplane. Detailed information about the multiple-component model is provided in this section.
Our multiple-component model is inspired by the part-based deformable model and is composed of a root filter and several part filters. For a specific target, the root filter gives an approximate location at coarse resolution while the part filters focus on the detailed information of the component features. The model for a target consisting of n components is defined by an ( n + 2 ) tuple ( F 0 , P 1 , , P n , b ) , where the root filter F 0 is a weight vector corresponding to the statistical features, its position in the spatial pyramid is ( x 0 , y 0 , d 0 ) , P i is the ith part filter and b denotes the real value bias term. We define each part filter using the 3-tuple ( F i , v i , d i ) , where the two-dimensional vector v i represents the anchor position relative to the root filter; and d i is the deformation cost, denoting the deviation degree of the part position to its anchor point. It is worth noting that the number of sub-components is generally determined based on experience; for example, an aircraft can be divided into four parts, namely the head, the wing, the fuselage and the tail, whereas a car is usually split into the main body and four tires. The size of the target is also worth considering. If an airplane in a small image is divided into too many sub-components, there will be too few pixels for each component to extract features for segmentation.
The combination of the response from the root filter and each part filter is scored, serving as a multi-scale detector to identify the correct target using Formulas (3)–(7). In the multiple-component model, we aim to describe the spatial relationships among each component annotated with a bounding box, thereby enhancing the robustness of the proposed target-detection algorithm.

2.2.2. Root Filter and Part Filters Training

The root filter describes the target at a coarse scale, and part filters model each predefined component at twice the spatial resolution of the former. It is essential for part filters to describe the components at fine resolution by re-sampling the original data into d i level pyramids. As mentioned above, the model is represented by ( F 0 , P 1 , , P n , b ) and the root filter F 0 is a weight vector corresponding to the feature of the sliding region (size w × h ) in the pyramid space. Each part filter P i is defined by a tuple ( F i , v i , d i ) . Moreover, H is the feature pyramid and p = ( x , y , λ ) indicates the position of the sliding window in the λ t h level of the pyramid. Hence, ϕ ( H , p ) denotes the eigenvectors of the window with p as the upper left corner. The response of a filter is quantified by the inner product of the weight vector and the corresponding eigenvector. Thus, the score of a filter F i at position p = ( x , y , λ ) is F i · ϕ ( H , p i ) . To eliminate the size error caused by the detection window, the aspect ratio of the target is introduced as an extended factor in the multiple-component model. Then, the potential target can be obtained from the position with the highest score, which is given as:
s c o r e ( P 0 , P 1 , , P n ) = i = 0 n F i · ϕ ( H , p i ) i = 1 n d i · ϕ d ( d x i , d y i ) + g · r + b ,
where ϕ d is the representation of the deformation feature and d i denotes the deformation cost of the ith part, which only exists in the part filters. g is the extended factor, and r is the aspect ratio of the target. ( d x i , d y i ) is the offset of the part to the anchor point and can be represented as:
( d x i , d y i ) = ( x i , y i ) ( 2 ( x 0 , y 0 ) v i ) u i ,
where v i specifies the anchor position and u i is the size of the detection window.
The score of the latent target can be reformulated using the dot product of vector β and ψ ( H , z )
ψ ( H , z ) = ( ϕ ( H , p 0 ) , , ϕ ( H , p n ) , ϕ d ( d x 1 , d y 1 ) , , ϕ d ( d x n , d y n ) , r ) ,
where z = ( p 0 , , p n ) is the filter location, and β is the model parameter denoted as β = ( F 0 , , F n , d 1 , , d n , g , b ) .
Thereafter, the position with the highest score can specify the target using the following formula:
f β ( x ) = max z Z ( x ) β · ψ ( x , z ) ,
where Z ( x ) is the latent value of x. The model parameter β can be trained with the following objective function:
L D ( β ) = 1 2 | | β | | 2 + C i = 1 n max ( 0 , 1 L i · f β ( x i ) ) ,
where L i { 1 , 1 } denote positive and negative samples, respectively. max ( 0 , 1 L i · f β ( x i ) ) is the standard loss, and constant C controls the relative weight vector. It should be noted that if there is a single possible latent value for each example | Z ( x i ) | = 1 , then f ( β ) will be linear in β , and the linear SVM is a special case of latent SVM.
Latent SVM is an active learning method, in which labeled training data, including positive and negative samples, are adopted to calculate the parameter β . The annotation in the sample image only gives the target location with a rough bounding box, and the components containing abundant latent information are not defined. The purpose of latent SVM is to predict the component location and to extract the parameters of the multiple-component model by the annotated information. To initialize the locations of the components, the first step is to obtain the energy map of the root filter in the feature pyramid. Then, the gradient descent method is utilized to sequentially place the part filters at the positions where the remaining energy is maximum. Finally, the parameters of the multiple-component model are calculated by maximizing the responses of all the filters. The detailed information about feature extraction based on the mixture statistical distribution for target detection is described in Section 3.

3. Mixture Statistical Distribution Based Multiple Component Model for SAR Target Detection

Statistical distribution models aim to reveal the statistical characteristics of SAR imagery for a better understanding of the scattering mechanism, contributing to image interpretation, including classification and segmentation. To accurately model the SAR scattering situation, the multiple-component model requires enrichment by combining different statistical distributions to describe the image features. Single statistical distribution models, including the Log-Normal [35], Weibull [36], Rayleigh [37] and Gamma [38] distributions, are exploited in Section 3.1 because statistical distributions have demonstrated their effectiveness in modeling the clutter. In the following chapter, the principle and framework of the proposed MSDMC model are illustrated.

3.1. Mixture Statistical Distribution Parameters Estimation

3.1.1. Mixture Statistical Distribution Model

Assuming that SAR images have many uniform and independent random scatters, according to the Central Limit Theorem (CLT), the real and imaginary parts of the complex SAR data both follow the Gaussian distribution. The amplitude and intensity follow the Rayleigh and negative exponential distributions, respectively [4,37]. In multiple-look SAR imagery, the Gamma distribution is more suitable [35,38] than the other statistical distributions. The typical statistical distributions are shown in Figure 1 with respect to different channels.
In this paper, we focus on target detection using SAR data with single-channel amplitude. For the MSDMC model, various statistical distributions, including the empirical distribution model and the prior-assumption distribution model, are adopted. The Weibull [36,39] and Log-Normal [35] distributions represent empirical statistical distribution models while the Gamma and Rayleigh distributions are typical cases of prior-assumption statistical distribution models. They are all integrated in the MSDMC framework for the following experiments.
Taking into account that a single statistical distribution model is unable to describe the complex SAR scene. Thus, a mixture statistical distribution model, which combines several single statistical distribution models through a linear combination, as presented by the following formula, is proposed:
F ( x , Γ ) = i = 1 n α i f i ( x , Γ i ) , i = 1 n α i = 1 ,
where f i ( x ) represents the Probability Density Function (PDF) of the ith distribution model. x is the image data and Γ is the corresponding parameter. α i is the weight of model f ( x ) . The mixture statistical distribution model enables the variance within the complex SAR image to be described thoroughly. In the experiment, the mixture statistical distribution model consists of four single statistical distributions, including the Gamma, Rayleigh, Log-Normal and Weibull distributions.

3.1.2. Parameter Estimation for the Mixture Statistical Distribution Model

To determine the regularity of the observed SAR data, parameter estimation method is required. The classic parameter estimation methods include Maximum Likelihood (ML) and Method of Moments (MoM). In terms of complicated statistical distributions, ML and MoM methods usually cost substantial computation time and are sensitive to initialization, thus are not efficient in dealing with complicated tasks. However, the Method of Logarithmic Cumulants (MoLC) allows for analytical solutions to be utilized, which saves time and can be considered as a good choice for parameter estimation in the mixture statistical distribution model.
The MoLC approach is established based on the PDF and Mellin integral transform. For parameters F ( x , Γ ) in the mixture statistical distribution model, the Mellin transform with PDF ϕ ( s ) is defined as:
ϕ ( s ) = M T [ F ] ( s ) = 0 x s 1 F ( x , Γ ) d x ,
where the integral converges at s to calculate the ith derivative to obtain the logarithmic moment estimation. The second logrithmic moment is defined as:
l i = d i ϕ ( s ) d s i | s = 1 = 0 ( ln x ) i F ( x , Γ ) d x , i = 1 , 2 ,
Then, the logarithmic cumulants are obtained by setting s = 1 . Formulas (9) and (10) are combined with:
k i = d i ln ϕ ( s ) d s i | s = 1 , i = 1 , 2 ,
The logarithmic moment and logarithmic cumulants are written as:
k 1 = l 1 , k 2 = l 2 l 1 2 , k 3 = l 3 3 l 2 l 1 2 + 2 l 1 3 .
The logarithmic cumulants can be estimated based on the classic distribution model, which is illustrated in Table 1.
To calculate the parameters in the mixture statistical distribution model, an iterative MoLC estimation with an EM [40] approach is implemented. Since several single statistical distribution models are included in the MSDMC model, the first step is to initialize the single distributions; then, EM method is used to select the optimal parameters for each statistical distribution.
For the mixture statistical distribution model presented in Formula (8), the parameter vector θ = ( α 1 , , α i , Γ 1 , 1 , , Γ 1 , m , , Γ i , 1 , Γ i , n ) is correlated with the image. In the EM procedure, the initial parameters of the single distribution models in F ( x , Γ ) are calculated by the MoLC. Then, the logarithmic likelihood function with M observed data can be represented as follows:
m = 1 M ln F ( x m , Γ ) = m = 1 M ln [ i = 1 n α i f i ( x m , Γ i ) ] .
The procedures of the EM approach are described as follows:
E-step: 
The Logarithmic likelihood value of the observed data is calculated according to the current distribution parameters.
M-step: 
The iteration procedure is added to maximize the logarithmic likelihood function:
θ t + 1 = arg max θ Θ m = 1 M i = 1 n τ i n t [ ln α i + ln f i ( x m / Γ i ) ] ,
where
τ i n t = α i t f ( x m / θ i t ) f ( x m / θ i t ) .
Then, the parameters in the mixture statistical distribution model are obtained by maximizing the objective function in formula (14).
Finally, a χ 2 test [41] is used to evaluate the performance of the parameter estimation method. The probability of the observed data subjected to the mixture distribution can be expressed as the following equation:
p = P r { χ 2 ( K t 1 ) > q } = 1 P r { χ 2 ( K t 1 ) q } .

3.2. Framework of the MSDMC Model

An illustration of the proposed MSDMC framework is presented in Figure 2. Considering that our method is weakly supervised, in the experiment, the MSDMC model is first trained, and then testing images are adopted for aircraft detection.
  • Training Process:
    1.
    Each SAR image used in our experiments is first processed by denoising using the OMP-based CS approach.
    2.
    The number of sub-components is determined, and each sub-component is labelled with a blue bounding box.
    3.
    To extract the mixture statistical features of the image, the EM iteration-based MoLC approach is adopted to estimate parameters of the mixture distribution model, which are later merged with the multiple-component model to generate the general MSDMC framework.
    It is worth noting that the feature pyramid is obtained in the training process.
  • Testing Process:
    4.
    The inner product of the multi-scale detector and the pyramid is calculated, and the point in the pyramid with the highest filter response is located and regarded as a candidate location.
    5.
    Among the candidate bounding boxes, the overlap rate is utilized to select the best detection result. If the overlap area is larger than the threshold, as shown in the formula (17), the corresponding bounding box will be chosen and displayed in the final detection results.
As shown in Figure 2, the whole airplane is finally highlighted with a red bounding box, and different components are detected with blue boxes. In the experiment, the number of components is set to 4 and the threshold is set to 0.5, according to the statistic that all the detected targets have an overlap of greater than 50 % in the training process:
s c o r e ( x ) = a r e a ( B B d t B B g t ) a r e a ( B B d t B B g t ) > t h r e s h o l d .

4. Experiment

4.1. Description of the Experiment

To evaluate the performance of the proposed MSDMC model, three high-resolution SAR data sets containing different targets are collected. The details of the experimental data sets are listed in Table 2.
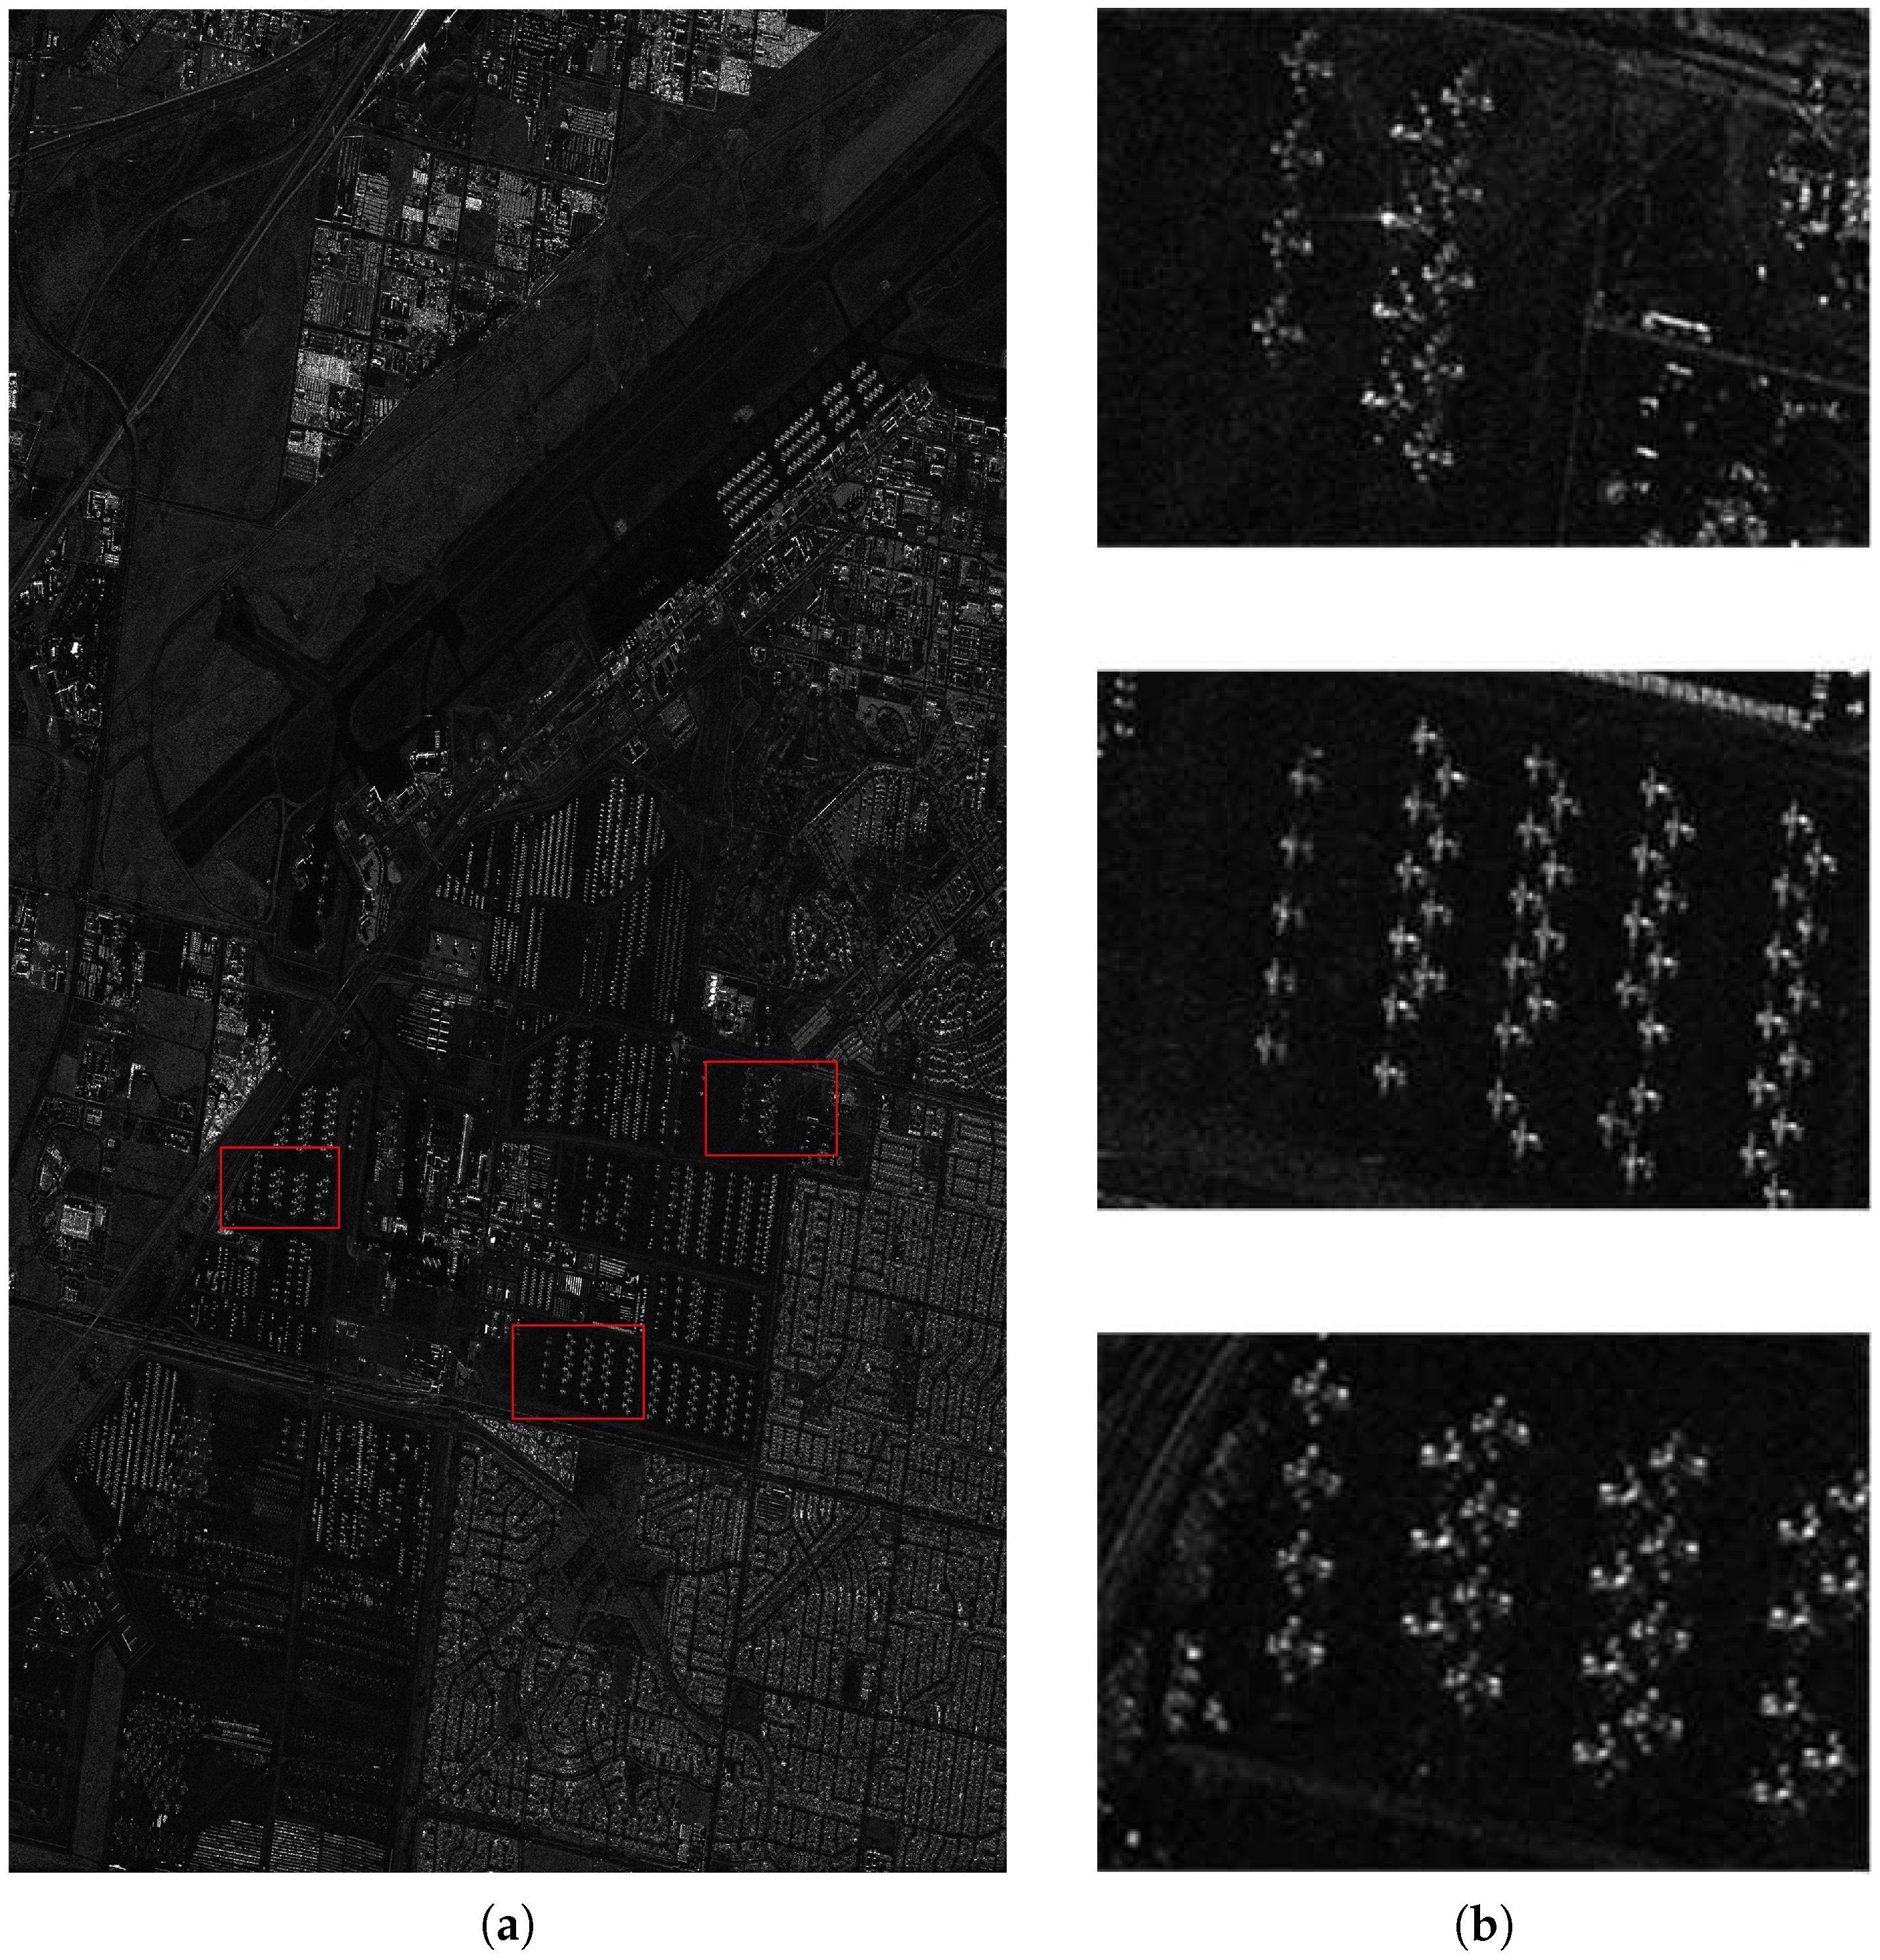
The data set used for airplane detection is the TerraSAR-X spotlight data set with the Horizontal-Horizontal(HH) channel, which contains approximately 4200 planes and is acquired over the Davis–Monthan AFB Force Base (AFB). This SAR data set has a pixel spacing of 2 m and image size of 6248 × 11 , 296 pixels, from which we select a sub-region of 818 × 600 pixels to conduct the experiments in this paper. The overview and three sampling areas of the the Davis–Monthan AFB are shown in Figure 3.
Two TerraSAR-X data sets with different spatial resolutions are used for electrical power tower detection. One is from the suburban area of Wuhan, Hubei Province, China, and the data set is acquired in spotlight mode and the VV channel with a pixel spacing of one meter. The image size is 1909 × 2561 pixels. The other SAR image data is from the rural area of Enshi in the HH channel with a pixel spacing of 3 m, and an image size of 890 × 323 pixels.

4.2. Experiments and Discussion

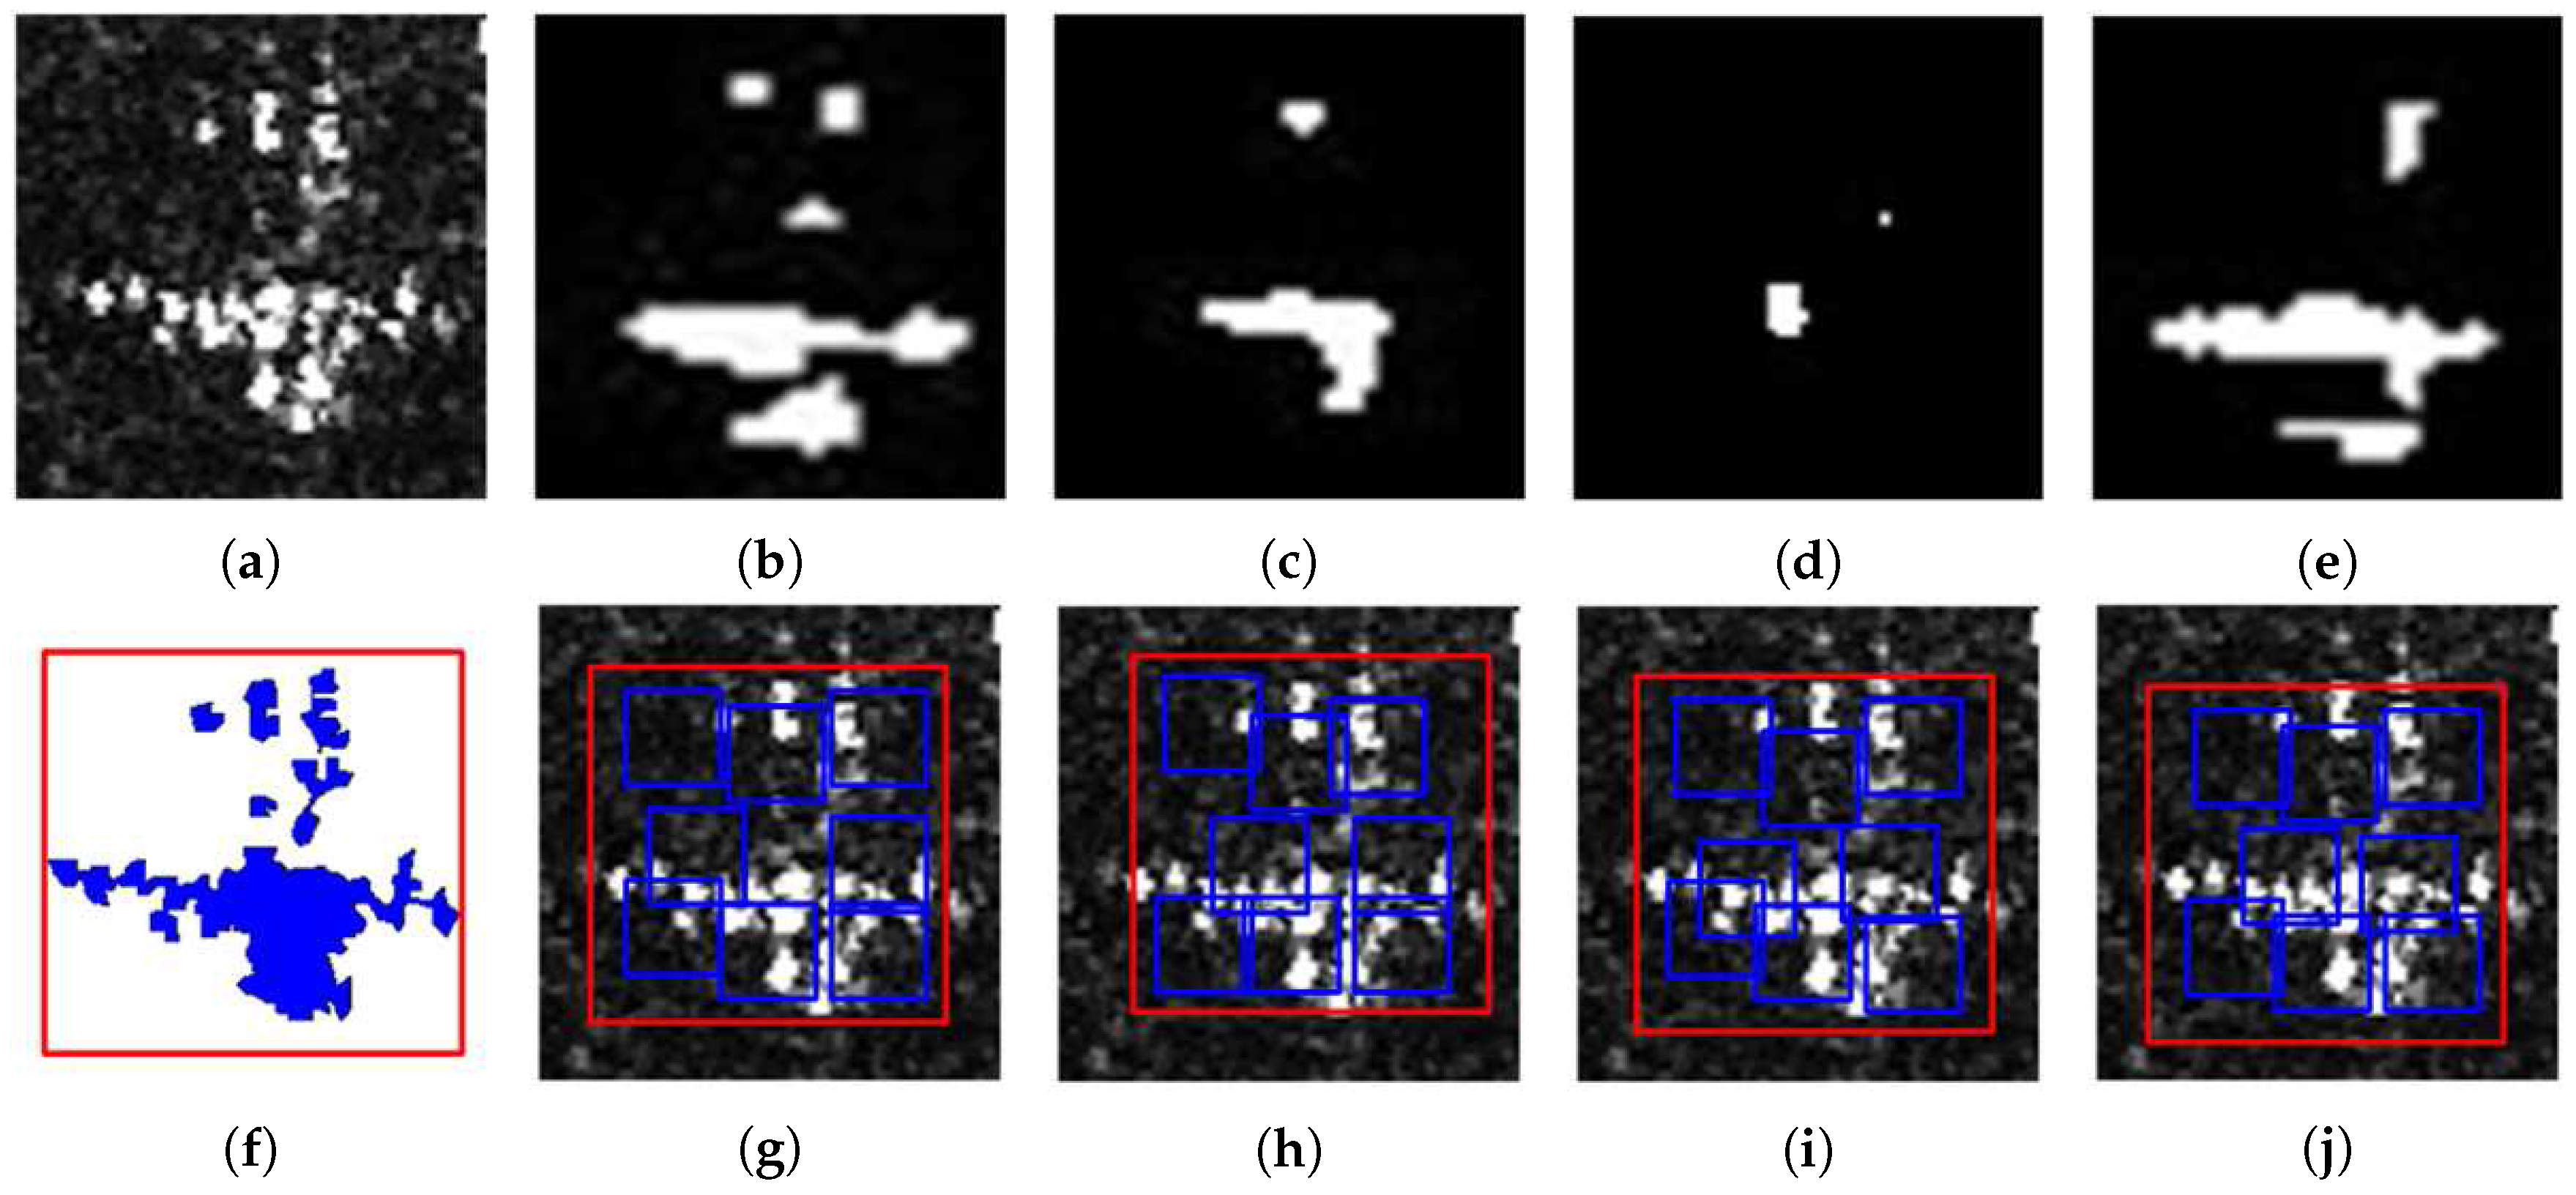
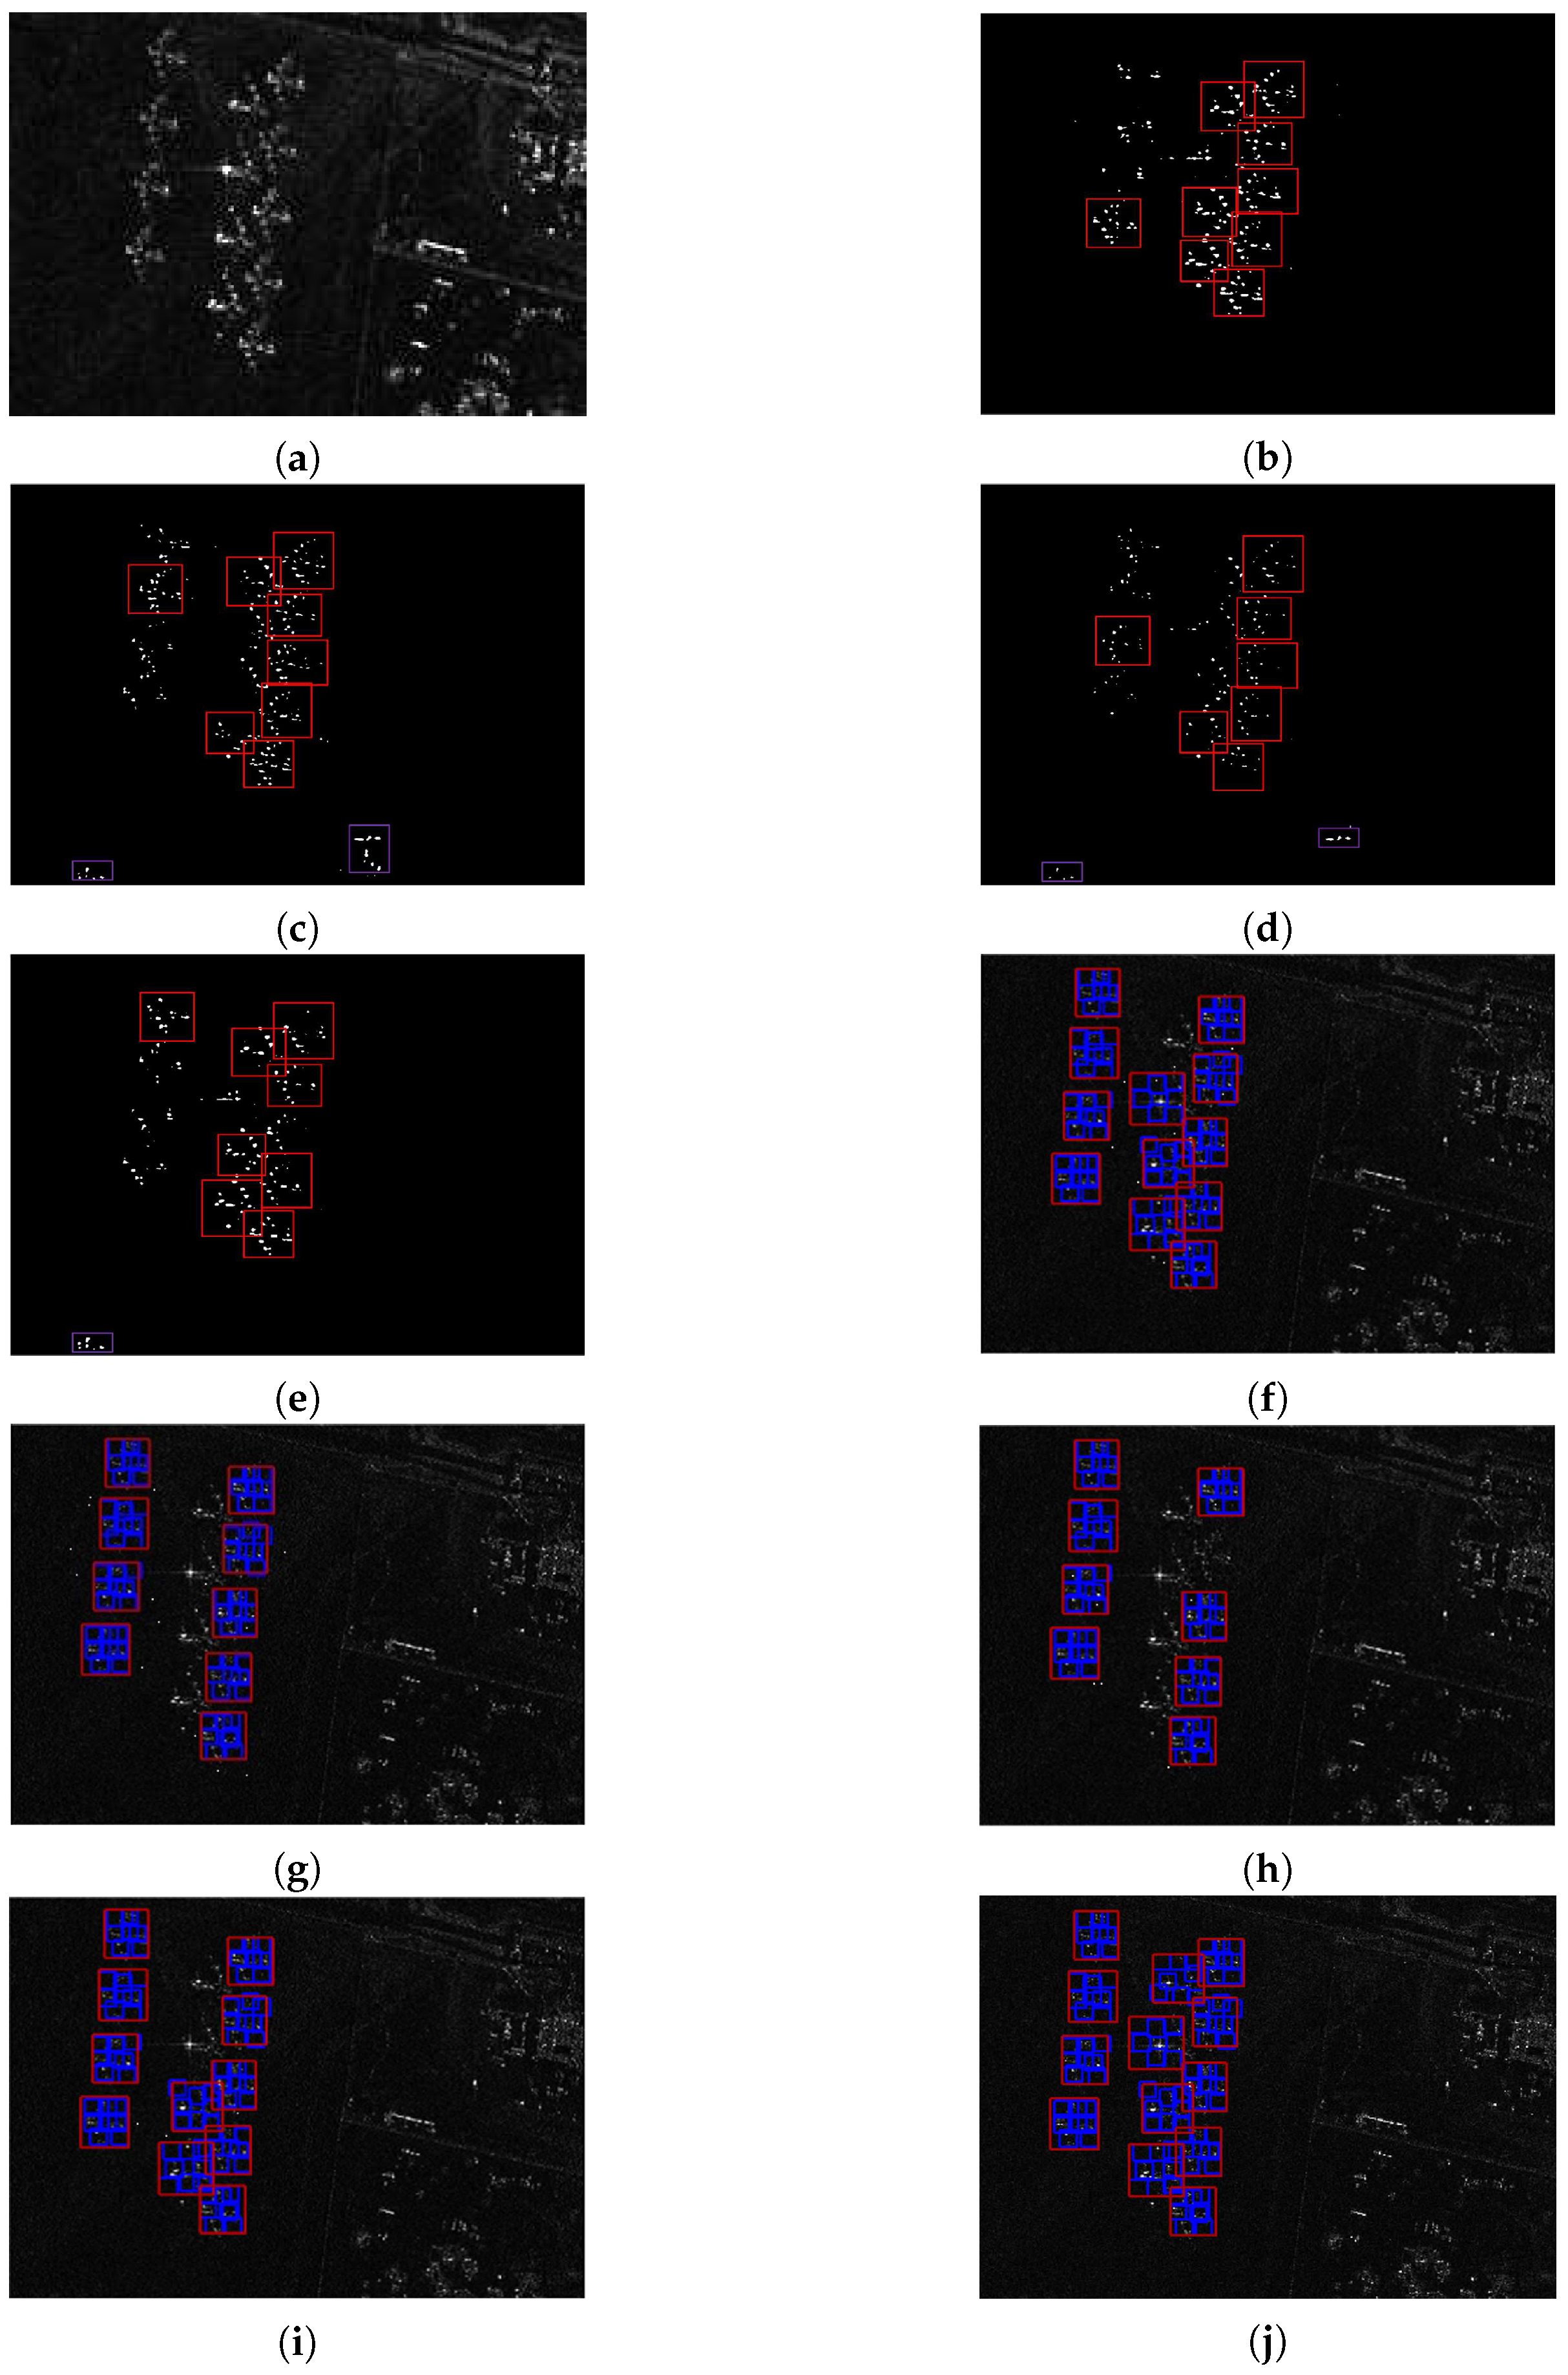
To evaluate the performance of the proposed algorithm, experiments are conducted with a Davis–Monthan data set on the statistical distribution-based CFAR methods, the corresponding Single Distribution Based Multiple Component (SDMC) models, and the mixture statistical distribution-based multiple-component model. Until now, CFAR detectors are commonly used for detecting the targets in SAR images. Moreover, the CFAR method can determine whether a pixel belongs to a target, and output the isolated discriminative results without considering the relationships with the neighboring pixels. In the experiment, four single statistical distribution-based CFAR methods are designed and compared with the corresponding SDMC models, in order to reflect the function of the multiple-component model. Another novelty of this method is adopting mixture statistical distributions, whose advantage over single distributions is reflected by the comparison between the four single statistical distribution-based SDMC methods and the overall MSDMC model.
For Wuhan and Enshi data sets, the effectiveness of the proposed MSDMC model is compared with the global scattering center model [17] and the region-based model [42] to detect the electrical power tower. The quantitative assessment of the target detection results by the different algorithms involves the following two precision indexes: (1) detection rate (the ratio of the number of correctly detected to the total number of targets); (2) false alarm rate (the ratio of false positive targets to the total number of the targets).

4.2.1. Selection of Training Samples and Testing Samples

For the Davis–Monthan data set, samples include 80 positive samples with single airplanes and 200 negative samples covering various roads, buildings, and cars. Furthermore, 30 positive samples and all the negative samples are used as training samples for the multiple-component model, and the remaining 50 positive samples are used as testing samples. The size of each sample is 200 × 200 pixels.
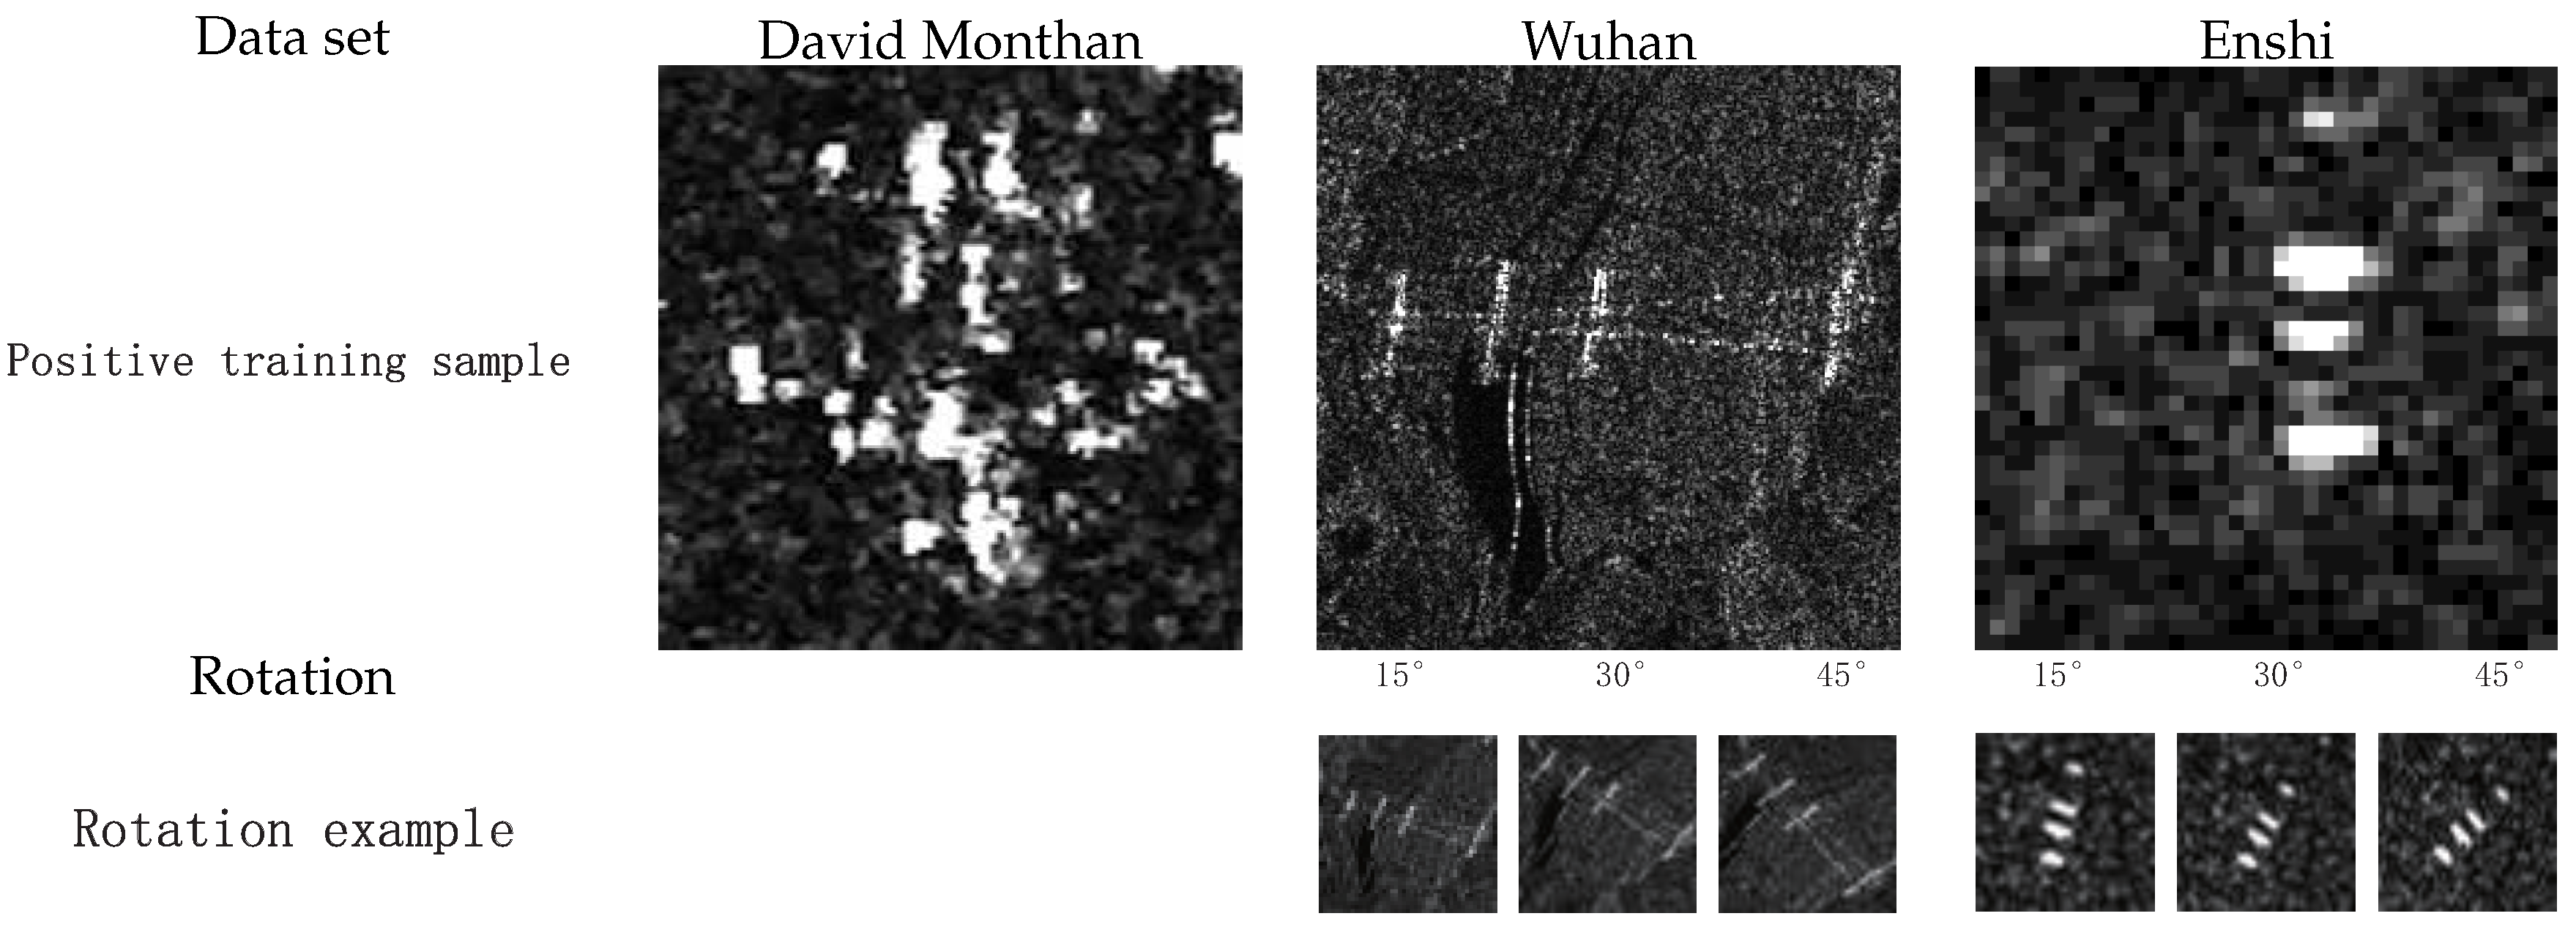
For the Wuhan and Enshi data sets, the total numbers of samples are ten and nine, respectively, and five samples are selected from each as positive samples. However, the current positive samples are insufficient for model training. To enlarge the positive training samples, five positive samples are rotated by 30 in this experiment, as shown in Figure 4 and Table 3. This procedure ensures the adaptability of the multiple components by considering different target orientations in SAR scenes. Thus, 10 positive samples are obtained, and 50 negative samples containing roads, buildings and forests are selected as negative training samples. The remaining sampling areas are processed in the same way to construct the testing samples by rotating the original images by 15 , 30 and 45 . Thus, the number of the positive testing samples is 20 for the Wuhan data set and 16 for the Enshi data set. The size of the samples selected from the Wuhan data set is 200 × 200 pixels. It is worth noting that the samples selected from the Enshi data set have an image patch size of 40 × 40 pixels. An illustration of the training samples is presented in Figure 4.

4.2.2. Airplane Detection Results

A. Performance of the CFAR and SDMC Model with different statistical distributions

The performance details of target-detection algorithms on the Davis–Monthan AFB data set are presented in Figure 5b,e,g,j.
Figure 5a,f are the original high spatial resolution SAR image and the ground truth, respectively. The ground truth is manually delineated from the original SAR imagery using visual interpretation. The comparable detection results of the statistical distribution-based CFAR methods and the statistical distribution-based SDMC methods indicate that the multiple-component model has great effectiveness in modeling the target’s structural information. From Figure 5b,e, it is clear that the statistical distribution-based CFAR method can detect only the highlighted points of the target, and some parts have not been identified. However, the SDMC model can provide complete information about the target and the accurate location is shown with a bounding box, which suggests that modeling the structure information is beneficial to describe the target in high spatial resolution SAR images. Regarding the performance of the different statistical distribution models, the Gamma distribution can detect most of the highlighted points and effectively suppress clutter of the target. Thus, it outperforms the other statistical distributions, confirming that the Gamma distribution is the most suitable choice for modeling airplanes in high spatial resolution SAR images.
For fair comparison, the accuracy sensitivity with different false alarm rates are analyzed in this section since the performance of the CFAR approach is strongly influenced by the false alarm rate. The accuracies, including the completeness and correctness, with different false alarm rates are reported in Figure 6. As shown in the figure, for false alarm rate ranging from 10 8 to 10 2 , the four single statistical distribution-based CFAR methods show variable performance with respect to completeness and correctness. Testing samples with 50 airplanes from Davis–Monthan AFB are selected to calculate the average value of the two indexes. The completeness curves in Figure 6a all rise with increasing false alarm rate. By contrast, in Figure 6b, the four correctness curves grow in the initial stage; then, there is a turning point when the false alarm rate reaches 10 5 , and the curves all begin to decrease to different degrees. To guarantee that the statistical distributions produce the best experimental results, the false alarm rate is set to 10 5 .

B. The performance of the MSDMC and comparative algorithms

The four different distribution-based CFAR methods and the corresponding SDMC approaches are tested on the images from Davis–Monthan AFB, and the related results are presented in Figure 7 and Table 4.
As shown in Figure 7, the SDMC model-based algorithms show better performance than the statistical distribution-based CFAR methods. In terms of the accuracies reported in Table 4, the SDMC models generally have higher detection rates and lower false alarm rates. The bounding boxes of the CFAR methods are generated by manual annotation because the algorithms only provide binary information about the target. In the statistical distribution-based CFAR approaches, a detection result with completeness greater than 50 % is regarded as the right target. The red bounding box is highlighted in Figure 7b–e to indicate the location of the correct target. The purple bounding box denotes the pseudo target detected by the CFAR-based algorithm. It should be noted that the purple box appears in the lower part of sub-figures c,d,e; zooming in on the figures makes them more visible. Clearly, the statistical distribution-based CFAR algorithms do not preserve the complete information of the target because they fail to detect some components. The Gamma distribution-based CFAR method performs the best among the four CFAR methods, with a detection rate of 69.2 % and zero false positives. The Rayleigh and Weibull distribution-based CFAR methods have the same detection rate ( 61.5 % ), but the false alarm rate of the former is much higher. The Log-Normal based CFAR method has the lowest detection rate and the highest false alarm rate. A similar conclusion is reached based on the corresponding SDMC methods. The Gamma distribution-based multiple-component model still provides the highest detection rate of 92.3 % , followed by the Weibull distribution-based method, with a detection rate of 84.6 % . The Rayleigh and Log-Normal based multiple-component methods have the same detection rate of 69.2 % . The detection results of the SDMC model-based methods are labelled with red bounding boxes that cover the whole target, and the corresponding components are annotated with blue boxes. Meanwhile, the SDMC methods all have zero false alarm rates, which are superior to the statistical distribution-based CFAR methods. This result indicates that structure information is useful for object detection in high spatial resolution SAR images. The detection result of the MSDMC model-based scheme is shown in Figure 7j. Compared with the SDMC models, the biggest advantage of the mixture distribution model is that all the targets in the image can be detected with no false positives, which indicates that a single statistical distribution can provide only partial information about the target. By contrast, the mixture statistical distribution model-based algorithm can model a complex scene from different aspects, thus extracting as much information as possible to achieve the best detection results. The calculation time indicates that SDMC model-based method is more time-consuming than the corresponding CFAR method. Finally, the proposed MSDMC algorithm has the longest computation time, which is slightly longer than that of the SDMC method.

4.2.3. Electrical Power Tower Detection Results

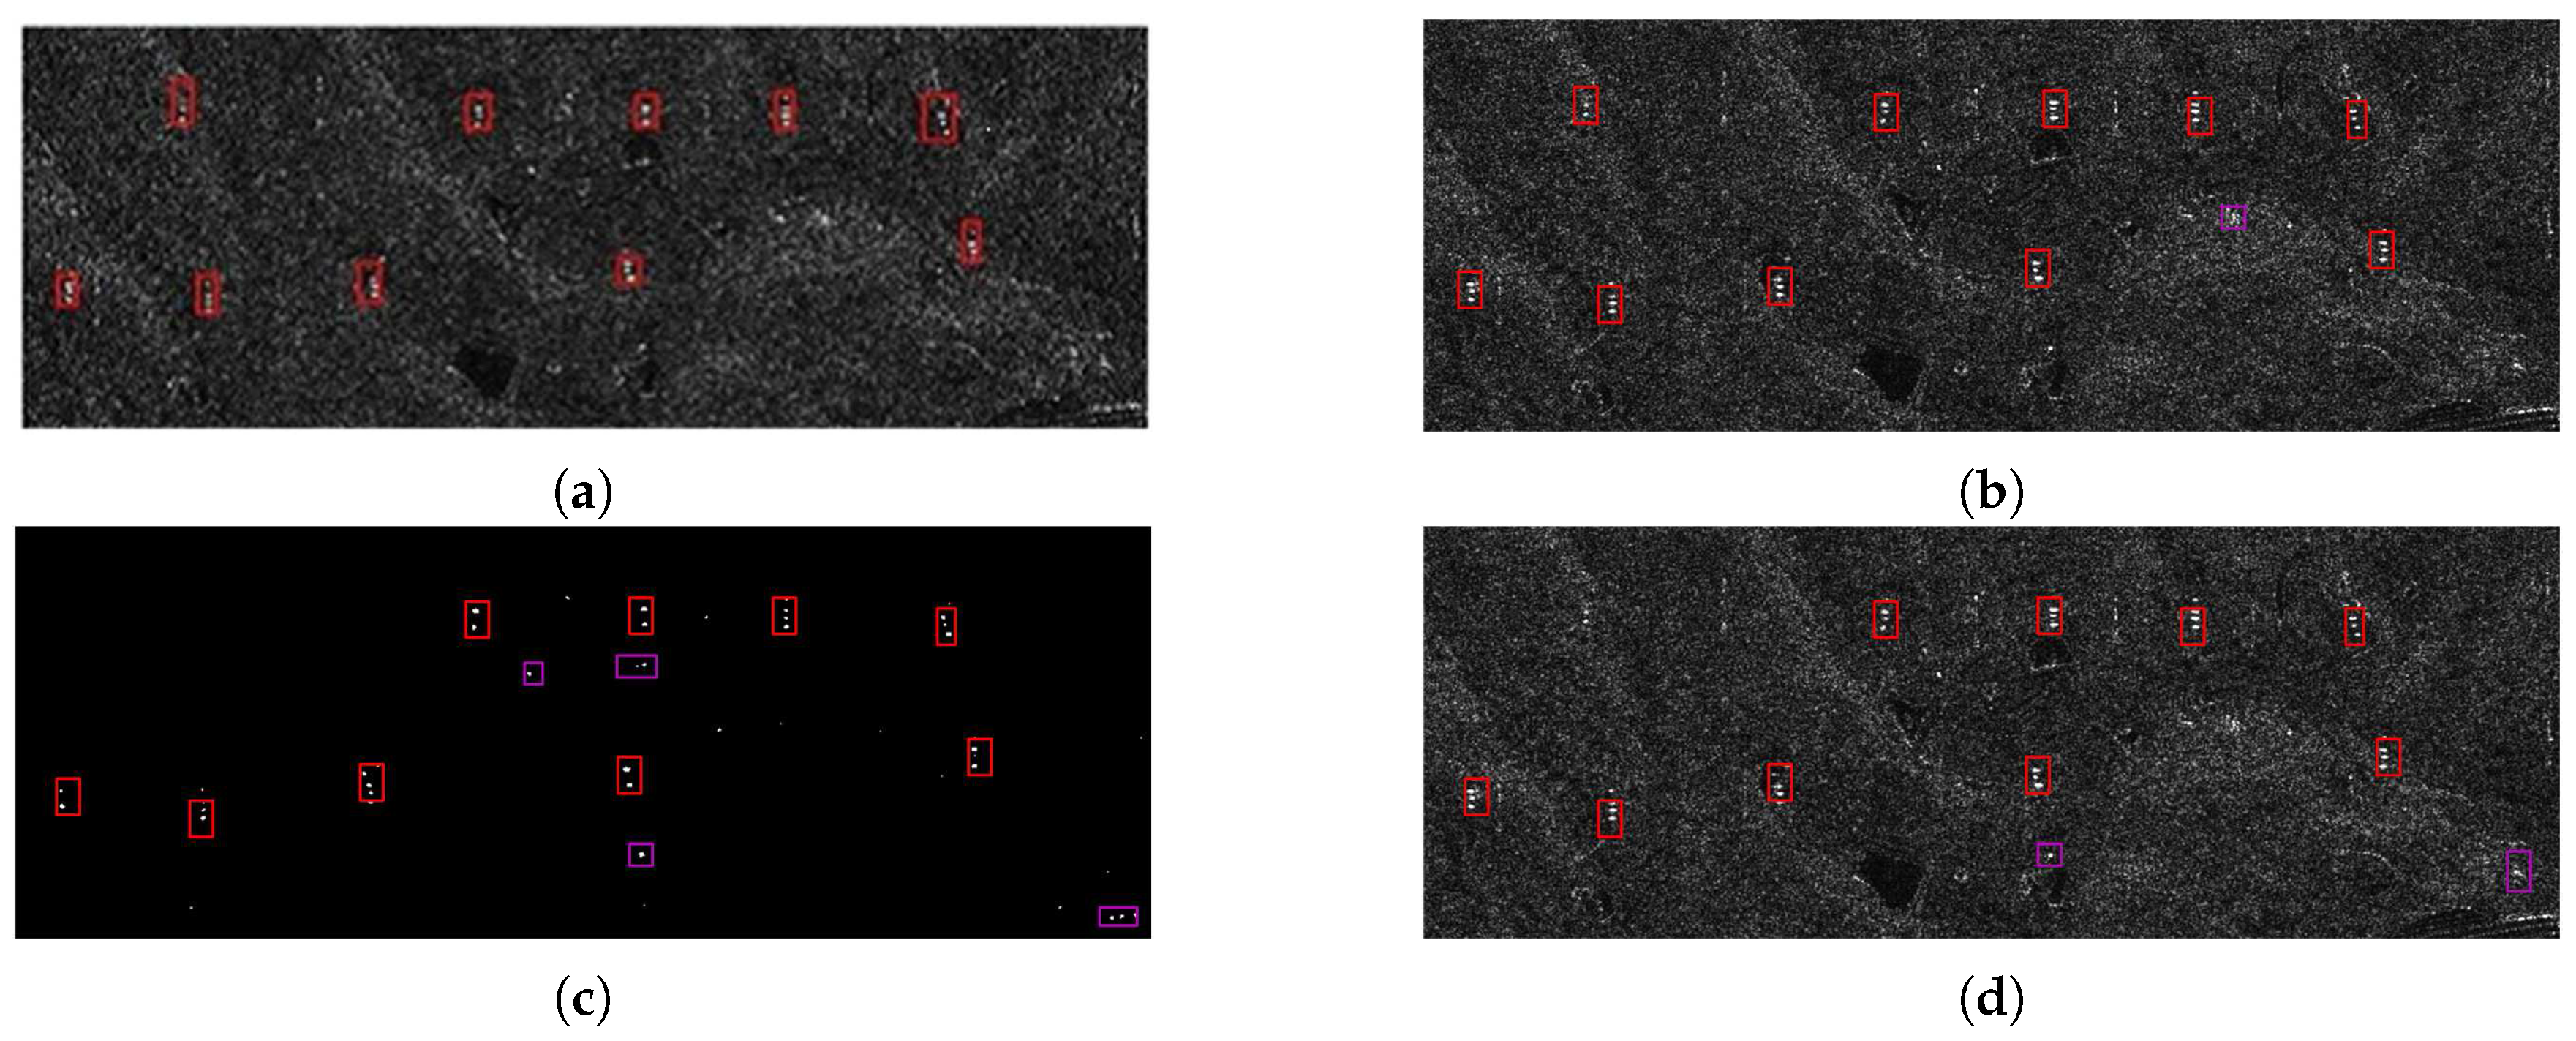
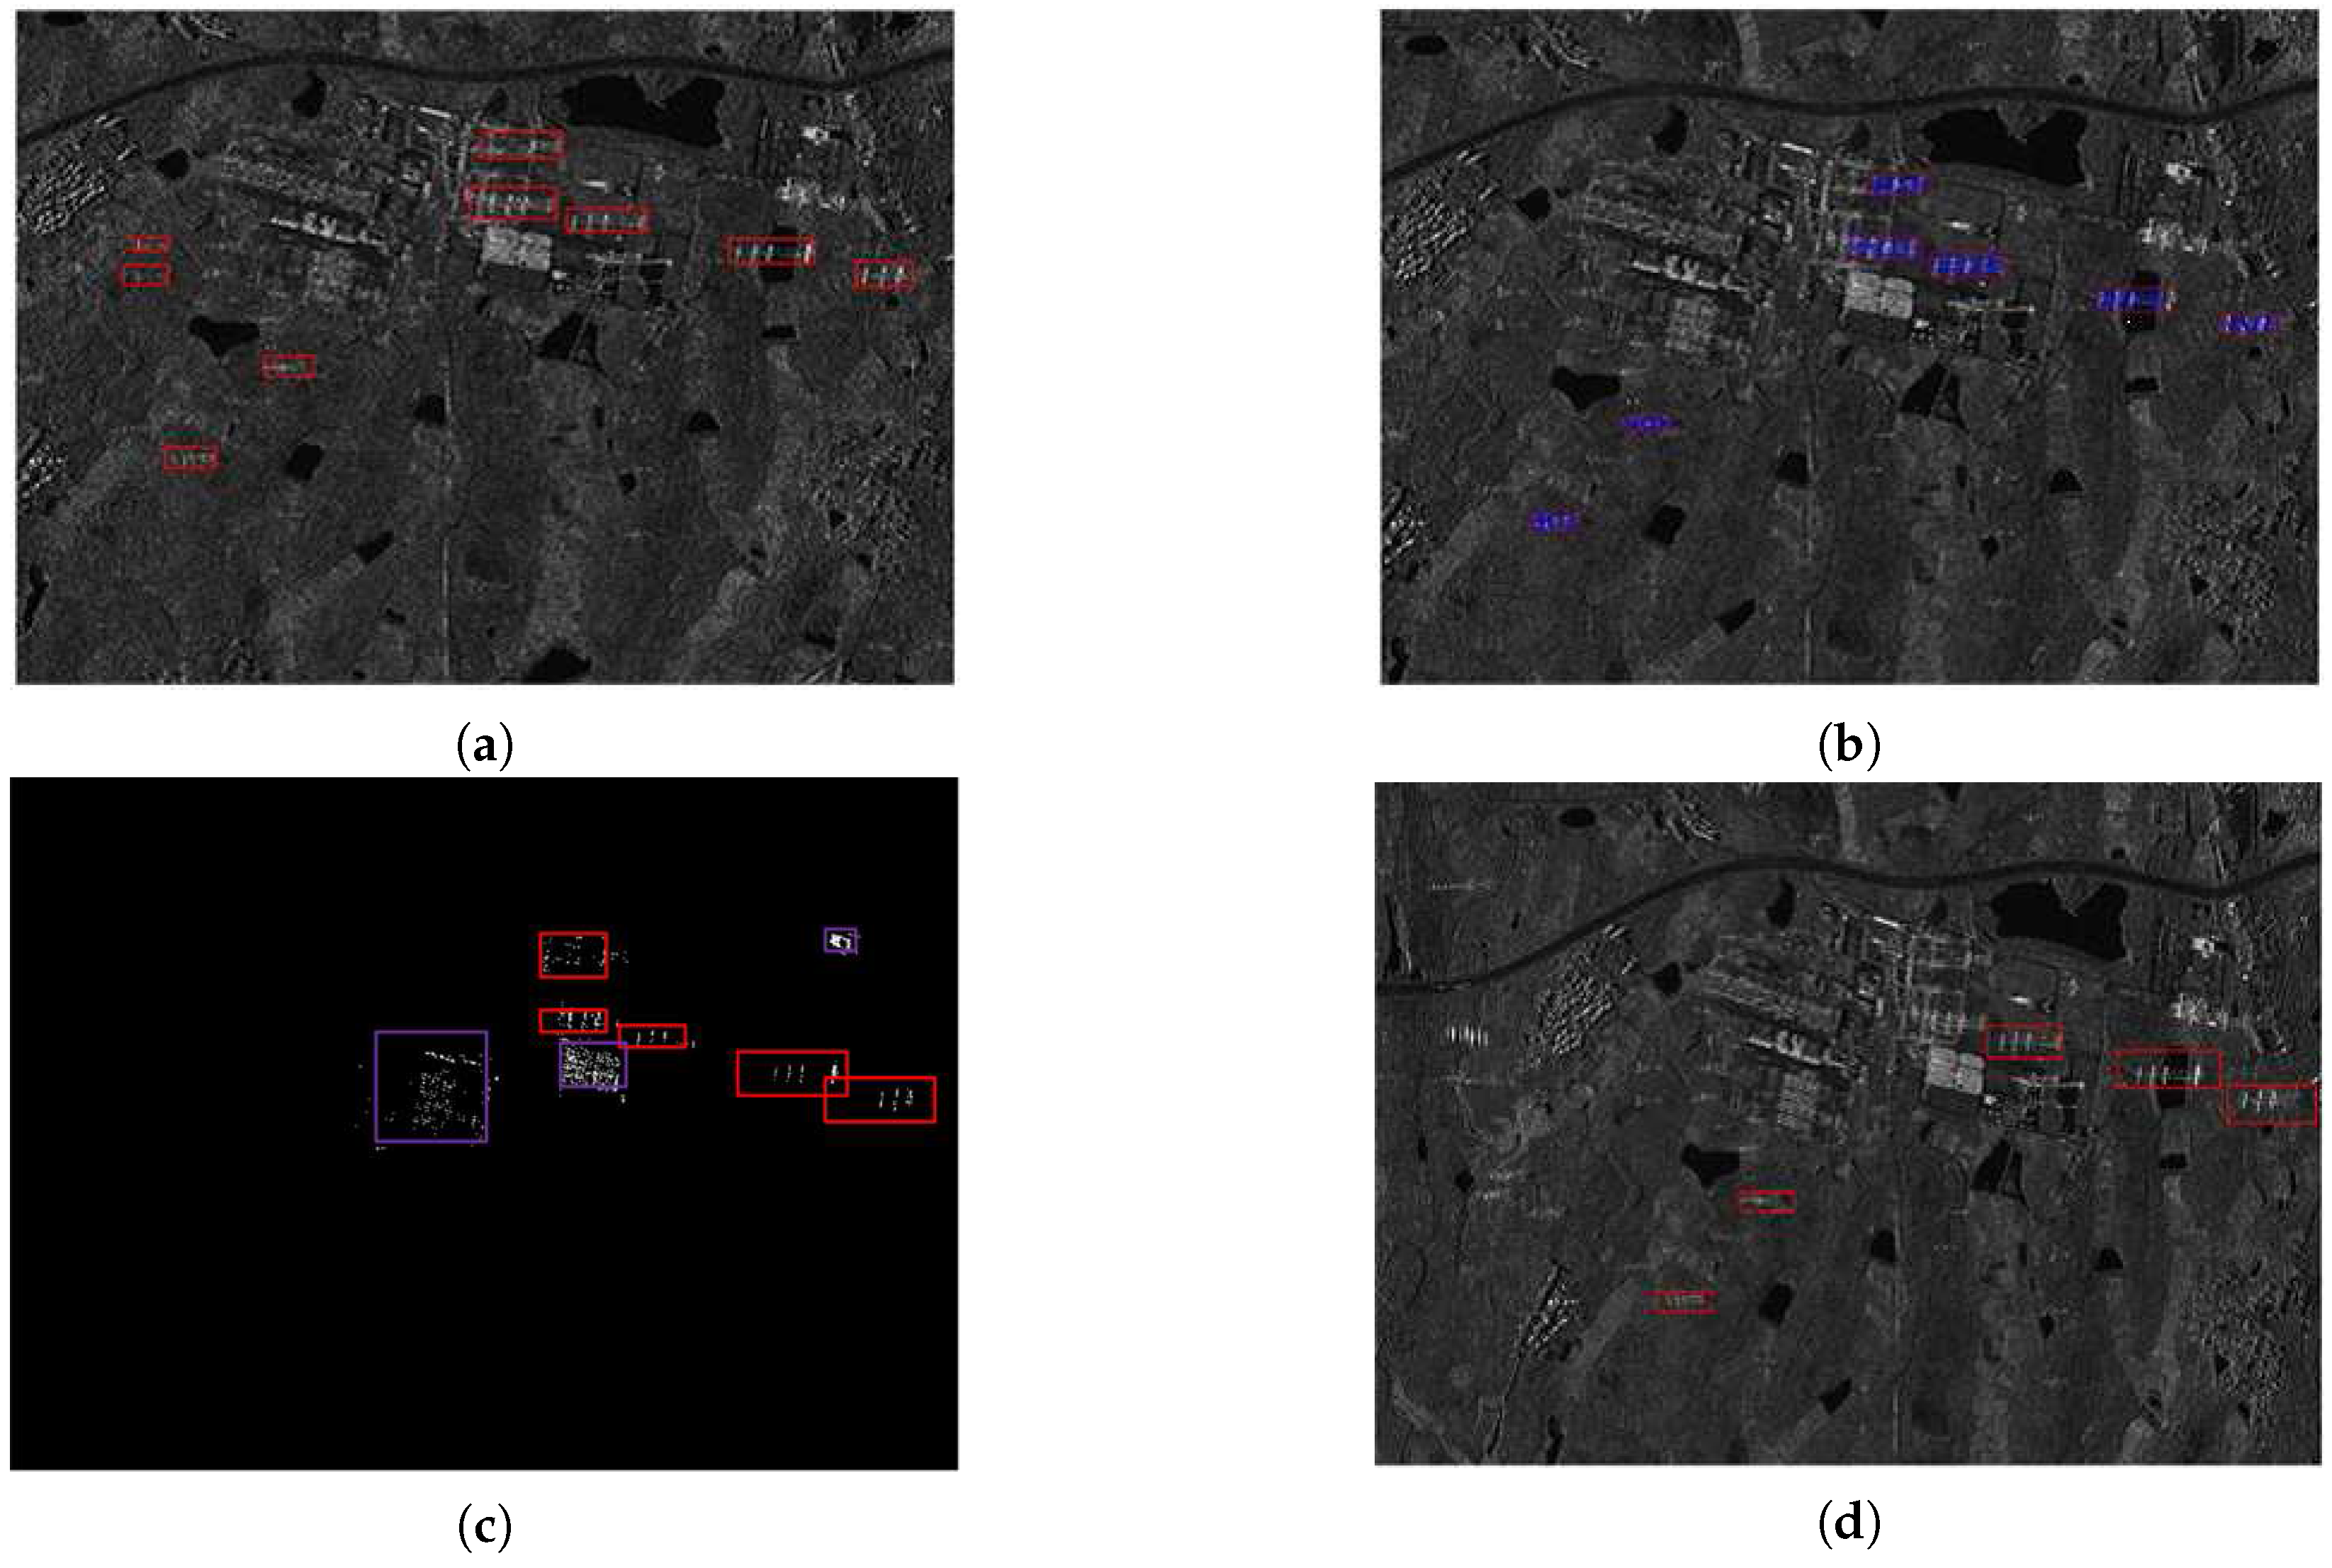
To validate the performance of the MSDMC model for detecting different targets at various spatial resolutions, experiments are also conducted on the electrical power tower data set, which have potential for electrical management systems. With respect to the capability of the proposed algorithm, the MSDMC model is compared with some classic methods, including the global scattering center model and the region-based method. The electrical power tower detection results for the Wuhan and Enshi data sets are presented in Figure 8 and Figure 9, and the accuracies are reported in Table 5 and Table 6, respectively.

A. Performance of the MSDMC Model on the Wuhan Data Set

Figure 8 and Table 5 show the detection performance of three algorithms on the Wuhan data set. In Figure 8a, the nine targets in the sampling image are indicated by red bounding boxes. From Figure 8, we can see that the MSDMC model can detect seven targets with clear bounding boxes. As reported in Table 5, the detection rate is 77.7 % . The results of the scattering center model are shown in Figure 8c, with red bounding boxes representing the correct targets and purple boxes indicating false positives. The detection rate of the global scattering center model is 55.5 % , with a false alarm rate of 28.6 % . The detection results of the region-based method are shown in Figure 8d, with a detection rate of 55.5 % and a zero false alarm rate. Due to the image complexity and shortage of positive samples, the MSDMC model could not detect all the targets in this area but still performs the best, providing the highest detection rate and lowest false alarm rate. The time consumed by the MSDMC model is the longest (503 s), followed by the global scattering center model(424 s), and the region-based method consumes the least amount of time (392 s).

B. Performance of the MSDMC model on the Enshi data set

Figure 9 and Table 6 present the detection results by different methods on the Enshi data set, which show a similar pattern as that of the Wuhan data set. In Figure 9a, there are ten electrical power towers with red bounding boxes from the original SAR image with a spatial resolution of 3 m. All of the electrical power towers are detected by the MSDMC model, but there is a false positive indicated by the purple bounding box in Figure 9b. Nevertheless, the MSDMC model still provides the highest detection rate and lowest false alarm rate. The accuracy indexes of the region-based model are 90 % and 18.2 % . Although the global scattering center model achieves the same detection rate as the region-based model, its false alarm rate is the largest. Therefore, the MSDMC model outperforms the other algorithms.

4.3. Analysis

The accuracies of various target detection methods on different spatial resolution SAR imagery are illustrated in Figure 10. The color bar under zero represents the false alarm rate and the corresponding color bar above zero represents the detection rate.
The airplane-detection results shown in Figure 10 a show that the SDMC model-based methods achieve better performance than the corresponding statistical distribution-based CFAR methods. Meanwhile, the MSDMC method, with the with green color bar, has a detection rate of 100 % and a zero false alarm rate because structure information is considered in the MSDMC model. Figure 10b shows the electrical power tower detection results on the Wuhan (left) and Enshi (right) data sets. As the spatial resolution of the Enshi data set is relatively high, the target structure provides richer information, leading to a higher detection rate than that of the Wuhan data set. Compared with the global scattering model and the region-based method, MSDMC model-based algorithm, with the red color bar, always achieves the best results with the highest detection rate and the lowest false alarm rate. Although the proposed algorithm requires the longest calculation time, its stable performance confirms that it has potential to improve target-detection results.

4.4. Discussion

To achieve better detection performance, we introduce a multiple-component model, in which the spatial relationships among a target and its corresponding sub-components are considered, and utilise the mixture statistical distributions to describe the aircraft object. To further improve the accuracy and to apply the proposed method in practical situations, the following aspects should be considered.
(1)
The method of SAR image denoising plays an important role in performance enhancement since the image quality directly influences the detection results. At present, the compressed sensing-based OMP algorithm is adopted because of its strong anti-inference ability and fast speed. However, our choice is based on the literature, which has shown that the compressed sensing method has relatively good perfformance [43,44]. It would be better to conduct relevant experiments to selet the most suitable denoising algorithm according to the objects to be detected.
(2)
Another question to consider is the type of data used in the experiment. In our work, the SAR images adopted are single polarized. Fully polarimetric SAR data for aircraft detection would clearly provide more information, but it would undoubtedly be more complex. The polarization covariance matrix is used to first analyze the polarization characteristics of the image; then, the main energy and information characteristics are extracted. After filtering and enhancing the image, the proposed framework is employed in the same way to detect the aircraft targets in fully polarimetric SAR images.
(3)
In the proposed MSDMC method, the mixture statistical distributions are utilised for feature extraction. Then, the mixture distribution model is incorporated with the multiple component model to generate the overall MSDMC framework. During the process, there are main two points worth noting:
  • A major limitation is that manual judgment is needed for the structural segmentation of different targets. For example, in view of the aircraft detection, we have divided the target into four parts: the nose, the fuselage, the wing and a tail on the basis of experience and practical results. Actually, it is widely regarded that an airplane always contains four parts, which is consistent with the objective knowledge. In addition, the SAR image size should also be taken into consideration to ensure that the sub-components can obtain enough pixels for extracting features. Therefore, if the presented MSDMC model is applied in detection for other objects, the number of the aircraft’s sub-components will not be suitable anymore. However, determining the number of sub-components in a new target is rather time-consuming.
  • On the other hand, the adopted mixture statistical distributions also deserve much attention. In our work, four distributions including Gamma, Weibull, Rayleigh and Log-Normal have been employed for detecting the airplanes, and the corresponding parameters for each single distribution are calculated through the MoLC based EM approach, specifically catering to the target’s unique characteristics. Once the object to be detected changes, the number and type as well as the corresponding parameters of the single distribution will be quite different, which has indicated the weak adaptability of the MSDMC method.

5. Conclusions

This paper has presented a new MSDMC model for object detection in high spatial resolution SAR images. Taking the structure information into account, a multiple-component model comprising a root filter and several part filters is constructed to describe the spatial relationships of the target at different scales. Due to the speckles in SAR images, an OMP-based CS algorithm is used to reconstruct the image with good quality. To describe the complex statistical characteristics of the target and its corresponding components, a MoLC-based EM approach is exploited to extract the parameters of the mixture statistical distribution model. Then, the mixture statistical distributions are incorporated into the multiple-component model to generate the complete MSDMC framework. In this paper, the proposed algorithm is tested on TerraSAR-X SAR data sets that contain two types of targets, namely, airplanes and electrical power towers. To verify the role of the structure information extracted by the multiple-component model, experiments are conducted to detect the airplanes by means of four different statistical distribution-based CFAR methods and the corresponding SDMC models. The results show that the SDMC model-based methods achieve higher detection rates with no false positives, demonstrating the effectiveness of the structure information. Moreover, the MSDMC model achieves the best results for both visual inspection and accuracy, confirming the advantage of mixture statistical distributions for SAR object detection. In addition, the MSDMC model and two comparative methods, namely, the global scattering center model and the region-based method, are implemented to detect electrical power towers. The proposed MSDMC method achieves the best results with the highest detection rate and the lowest false alarm rate. Further work will focus on building a data set of buildings in complicated terrain. Then, a more robust model will be constructed to detect dense buildings in complex SAR images.

Acknowledgments

This work was partially supported by the National Natural Science Foundation of China (No. 41371342, No. 61331016), and by the National Key Research and Development Program of China (No. 2016YFC0803003-01).

Author Contributions

Chu He and Mingxia Tu conceived and designed the experiments; Xinlong Liu performed the experiments and analyzed the results; Chu He and Mingxia Tu wrote the paper; Dehui Xiong and Mingsheng Liao revised the paper.

Conflicts of Interest

The authors declare no conflict of interest.

References

  1. Qin, X.; Zhou, S.; Zou, H.; Gao, G. CFAR Detection Algorithm for Generalized Gamma Distributed Background in High-Resolution SAR Images. IEEE Geosci. Remote Sens. Lett. 2013, 10, 806–810. [Google Scholar]
  2. Jung, C.H.; Kwag, Y.K. Efficient parameter estimation based SAR-CFAR detection algorithm for non-homogeneous clutter environment. In Proceedings of the IET Internatinal Conference on Radar Systems, Glasgow, UK, 22–25 October 2012; pp. 1–4. [Google Scholar]
  3. Wang, C.; Liao, M.; Li, X. Ship Detection in SAR Image Based on the Alpha-stable Distribution. Sensors 2008, 8, 4948–4960. [Google Scholar] [CrossRef] [PubMed]
  4. Oliver, C.; Quegan, S. Understanding Synthetic Aperture Radar Images; Artech House: Boston, MA, USA, 2013; pp. 277–299. [Google Scholar]
  5. Ramsey, E., III; Rangoonwala, A.; Suzuoki, Y.; Jones, C.E. Oil Detection in a Coastal Marsh with Polarimetric Synthetic Aperture Radar (SAR). Remote Sens. 2011, 12, 2630–2662. [Google Scholar] [CrossRef] [Green Version]
  6. Lin, I.I.; Kwoh, L.K.; Lin, Y.C. Ship and ship wake detection in the ERS SAR imagery using computer-based algorithm. In Proceedings of the IEEE International Geoscience and Remote Sensing Symposium, Singapore, 3–8 August 1997; pp. 17–21. [Google Scholar]
  7. Kaplan, L.M. Improved SAR Target Detection via Extended Fractal Features. IEEE Trans. AES 2011, 37, 436–450. [Google Scholar] [CrossRef]
  8. Tello, M. A Novel Algorithm for ship Detection in SAR Imagery Based on The Wavelet Transform. IEEE Geosci. Remote Sens. Lett. 2005, 2, 201–205. [Google Scholar] [CrossRef]
  9. Wang, C.L.; Zhong, X.; Zhou, P.; Zhang, X. Man-Made Target Detection in SAR Imagery. In Proceedings of the IEEE International Geoscience and Remote Sensing Symposium, Seoul, Korea, 25–29 July 2005; pp. 1721–1724. [Google Scholar]
  10. Jao, J.K.; Lee, C.E.; Ayasli, S. Coherent Spatial Filtering for SAR Detection of Stationary Targets. IEEE Trans. AES 2000, 35, 378–384. [Google Scholar]
  11. Tan, Y.; Li, Q.; Li, Y.; Tian, J. Aircraft Detection in High-Resolution SAR Images Based on a Gradient Textural Saliency Map. Sensors 2015, 15, 23071–23094. [Google Scholar] [CrossRef] [PubMed]
  12. Wang, Y.; Liu, H. A Hierarchical Ship Detection Scheme for High-Resolution SAR Images. IEEE Trans. Geosci. Remote Sens. 2012, 50, 4173–4184. [Google Scholar] [CrossRef]
  13. Huang, X.; Yang, W.; Zhang, H.; Xia, G. Automatic Ship Detection in SAR Images Using Multi-Scale Heterogeneities and an A Contrario Decision. Remote Sens. 2015, 6, 7695–7711. [Google Scholar] [CrossRef]
  14. Cheng, G.; Han, J.; Zhou, P.; Li, K. Multi-class geospatial object detection and geographic image classification based on collection of part detectors. ISPRS J. Photogramm. Remote Sens. 2014, 98, 119–132. [Google Scholar] [CrossRef]
  15. Cheng, G.; Han, J.; Guo, L.; Liu, Z.; Bu, S.; Ren, J. Effective and efficient midlevel visual elements-oriented land-use classification using VHR remote sensing images. IEEE Trans. Geosci. Remote Sens. 2015, 53, 4238–4249. [Google Scholar] [CrossRef]
  16. Cheng, G.; Han, J.; Guo, L.; Qian, X.; Zhou, P.; Yao, X.; Hu, X. Object detection in remote sensing imagery using a discriminatively trained mixture model. ISPRS J. Photogramm. Remote Sens. 2013, 85, 32–43. [Google Scholar] [CrossRef]
  17. Zhou, J.; Shi, Z.; Cheng, X. Automatic Target Recognition of SAR Images Based on Global Scattering Center Model. IEEE Trans. Geosci. Remote Sens. 2011, 49, 3713–3729. [Google Scholar]
  18. Felzenswalb, P.F.; Grishick, R.B.; McAllister, D.; Remanan, D. Object Detection With Discriminatively Trained Part-based Models. IEEE PAMI 2010, 32, 1627–1645. [Google Scholar] [CrossRef] [PubMed]
  19. Dollar, P.; Wojek, C.; Schiele, B.; Perona, P. Pedestrian Detection: An Evaluation of the state of the Art. IEEE PAMI 2012, 34, 743–761. [Google Scholar] [CrossRef] [PubMed]
  20. Viola, P.A.; Jones, M.J.; Snow, D. Detecting Pedestrians Using Patterns of Motion and Appearance. Int. J. Comput. Vis. 2005, 63, 153–161. [Google Scholar] [CrossRef]
  21. Tison, C.; Nicolas, J.M.; Tupin, F.; Maitre, H. A New Statistical Model for Markovian Classification of Urban Areas in High-resolution SAR Images. IEEE Trans. Geosci. Remote Sens. 2004, 42, 2046–2057. [Google Scholar] [CrossRef]
  22. Tsaig, Y.; Donoho, D.L. Extensions of Compressed Sensing. Signal Process. 2006, 86, 549–571. [Google Scholar] [CrossRef]
  23. Huang, L.; Lu, Y.L. Radar Imaging with Compressed Sensing for Detecting Moving Targets Behind Walls. In Proceedings of the IET Internatinal Conference on Radar Systems, Glasgow, UK, 22–25 October 2012; pp. 1–5. [Google Scholar]
  24. Li, H.; Hong, W.; Wu, Y.; Fan, Z. On the Empirical-Statistical Modeling of SAR Images With Generalized Gamma Distribution. IEEE J. Sel. Top. Signal Process. 2011, 5, 386–397. [Google Scholar]
  25. Krylov, V.A.; Moser, G.; Serpico, S.B.; Zerubia, J. On the Method of Logarithmic Cumulants for Parametric Probability Density Function Estimation. IEEE Trans. Image Process. 2013, 10, 3791–3806. [Google Scholar] [CrossRef] [PubMed]
  26. Friedman, J.; Hastie, T.; Tibshirani, R. The Elements of Statistical Learning; Springer Series in Statistics; Springer: Berlin, Germany, 2001. [Google Scholar]
  27. Bishop, C.M. Pattern Recognition and Machine Learning; Springer: Berlin, Germany, 2006. [Google Scholar]
  28. James, G.; Witten, D.; Hastie, T.; Tibshirani, R. An Introduction to Statistical Learning; Springer: New York, NY, USA, 2013. [Google Scholar]
  29. Chang, C.; Lin, C. LIBSVM: A library for support vector machines. ACM Trans. Intell. Syst. Technol. 2011, 2, 27. [Google Scholar] [CrossRef]
  30. Donoho, D.L.; Tsaig, Y.; Drori, I.; Starck, J.L. Sparse Solution of Underdetermined Systems of Linear Equations by Stagewise Orthogonal Matching Pursuit. IEEE Trans. Inf. Theory 2012, 52, 1049–1121. [Google Scholar] [CrossRef]
  31. Candes, E.C.; Romberg, J. Quantitative Robust Uncertainty Principles and Optimally Sparse Decompositions. Found. Comput. Math. 2006, 6, 227–254. [Google Scholar] [CrossRef]
  32. Han, J.; Zhang, D.; Cheng, G.; Guo, L.; Ren, J. Object detection in optical remote sensing images based on weakly supervised learning and high-level feature learning. IEEE Trans. Geosci. Remote Sens. 2015, 53, 3325–3337. [Google Scholar] [CrossRef]
  33. Cheng, G.; Han, J. A survey on object detection in optical remote sensing images. ISPRS J. Photogramm. Remote Sens. 2016, 117, 11–28. [Google Scholar] [CrossRef]
  34. Han, J.; Zhou, P.; Zhang, D.; Cheng, G.; Guo, L.; Liu, Z.; Bu, S.; Wu, J. Efficient, simultaneous detection of multi-class geospatial targets based on visual saliency modeling and discriminative learning of sparse coding. ISPRS J. Photogramm. Remote Sens. 2014, 89, 37–48. [Google Scholar] [CrossRef]
  35. Oliver, C.J. A Model for Non-Rayleigh Scattering Statistics. Opt. Acta Int. J. Opt. 1984, 31, 701–722. [Google Scholar] [CrossRef]
  36. Schleher, D. Radar Detection in Weibull Clutter. IEEE Trans. Aerosp. Electron. Syst. 1976, 6, 736–743. [Google Scholar] [CrossRef]
  37. Goodman, J. Statistical Properties of Laser Speckle Patterns. In Laser Speckle and Related Phenomena; Springer: Berlin/Heidelberg, Germany, 1975; pp. 9–75. [Google Scholar]
  38. Jakeman, E.; Pusey, P. A Model for Non-Rayleigh Sea Echo. IEEE Trans. Antennas Propag. 1976, 24, 806–814. [Google Scholar] [CrossRef]
  39. Hu, G.; Gao, S.; Zhong, Y.; Gu, C. Asymptotic Properties of Random Weighted Empirical Distribution Function. Commun. Stat. Theory Methods 2015, 44, 18–20. [Google Scholar] [CrossRef]
  40. Kayabol, K.; Krylov, V.A.; Zerubia, J. Unsupervised classification of SAR images using hierarchical agglomeration and EM. In Proceedings of the 2011 International Conference on Computational Intelligence for Multimedia Understanding, Pisa, Italy, 13–15 December 2011; pp. 54–65. [Google Scholar]
  41. DeVore, M.D.; O’Sullivan, J.A. Quantitative Statistical Assessment of Conditional Models for Synthetic Aperture Radar. IEEE Trans. Image Process. 2004, 13, 113–125. [Google Scholar] [CrossRef] [PubMed]
  42. Nar, F.; Demirkesen, C.; Okman, O.; Çetin, M. A region based target detection method for SAR images. In Proceedings of the IEEE 19th Signal Processing and Communications Applications Conference (SIU), Antalya, Turkey, 20–22 April 2011; pp. 809–812. [Google Scholar]
  43. Zhou, R.F.; Wang, G. An algorithm for speckle noise removal based on compressed sensing. Radio Commun. Technol. 2017, 43, 25–30. [Google Scholar]
  44. He, J.F.; Li, F.; Zhang, J.M.; Wu, H.L. Using double sparse image denoising algorithms. Small Micro Comput. Syst. 2015, 36, 1109–1112. [Google Scholar]
Figure 1. Statistical distribution model of an SAR image.
Ijgi 06 00336 g001
Figure 2. Framework of the mixture statistical distribution-based multiple-component model (MSDMC).
Ijgi 06 00336 g002
Figure 3. Davis–Monthan data set. (a) an overview of Davis–Monthan data set; (b) three sampling areas in Davis–Monthan.
Ijgi 06 00336 g003
Figure 4. Illustration of the samples in the three experimental data sets.
Ijgi 06 00336 g004
Figure 5. Target detection results of the CFAR and SDMC model based on four different statistical distributions. (a) original image; (b) Gamma distribution; (c) Rayleigh distribution; (d) Log-Normal distribution; (e) Weibull distribution; (f) ground truth; (g) Gamma SDMC model; (h) Rayleigh SDMC model; (i) Log-Normal SDMC model; and (j) Weibull SDMC model.
Ijgi 06 00336 g005
Figure 6. Character curves of the performance of the different statistical distributions at different false alarm rate thresholds. (a) completeness; and (b) correctness.
Ijgi 06 00336 g006
Figure 7. Target detection results for different algorithms with the Davis–Monthan AFB data set for detecting airplanes. (a) original image; (b) Gamma distribution-based CFAR; (c) Rayleigh distribution-based CFAR; (d) Log-Normal distribution-based CFAR; (e) Weibull distribution-based CFAR; (f) Gamma SDMC model; (h) Rayleigh SDMC model; (h) Log-Normal SDMC model; (i) Weibull SDMC model; and (j) MSDMC model.
Ijgi 06 00336 g007
Figure 8. Target detection results using different algorithms. (a) original image; (b) MSDMC model; (c) global scattering center model; and (d) region-based model.
Ijgi 06 00336 g008
Figure 9. Target-detection results using different algorithms. (a) original image; (b) MSDMC model; (c) global scattering center model; and (d) region-based model.
Ijgi 06 00336 g009
Figure 10. Accuracies for different targets on different spatial resolution SAR imagery. (a) airplane as the target; and (b) electrical power tower as the target.
Ijgi 06 00336 g010
Table 1. Parameter estimation for the statistical distribution model.
Single Distribution ModelPDFCurveMethod of Logarithmic Cumulants
Rayleigh f ( x ) = x σ 2 e x 2 2 σ 2 Ijgi 06 00336 i001 k 1 = ( l n 2 + ψ ( 1 ) ) / 2 + l n σ
Gamma f ( x ) = 1 Γ ( L ) ( L μ ) L x L 1 e L x μ Ijgi 06 00336 i002 k 1 = ψ ( L ) l n L + l n μ
k 2 = ψ ( 1 , L )
Log-Normal f ( x ) = 1 σ 2 π e ( ln x μ ) 2 2 σ 2 Ijgi 06 00336 i003 k 1 = μ
k 2 = σ 2
Weibull f ( x ) = c b ( x b ) c 1 e ( x b ) c Ijgi 06 00336 i004 k 1 = l n b r c
k 2 = π 2 6 c 2
Table 2. List of TerraSAR-X SAR imagery used for target detection.
Scene ID RegionScene Center Latitude LongitudePixel Spacing MeterPolarization ModeScene Center PixelTarget Type
Davis–Monthan 32 09 58 N, 110 51 18 W2HH 6248 × 11296 Airplane
Wuhan 30 23 50 N, 114 27 13 E1VV 1909 × 2561 Power Tower
Enshi 31 08 08 N, 112 23 00 E3HH 890 × 323 Power Tower
Table 3. The training and testing samples in three experimental data sets.
Data SetDavis–MonthanWuhanEnshi
Total positive training samples301010
Total negative training samples2005050
Total positive testing samples501620
Sample size 200 × 200 200 × 200 40 × 40
Table 4. Accuracies of target-detection results in the Davis–Monthan data set using different methods.
MethodDetected Target NumberDetection Rate / % False alarm NumberFalse alarm Rate / % Calculation Time / %
Gamma-based CFAR969.20048
Rayleigh-based CFAR861.522039
Log-Normal-based CFAR753.8222.251
Weibull-based CFAR861.5111.150
Gamma SDMC1292.30087
Rayleigh SDMC969.20075
Log-Normal SDMC969.20092
Weibull SDMC1184.60097
MSDMC1310000108
Table 5. Target-detection results on the Wuhan data set using different methods.
MethodDetected Target NumberDetection Rate / % False Alarm NumberFalse Alarm Rate / % Calculation Time / %
MSDMC777.700503
Global Scattering Center Model555.5228.6424
Region-Based Method555.500392
Table 6. Target-detection results on the Enshi data set using different methods.
MethodDetected Target NumberDetection Rate / % False Alarm NumberFalse Alarm Rate / % Calculation Time / %
MSDMC1010019.188
Global Scattering Center Model990430.884
Region-Based Method990218.277

