Exploring Spatiotemporal Patterns of Long-Distance Taxi Rides in Shanghai


1
College of Surveying and Geo-infomatics, Tongji University, Shanghai 200092, China
2
School of Remote Sensing and Information Engineering, Wuhan University, Wuhan 430079, China
3
Shanghai Baosight Software Co., Ltd., Shanghai 201900, China
*
Author to whom correspondence should be addressed.
ISPRS Int. J. Geo-Inf. 2017, 6(11), 339; https://doi.org/10.3390/ijgi6110339
Submission received: 31 August 2017
/
Revised: 2 October 2017
/
Accepted: 26 October 2017
/
Published: 3 November 2017
Abstract
:Floating Car Data (FCD) has been analyzed for various purposes in past years. However, limited research about the behaviors of taking long-distance taxi rides has been made available. In this paper, we used data from over 12,000 taxis during a six-month period in Shanghai to analyze the spatiotemporal patterns of long-distance taxi trips. We investigated these spatiotemporal patterns by comparing them with metro usage in Shanghai, in order to determine the extent and how the suburban trains divert the passenger flow from taxis. The results identified 12 pick-up and six drop-off hotspots in Shanghai. Overall, the pick-up locations were relatively more concentrated than the drop-off locations. Temporal patterns were also revealed. Passengers on long-distance taxi rides were observed to avoid the rush hours on the street as their first priority and tried to avoid the inconvenience of interchanges on the metro lines as their second priority.
1. Introduction
In an increasing number of cities, taxis are equipped with mobile devices for recording positions and for the provision of services. The collected data are normally regarded as one kind of floating car data (FCD). FCD data has been used for a diverse range of purposes. The majority of existing research has focused on transportation management, including the estimation of actual traffic situations [1,2], for transportation planning [3], and for the quantitative classification of road segments based on traffic flows [4,5,6].
Despite this, many studies have been devoted to optimizing the behaviors of using taxis in urban areas. Veloso et al. [7] attempted to explore the relationships between the origins and destinations of taxi trips and predict taxi demand. Yuan et al. [8] presented a recommendation system for both taxi drivers and people wanting to take a taxi, using the knowledge of passenger mobility patterns and taxi driver picking-up and dropping-off behaviors, learned from the GPS trajectories of taxicabs. In a similar study, Li et al. [9] tried to determine the best strategies for taxi drivers to pick up passengers at a given time and location, based on the FCD data analysis, with 5500 taxis in Hangzhou, China. Zhan et al. [10] estimated urban link travel times by using FCD in Manhattan for the purpose of time-dependent route planning. Ebendt et al. [11] suggested reducing the fleet travel times by measuring real-time travel using FCD in Berlin. Powell et al. [12] generated spatiotemporal profitability maps to help taxi drivers reduce cruising time.
As a type of movement data, FCD has been used for mining and understanding human mobility in urban areas. Zheng and Zhou [13] systematically investigated spatial trajectories from a wide spectrum of perspectives and disciplines, including spatial databases, mobile computing, and data mining. In human geography, Liu et al. [2] and Yuan et al. [8] examined large amounts of FCD and mobile phone data, respectively, to understand human mobility patterns. In visual analytics, the interactive visualization of movement data, on local scales focusing on individual trajectories [14, 15], and on large scales emphasizing aggregated data [16,17], have been comprehensively studied to extract significant traffic mobility patterns. Shen et al. [18] analyzed nearly 6000 taxis over two weeks in order to uncover the pattern of people movement in Nanjing.
Some research has been conducted to improve the profit of taxi drivers. Liu et al. [4] categorized drivers into top driver or ordinary driver, based on their average daily income, and conducted a spatiotemporal analysis of their operation behavior and skill, as measured by income, based on the operation zone. Chang et al. [19] and Li et al. [20] developed algorithms to predict taxi demand hotspots, in order to help taxi drivers efficiently find clients. In [21], the difference in driving behaviors between low- and high-earning taxi drivers were analyzed. They distinguished top and bottom drivers and not only by examining their cruising traces but by considering their stationary spots.
In this paper, we analyzed FCD data in Shanghai from a different point view compared to the existing approaches. Shanghai is the largest Chinese city by population and area. At the country level, Shanghai is a major hub for China’s expressway network. Many national expressways, prefixed with a G, pass through or terminate in Shanghai, such as G2, G42, G15, and G60. A ring expressway also exists within the city. Numerous municipal expressways are prefixed with S, including S1, S2, S4, S7, and S20. In the city center, several elevated expressways were built to lessen traffic pressure on surface streets, such as the inner ring, middle ring, and north-south elevator road. Furthermore, there are a number of arterial roads and numerous normal roads that pass through residential areas. Overall, the city is densely structured with a complicated road network. At the same time, the underground metro system in Shanghai is one of the most developed in China, and it is considered a main transportation method by increasing numbers of people. In this paper, we investigated long-distance taxi trips in Shanghai and their correlation with the suburban train lines, in order to determine to what extent and how the suburban trains could divert the passenger flow from taxis.
The remainder of this paper are structured as follows. Section 2 describes the method used to extract the long-distance trajectories from original taxi positioning data and introduces the main features of long distance taxi trips in Shanghai. Section 3 provides the research methods and the spatiotemporal patterns of long distance taxi rides in Shanghai by identifying the hotspots of long distance taxi ride origins and destinations. We found the differences in departure times and distance distribution for workdays and non-workdays, and analyzed the interrelations among the hotspots. Finally, the main conclusions are derived and summarized in the last section.
2. Data Extraction of Long Distance Taxi Rides
In this section, the general description of selected FCD data, and the charging modes in Shanghai are introduced. Then, the definition and extraction method of long distance taxi rides from the original FCD data are described.
2.1. General FCD Data Description
The research data used were provided by a transportation company which includes about 12,000 taxis and covered the period from March to August of 2015. According to the statistics by the Shanghai Commission of Transportation, the total number of taxis in 2015 was about 50,000. Therefore, the data samples used in this paper included about 24% of the total number of taxis in Shanghai.
A GPS receiver, a taxi status recorder, and a communication module were installed in every taxi in Shanghai. The GPS receiver generates the current location of the taxi. The taxi status recorder records the current status of the taxi, such as velocity, direction, and the presence of passengers. These two kinds of data are generated every 15 s. After that, all data fields are transferred to the data center via the wireless communication module. In theory, 5760 records are generated each day. However, the actual number of records are less than 5760 because the GPS receiver and the taxi status recorder do not work when the power to the taxi is off. The recorded data contains 10 fields: vehicle index, day, time, company name, position, vehicle velocity, direction, positioning flag, vehicle status, and a reserved field.
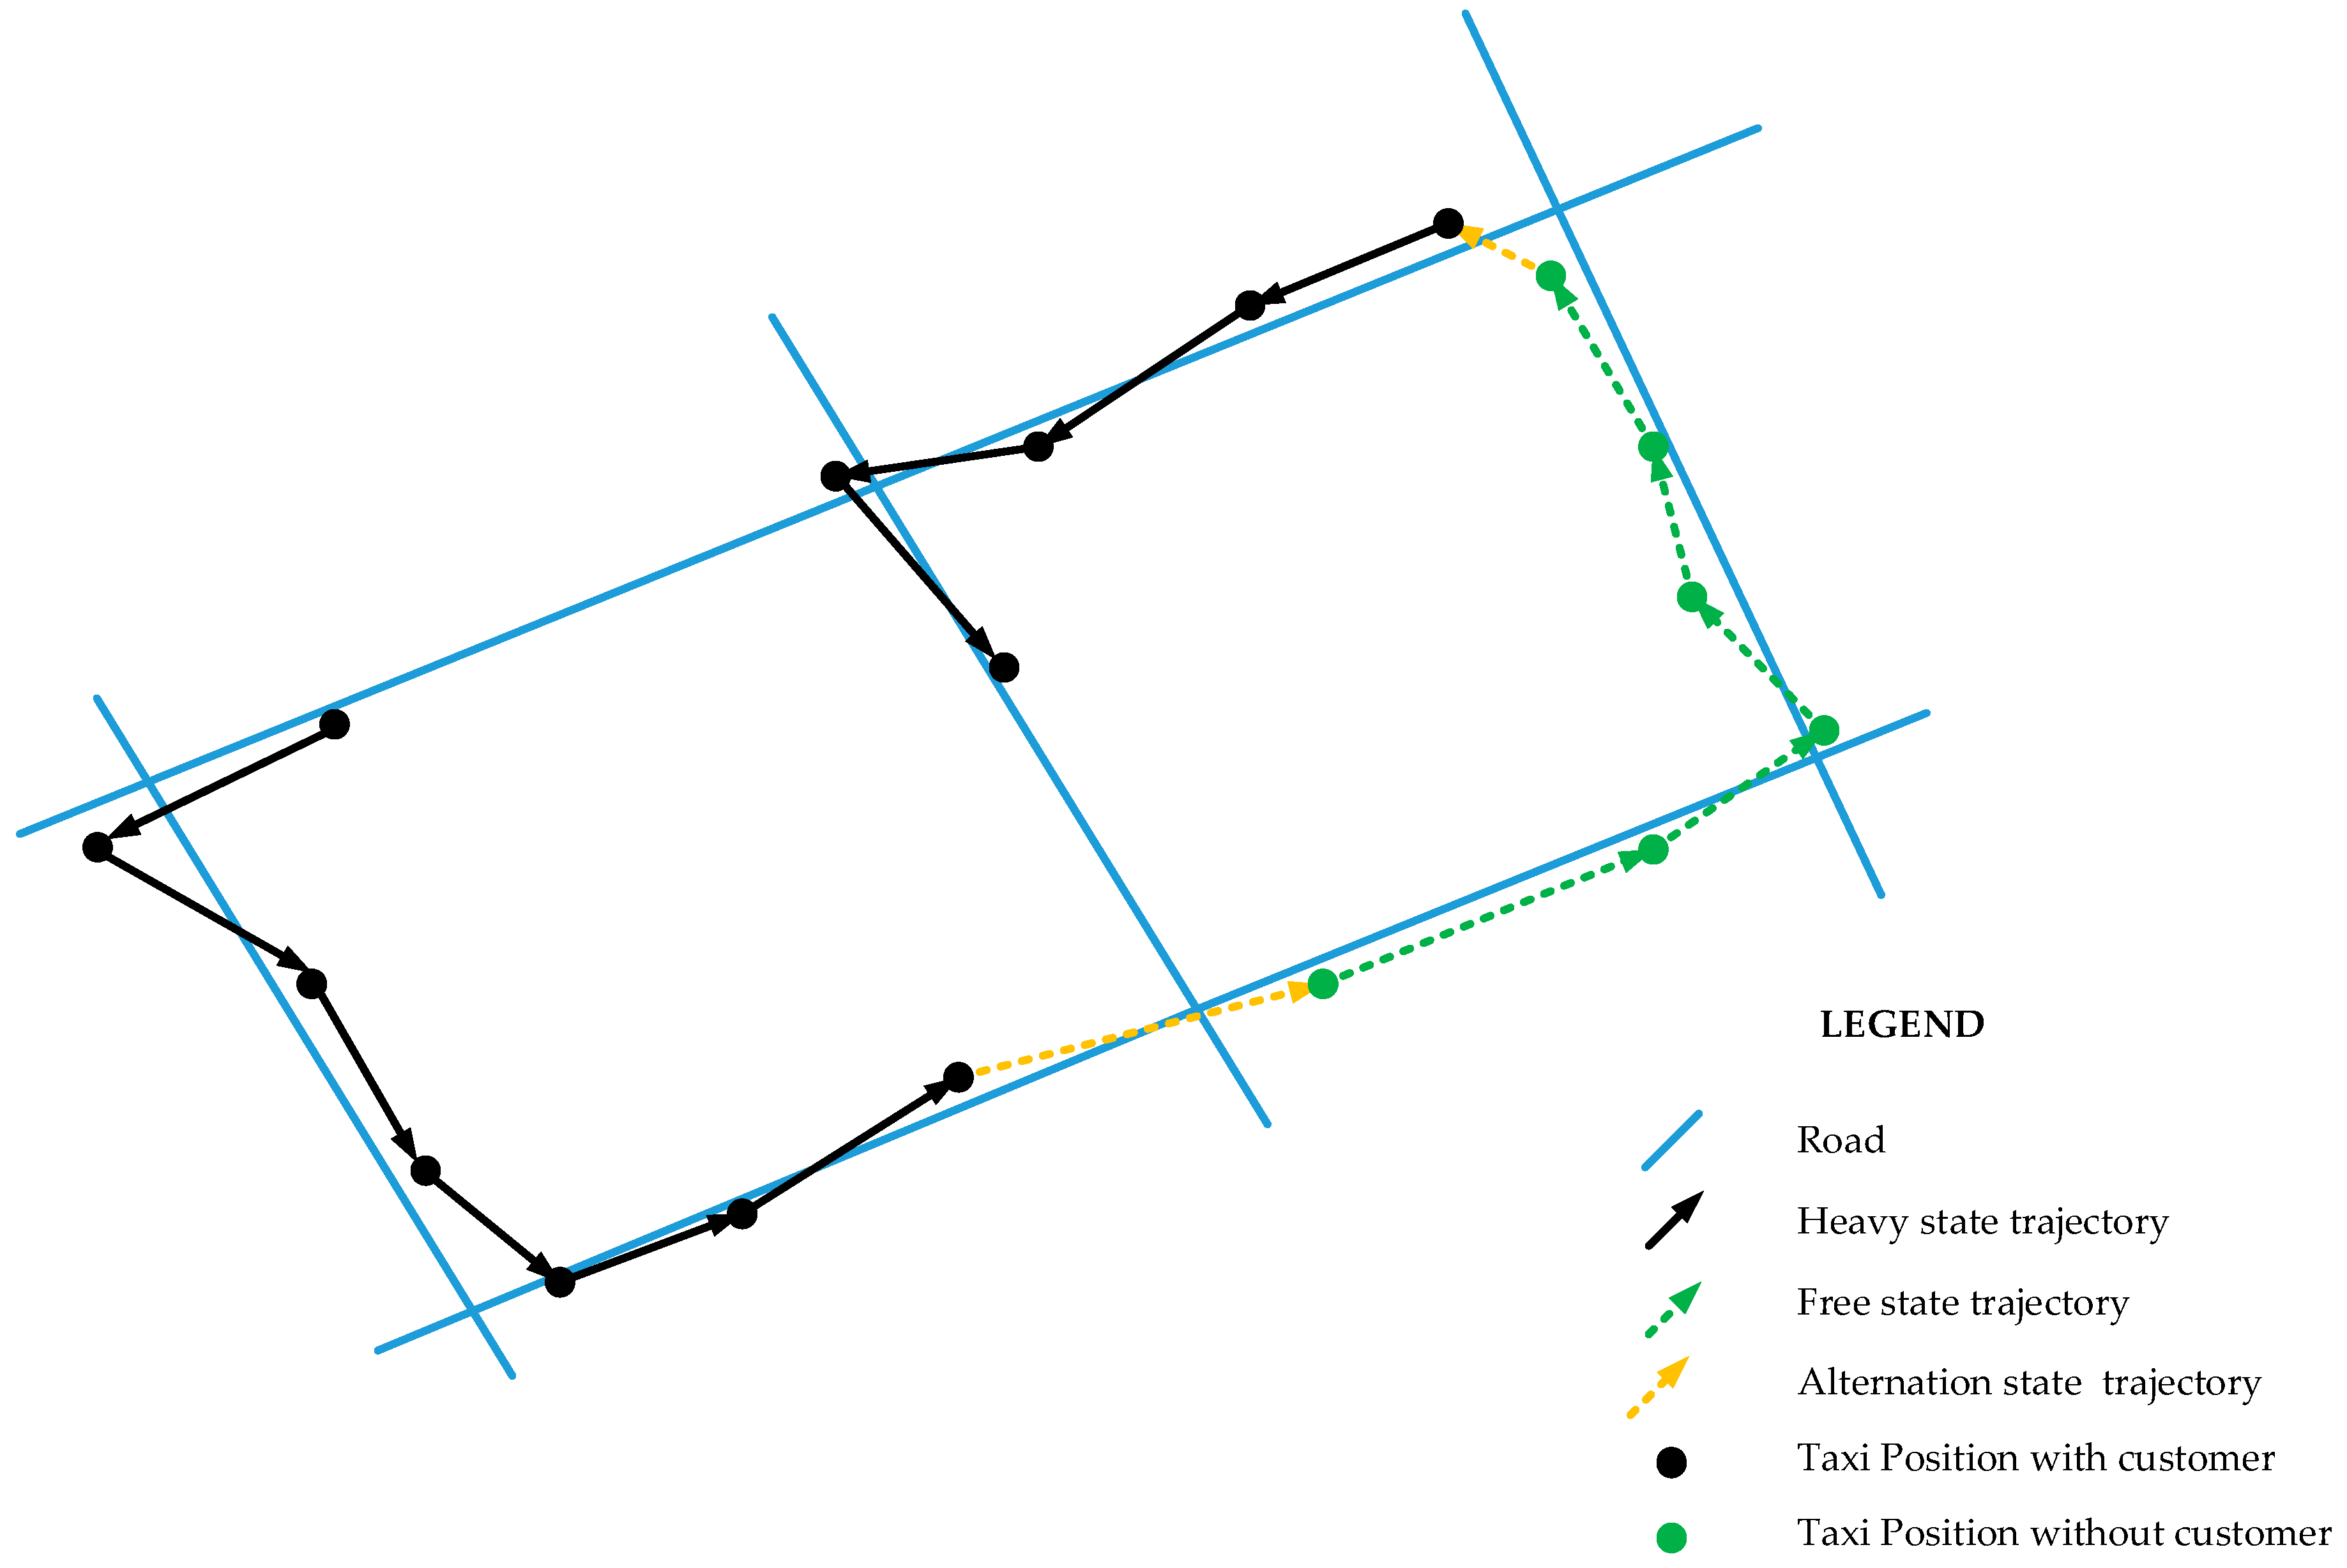
The vehicle status field records if customers are in the taxi. When customers are in the taxi, the taxi state is termed as being in a heavy state, as shown by the black dots and lines in Figure 1. Otherwise, the taxi state is considered as being in a free state, as shown by the green dots and lines in Figure 1. The alternation state is the transition period from the free state to the heavy state, or the heavy state to the free state, shown by the yellow lines in Figure 1. For consistency, trajectories in the heavy state were extracted and analyzed. Other trajectories were not used in this study.
2.2. Definition of Long-Distance Taxi Rides in Shanghai
The Shanghai taxi fee charging modes are divided into four parts: the starting fare (Sf), short distance fare (SDf), long distance fare (LDf), and the waiting fare (Wf):
According to the current charging rules, each part is associated with the distance traveled and the travel time. Table 1 depicts how the taxi fare is altered according to the time when customers get into and out of the taxi.
In the daytime (5:00 a.m.–11:00 p.m.), the starting fare (Sf) is 14 RMB (Chinese Yuan: Renminbi) within 3.0 km. If the total distance of the taxi trip is less than 15 km, the LDf is not applied, and the short distance fee is (D−3) × 2.5, where 2.5 RMB is the unit price per kilometer. If the total distance (D) of the taxi trip is over 15 km, the customer pays both the SDf and LDf. Moreover, the unit price also increases from 2.5 RMB/km to 3.6 RMB/km. In the nighttime (11:00 p.m.–5:00 a.m.), the Sf is 17 RMB and the unit price is 3.6 RMB/km and 4.7 RMB/km for the short distance and long distance parts, respectively.
According to Table 1, for both daytime and nighttime trips, 15 km is the threshold for the separation of short- and long-distance taxi rides. Once the total distance of a taxi ride is over 15 km, the LDf portion will be generated with a higher unit price. Therefore, in this paper, the threshold used to separate the long-distance taxi trip from the entire trip is 15 km.
2.3. General Information on Long Distance Taxi Rides in Shanghai
In this subsection, we used the travel mileage and the travel times to describe the general features of long distance taxi rides in Shanghai.
We first summarized the total mileage and the duration of taxi rides of the case data after removing the free state and alternation state taxi trajectories. Then, the heavy state trajectories set were divided into either short-distance trajectories or long-distance trajectories, and the values and percentages of mileage and travel times are listed in Table 2.
From Table 2, long distance taxi rides account for about a quarter of heavy trajectories, which is obviously less than short distance taxi rides. However, the mileage for long distance taxi rides (58.35%) is greater than for short distance taxi rides (41.65%), which means that long distance taxi travel involves more road resources. The average distance traveled for long distance taxi rides is 20.5 km, which is higher than for short distance taxi rides (4.7 km).
3. Spatiotemporal Patterns of Long-Distance Taxi Rides in Shanghai
The spatiotemporal patterns in this study include the pick-up and drop-off hotspots, the travel distance distribution, as well as their changes over time.
3.1. Spatial Patterns of Long-Distance Taxi Rides
The Shanghai taxi spatial patterns were analyzed according to the spatial distribution of the pick-up and drop-off locations. The flowchart for the pick-up and drop-off hotspots identification are quite similar as shown in Figure 2. Details will be introduced in Section 3.1.1 and Section 3.1.2.
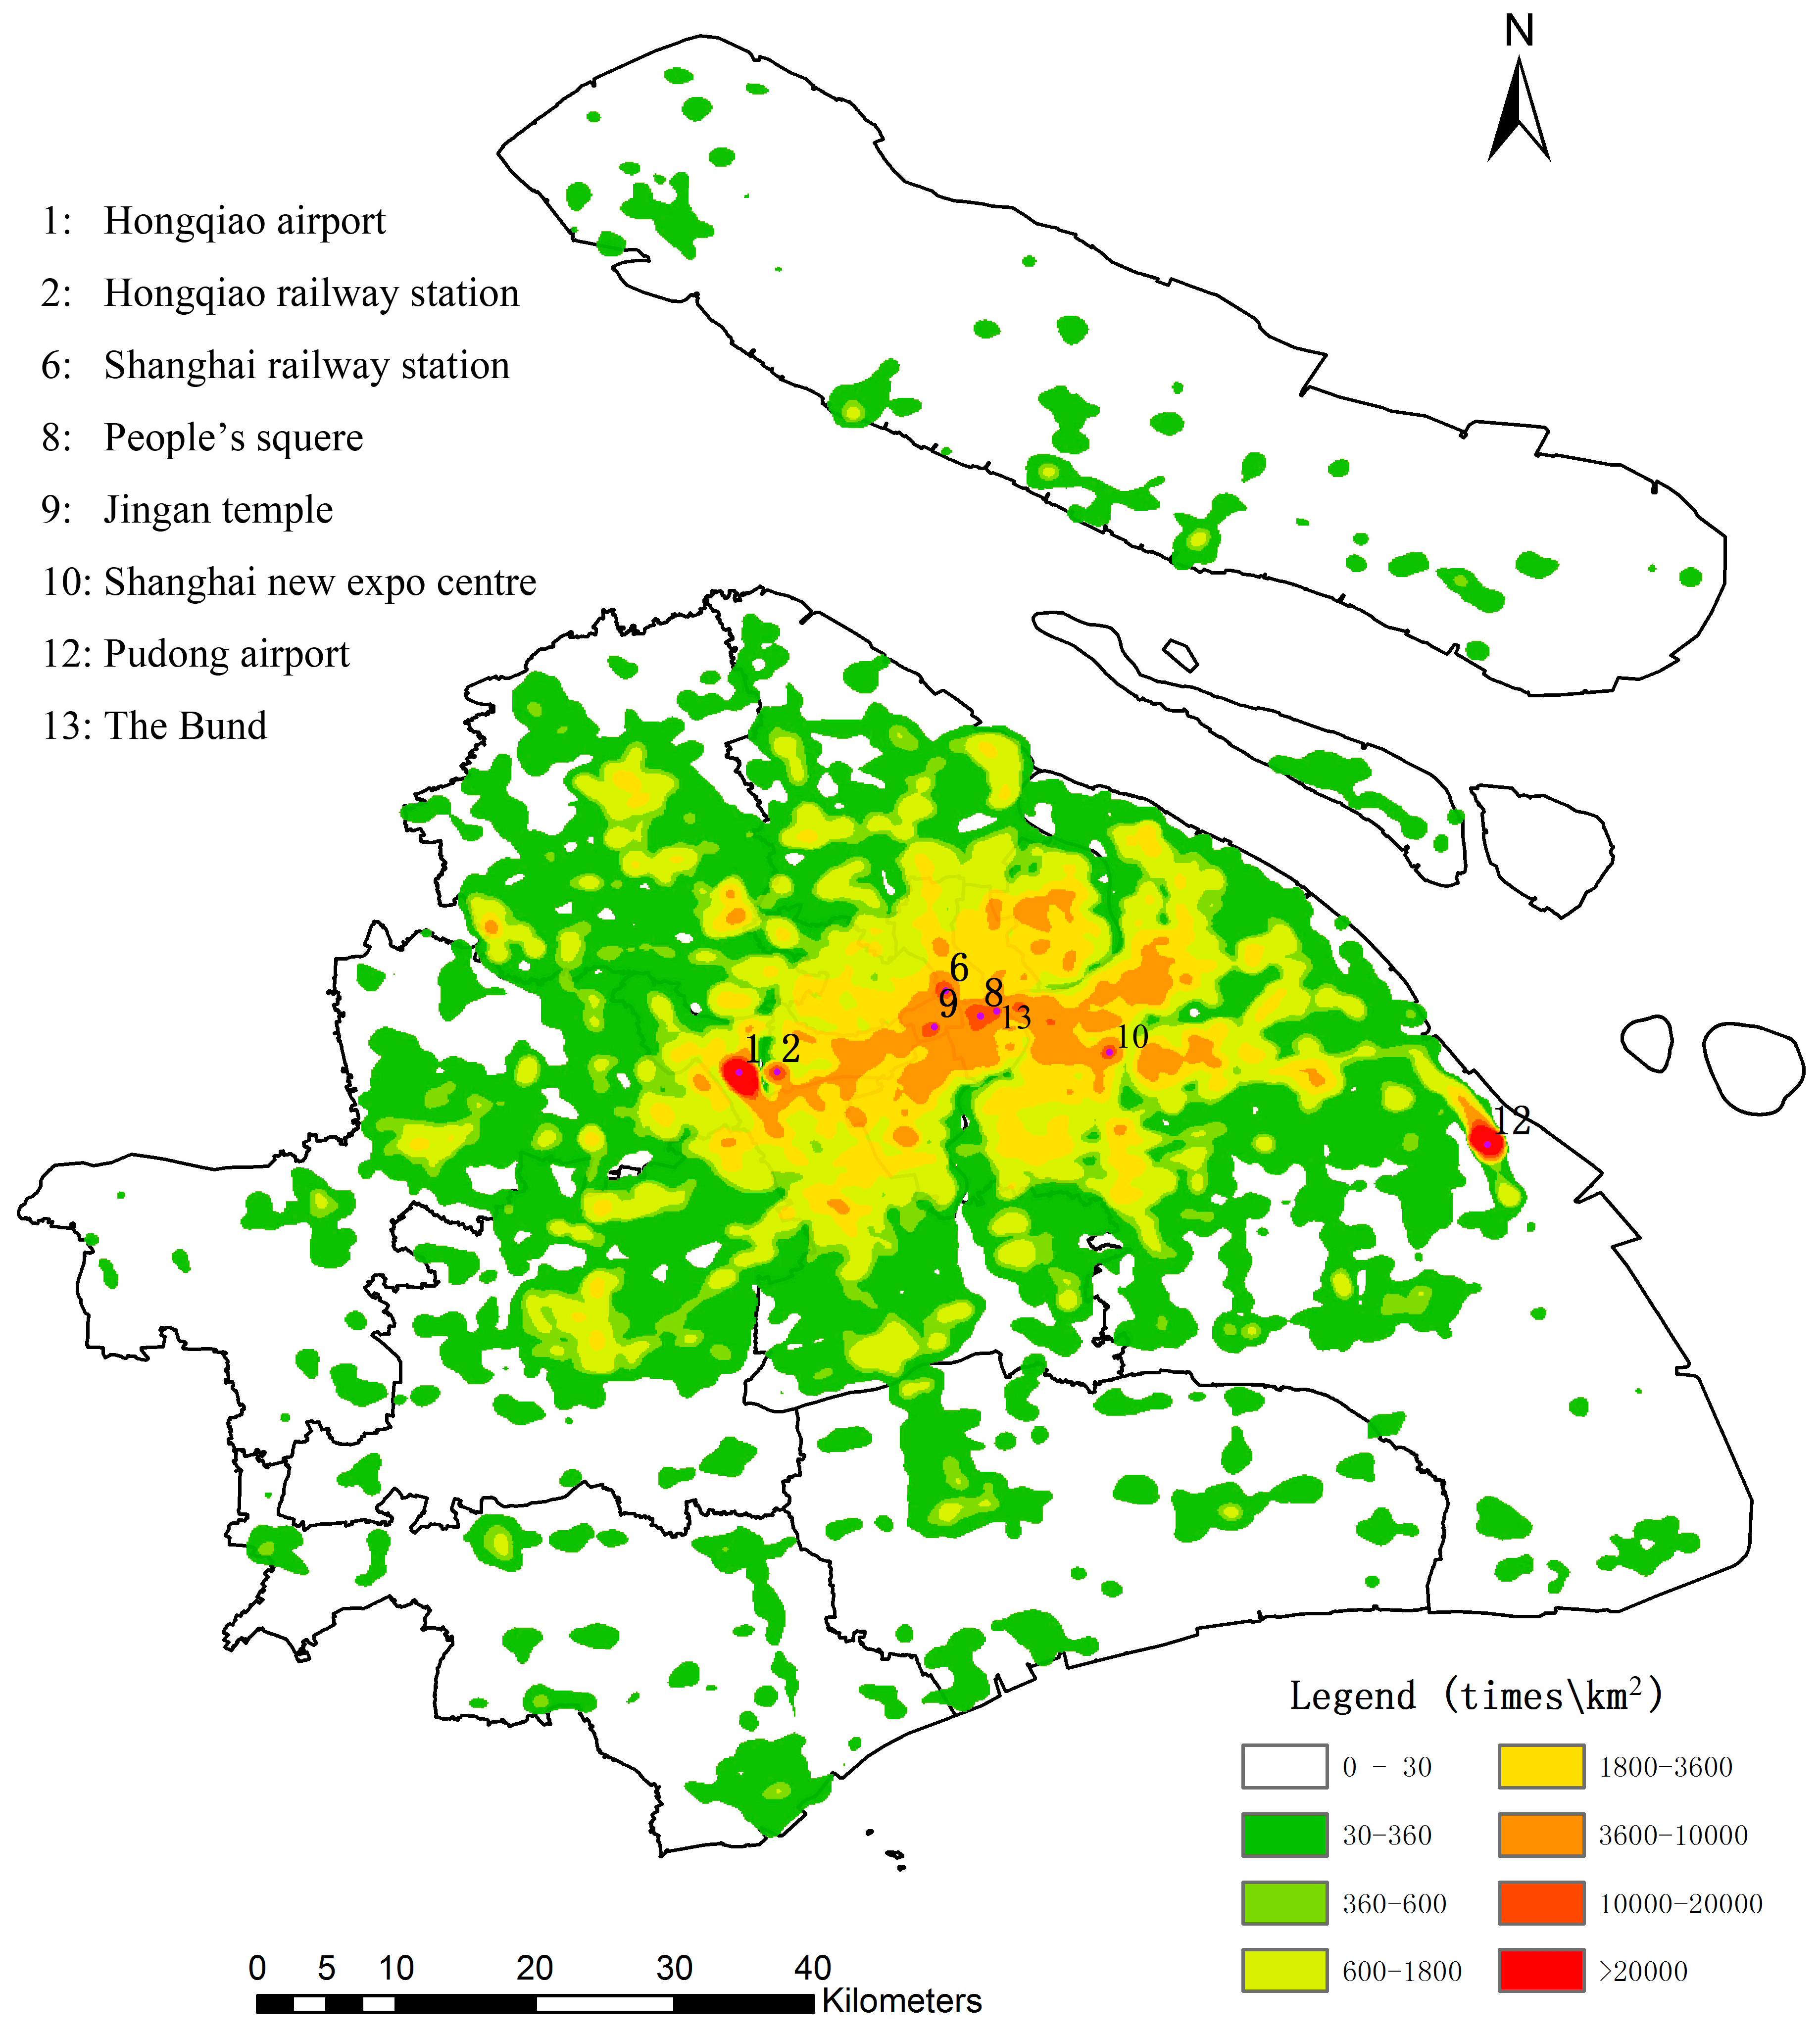
3.1.1. Identifying Pick-Up Hotspots for Long-Distance Taxi Rides
The starting location of each long-distance taxi ride, with a trajectory length greater than 15 km, was selected to obtain the pick-up hotspots in Shanghai. First, the starting location of each selected trajectory was extracted from the entire trajectory. An overlay processing was then performed to the starting point and the boundary of Shanghai to identify the locations which are outside of Shanghai. These points mean the taxi drivers pick up customers outside of Shanghai. After removal of these points, over 3.06 million pick-up locations in Shanghai were selected.
A density analysis was then performed on the extracted starting points with a search radius of 100.0 m using a kernel density algorithm integrated in ArcGIS 10.2. According to the land use information around the densest areas, 14 hotspots with the density higher than 10,000 times/km2 were manually identified. The density map and the hotspots’ names are listed in Figure 3. The different colors indicate the different densities of the pick-up points in Shanghai. The number and the text at the top left of Figure 3 list the hotspot name and identification number.
3.1.2. Identifying Long-Distance Taxi Ride Drop-Off Hotspots
Similar to the processing procedures described in the previous subsection, after the trips over 15 km were separated from the entire trip, the terminal point of each trip was extracted. The terminal points which were located out of Shanghai were then removed via an overlay analysis with the Shanghai boundary. After that, a density analysis algorithm integrated by ArcGIS was applied to the extracted terminal points. According to the land use information around the densest areas, the 8 hotspots were extracted. The density map and the identified hotspots, with a density higher than 10,000 times/km2, are shown in Figure 4. The different colors indicate the different densities of the drop-off points in Shanghai. The number and the text at the top left of Figure 4 indicate the hotspot name and number. The hotspot numbers in this figure are the same as in Figure 3.
Comparing Figure 3 and Figure 4, the pick-up locations are more concentrated than the drop off locations. Whether the starting point or end point, the city center is a poplar area for long distance taxi rides. All eight of the drop-off hotspots are also pick-up hotspots, indicating that those hotspots are more concentrated for long distance taxi rides.
In Shanghai, the Hongqiao railway station and the Hongqiao airport are located in the same area. Therefore, we combined these two hotspots and used “Hongqiao hub” for further analysis.
In order to compare spatiotemporal features for the same type of hotspots, we categorized the seven hotspots into three groups: transportation hotspot, exhibition hotspot, and tourism hotspot. The transportation hotspot includes Pudong airport, the Hongqiao hub, and the Shanghai railway station. The main reason people visit these hotspots is to take airplanes or trains. The Shanghai new expo center is the only long-distance hotspot in this study. People usually visit the Shanghai new expo center for joining an exhibition. The last type of hotspot is tourism, including People’s square, Jingan temple, and The Bund, which are the three of the most famous sightseeing spots in downtown Shanghai. The details are shown in Table 3.
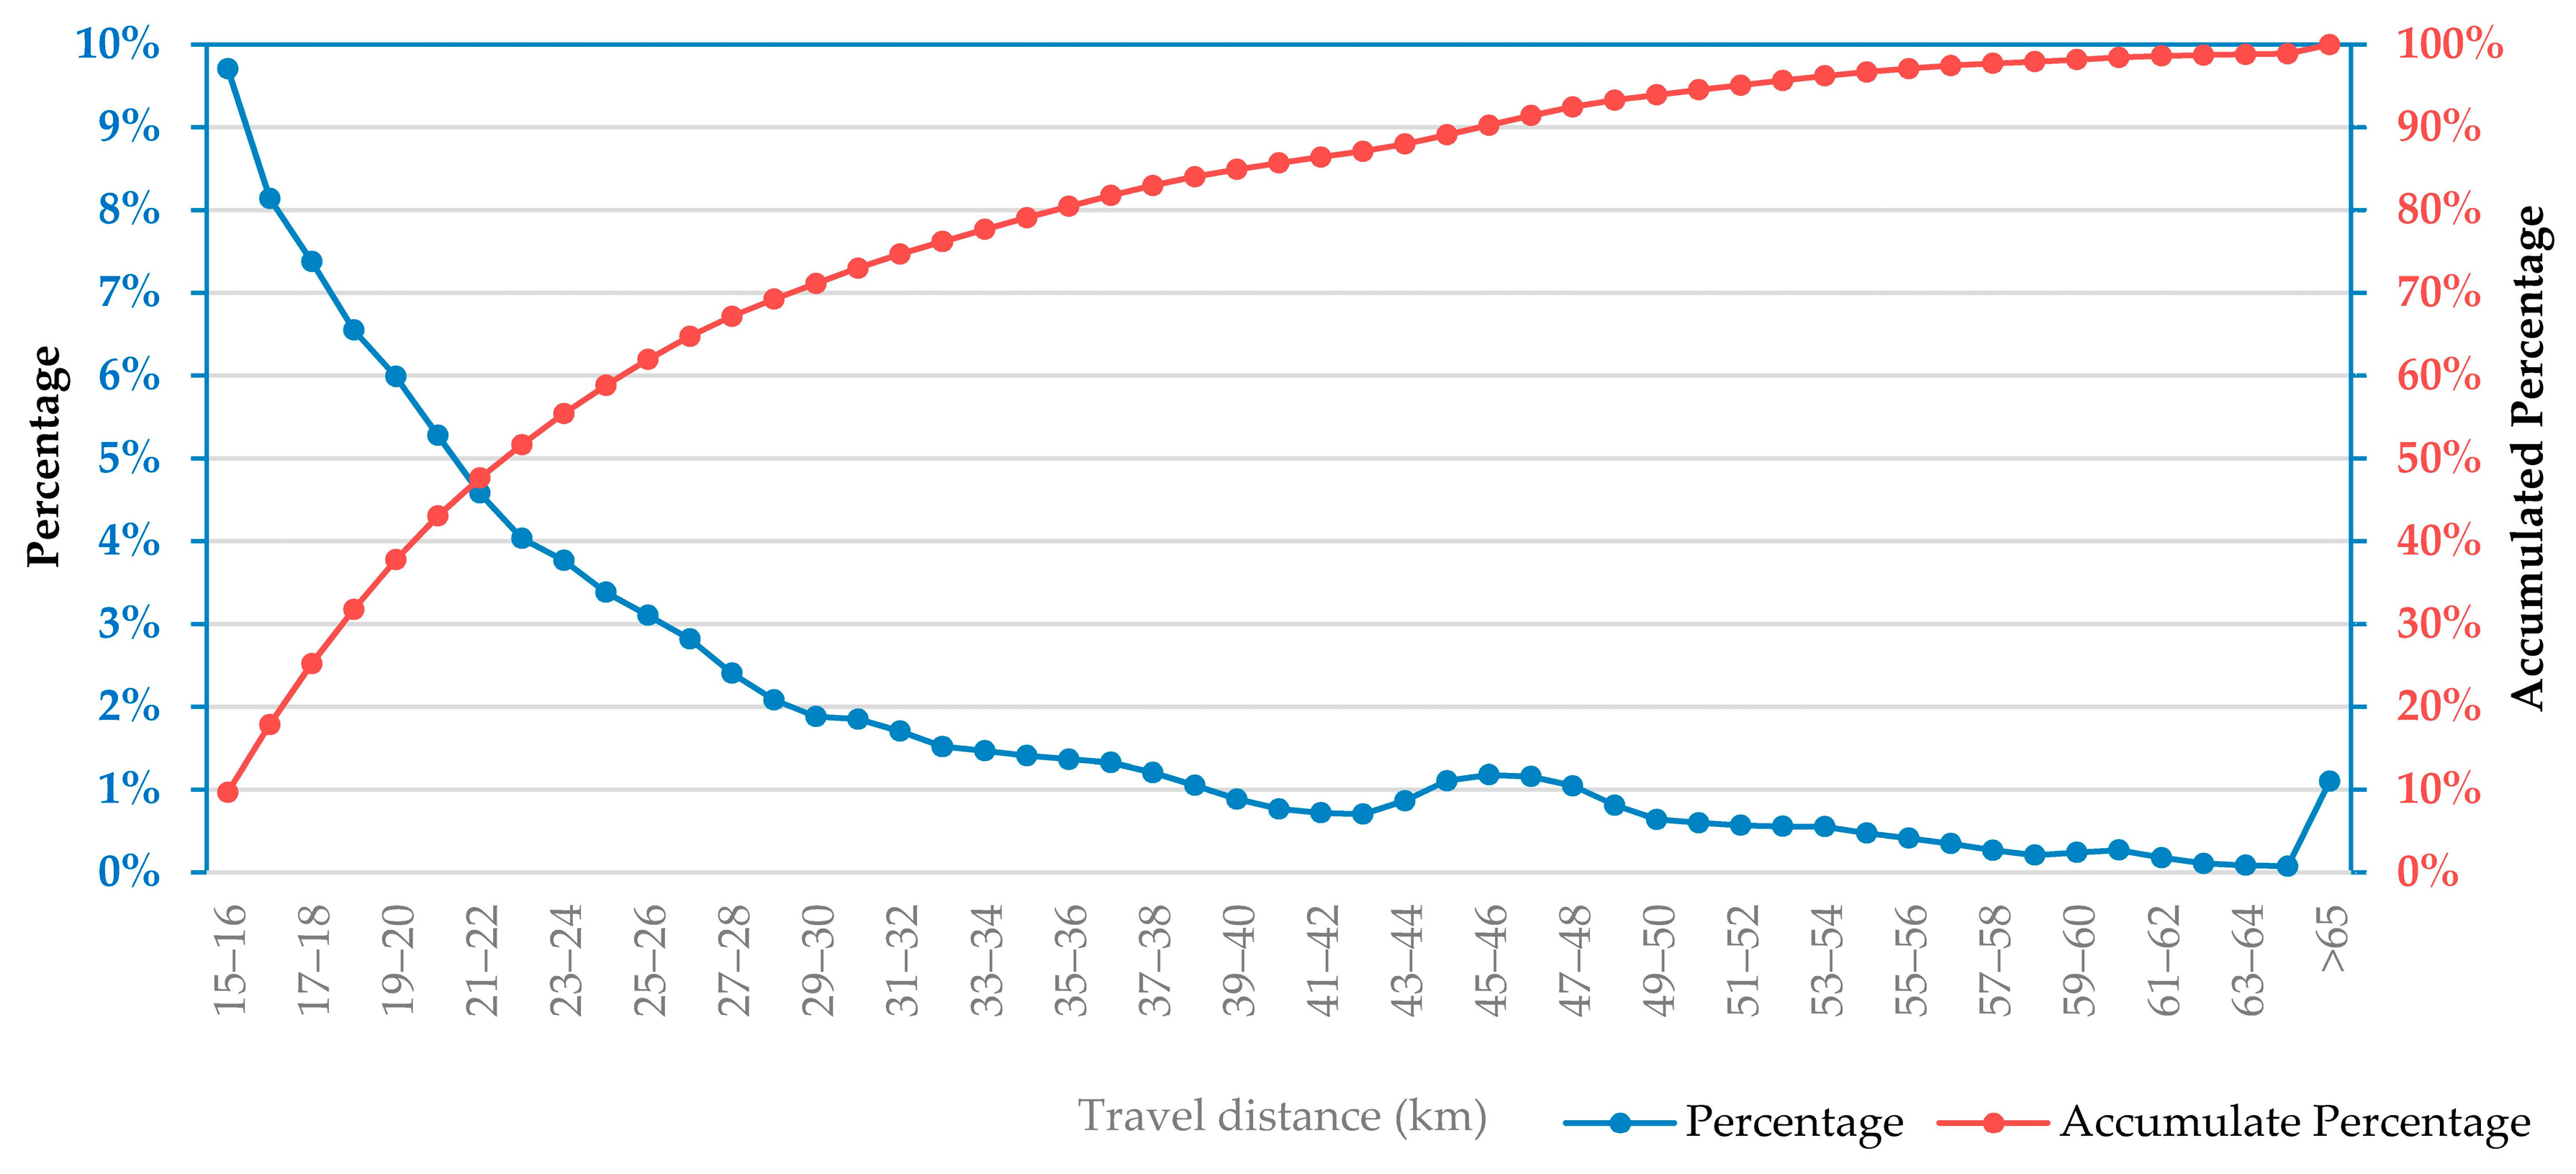
3.1.3. Portion of Long-Distance Taxi Driving
Figure 5 shows the proportion of long-distance taxi driving in Shanghai. The blue dots and line indicate the percentage of long distance driving, whereas the red dots and line indicate the accumulated percentage from 15 km to beyond 65 km. The blue line decreases smoothly as the driving distance increases from 15 to 65 km. According to the red line, taxi driving longer than 45 km is less than 10% of the total long-distance taxi driving. In other words, less than 10% of taxi passengers will choose a taxi if the distance is longer than 45 km.
3.2. Temporal Patterns of Long-Distance Taxi Rides
3.2.1. Departure Time Patterns between Workdays and Non-Workdays for Long-Distance Taxi Rides
The departure time of each long-distance taxi ride was selected to analyze the pick-up patterns. Firstly, all trajectories were divided into two groups, workdays and non-workdays. Non-workdays contain the weekends and holidays as defined by Chinese law. According to the time scope of our case data, there were 55 non-workdays including 53 weekend days and two holidays. The workdays selected in this study totaled 129 days. Then, statistic processing was performed on the departure time of each trajectory. The 24 h in a day were divided into five-minute durations, for a total of 288. The departure time of each trajectory was selected and assigned to the appropriate group. After that, the number of each group was counted. The distribution diagram of departure times for workdays and non-workdays are shown in Figure 5. The blue line indicates the departure time distribution of non-workdays and the brown line is the workday distribution.
As shown in Figure 6, the long-distance taxi rides on non-workdays are relatively stable in the daytime. The travel frequency did not change much during 6:00 a.m. to 11:00 p.m. The frequency of long-distance taxi trips during 8:00 a.m. to 9:00 a.m., 11:55 a.m. to 12:10 p.m., and 10:30 p.m. to 11:00 p.m. is relatively higher than other time intervals, however, the reason for the differences is not clear.
Long-distance taxi travel on workdays showed obvious time-related features. According to Figure 6, there are four peaks after sunrise: 5:50 a.m.–6:50 a.m. (before early peak), 9:00 a.m.–9:30 a.m. (after early peak), 4:00 p.m.–4:25 p.m. (before late peak) and 8:50 p.m.–11:00 p.m. (after late peak). After 11:00 p.m., the frequency rapidly decreased.
3.2.2. Difference in Workday and Non-Workday Hotspots for Long-Distance Taxi Rides
In this subsection, the typical hotspots which listed in Table 3 were selected to analyze the travel differences between workdays and non-workdays. Two indices were adopted to describe the travel features of hotspots, as shown in Equations (2) and (3).
where P denotes the possibility of long distance taxi-riding, LD is the long-distance travel times of certain hotspots, and T is the total travel time for certain hotspots, including both long and short distance travel.
Another index R, which is the proportion of working days and non-working days, is defined as:
where LDW is the number of long distance travel trips on workdays and LDNW is number of long distance travel times on non-workdays. In this study, we selected 129 workdays and 55 non-workdays. Therefore, the normal value for R should be 129/55 = 2.34. Any hotspot with a higher R value can be considered as a higher demand for long distance workday taxis.
Using the P and R indices, we evaluated the probability of long distance taxi rides and the proportion of workdays and non-workdays for each hotspot. The results are shown in Table 4.
From Table 3, long-distance travel always occurred at Pudong Airport and the Hongqiao hub with a rate of near or above 50%. Especially in Pudong airport, the long-distance travel was near 100%. This is because Pudong airport is located far away from the Shanghai downtown. The Hongqiao hub is located near the Shanghai downtown, therefore, the possibility of taking long distance passengers is higher than for other downtown hotspots for a taxi driver, but lower than at Pudong Airport.
Another traffic hotspot, similar to Pudong airport and Hongqiao hub, is the Shanghai railway station, which is located in the downtown of Shanghai. Therefore, the possibility of taking long distance travelers is obviously lower than the Pudong and Hongqiao airports. Compared to these three transportation hotspots, the R values are relatively close (2.65–3.30) but higher than 2.34, which indicates that the long-distance passengers on workdays and non-workdays are relatively uniform. Moreover, the number of workday passengers are a bit higher than non-workdays.
At the exhibition hotspot, Shanghai new expo center, located in the Shanghai downtown, the possibility of take long distance passengers is lower than Pudong airport and Hongqiao hub, and is similar to the Shanghai railway station. The R values of 3.91 and 4.25 are obviously higher than the transportation hotspots, which indicates that long distance passengers on workdays are higher than on non-workdays.
For the tourism hotspots, including People’s square, Jingan temple and The Bund, the possibility of long distance taxi is obviously lower than Pudong airport and the Hongqiao hub because these hotspots are located in the downtown of Shanghai. The R value varied from 2.53–4.61, which indicates the rate of workday to non-workday long distance travel differs according to the hotspot location.
3.2.3. Departure Time Patterns for Long Distance Travel Hotspots
The departure time of seven hotspots, including Pudong airport, Hongqiao hub, Shanghai railway station, the Shanghai new expo center, People’s square, Jingan temple, and The Bund, are analyzed.
The number of long-distance trips were counted hourly based on the departure time. Then, the average number of long-distance trips were calculated for both the workdays and non-workdays. Figure 7 shows the differences in the number of the long-distance trips each hour based on the departure time at the abovementioned seven hotspots, whereby different colors represent different hotspots as indicated on Figure 7. The number of long distance trips based on departure time means the number of long-distance trips that start at a certain time or in a certain time interval. The length of the bar in the chart represents the difference in the numbers of departures for long-distance trips at a certain point in time. The longer the chart bar is, the larger the difference. Positive values mean that there is more long-distance trips during non-workdays than workdays, while a negative value means the opposite.
From Figure 7, two time intervals exist in which the long-distance trips on non-working days are greater than those on the working days, namely from 11:00 p.m. to 8:00 a.m. and from 5:00 p.m. to 7:00 p.m. At the same time, two time intervals also exist in which the long-distance trips on workdays are greater than those on non-workdays, namely from 9:00 a.m. to 4:00 p.m. and from 8:00 p.m. to 10:00 p.m. The reason for this phenomena could be that people who wanted to take taxis for long-distance trips tried to avoid the rush hours in the Shanghai metro transportation system. During the Shanghai workdays, most people use the metro as transport between home and their workplace. Therefore, from 6:30 a.m. to 8:00 a.m. and from 5:00 p.m. to 7:00 p.m. on working days, the metro is extremely crowded. Due to this, people prefer to take taxis for long-distance trips, because they do not want to be squeezed by others for long periods and want to avoid the busiest interchanges between different metro lines, since changing from one line to another can be time-consuming. From 9:00 a.m. to 4:00 p.m. and from 8:00 p.m. to 10:30 p.m. during the workdays, the metro trains are less busy and therefore people prefer to use the metro instead of taxis, because it is more comfortable and more affordable.
Despite this, more people take taxis from 11:00 p.m. to 5:00 a.m. on non-workdays than those on workdays. Notably, during this time interval, regardless of the type of day, the metro is closed. People must use if they have to travel long distances. The reason for more taxi use for long distance on non-working days than on working days might be because the total number of long-distance trips on working days is less than that on non-working days; on workdays people normally do not go out for long-distance travel but may go shopping or sightseeing during this time interval on non-working days.
There are slight differences among the hotspots in Shanghai. The new expo center opened in 2010. However, only one metro line has a stop at the new expo center. Figure 7 (yellow bar) shows less people take taxis for long-distance driving before 12:00 p.m. during working days, because the tourists arrived in the morning. From 12:00 p.m. to 4:00 p.m. during working days, people start leaving the new expo center by taxi instead of taking the metro, because they want to avoid the traffic rush hour from 5:00 p.m. to 7:00 p.m. and avoid the inconvenient interchanges of the metro system. The evidence for this is shown at 4:00 p.m. during the working days when many more people take taxis for long distance trips than on the non-working days, because on the non-working days there is no rush hour from 5:00 p.m. to 7:00 p.m., and many people can take taxis for leaving the new expo center at 6:00 p.m. during non-working days.
The Bund is another famous attraction in Shanghai. Unlike the new expo center, the Bund is located in the city center and is easily accessible via three metro lines. As Figure 7 (orange bar) depicts, during non-working days more people leave the Bund by taxi from 5:00 p.m. to 7:00 p.m., likely for dinner, and from the midnight to head home or to a hotel. As a contrast, after 8:00 p.m. on working days, more people leave the Bund by taxi because they want to avoid the rush hour both on the street and in the metro lines.
The Shanghai railway station is located in the city center and receives both regional and long-distance high-speed trains. Two taxi parking lots can be found beneath the north and south square of Shanghai station. In addition, three metro lines stop here, and the metro station is close to the taxi parking lots. From Figure 7 (dark blue bars), between 7:00 a.m. and 8:00 a.m. on non-working days, significantly more people take taxis to Shanghai Station, because in this time slot there is not much traffic on non-working days, while it is rush hour on working days. In comparison to Shanghai railway station, Hongqiao hub and Pudong airport reveal slight differences between working and non-working days. Because these two hotspots are located far from the city center. so to reach the city center, changing trains several times is required which is time-consuming compared to taking a taxi on urban expressways which are less affected by rush hours.
3.2.4. Travel Distance Patterns for Long-Distance Hotspots
The travel distance patterns of these seven hotspots were analyzed. To clearly understand the travel distance patterns of both drop-off and pick-up taxi trips, the trip distance for each taxi with a customer was computed and the distribution of the distance was summarized.
Firstly, the number of long distance taxi trips was counted, divided into 1.0 km partitions, for trip distances in the range of 15 to 65 km. Then the percentage of each integer kilometer was calculated for the workdays and non-workdays. Figure 8 and Figure 9 show the comparison of the distribution of departure travel distance for each hotspot.
Obviously, the distribution in departure travel distance is similar to the arrival distance distribution. This suggests that the transportation, exhibition, and tourism hotspots maintain a high level of service in Shanghai on both non-workdays and workdays.
The threshold distance for most hotspots is 15–20 km, except for the Pudong airport and Hongqiao hub. However, once the distance exceeds 20 km, the likelihood of long-distance taxi travel decreased rapidly in these hotspots. The reason for this phenomena could be that these hotspots are located in downtown Shanghai, suggesting that the expected distance for those hotspots in downtown of Shanghai is within 20 km. If the distance between the origin and destination exceeds 20 km, people will select other transportation methods to reduce the cost, given the higher unit price of taxi travel.
Over the expected distance, a peak for every downtown hotspot. The distance and the concentrative destination at peak distance are listed in Table 5.
The expected distances for the other two hotspots, Hongqiao hub and Pudong airport, are 45 km and 25 km, respectively, which are higher than the downtown hotspots. This is probably because if people must meet deadlines for catching trains or planes, the cost of a taxi is not as significant a factor.
3.3. Interrelations Among the Long-Distance Pick-Up and Drop-Off Hotspots
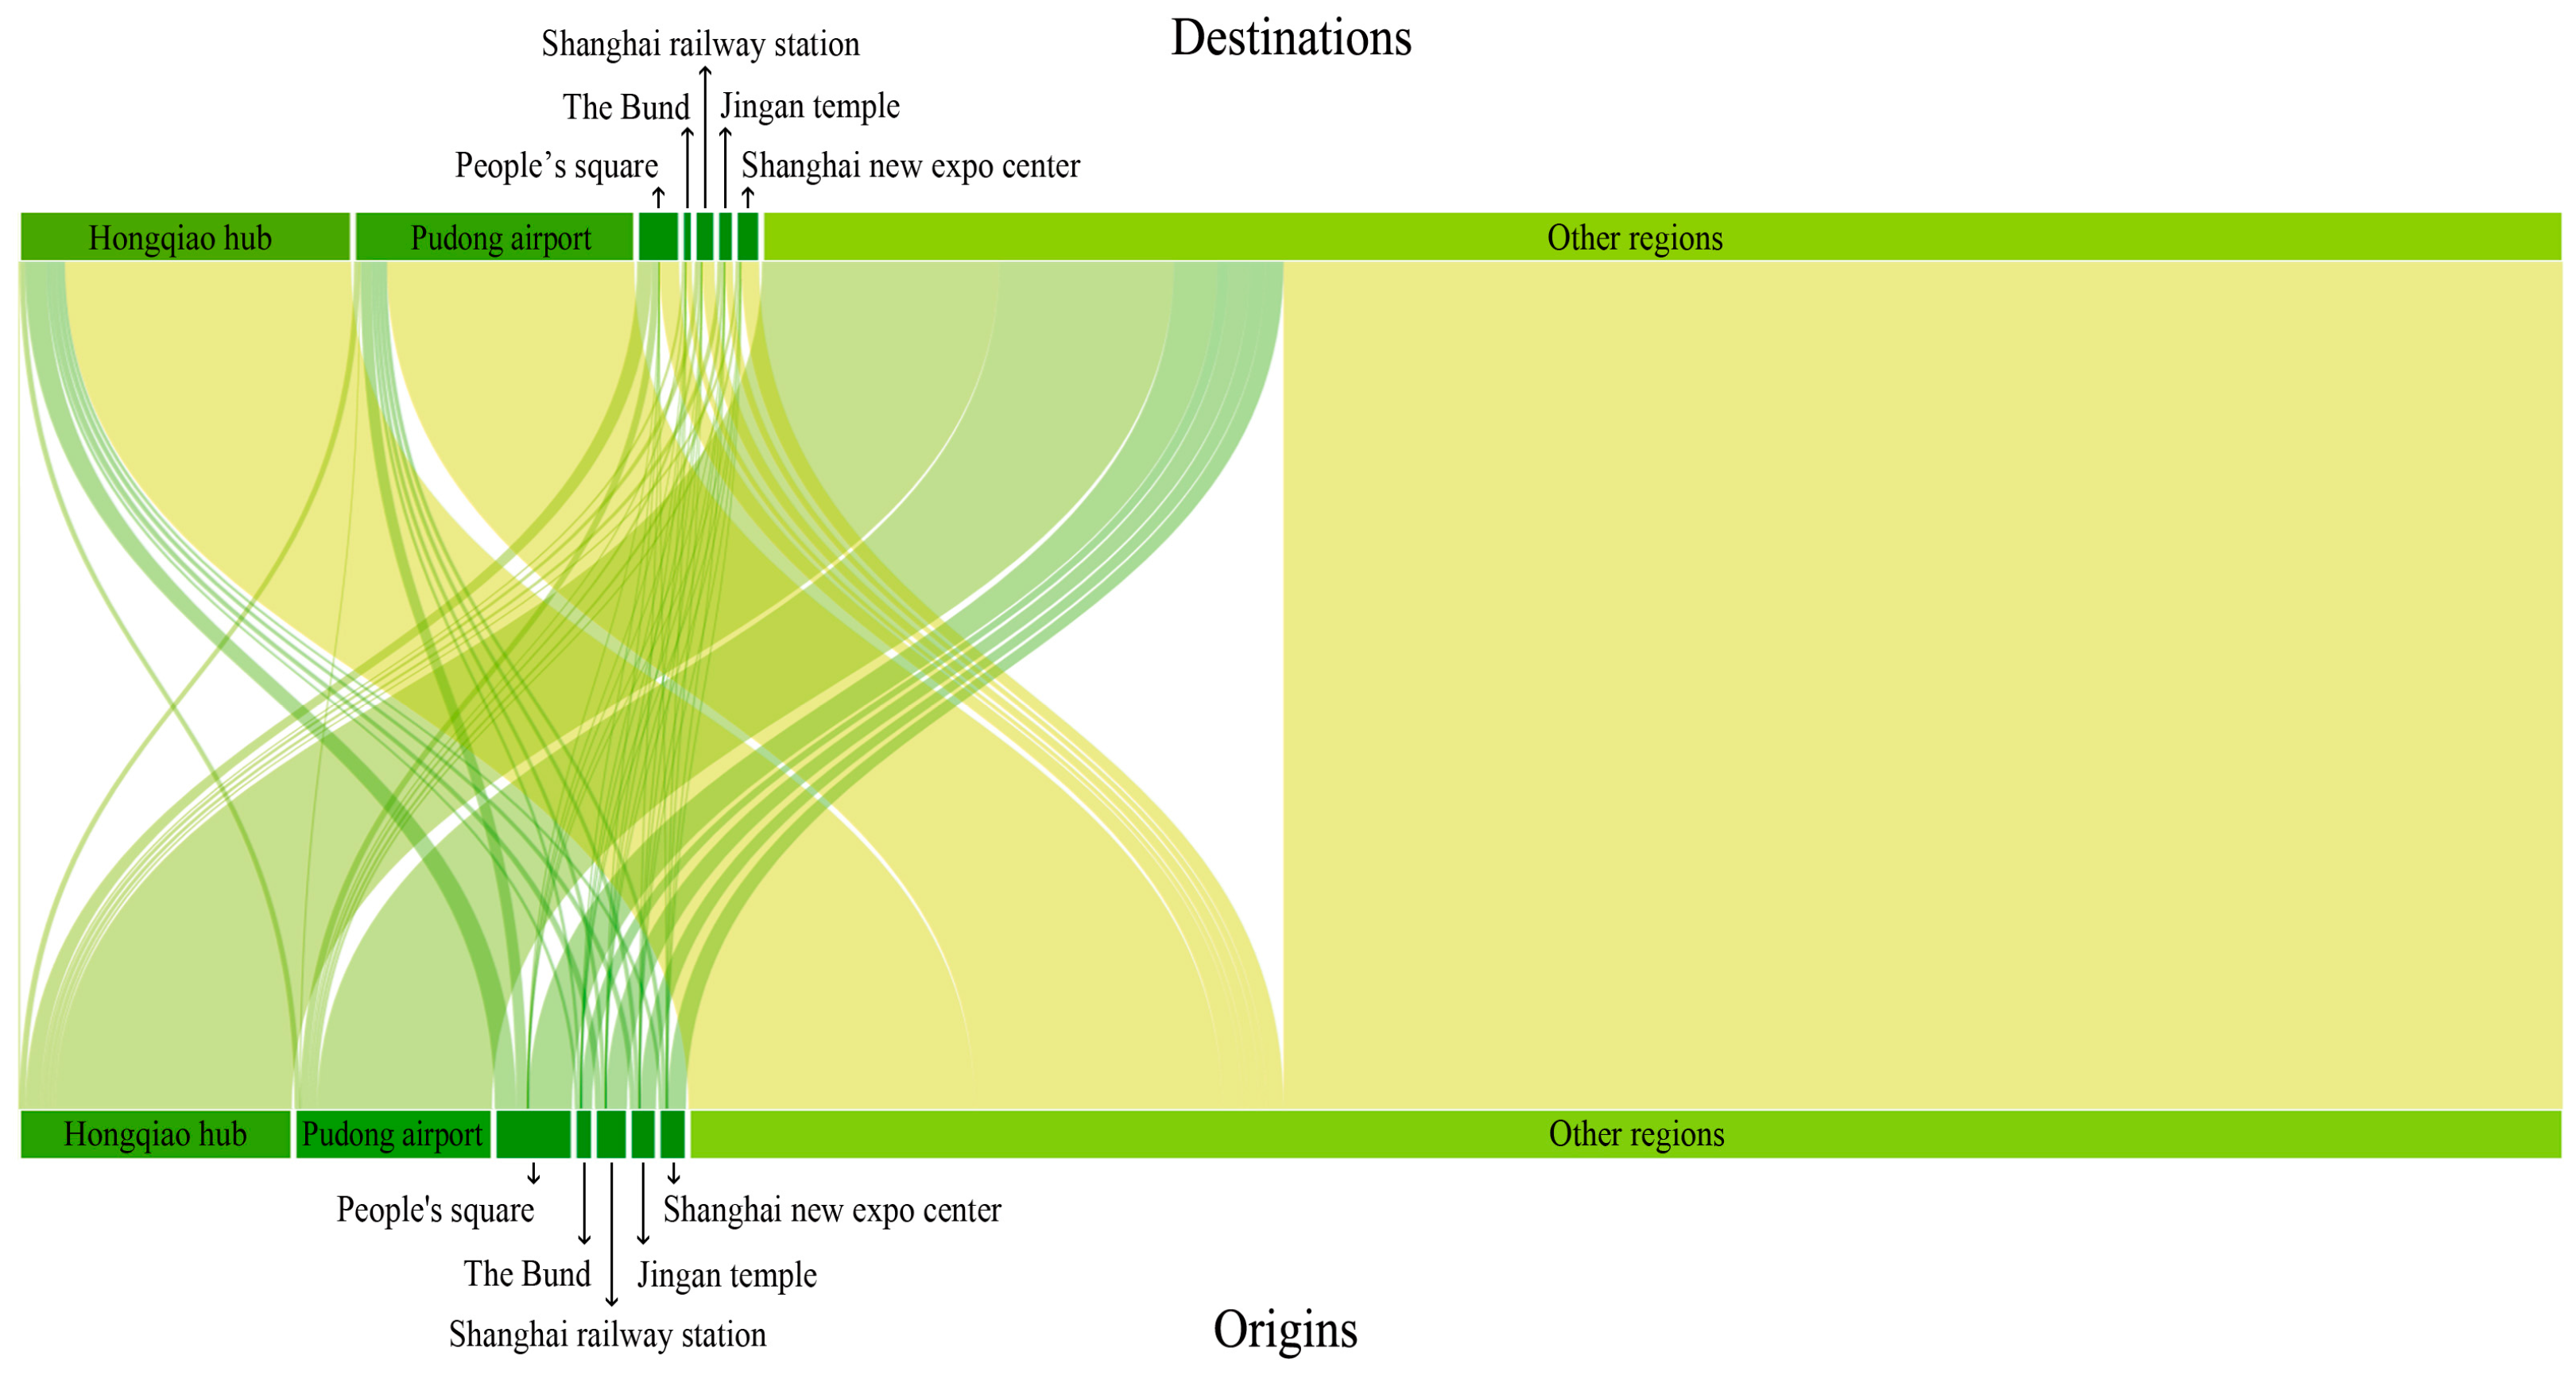
After the origins and destinations of each long-distance taxi trip was exported, we summarized the origin to destination (OD) matrix from hotspots and other regions. The OD matrix is shown in Figure 10 and the numerical results are listed in Table 6. The width of the colored text represents the number of origins or destinations of long-distance travel. The width of line between the lower (origins) and upper (destinations) show the times during which taxis pick up passengers from certain origin hotspots to certain destination hotspots.
From Table 6, the long-distance taxi rides 28.6% started from the hotspots which is more than one quarter of the total long-distance taxi trips in Shanghai. A total of 25.7% of long-distance taxi travel which ended at hotspots. A total of 49.31% of the trips were related to the hotspots, which is essentially half of the total long-distance taxi trips.
4. Conclusions
We may argue that taxi travel for long or extraordinarily long distances is of importance when analyzing the urban dynamics in a city as large as Shanghai. In this paper, we extracted and analyzed the spatiotemporal patterns of long-distance taxi trips in Shanghai by using FCD. In particular, we investigated these spatiotemporal patterns by comparing them with metro usage in Shanghai to determine to what extent and how the suburban trains could divert the passenger flow from taxi riding.
In total, the trips of 12,000 taxis from March to August 2015 were used for this study. A mathematic model was developed to define the long-distance taxi trips. Considering the taxi fees, a trip in Shanghai is regarded as being long-distance if it is longer than 15 km. Among all the trip lengths used in this study, 24% of all trips were found to be long-distance, whereas about 58% of the total distance traveled was as a result of long-distance riding.
By visualizing the pick-up and drop-off locations as a density map, 14 pick-up hotspots were identified. However, only eight drop-off hotspots were identified. In addition, the pick-up locations were relatively more concentrated than the drop-off locations. Both for pick-ups and drop-offs, the city center is a main area for long-distance taxi travel. Additionally, the traffic hubs, including Hongqiao and Pudong airport, are hotspots with an obvious higher travel density.
Temporal patterns were also revealed. After comparing the pick-up times of long-distance trips during workdays and non-workdays, and considering the rush hours both on the street traffic and in metro lines, we observed that long-distance taxi trip passengers tried to avoid the rush hours on the street as their first priority and tried to avoid the inconvenience of interchanges on metro-lines as their second priority. The majority of passengers on long-distance taxi trips chose taxis instead of metro-lines because they prefer to spend less time on their travels while pursuing comfort and convenience during their trips. In the downtown area of Shanghai, the dominant long-distance trip is about 20 km. If the distance between the origin and destination is over 20 km, people prefer to select other transportation methods to reduce the cost, due to the higher unit price of taking a taxi.
Two special hotspots exist in Shanghai: Hongqiao hub and Pudong airport. Hongqiao hub is one of the two high speed (HCR) railway train stations. For these two hotspots, the majority of the taxi riding travels are 25 km and 45 km, respectively, which are both higher than the downtown hotspots. The financial expense does not appear to be a determining factor when choosing taxis for long-distance travel for these two hotspots. Instead, people are aiming to save time when must meet deadlines to catch trains or airplanes.
Acknowledgments
This study was supported by the National Science and Technology Major Program (2016YFB0502104), the National Science Foundation of China (No. 41671451) and the Fundamental Research Funds for the Central Universities of China. The authors also appreciate the contributions made by anonymous reviewers.
Author Contributions
Hangbin Wu had the initial idea for the long-distance taxi riding analysis. Hangchao Fan contributed his efforts for the analysis factors of research structure and experiments. Hangbin Wu and Shengyuan Wu collect the data and finished the data processing procedures. Hangbin Wu and Hongchao Fan wrote the paper.
Conflicts of Interest
The authors declare no conflict of interest. The founding sponsors had no role in the design of the study; in the collection, analyses, or interpretation of data; in the writing of the manuscript; or in the decision to publish the results.
References
- Huber, W.; Lädke, M.; Ogger, R. Extended floating-car data for the acquisition of traffic information. In Proceedings of the 6th World Congress on Intelligent Transport Systems, Toronto, ON, Canada, 8–12 November 1999. [Google Scholar]
- Liu, Y.; Kang, C.; Gao, S.; Xiao, Y.; Tian, Y. Understanding intra-urban trip patterns from taxi trajectory data. J. Geogr. Syst. 2012, 14, 463–483. [Google Scholar] [CrossRef]
- Sohr, A.; Brockfeld, E.; Krieg, S. Quality of floating car data. In Proceedings of the WCTR 2010—World Conference on Transport Research, Lisbon, Portugal, 11–15 July 2010. paper nr 02392. [Google Scholar]
- Liu, L.; Andris, C.; Biderman, A.; Ratti, C. Revealing taxi driver’s mobility intelligence through his trace. IEEE Pervasive Comput. 2009, 160, 1–17. [Google Scholar]
- Goldsberry, K. Limitations and potentials of real-time traffic visualization for wayfinding. In Proceedings of the 22nd ICA/ACI International Cartographic Conference, A Coruna, Spain, 9–16 July 2005. [Google Scholar]
- Goldsberry, K. GeoVisualization of automobile congestion. In Proceedings of the AGILE 2008 Conference: GeoVisualization of Dynamics, Movement and Change, Girona, Spain, 5 May 2008. [Google Scholar]
- Veloso, M.; Phithakkitnukoon, S.; Bento, C. Sensing urban mobility with taxi flow. In Proceedings of the International Workshop on Location-Based Social Networks, Chicago, IL, USA, 1–4 November 2011; ACM: New York, NY, USA. [Google Scholar]
- Yuan, Y.; Raubal, M.; Liu, Y. Correlating mobile phone usage and travel behavior—A case study of harbin, china. Comput. Environ. Urban Syst. 2012, 36, 118–130. [Google Scholar] [CrossRef]
- Li, B.; Zhang, D.; Sun, L.; Chen, C.; Li, S.; Qi, G.; Yang, Q. Hunting or waiting? Discovering passenger-finding strategies from a large-scale real-world taxi dataset. In Proceedings of the IEEE International Conference on Pervasive Computing and Communications Workshops, Seattle, WA, USA, 21–25 March 2011. [Google Scholar]
- Zhan, X.; Hasan, S.; Ukkusuri, S.V.; Kamga, C. Urban link travel time estimation using large-scale taxi data with partial information. Transp. Res. Part C 2013, 33, 37–49. [Google Scholar] [CrossRef]
- Ebendt, R.; Sohr, A.; Tcheumadjeu, L.C.T.; Wagner, P. Dynamische Neuplanung der Touren von Express Trucks unter Einbeziehung einer FCD-basierten Verkehrslage. In Proceedings of the Multikonferenz Der Wirtschaftsinformatik, Goettingen, Germany, 23–25 February 2010; pp. 125–136. [Google Scholar]
- Powell, J.W.; Huang, Y.; Bastani, F.; Ji, M. Towards reducing taxicab cruising time using spatio-temporal profitability maps. In International Conference on Advances in Spatial and Temporal Databases; Springer: Berlin, Germany, 2011; Volume 6849, pp. 242–260. [Google Scholar]
- Zheng, Y.; Zhou, X. Computing with Spatial Trajectories; Springer: Berlin, Germany, 2011; ISBN 978-1-4614-1628-9. [Google Scholar]
- Guo, H.; Wang, Z.; Yu, B.; Zhao, H.; Yuan, X. TripVista: Triple Perspective Visual Trajectory Analytics and Its Application on Microscopic Traffic Da-ta at a Road Intersection. In Proceedings of the IEEE Pacific Visualization Symposium (PacificVis 2011), Hong Kong, China, 1–4 March 2011; IEEE Computer Society: Washington, DC, USA; pp. 163–170. [Google Scholar]
- Tominski, C.; Schumann, H.; Andrienko, G.; Andrienko, N. Stacking-based visualization of trajectory attribute data. IEEE Trans. Vis. Comput. Graph. 2012, 18, 2565–2574. [Google Scholar] [CrossRef] [PubMed]
- Andrienko, G.; Andrienko, N.; Bak, P.; Keim, D.; Kisilevich, S.; Wrobel, S. A conceptual framework and taxonomy of techniques for analyzing movement. J. Vis. Lang. Comput. 2011, 22, 213–232. [Google Scholar] [CrossRef]
- Andrienko, N.; Andrienko, G. Visual analytics of movement: An overview of methods, tools and procedures. Inf. Vis. 2013, 12, 3–24. [Google Scholar] [CrossRef]
- Shen, J.; Liu, X.; Chen, M. Discovering spatial and temporal patterns from taxi-based Floating Car Data: A case study from Nanjing. GIScience Remote Sens. 2017, 54, 617–638. [Google Scholar] [CrossRef]
- Chang, H.W.; Tai, Y.C.; Chen, H.W.; Yung, J.; Hsu, J. Itaxi: Context-aware taxi demand hotspots prediction using ontology and data mining approaches. In Proceedings of the 13th Conference on Artificial Intelligence and Applications (TAAI 2008), Varna, Bulgaria, 4–6 September 2008. [Google Scholar]
- Li, X.; Pan, G.; Wu, Z.; Qi, G.; Li, S.; Zhang, D.; Zhang, W. Prediction of urban human mobility using large-scale taxi traces and its applications. Front. Comput. Sci. 2012, 6, 111–121. [Google Scholar]
- Ding, L.; Fan, H.; Meng, L. Understanding taxi driving behaviors from movement data. In AGILE 2015; Lecture Notes in Geoinformation and Cartography; Bacao, F., Santos, M.Y., Painho, M., Eds.; Springer: Berlin, Germany, 2015. [Google Scholar]
Figure 1.
Taxi positions, trajectories, and states of Floating Car Data (FCD).

Figure 2.
Flowchart for identifying taxi pick-up and drop-off hotspots.
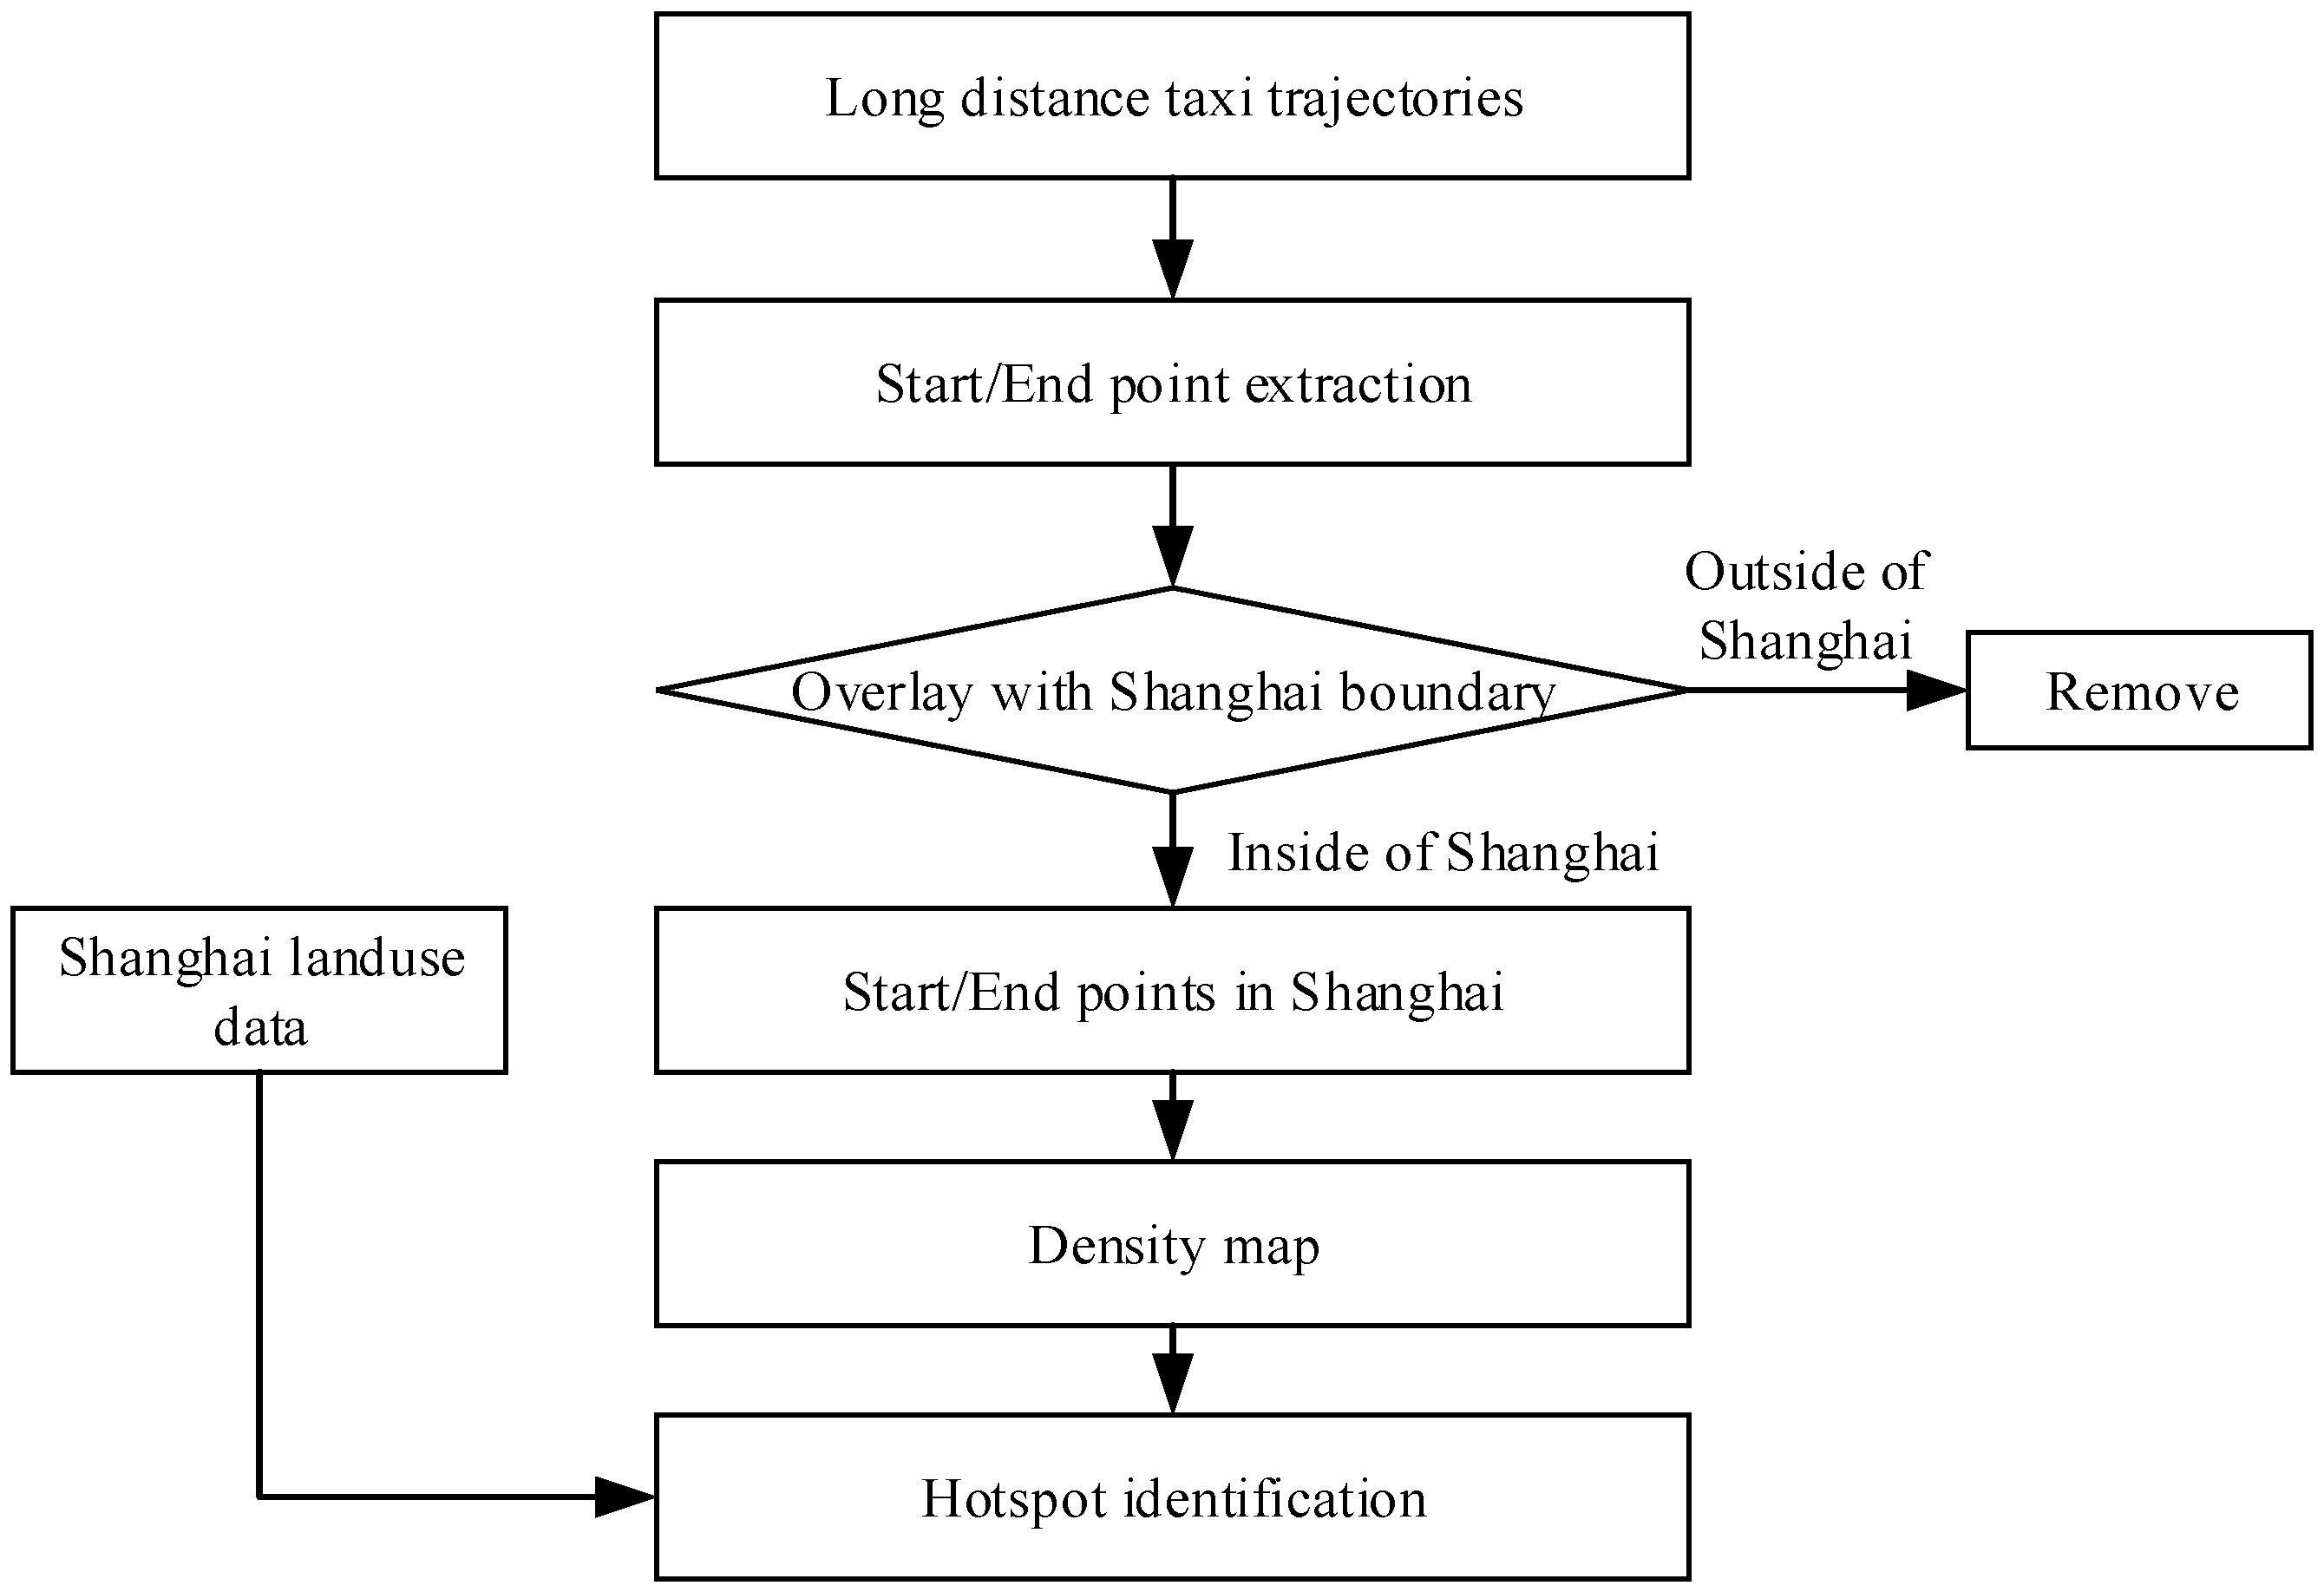
Figure 3.
Density map of pick-up locations for long distance taxi trips and identification of hotspots in Shanghai.
Figure 3.
Density map of pick-up locations for long distance taxi trips and identification of hotspots in Shanghai.
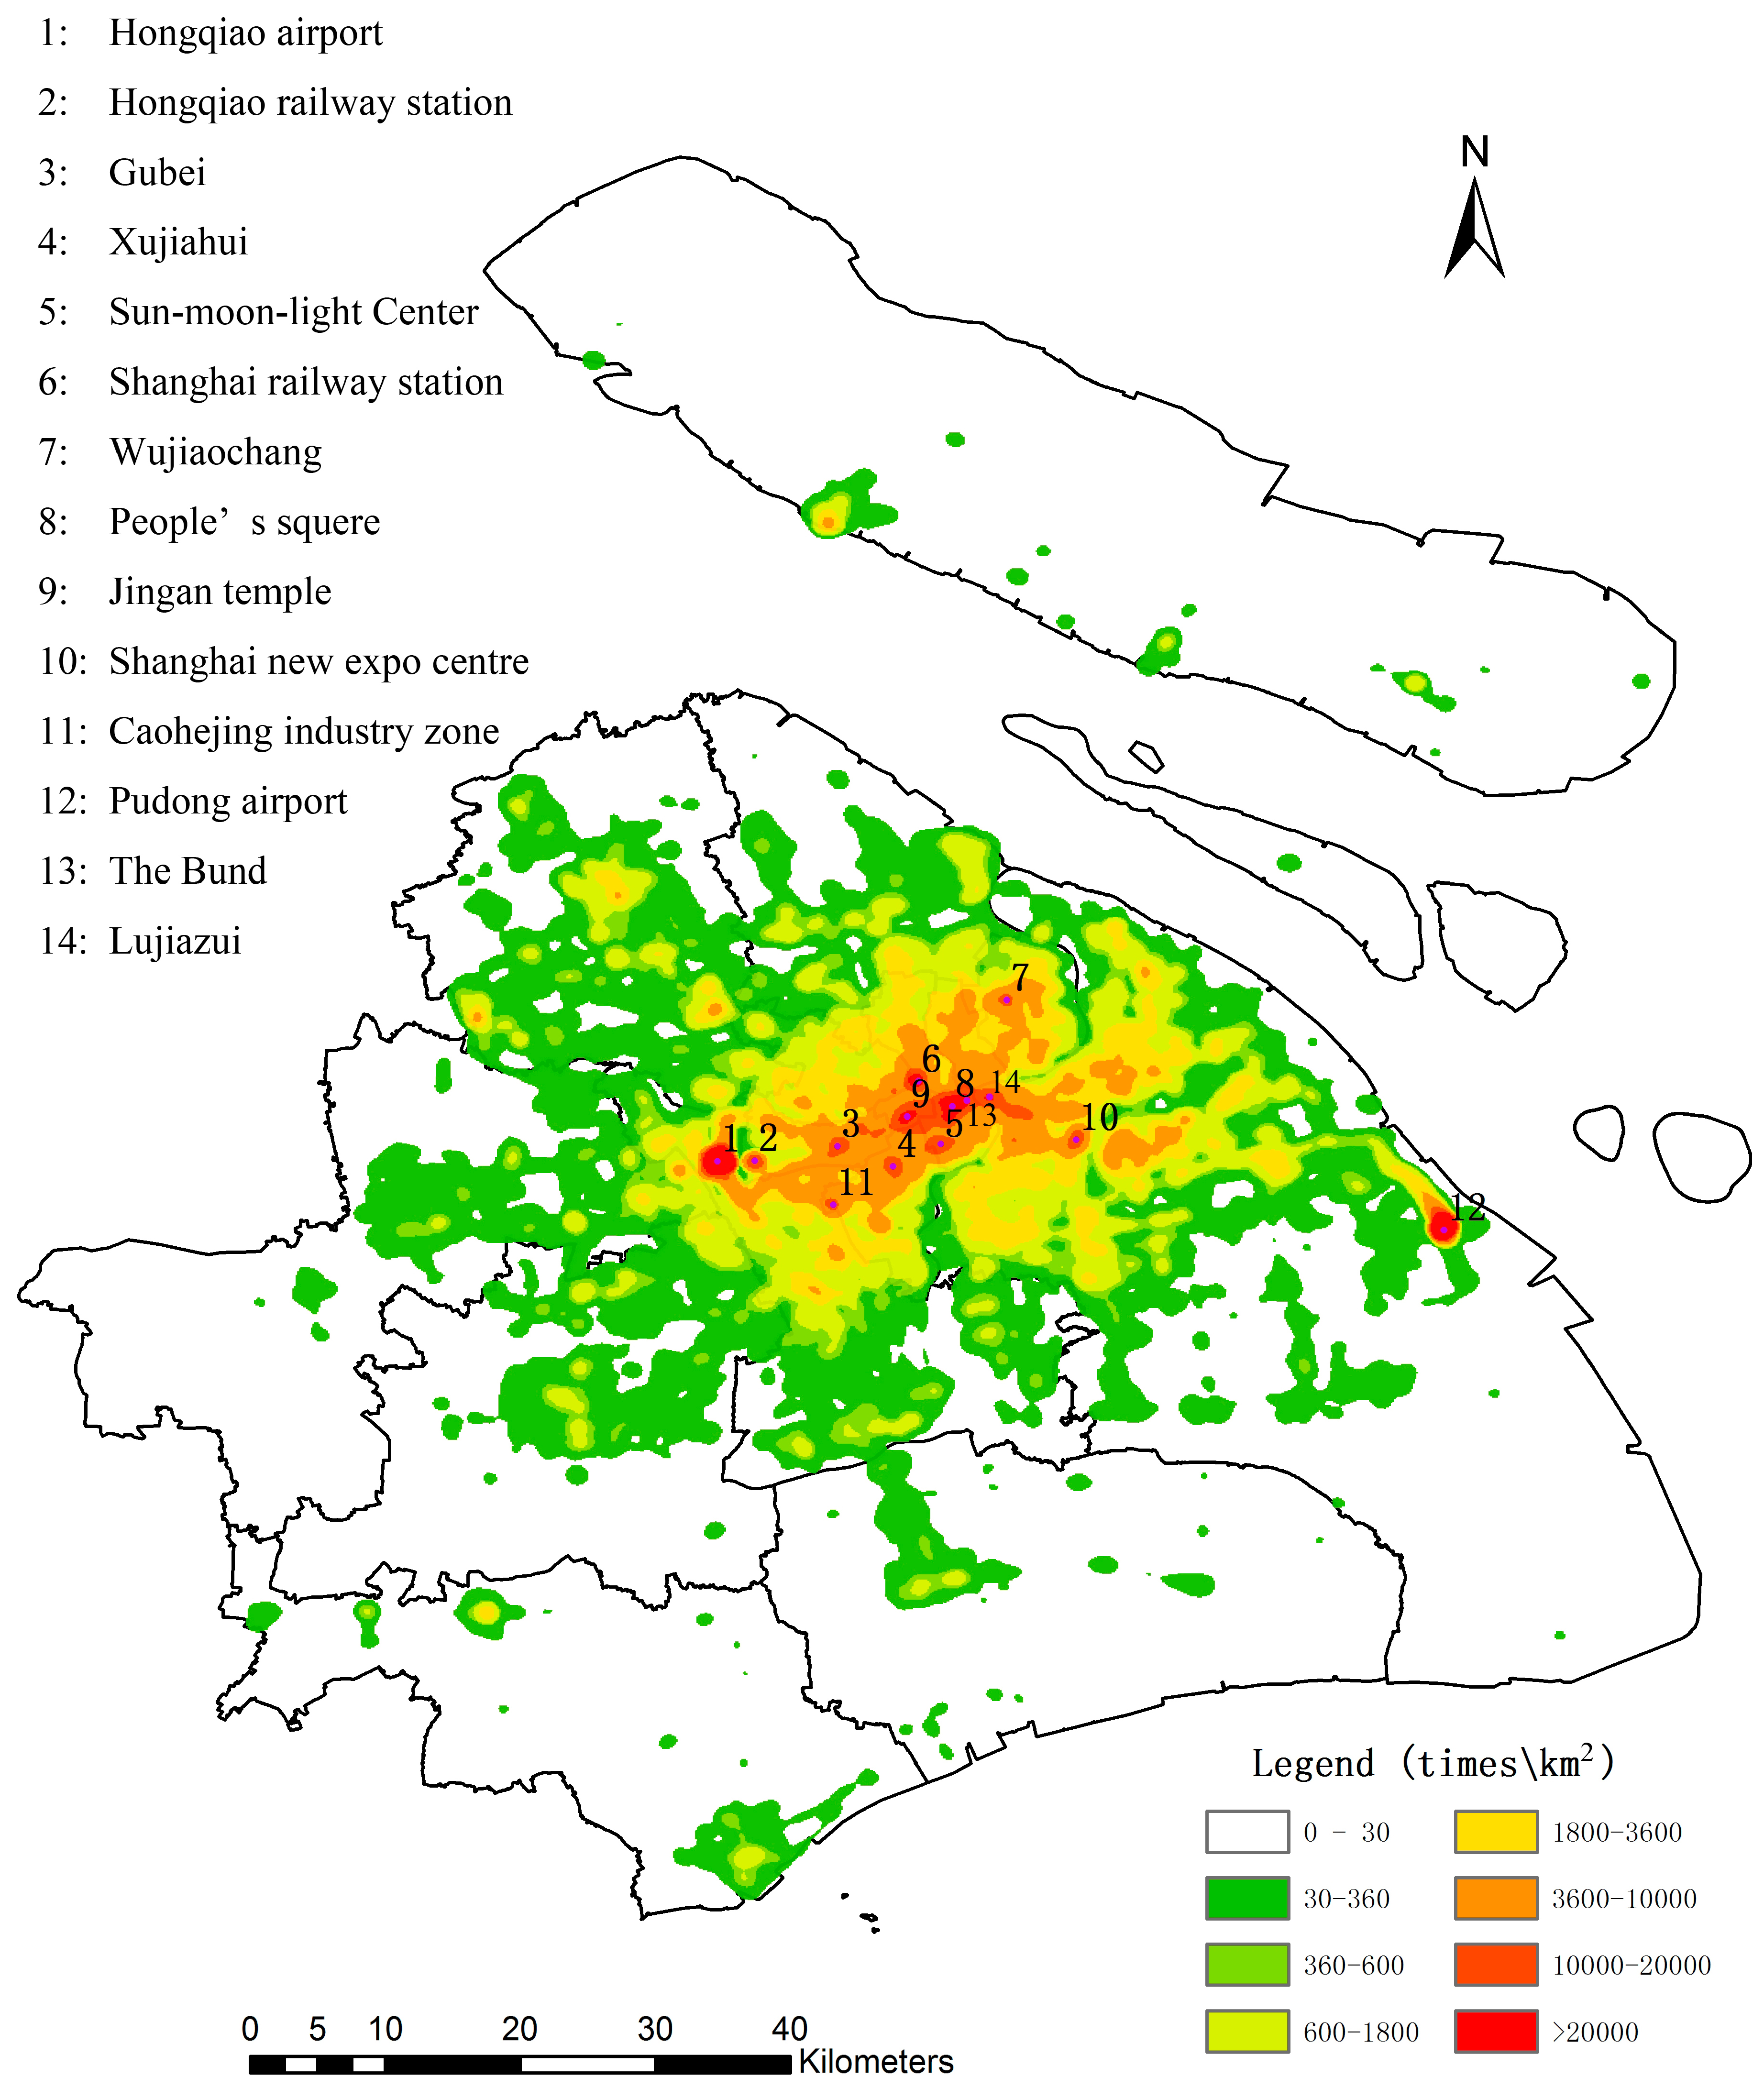
Figure 4.
Density map of drop-off locations and hotspots identification for long distance taxi travel in Shanghai.
Figure 4.
Density map of drop-off locations and hotspots identification for long distance taxi travel in Shanghai.

Figure 5.
The percentage and accumulated percentage of the distances traveled for long-distance taxi travel.
Figure 5.
The percentage and accumulated percentage of the distances traveled for long-distance taxi travel.

Figure 6.
Departure time statistics for workday versus non-workday long-distance taxi trips.
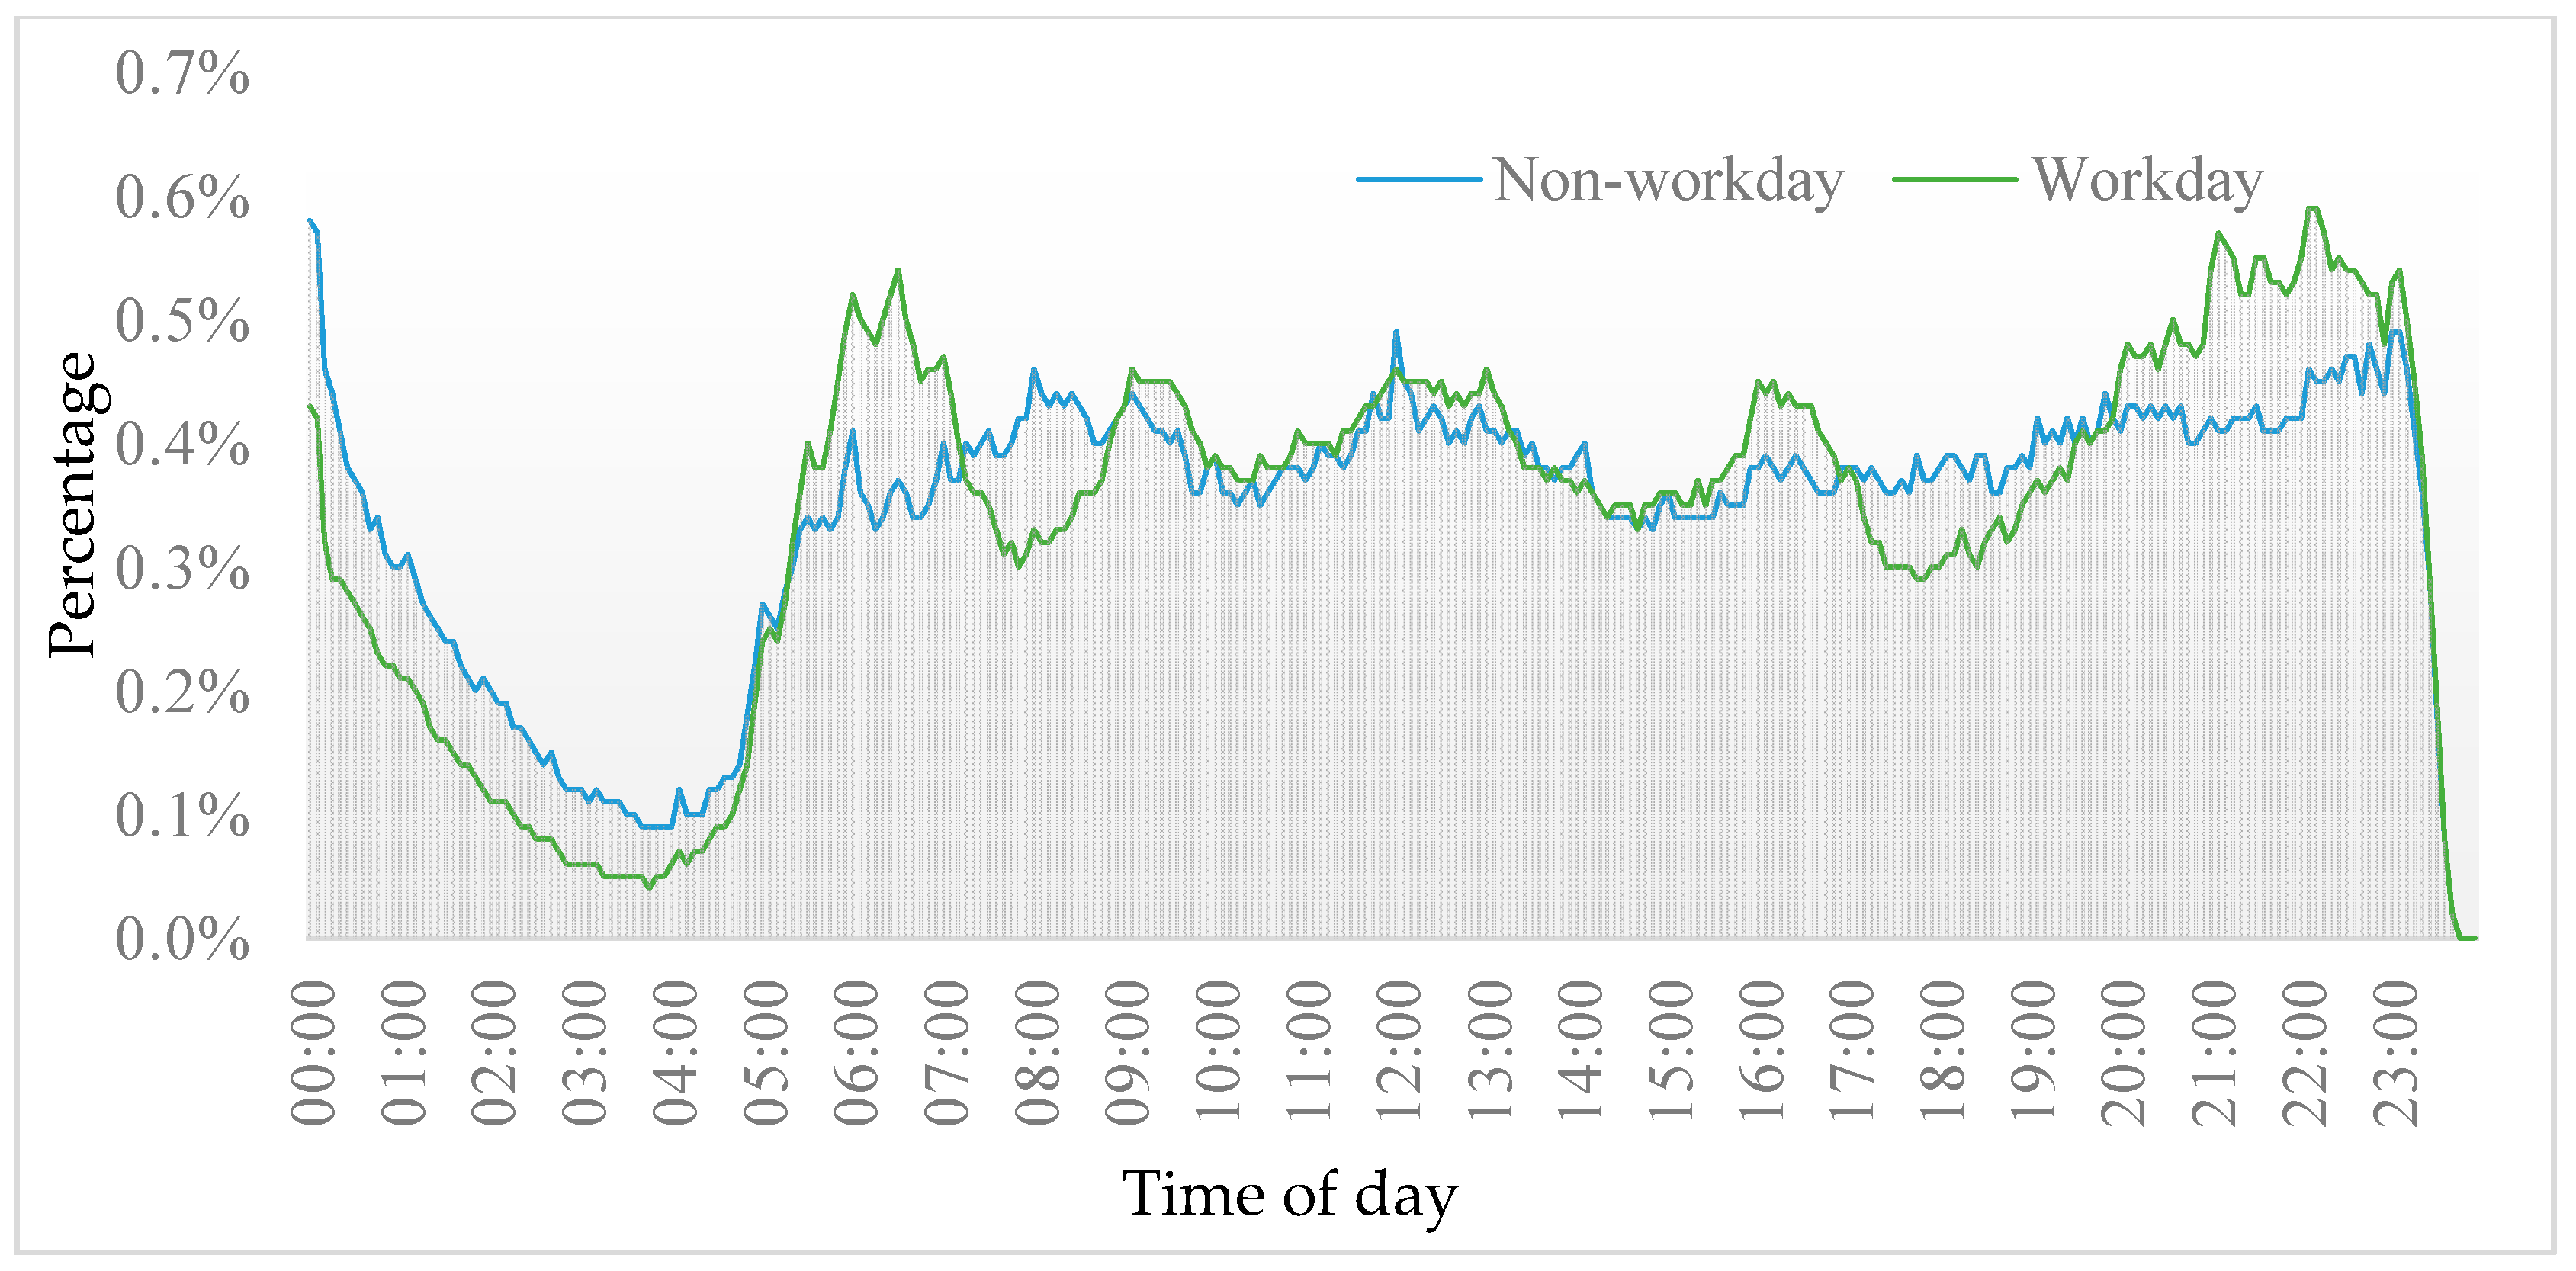
Figure 7.
The differences between workdays and non-workdays in the long-distance travel taxi hotspots in Shanghai.
Figure 7.
The differences between workdays and non-workdays in the long-distance travel taxi hotspots in Shanghai.
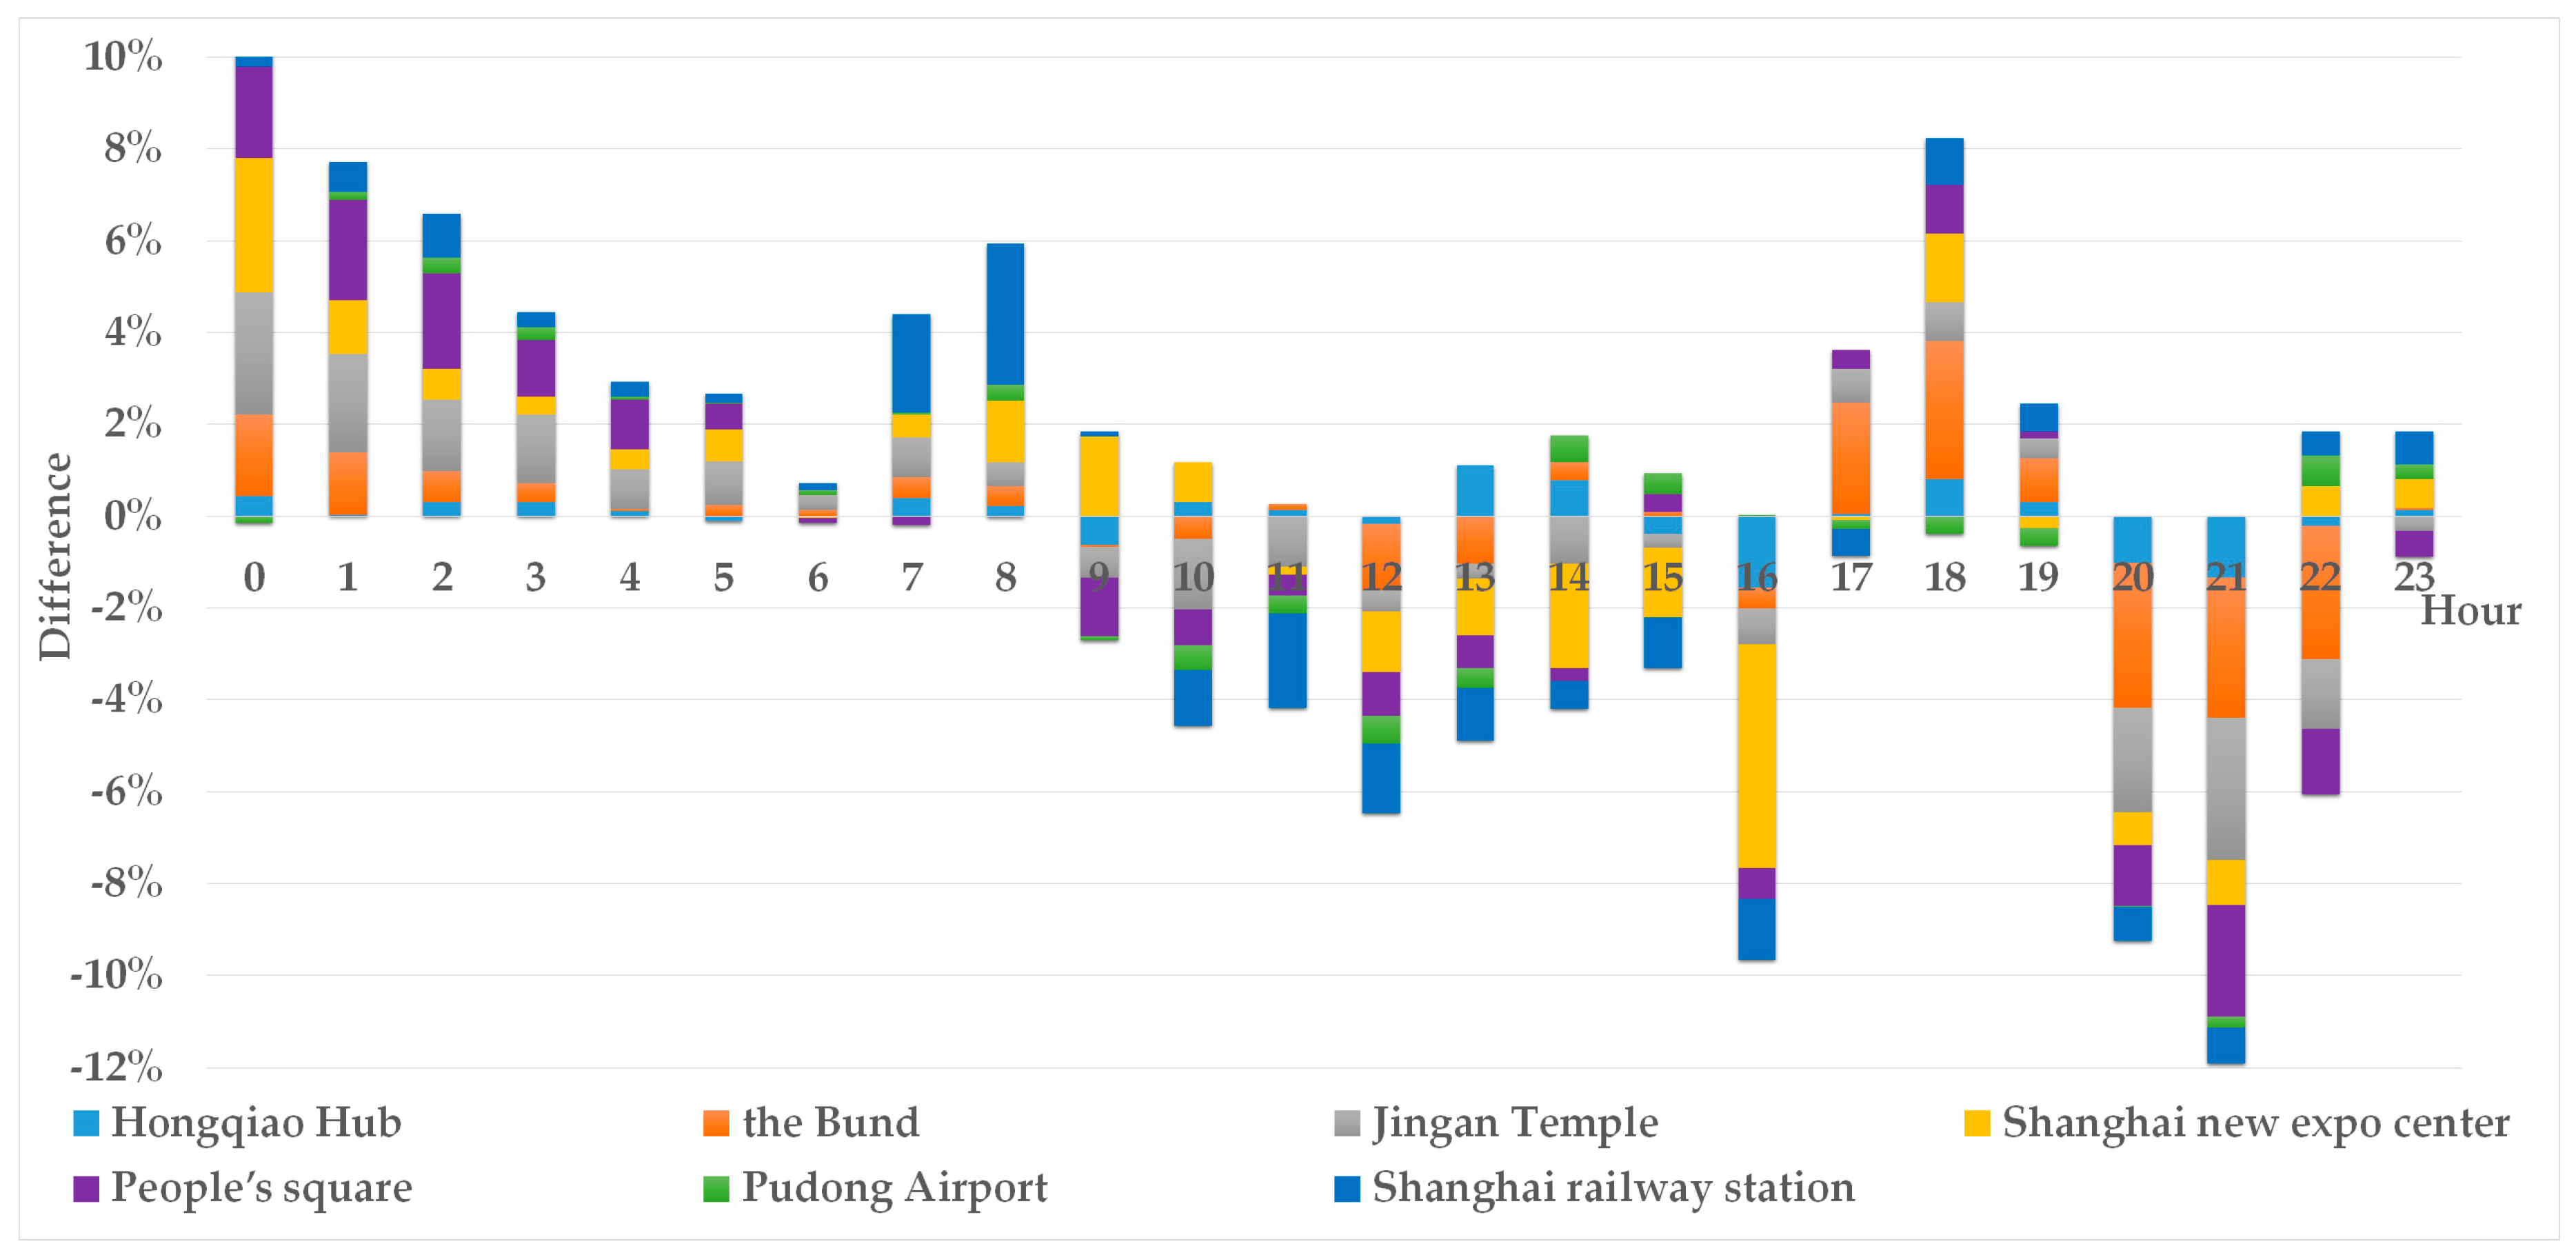
Figure 8.
Distribution of the distance traveled from hotspots in Shanghai for non-workdays versus workdays.
Figure 8.
Distribution of the distance traveled from hotspots in Shanghai for non-workdays versus workdays.
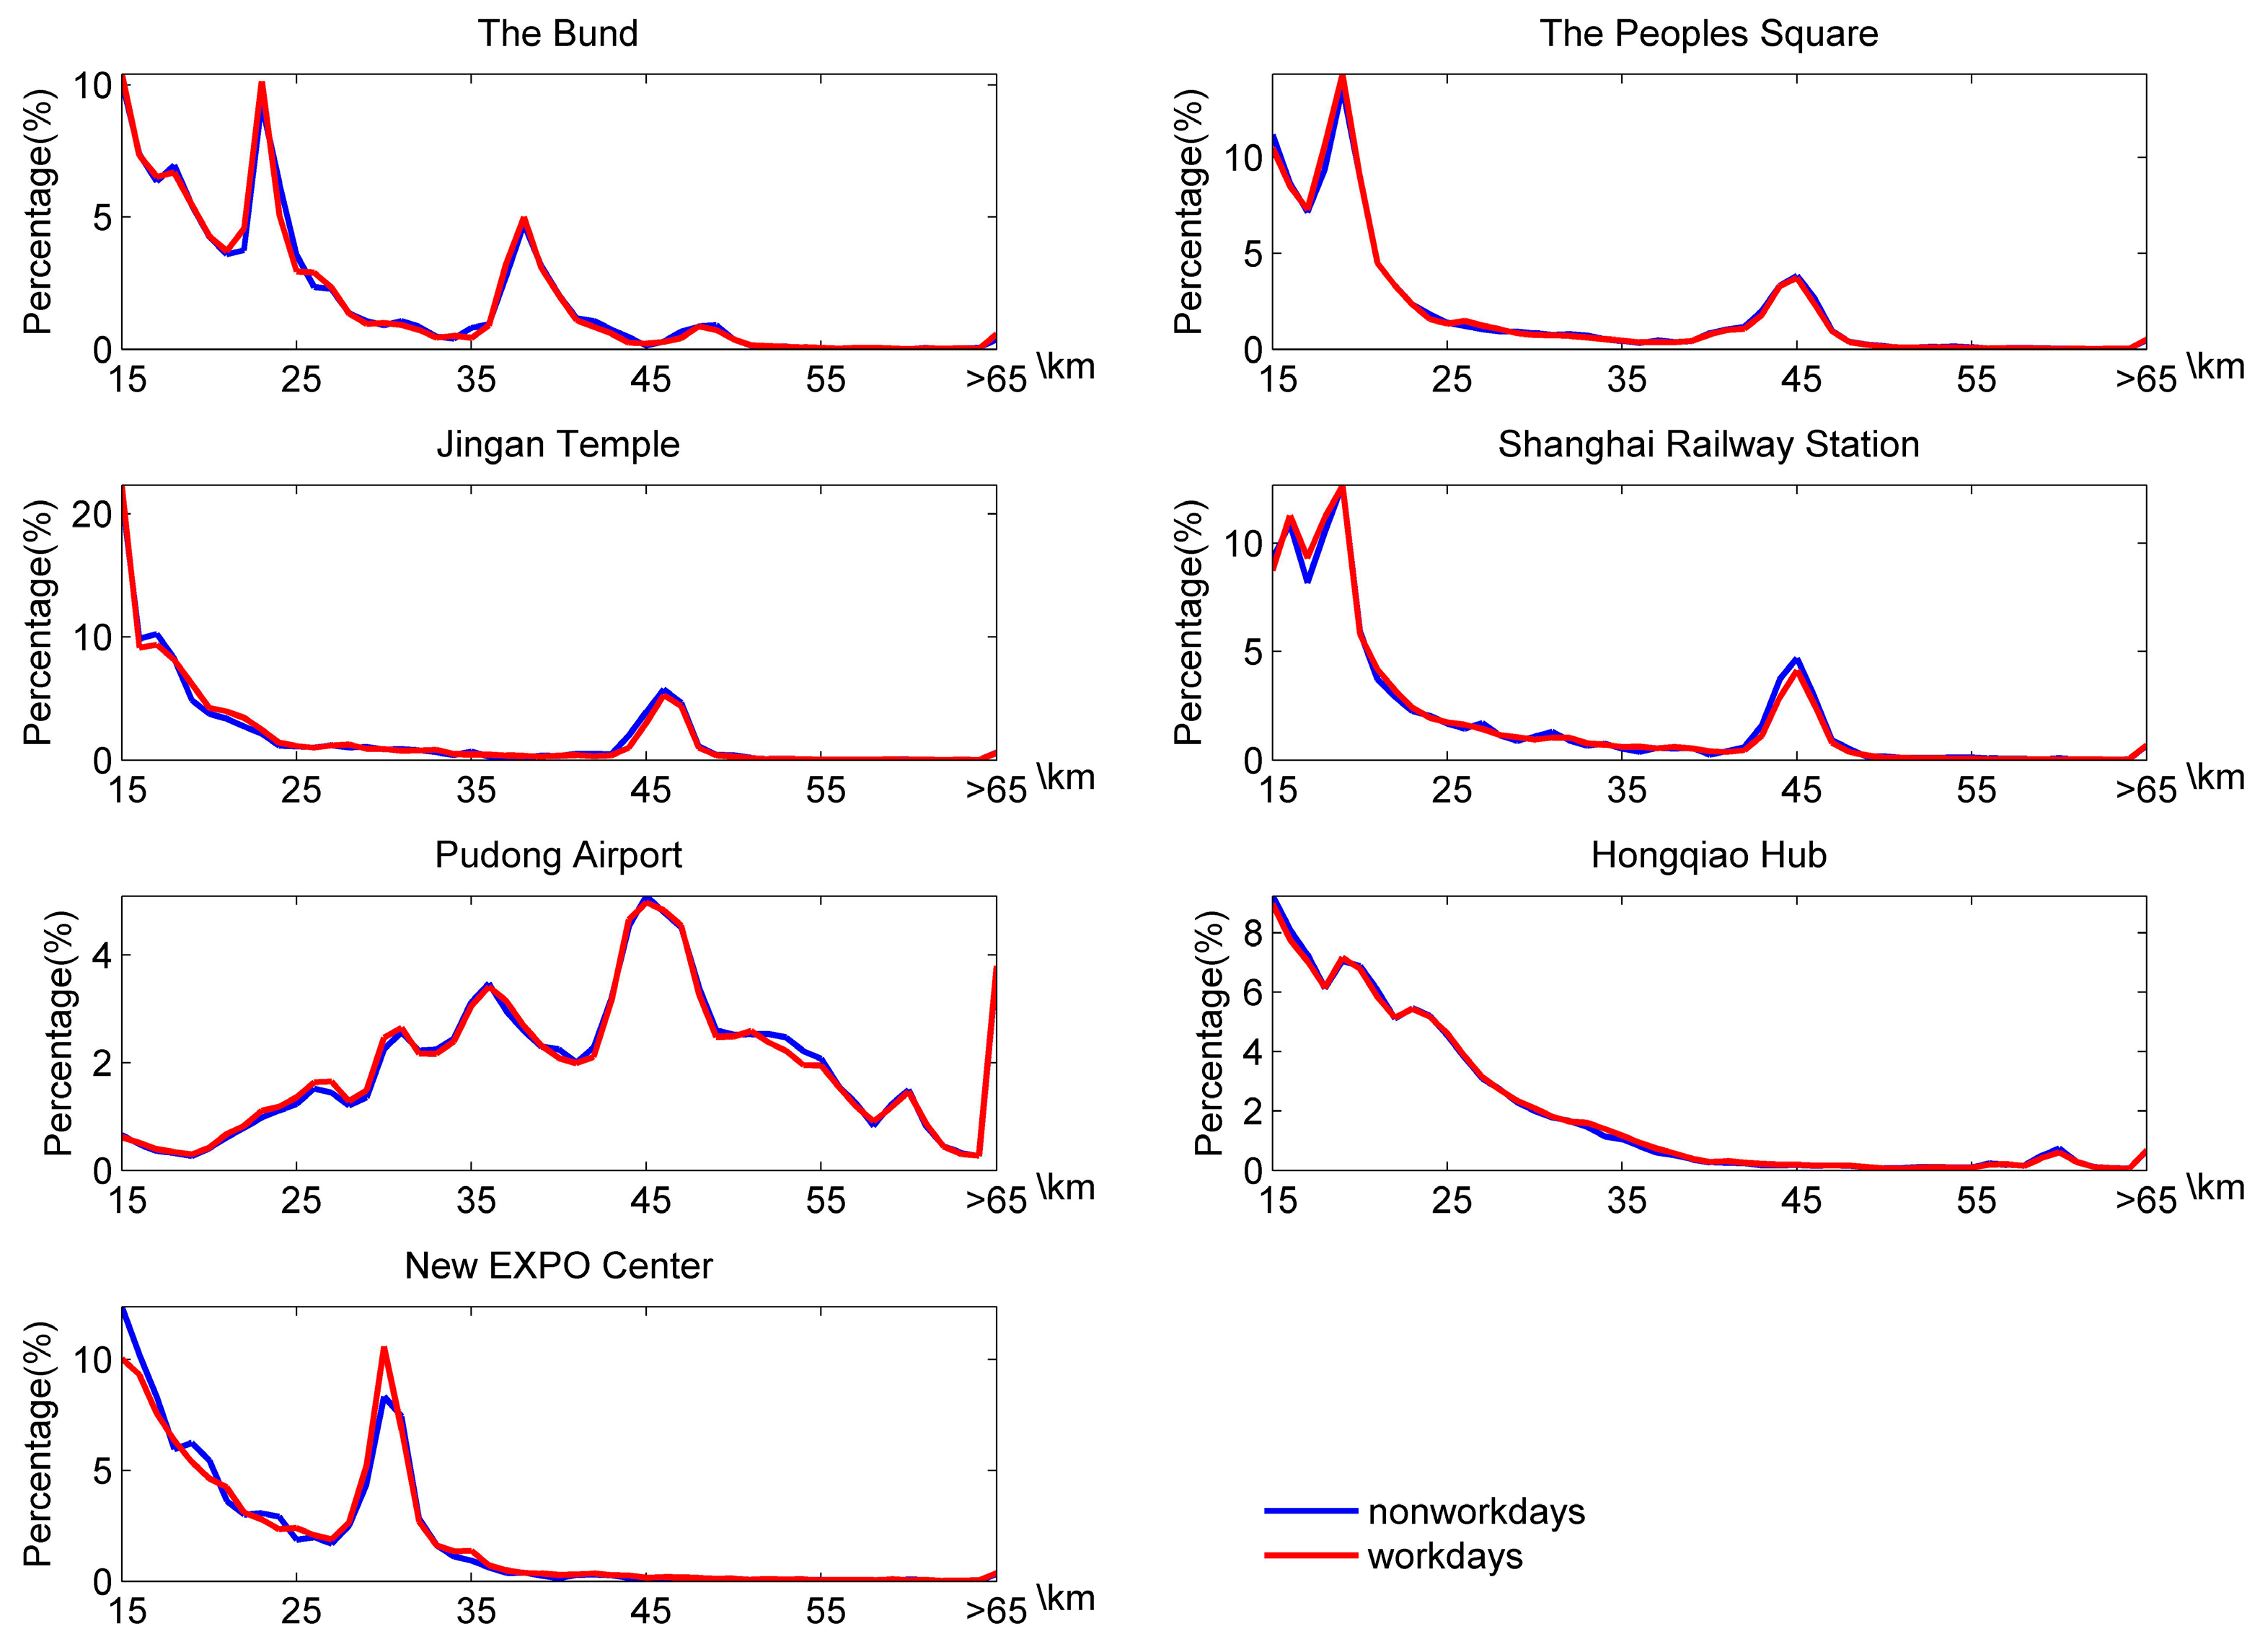
Figure 9.
Distribution of distance traveled when arriving at hotspots in Shanghai, comparing non-workdays with workdays.
Figure 9.
Distribution of distance traveled when arriving at hotspots in Shanghai, comparing non-workdays with workdays.
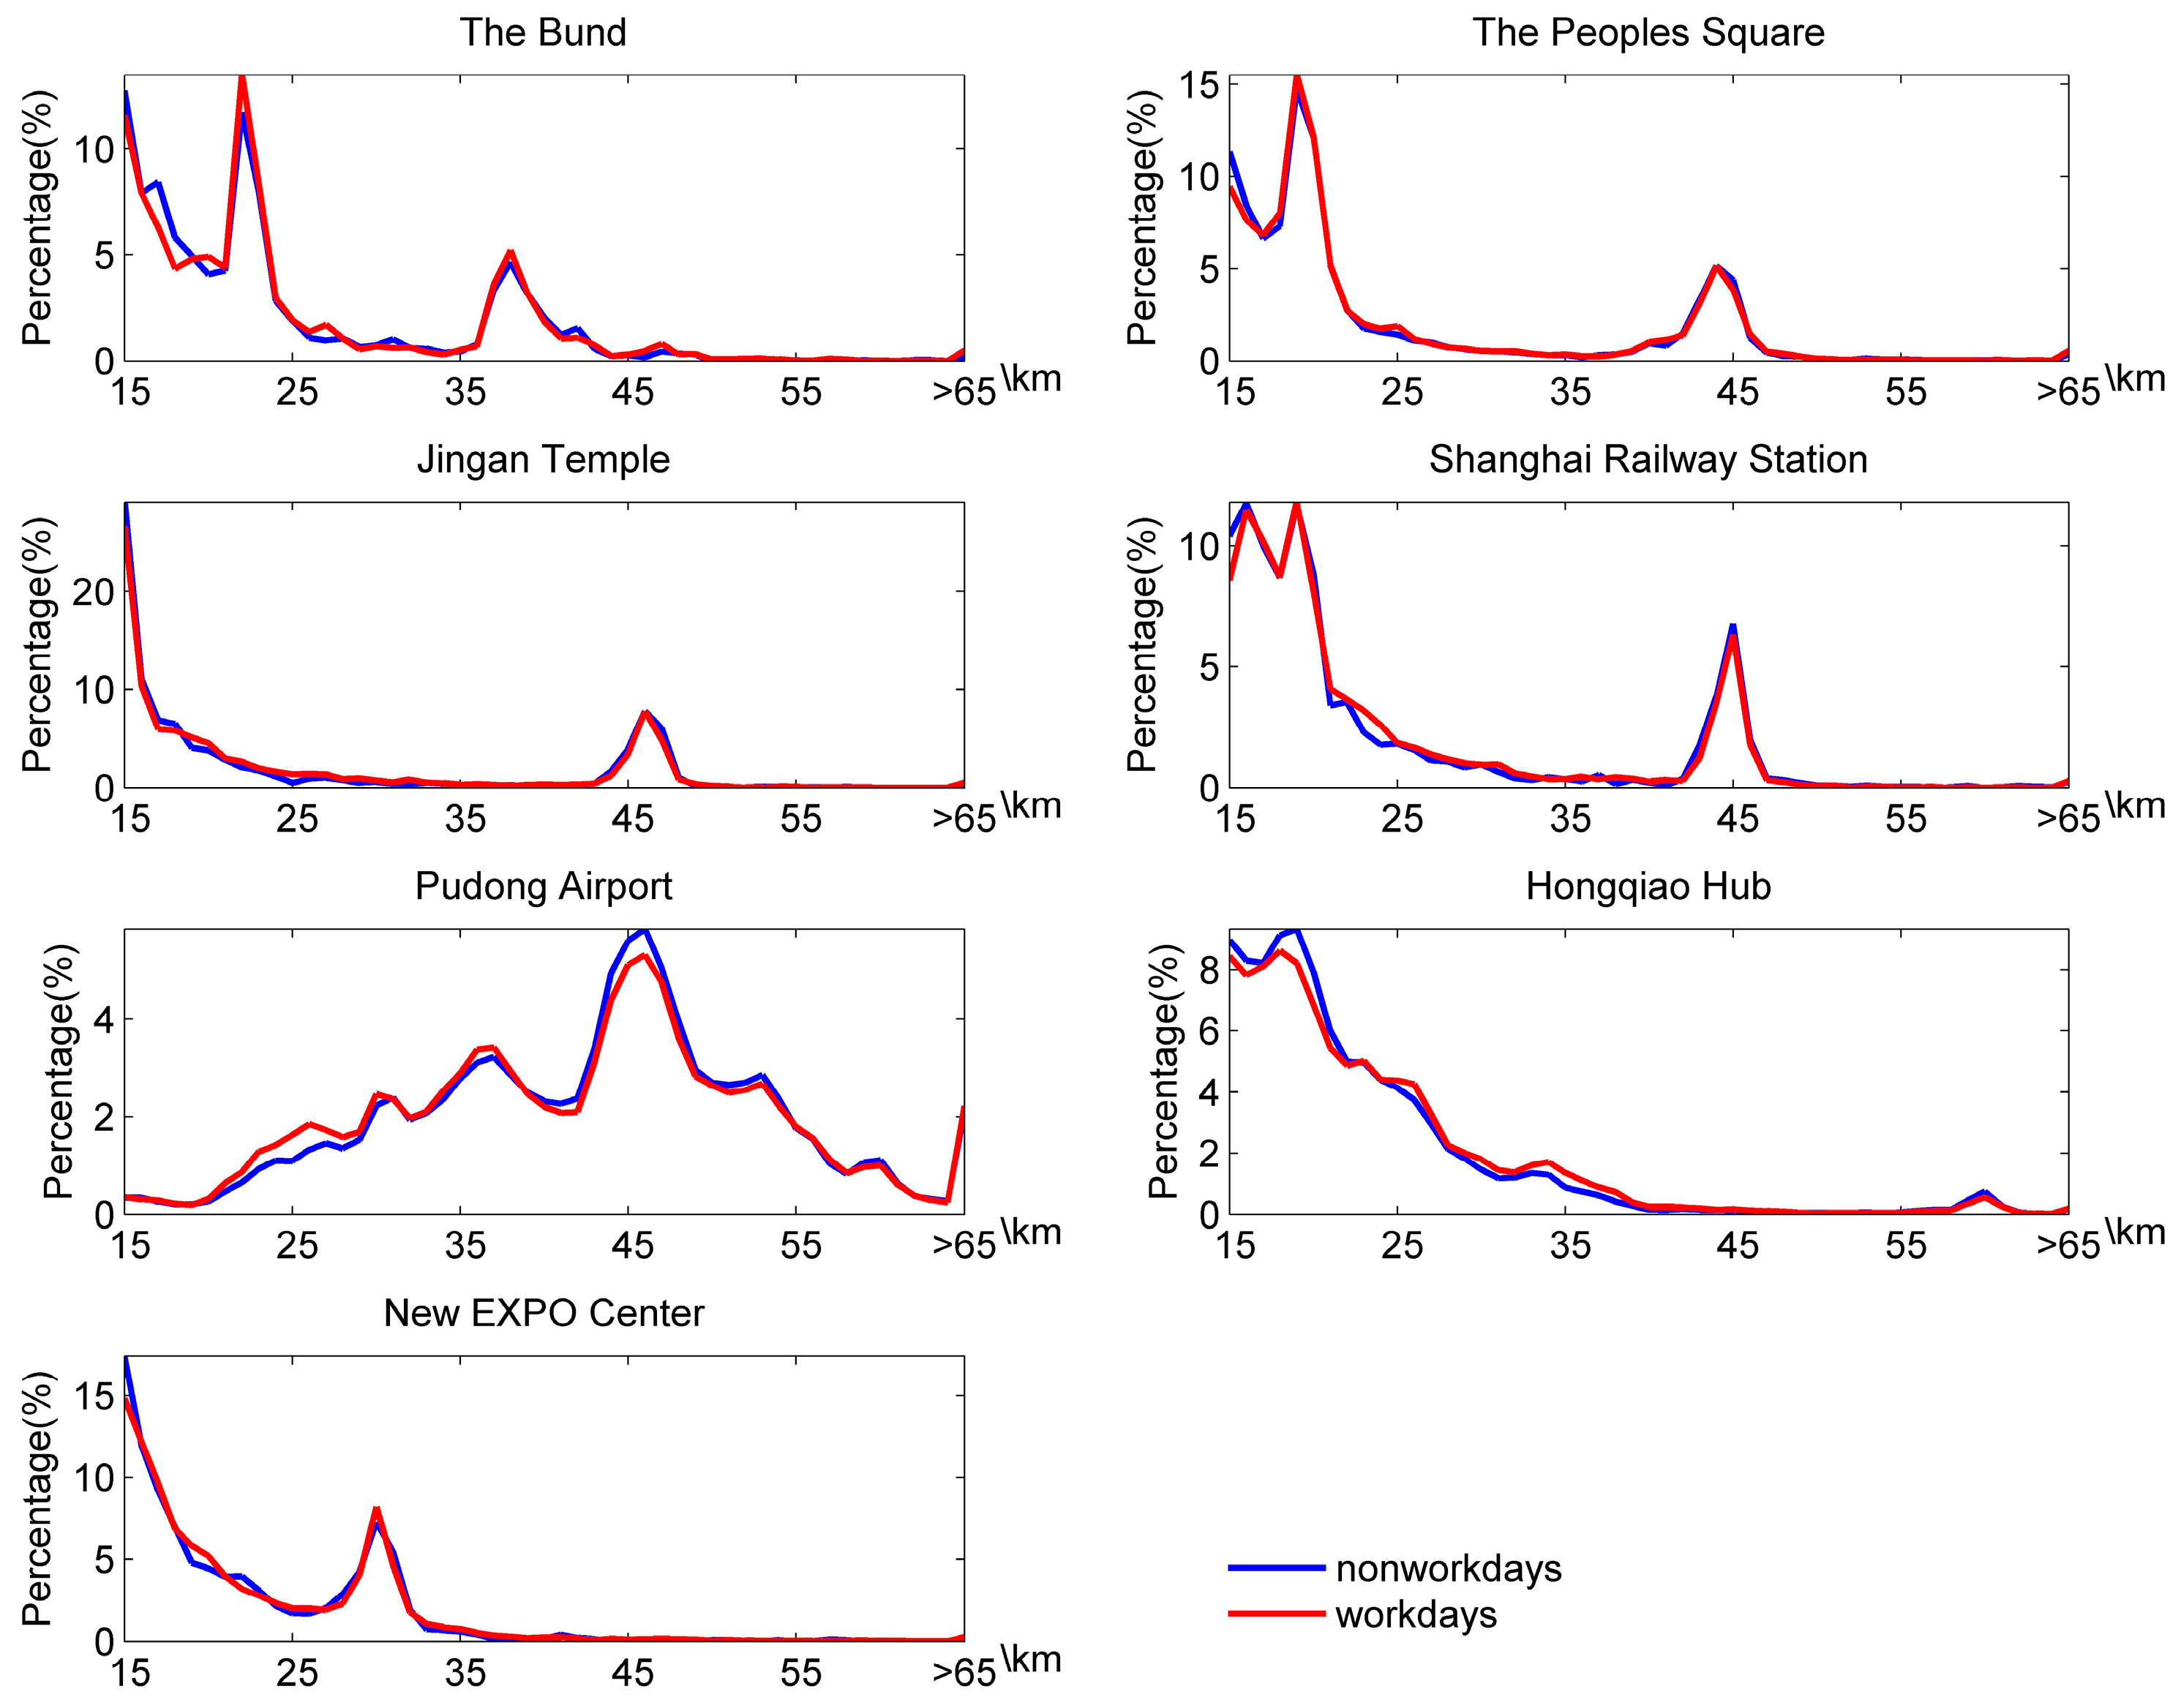
Figure 10.
Visualization of origin to destination (OD) matrix of long-distance taxi travel in Shanghai.
Figure 10.
Visualization of origin to destination (OD) matrix of long-distance taxi travel in Shanghai.


Table 1.
The charging mode for Shanghai taxi (RMB).
| Time | Distance (D) | Sf | SDf | LDf | WFf |
|---|---|---|---|---|---|
| 5:00 a.m.–11:00 p.m. | <15 km | 14 | (D−3) × 2.5 | 0 | T/4 × 2.5 |
| >15 km | 14 | (15−3) × 2.5 | (D−15) × 3.6 | T/4 × 2.5 | |
| 11:00 p.m.–12:00 a.m. 12:00 a.m.–5:00 a.m. | <15 km | 17 | (D−3) × 3.6 | 0 | T/4 × 3.6 |
| >15 km | 17 | (15−3) × 3.6 | (D−15) × 4.7 | T/4 × 3.6 |
Distance denotes the total distance of the taxi trajectory. T is the total time where the taxi velocity is lower than 12.0 km/h.
Table 2.
The mileage and travel times of long- and short-distance taxi trips.
| Index | Long Distance Trips | Short Distance Trips | |
|---|---|---|---|
| Travel Mileage | Value (km) | 6.2910 | 4.4910 |
| Percentage | 58.35% | 41.65% | |
| Travel Time | Value (hours) | 3,061,564 | 9,533,246 |
| Percentage | 24.30% | 75.70% | |
| Average Distance Traveled | Value (km) | 20.5 | 4.7 |
Table 3.
Categories of typical long-distance taxi ride hotspots in Shanghai.
| Hotspot Type | Number | Name |
|---|---|---|
| Transportation | 12 | Pudong airport |
| 1,2 | Hongqiao hub | |
| 6 | Shanghai railway station | |
| Exhibition | 10 | Shanghai new expo center |
| Tourism | 8 | People’s square |
| 9 | Jingan temple | |
| 13 | The Bund |
Table 4.
Comparison of the possibility of long distance taxi trips (P) and the proportion of working and non-working days (R) of hotspots in Shanghai.
Table 4.
Comparison of the possibility of long distance taxi trips (P) and the proportion of working and non-working days (R) of hotspots in Shanghai.
| ID | Name | Type | T | LD | P | LDW | LDNW | R |
|---|---|---|---|---|---|---|---|---|
| 12 | Pudong airport | Departure | 197,298 | 184,894 | 93.71% | 141,514 | 52,259 | 2.70 |
| Arrival | 268,846 | 259,584 | 96.55% | 191,207 | 68,377 | 2.79 | ||
| 1,2 | Hongqiao hub | Departure | 461,086 | 325,220 | 70.53% | 240,336 | 84,884 | 2.83 |
| Arrival | 634,653 | 300,146 | 47.29% | 230,484 | 69,662 | 3.30 | ||
| 6 | Shanghai railway Station | Departure | 151,421 | 28,922 | 19.10% | 21,008 | 7914 | 2.65 |
| Arrival | 68,449 | 17,626 | 25.75% | 13,078 | 4548 | 2.88 | ||
| 10 | Shanghai new expo centre | Departure | 139,885 | 26,328 | 18.82% | 20,971 | 5357 | 3.91 |
| Arrival | 87,139 | 22,213 | 25.49% | 17,912 | 4211 | 4.25 | ||
| 8 | People’s square | Departure | 420,873 | 69,689 | 16.55% | 49,954 | 19,735 | 2.53 |
| Arrival | 176,279 | 39,462 | 22.38% | 28,968 | 10,684 | 2.71 | ||
| 9 | Jingan temple | Departure | 150,111 | 23,630 | 15.74% | 17,895 | 5735 | 3.12 |
| Arrival | 70,221 | 14,450 | 20.57% | 10,753 | 3697 | 4.61 | ||
| 14 | The Bund | Departure | 81,539 | 16,281 | 19.96% | 12,547 | 3734 | 3.36 |
| Arrival | 47,299 | 9084 | 19.20% | 6807 | 2277 | 2.98 |
Table 5.
The peak distance and the concentrative destination of downtown hotspots.
| Hotspot | Peak Distance (km) | Target at Peak Distance |
|---|---|---|
| The Bund | 37–41 | Pudong airport |
| Jingan temple | 44–48 | Pudong airport |
| Shanghai new expo center | 28–32 | Pudong airport, Hongqiao hub |
| People’s square | 42–46 | Pudong airport |
| Shanghai railway station | 44–47 | Pudong airport |
Table 6.
OD matrix between hotspots and other regions.
| Region | Origin | ||
|---|---|---|---|
| Hotspots | Other Regions | ||
| Destination | Hotspots | 154,624 (5.05%) | 632,963 (20.67%) |
| Other Regions | 374,625 (23.57%) | 1,552,071 (50.69%) | |
© 2017 by the authors. Licensee MDPI, Basel, Switzerland. This article is an open access article distributed under the terms and conditions of the Creative Commons Attribution (CC BY) license (http://creativecommons.org/licenses/by/4.0/).
Share and Cite
MDPI and ACS Style
Wu, H.; Fan, H.; Wu, S. Exploring Spatiotemporal Patterns of Long-Distance Taxi Rides in Shanghai. ISPRS Int. J. Geo-Inf. 2017, 6, 339. https://doi.org/10.3390/ijgi6110339
AMA Style
Wu H, Fan H, Wu S. Exploring Spatiotemporal Patterns of Long-Distance Taxi Rides in Shanghai. ISPRS International Journal of Geo-Information. 2017; 6(11):339. https://doi.org/10.3390/ijgi6110339
Chicago/Turabian StyleWu, Hangbin, Hongchao Fan, and Shengyuan Wu. 2017. "Exploring Spatiotemporal Patterns of Long-Distance Taxi Rides in Shanghai" ISPRS International Journal of Geo-Information 6, no. 11: 339. https://doi.org/10.3390/ijgi6110339
Note that from the first issue of 2016, this journal uses article numbers instead of page numbers. See further details here.