Ground Deformation Detection Using China’s ZY-3 Stereo Imagery in an Opencast Mining Area


1
IoT Perception Mine Research Center, China University of Mining and Technology, Xuzhou 221008, China
2
School of Geosciences and Info-physics, Central South University, Changsha 410083, China
3
State Key Laboratory of Remote Sensing Science, Institute of Remote Sensing and Digital Earth, Chinese Academy of Sciences, Beijing 100101, China
*
Author to whom correspondence should be addressed.
ISPRS Int. J. Geo-Inf. 2017, 6(11), 361; https://doi.org/10.3390/ijgi6110361
Submission received: 25 September 2017
/
Revised: 6 November 2017
/
Accepted: 13 November 2017
/
Published: 16 November 2017
(This article belongs to the Special Issue Spatial Environmental Analysis, Informatics, Planning, Restoration, and Management)
Abstract
:Detection and extraction of mining-induced ground deformation can be used to understand the deformation process and space distribution and to estimate the deformation laws and trends. This study focuses on the application of ground deformation detection and extraction combined with digital surface model (DSM), derived from China’s ZiYuan-3 (ZY-3) satellite stereo imagery and the advanced spaceborne thermal emission and reflection radiometer global digital elevation model (ASTER GDEM) data. A district covering 200 km2 around the west open-pit mine in Fushun of Liaoning Province, a city located in Northeast China, is chosen as the study area. Regional overall deformation, typical region deformation, and topographical profile deformation are extracted to analyze the distribution and the link between the regional ground deformations. The results show that the mean elevation has already increased by 3.12 m from 2010 to 2015; 71.18% of this area is deformed, and 22.72% of this area has an elevation variation of more than 10 m. Four districts of rising elevation and three districts of descending elevation are extracted. They are deformed with distinct elevation and volume changes. The total area with distinct rising elevation (>15 m) is about 8.44 km2, and the change in volume is 2.47 × 10⁸ m3. However, the total area with distinct descending elevation (<−10 m) is about 6.12 km2, and the change in volume is 2.01 × 10⁸ m3. Moreover, the deformation in the local mining area has expanded to the surrounding areas. Experiments in the mining area demonstrate that ground deformation, especially acute deformation such as large fractures or landslides, can be monitored using DSMs derived from ZY-3 satellite stereo images.
1. Introduction
Detection and measurement of ground deformation associated with mining operations is an important for hazard management. The deformation appears in various forms such as ground subsidence, collapse, slope sliding, and changes in the position of buildings and landscape [1,2,3]. Further, it is known to continue after the termination of exploitation. Mining disturbances not only appear in the active mining areas but also expand to surrounding areas gradually. Open-pit mining operations involve very large quantities of overburden removal, dumping, and backfilling in excavated areas [4]. Mining activities lead to substantial deformation and an increase in the rate of dump failures and open-pit slope failures. Continuous monitoring of ground deformation under careful scrutiny is necessary to predict and prevent the damages or disasters caused by ground deformation.
Ground deformation is more dramatic in open-pit mining areas than in underground mining areas. As the largest open-pit mine in Asia, the deformation in the Fushun West open-pit mine and the surrounding areas is quite complicated in terms of its operational activities [1]. Geological disasters associated with deformation, such as landslides [5,6], rock slope failure [7,8], subsidence [9], and mining-induced seismicity, all occurred in this area [1]. Deformation monitoring using differential interferometric synthetic aperture radar (DInSAR) is limited here, because rapid change or large deformation in an abruptly morphing area could lead to a failure to estimate the correct displacement for the temporal decorrelation and phase unwrapping of SAR images [10,11,12,13,14,15,16,17,18]. Approaches with the multiple-aperture, InSAR-based small baseline [5,19,20], using image SIFT features for landslide monitoring [6], or using 3D laser scanning, have been improved for such types of large deformation detection [15]. Moreover, the traditional global positioning system (GPS) observation needs many distribution points, and points often suffer damage due to the severe deformation of their surfaces [8,21,22].
Satellite photogrammetry monitoring can provide a synoptic view of the deformation field affecting the area of interest, as well as its spatio-temporal evolution, especially with acute surface or landform changes. Stereo images can provide visible features and the 3D information of the surface using the digital surface model (DSM) or the digital elevation model (DEM) derived from the stereo images. DSMs derived from high-resolution stereo satellite images have been used for detailed landslide hazard assessment [23] and 3D gully monitoring and extraction [24,25]. A multiple pairwise image correlation technique has been used for detecting and monitoring slow-moving landslides [26]. Historic DEMs are constructed for geomorphic change detection and analysis [27].
The Chinese ZiYuan-3(ZY-3) surveying satellite, which was launched on 9 January 2012, is the first civilian high-resolution stereo mapping satellite of China [28]. Many experiments demonstrated the effectiveness of DSM and the ortho map, derived from ZY-3 satellite stereo imagery and the geometry model, because their planar and vertical accuracy is higher than 3 and 2 meters [28,29,30,31,32,33,34,35], respectively. Additionally, ZY-3 images are also used as reference maps in land cover extraction or in changes related to high accuracy [36,37]. In previous studies, the DSM derived from the ZY-3 stereo images was used to measure morphologic parameters and perform quantitative morphological analysis on gullies [25]. The generation of different DSMs and their comparison over time makes it possible to understand how the ground is moving in an up-down direction, which is also an important aspect of topography monitoring for mining areas. However, the capabilities of ZY-3 satellite stereo imagery in the measurement of active mining areas still need to be verified. Regarding the complicated deformation in the mining area, new analysis methods and experiments are needed. Not only can the external DEM be used to improve the quality of DInSAR measurements, the updated DEM’s time-series from Chinese ZY-3 satellite stereo imagery can provide deformation, which is different in scale to DInSAR techniques, as it will improve our knowledge of the whole deformation of the area. However, it is unknown what kind of deformation, or how large the deformation is, that can be detected based on the DSMs derived from ZY-3 imagery, and the accuracy of the deformation parameters are also unknown.
In this study, we propose an extension and the potential of Chinese ZY-3 satellite stereo imagery for ground deformation detection and extraction in mining areas. Ground deformations are extracted and analyzed using DSMs derived from ZY-3 satellite stereo images in the Fushun open-pit mine and its surrounding area. We intend to evaluate the capability of ZY-3 stereo mapping and monitoring in the active mining areas. Depending on periodic observations, time series DSMs and accompanying surface changes are detected. The uncertainty of the extracted deformation and the accuracy of DSMs from time series ZY-3 and time series DSMs is analyzed based on the results. The rest of the paper is organized as follows: Section 2 is the introduction of the study area and data used in processing. Section 3 presents the method for ground deformation detection and extraction using DSMs derived from ZY-3 satellite stereo images. Section 4 describes the results, and Section 5 discusses the results of the study. Three kinds of deformation, consisting of regional overall deformation, topographical profile deformation, and typical region deformation, are extracted and analyzed. Conclusions and future perspectives are given in Section 6.
2. Study Area and Data
2.1. Study Area
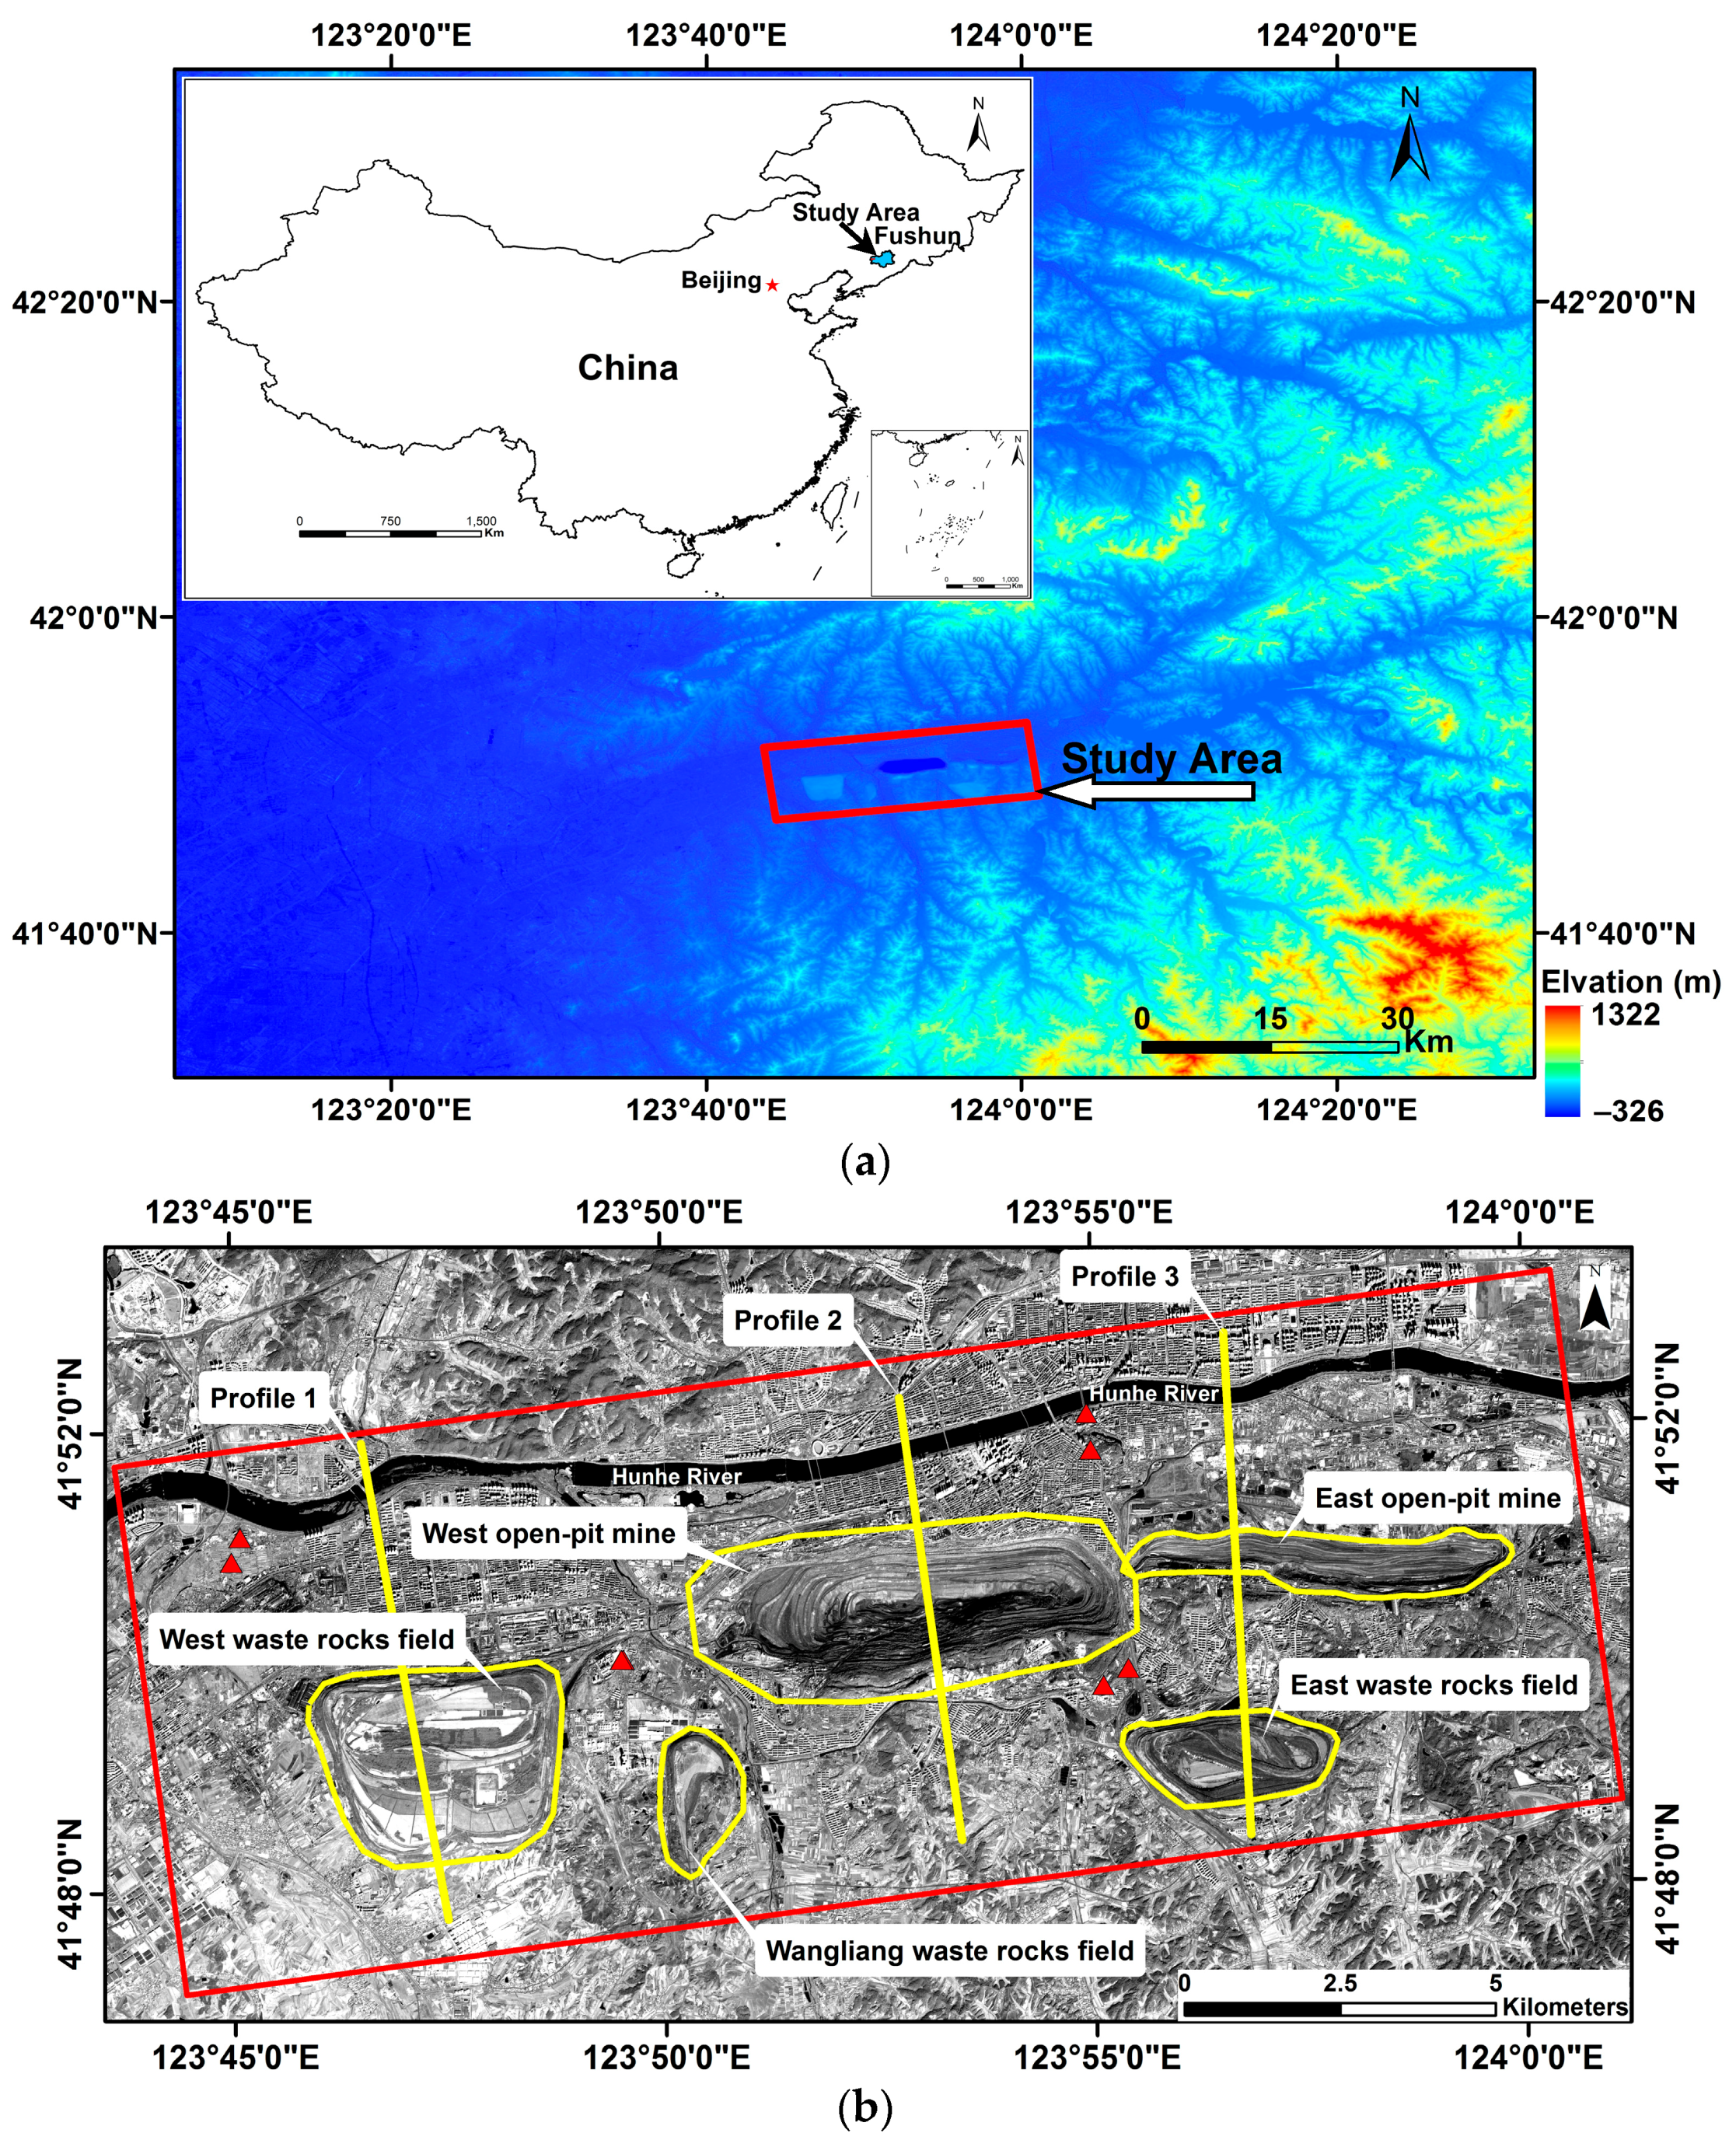
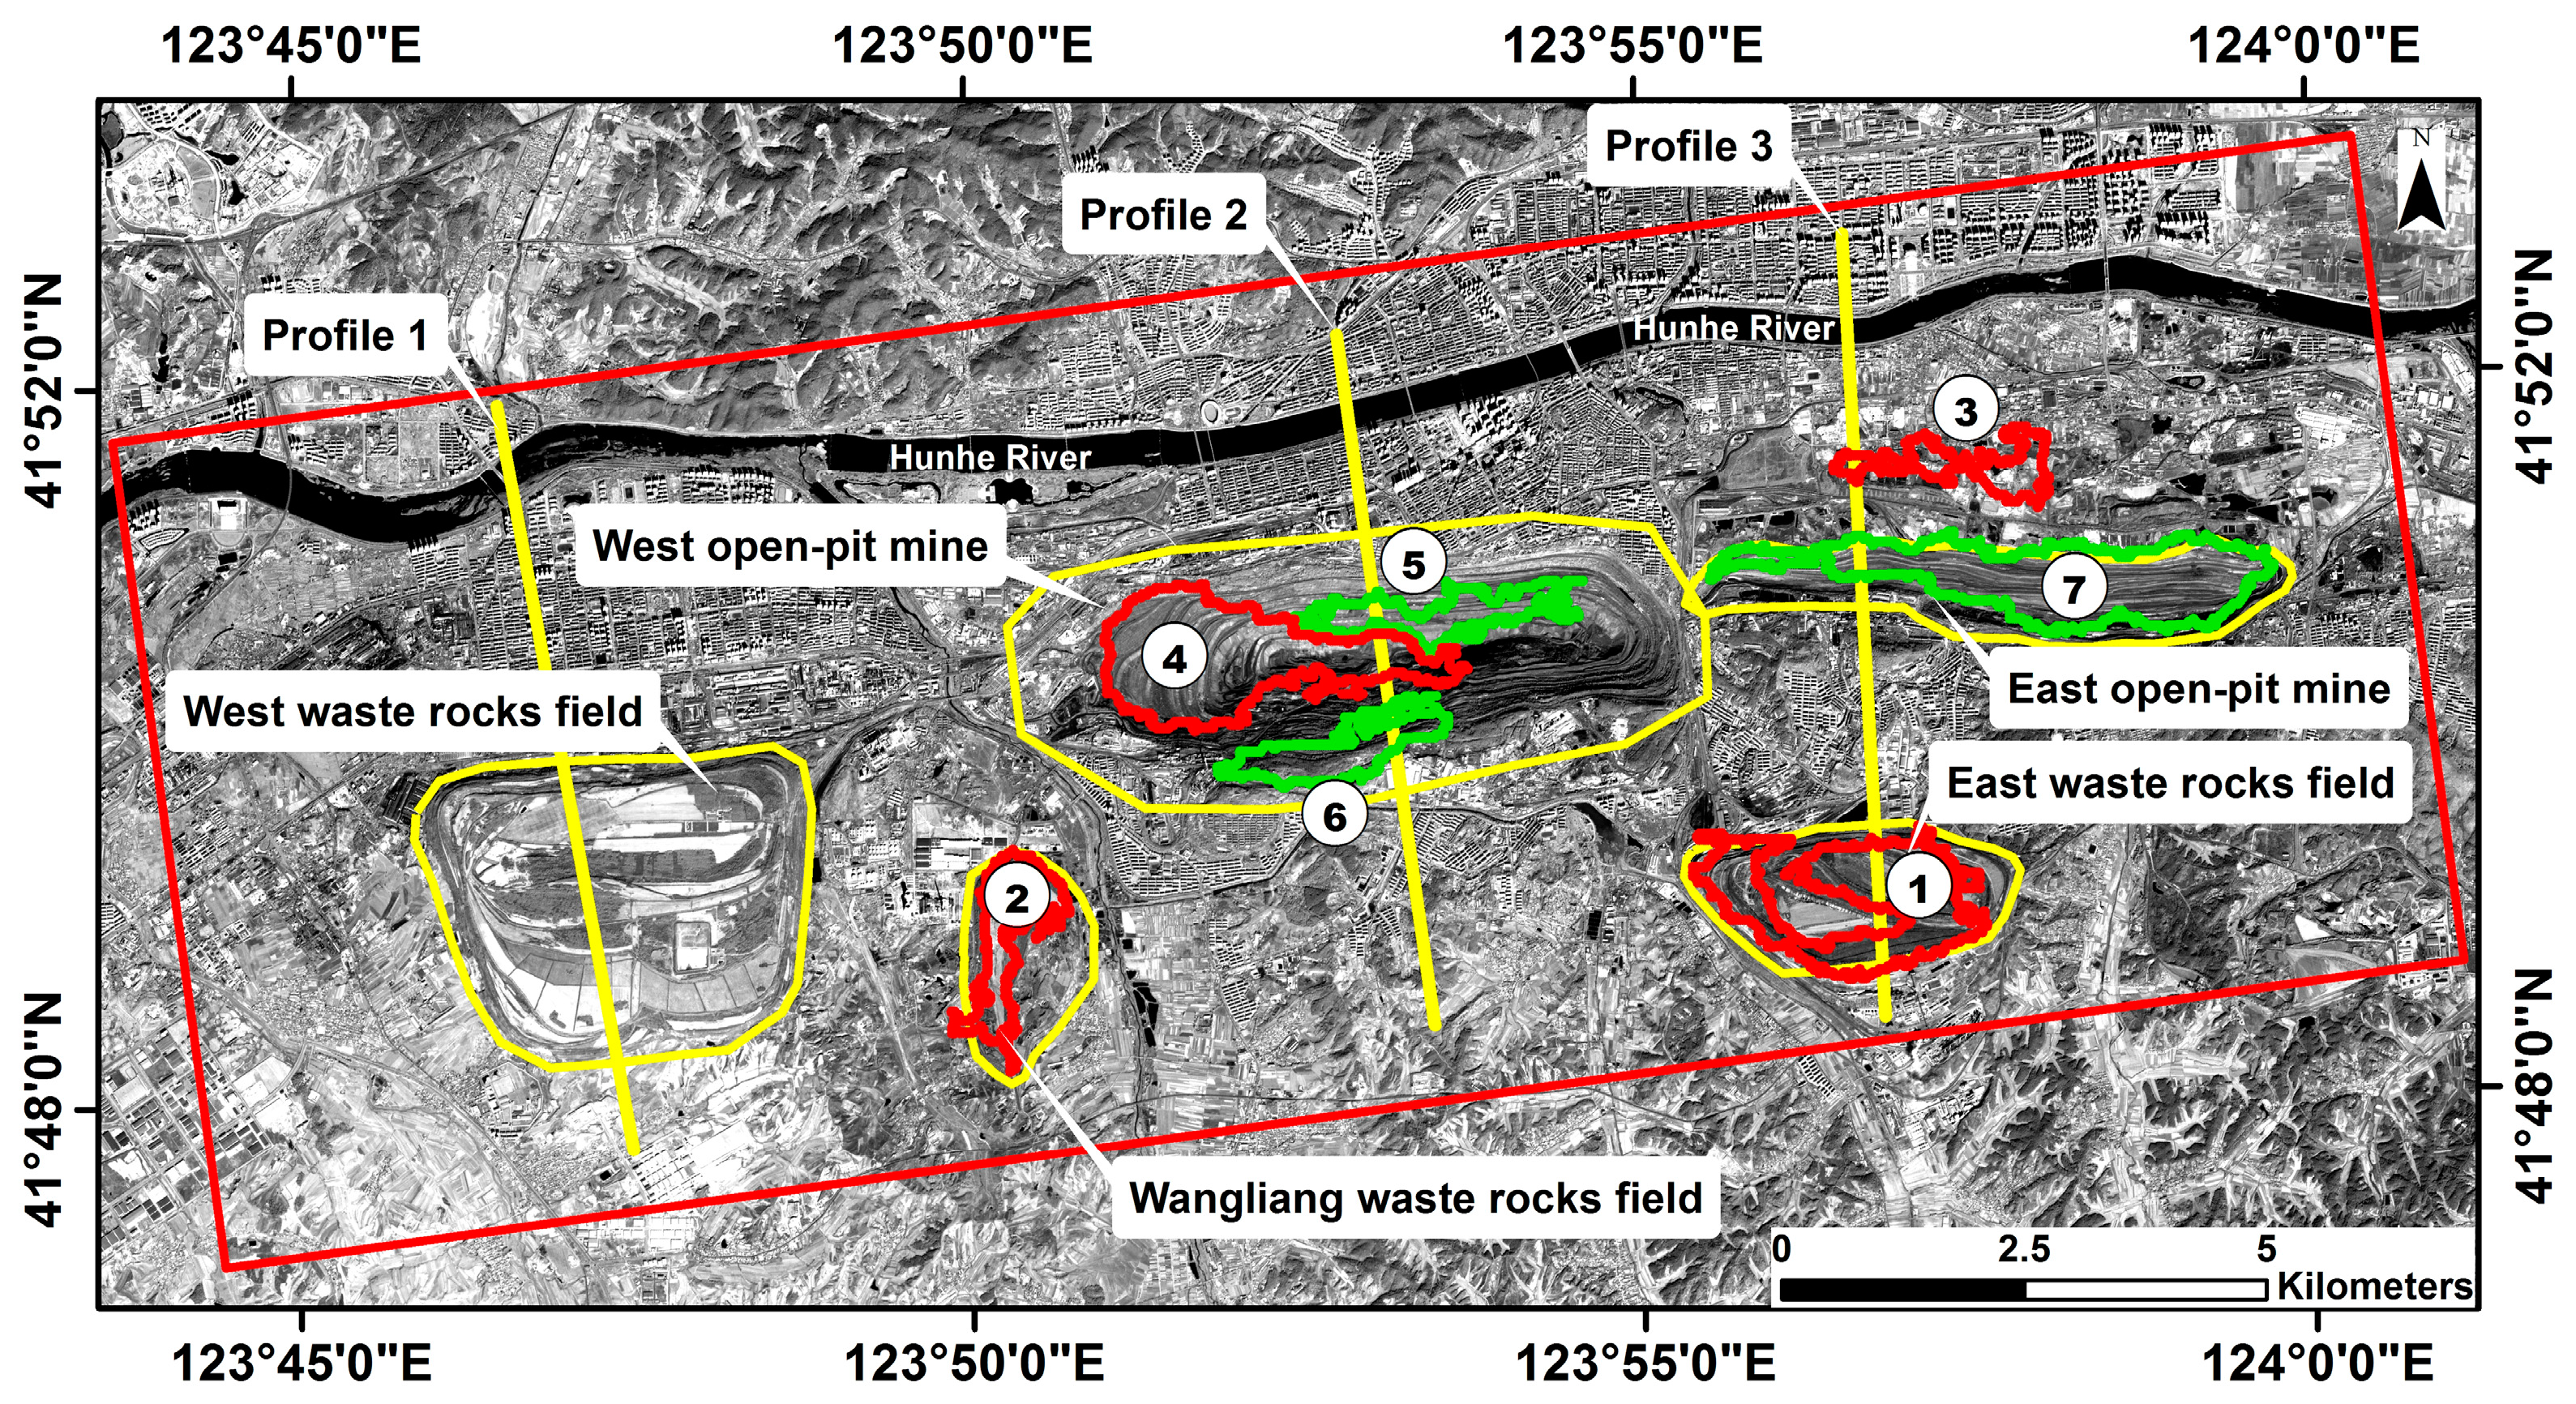
The study area, covering about 200 km2, is located in the Fushun coalfield in Fushun City, which lies 47 km east of the capital city Shenyang in Northeast China (Figure 1a). The Fushun coalfield is in a relatively small east-west-trending exposure of Mesozoic and Cenozoic rocks surrounded by Precambrian terrane [38]. The principal coal beds of the Fushun coalfield are low-sulfur subbituminous and bituminous in rank, are of limnic origin, and are contained in the 55-m-thick Eocene Guchengzi Formation [38]. The outcrops consist primarily of Mesozoic volcanic tuff, basalts, and weak interlayers (fractured zone), whereas the underlying bedrock is made up of Archaean granitic gneiss [39]. Fushun coalfields developed in the Hunhe fault of the Fushun basin [39]. The Hunhe River passes through the central part of the basin (Figure 1b). Figure 1 indicates the location of the study area in China and the distribution of typical regions.
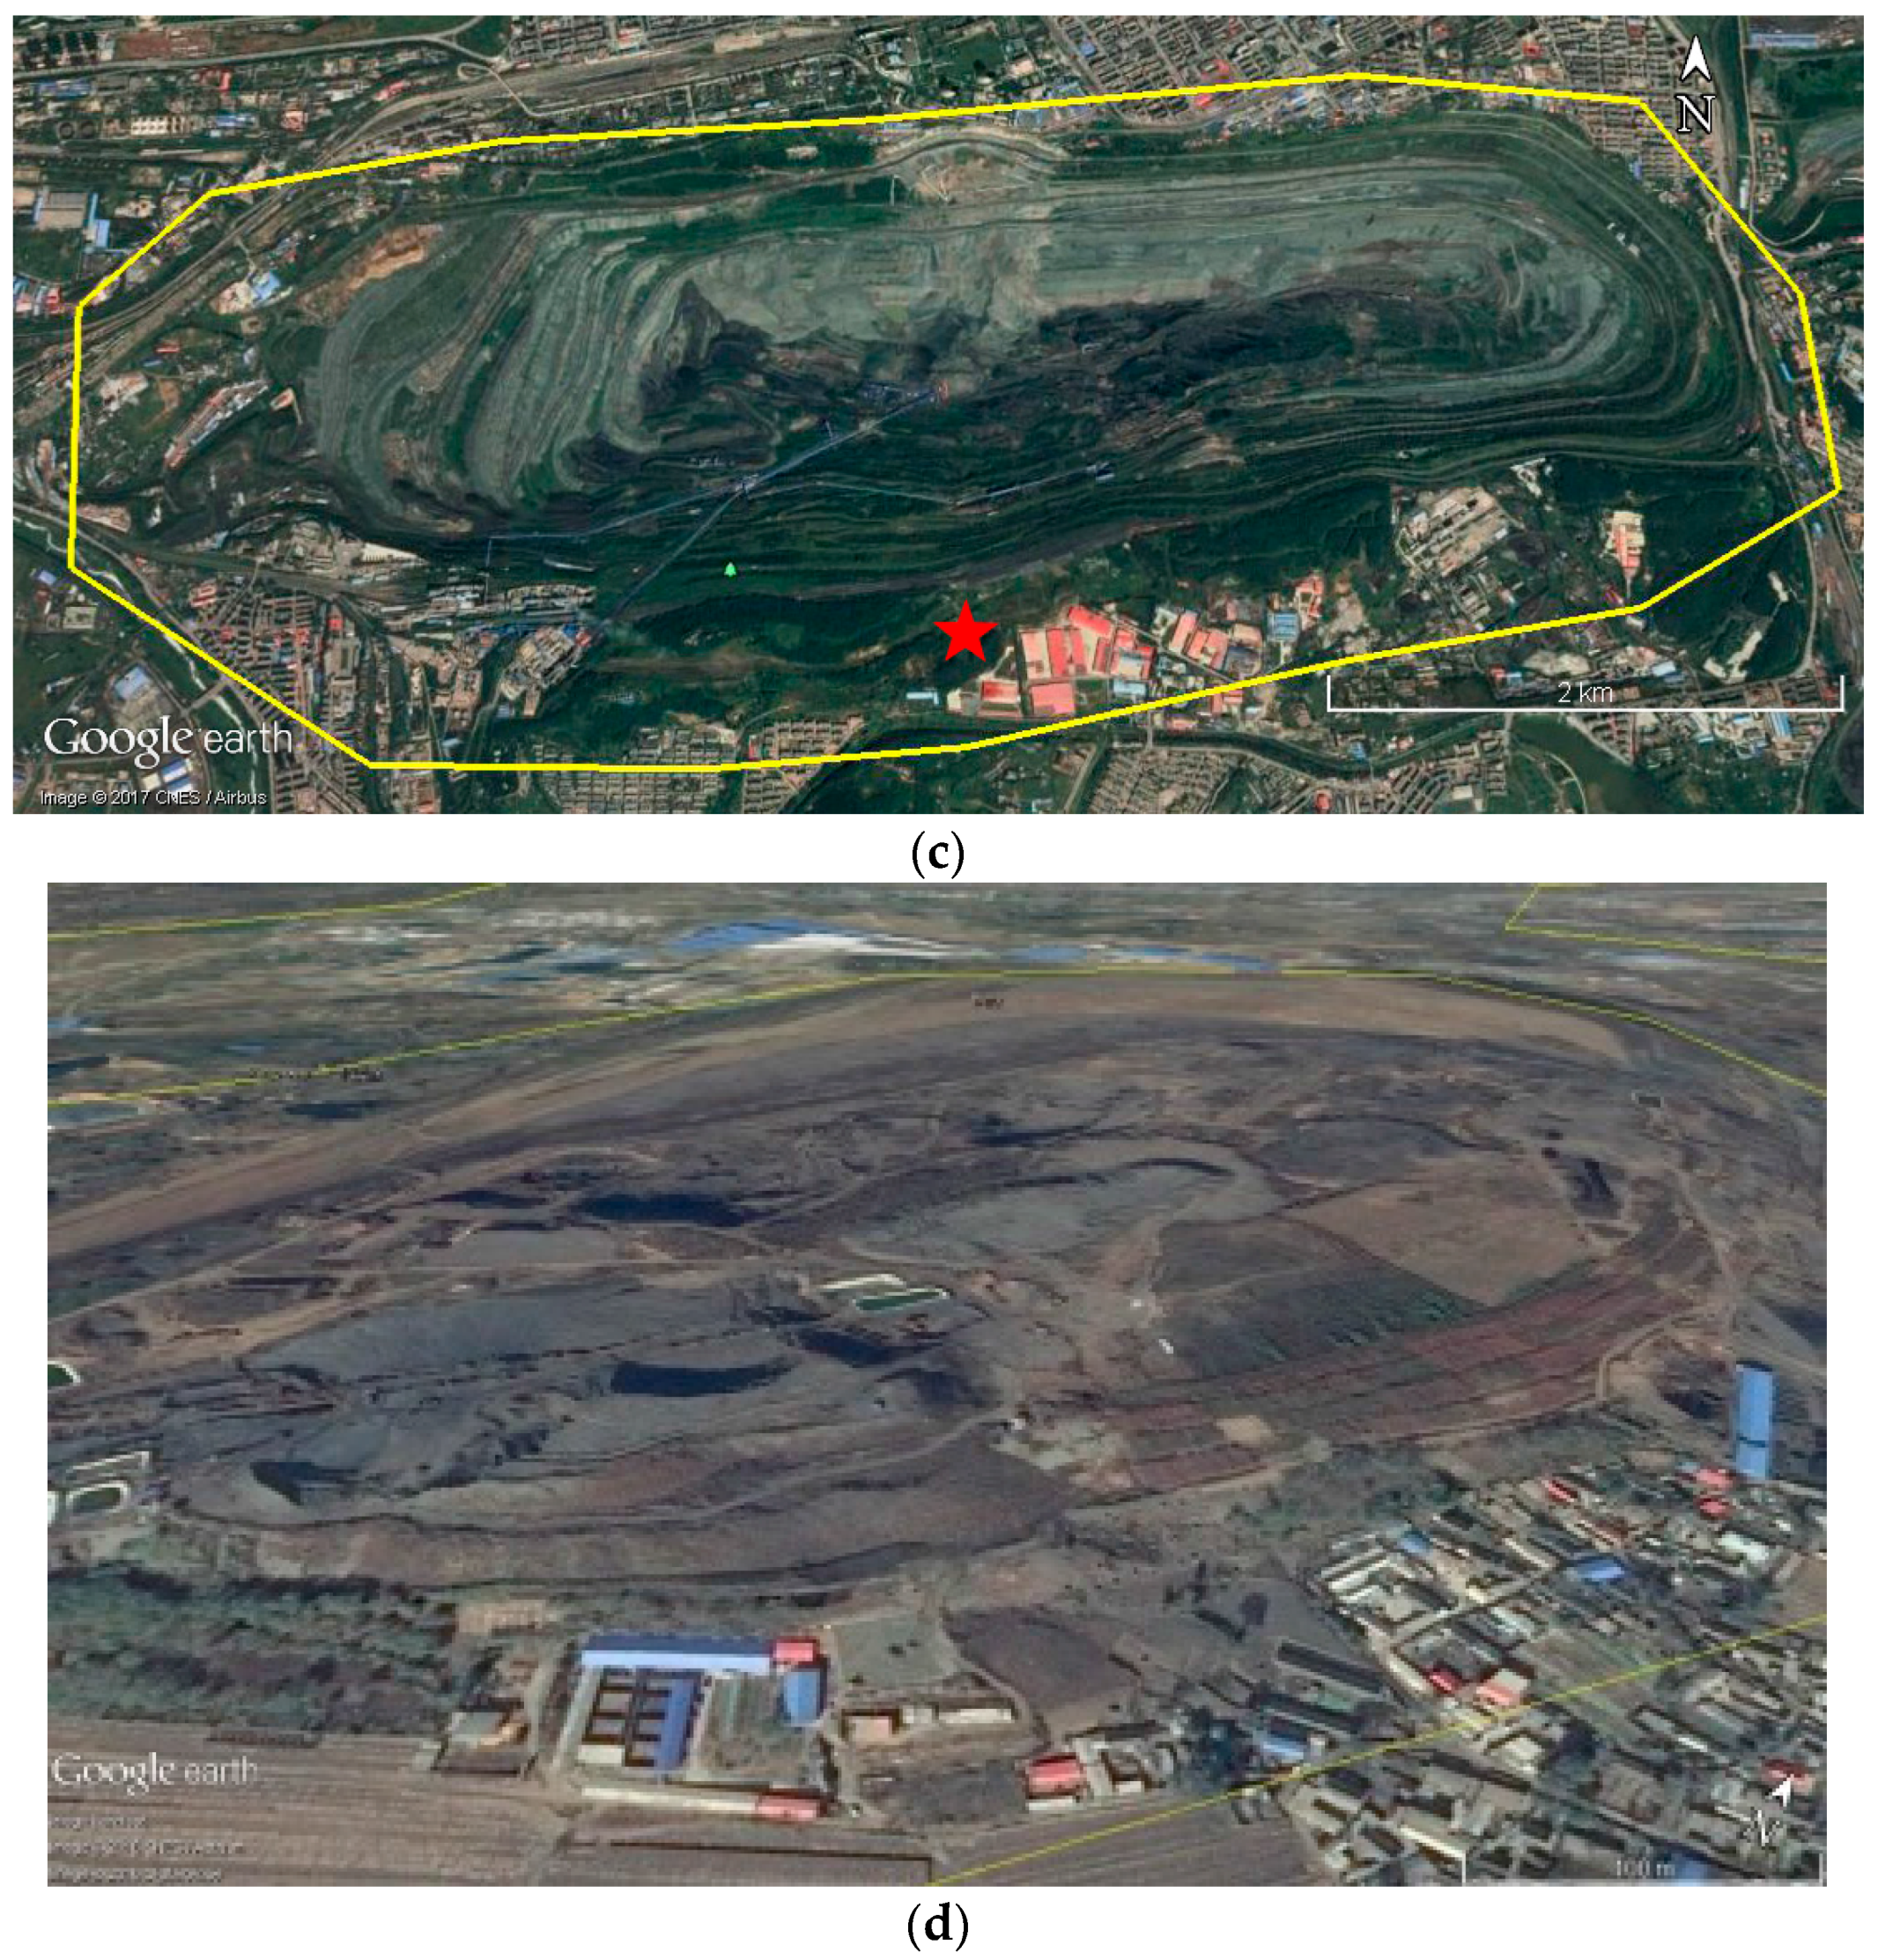
In the study area, there are five typical regions, including two open-pit mines and three waste rocks fields. Two open-pit mines, the west open-pit mine (Figure 1c) and the east open-pit mine, are the mining open-pit stopes. Three large waste rocks fields, the west waste rocks field, the Wangliang waste rocks field (Figure 1d), and the east waste rocks field, are all around the open-pit mines. The west open-pit mine has a coal mining history of more than 100 years and has made important contributions to the economic development of China. During its hundred years of mining, the west open-pit mine has been the largest open-pit coal mine in Asia, with a length of 6.6 km from east to west, a width of 2.2 km from north to south, and an average depth of approximately 500 m [6]. The east open-pit mine was a large mining field covering about 1.8 km2 before 2001. However, after the production of coal seam roof oil shale in 2001, the mining range and scale kept increasing year by year [1]. Coal mining waste rocks are piled up in the three large waste rocks fields.
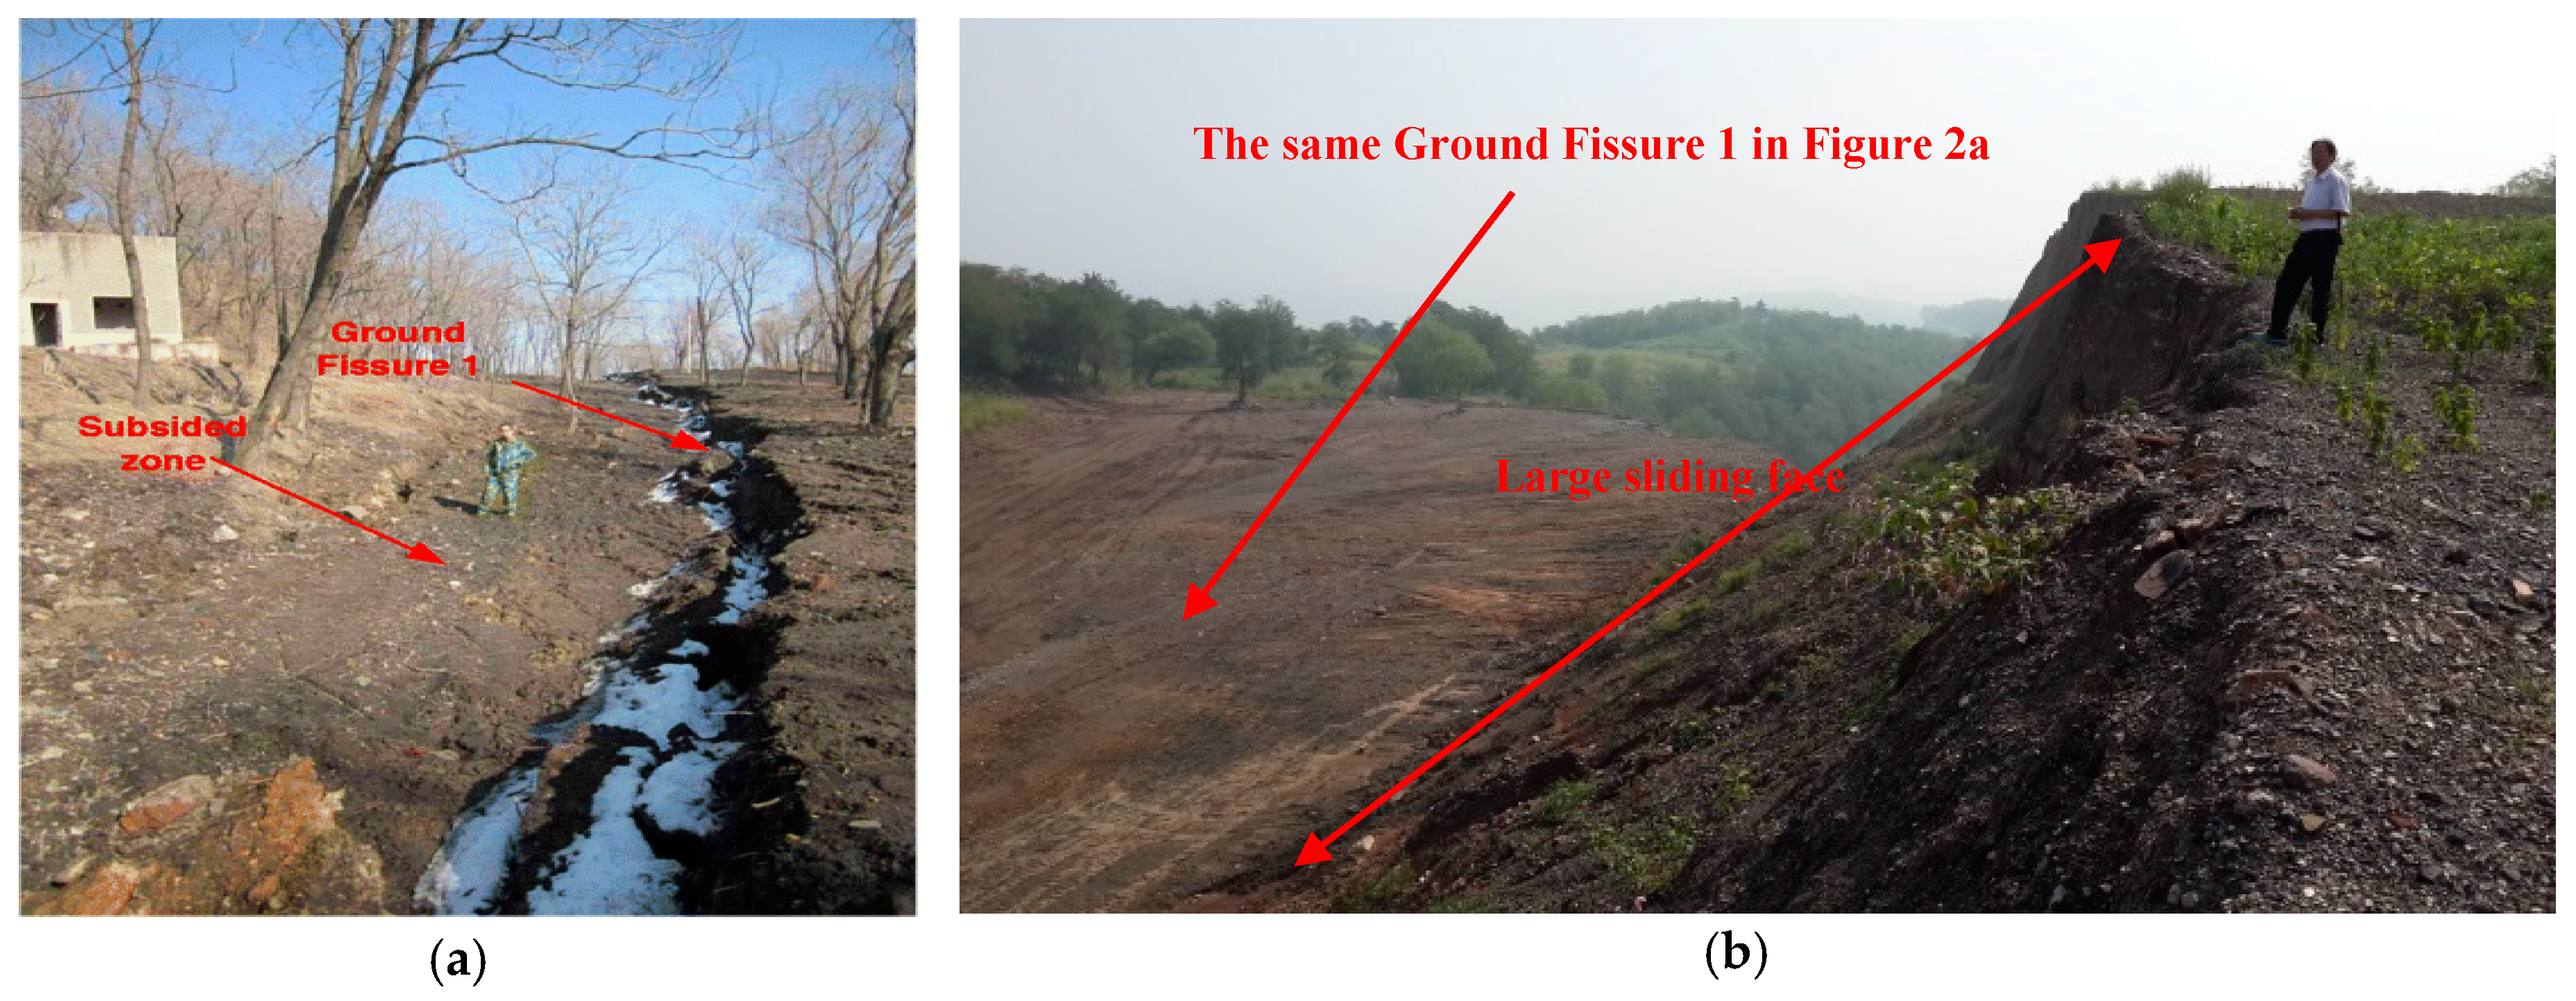
Due to extensive mining and inadequate treatment of coal mine waste rocks, ground deformation including landslides, subsidence, surface collapse, and fracture has occurred since the 1990s [5,6,7,8,9]. The pentacle in Figure 1c indicates the location of Qiantai Mountain in the southern slope of the west open-pit mine, where a ground fracture with a length of about 3.1 km has appeared since 2010 [6]. The height of the scarp measured on 16 March 2013 was about 1.6 m [8,22] (Figure 2a). In June 2014, the fracture reached a width of 40 m with a maximum drop of more than 18 m [6]. Figure 2b is a picture of the fracture on 16 July 2014. The rapid displacement and ground deformation led to the uplift of the bottom and subsidence of Qiantai Mountain, as well as the damage to the surrounding environment. Moreover, the large and rapid ground deformation led to trouble in the phase unwrapping in the use of DInSAR [5,6], so this study attempts to verify the capabilities of measuring and monitoring using the Chinese ZY-3 satellite stereo imagery and derived DSMs in mining areas. Due to the backfilling process in the west open-pit mine and mining in the east open-pit mine, time series of stereo image-based DSMs is applied for the detection, extraction, and quantification of ground deformation in this area.
2.2. Data
Table 1 shows the datasets including ZY-3 surveying satellite stereo images and ASTER GDEM used in this study. The ZY-3 surveying satellite, which was launched on 9 January 2012, is the first civilian high-resolution stereo mapping satellite of China. It is equipped with two types of pushbroom imaging sensors for the acquisition of multispectral and panchromatic images, respectively [28]. The resolution of multispectral images is 5.8 m. However, the resolutions of panchromatic images are different for the different element sizes of the charge coupled device (CCD). The nadir image is 2.1 m, and forward and backward images are 3.6 m. The rational polynomial coefficients (RPC), which are built on the WGS84 geocentric coordinate system, are delivered together with the image data [28,29,30,31]. Panchromatic images are used for stereo mapping in this study. The forward-nadir-backward stereo images acquired at three different times are selected to derive DSMs in the mining area, and then the changes in DSMs with time are calculated. The images were acquired on 24 December 2013, 21 April 2014, and 24 October 2015.
ASTER DEM datasets (ASTGTM2_N41E123, ASTGTM2_N41E124, ASTGTM2_N42E123, and ASTGTM2_N42E124), downloaded from http://gdem.ersdac.jspacesystems.or.jp [40], are used as the benchmark of comparison with ZY-3 imagery-derived DSMs at different times.
3. Method
A combined data processing procedure using satellite stereo images to obtain the ground deformation information in the mining area is shown in Figure 3. The first step is the DSM generation from ZY-3 stereo images, which makes height comparison and feature extraction possible. GPS points are used for the refinement of RPC and precision validation. The second step is detection and extraction of deformation. By the DSM’s comparison over time, deformation in the up-down direction can be detected and extracted. Then, three kinds of deformation, including regional overall deformation, typical region deformation, and topographical profile deformation, are extracted and analyzed.
3.1. DSM Derived from ZY-3 Stereo Images
DSM derived from ZY-3 stereo imagery is the interpolation of measurements on matching points automatically recognized from stereo images with the sensor model expressed by RPC [29]. As the process shows in Figure 4, the matching points of each image pair are produced using the LPS tool of ERDAS IMAGE 2013 of Intergraph Corporation, and the initial RPC, as tie points. We also pinpoint the GPS points on the images as ground control and check points. Since the ZY-3 satellite image width is about 52 km [28], only one single scene of stereo images is used in this study. According to the reference [35], four or five points in a scene range will be enough for the adjustment; the correction accuracy will be just improved slightly with an increase in the number of GCPs. Thus, in the experiment, seven points are used as the control points and eleven points are used as the check points, which are all acquired by GPS RTK measuring in May, 2016. The vertical measurement accuracy is about 0.01 m. Considering the obviousness and accessibility of ground points, most of them are located at the road intersection, the corner of the road or farmland, and so on.
Then, the RPC is refined with the affine transformation model through block adjustment with high-accuracy ground control points and tie points using the method in a previous study to improve the quality and evaluate the accuracy of DSM [30]. The adjustment process consists of constructing and solving the error equation based on the initial RPC, which establishes the function between the image space and object space. The error equation is as follows:
where Fx and Fy are the error corrections; (x, y) is the image coordinates of GCPs; a0, b0 are the offset coefficients; a1, b1 are the coefficients of line direction; a2, b2 are the coefficients of the column direction; and line and sample are back-projected image coordinates by the object coordinates of control points using initial RPC. With the least squares solution of the image plane refinement model of the rational function model, the coordinates of each encryption point are obtained. Then, a DSM with 10 m spatial resolution is derived using the forward intersection base on the refined RPC. The root mean square error of the surface elevation from the DSM is evaluated by the GPS check points.
Fx = a0 + a1·sample + a2·line + sample − x = 0
Fy = b0 + b1·sample + b2·line + line − y = 0
Fy = b0 + b1·sample + b2·line + line − y = 0
3.2. Detection and Extraction of Deformation
The difference between each DSM and the ASTER GDEM is used to quantify the change in elevation in each grid [27]. It is calculated as follows:
where ΔHi,j is the elevation change value in the grid location (i, j), H(t2)i,j is the (i, j) elevation value of the later DSM on time t2, and H(t1)i,j is the (i, j) elevation value of the early DSM at time t1. The results represent reductions in elevation as negative values and increases in elevation as positive values. Through the recognition of elevation variations, the districts of deformation are detected and extracted automatically. Comparisons of regional, typical regions, and topographical profiles are used to analyze the deformation distribution and trends.
ΔHi,j= H(t2)i,j− H(t1)i,j
Since the ASTER GDEM has a spatial resolution of 30 m, DSMs derived from ZY-3 imagery are resampled to the same spatial resolution with ASTER GDEM using bilinear interpolation. After co-registering spatial resolution and location, the DSMs from ZY-3 images are compared with the ASTER GDEM used as a reference. Based on gridded models, regional overall deformation shows the entire deformation distribution in the study area. It is constructed by subtracting the elevations of ASTER GDEM from the DSMs from ZY-3 images according to the time series.
Typical region deformation is used for statistical analysis of elevation changes within a particular local area, especially in the active mining area and the piling field in Figure 1b. According to the threshold of elevation change indicated in Equation (3), the deformation district, as well as the boundary and area of deformation, is extracted:
where δ↑ and δ↓ are the thresholds of elevation change for the rising area and descending area, respectively. Then, the volumetric change is calculated from the elevation change and area of deformation district indicated in Equation (4):
where (i, j) is one pixel in A, which is the pixels set of deformation area, Si,j = Li,j×Wi,j is the area of grid location, (i,j), Li,j and Wi,j are the length and width of grid location (i,j), ΔVi,j is the volumetric change of grid location (i,j), and the volumetric change ΔV is the summation of ΔVi,j in the deformation district.
If ΔHi,j > δ↑, then, (i, j) is the rising area.
If ΔHi,j ≤ δ↓, then, (i, j) is the descending area.
If ΔHi,j ≤ δ↓, then, (i, j) is the descending area.
ΔV = ∑ΔVi,j = ∑ΔHi,j×Si,j (i, j)∈A
Topographical profile deformation is used to describe the changes in elevations along the specified line above the surface. It is calculated from the differences in elevation values extracted from both the compared terrain models along the profile line. The location of a profile line is drawn manually. Three profile lines that cross the active open mining pit and the waste piling field are chosen to analyze the profile deformation.
4. Results
4.1. DSM Results and Regional Overall Deformation
Figure 5 shows the ASTER GDEM and 10 m resolution DSMs from ZY-3 stereo images in the study area using the method described in Section 3. Table 2 presents the statistical results of multi-temporal DSMs using the method displayed in Figure 4. After adjustment by ground points, the root mean square (RMS) of DSM elevation in the region acquired in 2015 is reduced from 5.21 m to 1.72 m. The RMS is decreased to 2.11 m from the original 11.29 m in 2014, whereas the RMS decreases to 4.04 m from the original 28.71 m in 2013.
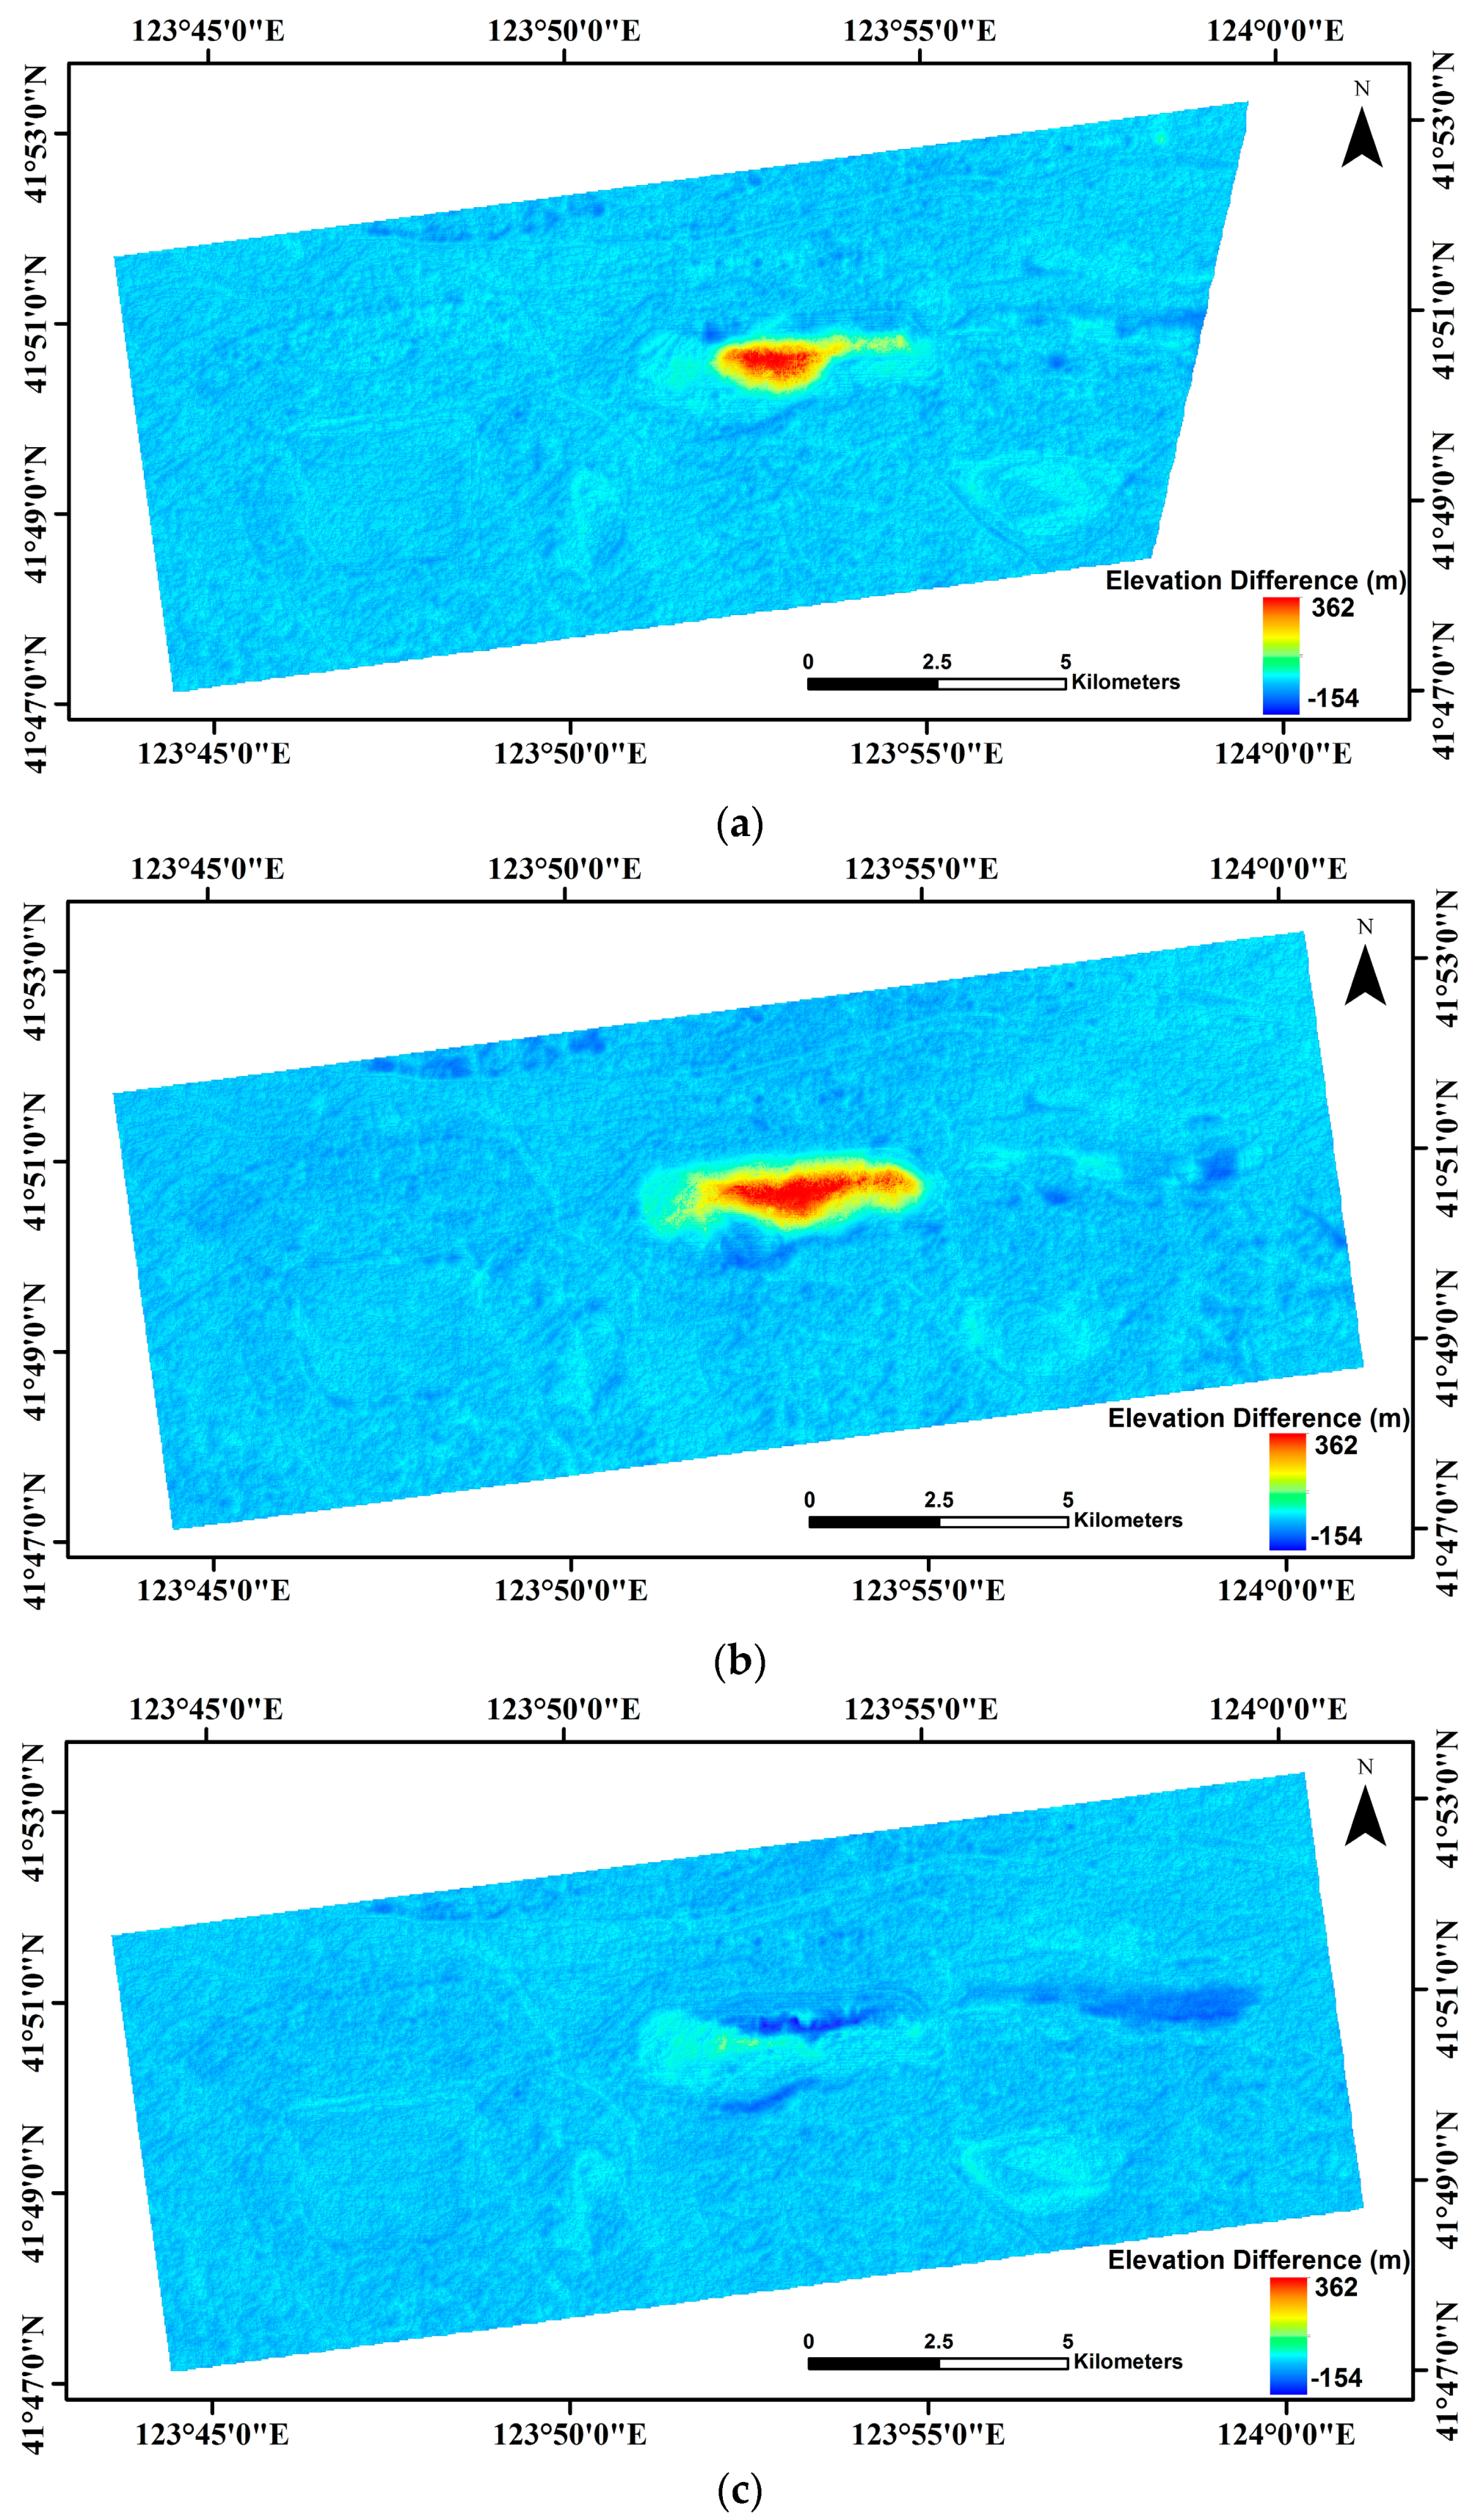
Figure 6 shows the overall ground deformation using the elevation difference between ZY-3 DSMs and the ASTER GDEM. Table 3 displays statistical results of elevation changes with the minimum, maximum, mean, and standard deviation values. The table shows that the elevations from ZY-3 DSMs are higher than those from ASTER GDEM, and the mean elevation changes by 8.38 m, 6.61 m, and 3.12 m in 2013, 2014, and 2015, respectively. Due to the backfilling process while mining in this area, a deformation of more than 100 m is found, especially in the active mining area, where the slope slides steeply and the pit backfill rises on the other side.
From the results, the terrain accuracy of DSM in 2015 is significantly higher than that in 2013 and 2014.The mean RMS of DSMs in 2013–2015 is 2.62 m, and the average difference between ZY-3 DSM (2015) and ASTER GDEM is 3.12 m, so the threshold for height change is set as 3 m. DSM in 2015 is used in the analysis of deformation. Table 4 shows the statistical results of elevation changes between ZY-3 DSM in 2015 and ASTER GDEM. The results show that 71.18% of this area is deformed with the threshold, and 22.27% of the area has an elevation variation of more than 10 m. Further, 30.72% of the area shows the descending elevation phenomenon, whereas 69.28% of the area shows a rising elevation change.
4.2. Typical Region Deformation
Typical region deformation means the deformation in the typical regions in the study area. To analyze the elevation and volume changes in particular local areas, five typical regions consisting of mining pits and piling fields displayed in Figure 1 are chosen to make a detailed analysis using ZY-3 DSM in 2015 and ASTER GDEM. Table 5 presents the statistical results of deformation in the five typical regions.
The districts with obvious elevation changes are extracted using Equation (3) to obtain more detailed distribution of height increase and decrease. If the elevation of pixel (i, j) increases or decreases beyond the threshold of change, it is considered an obvious elevation change. The descending threshold of obvious elevation changes δ↓ is set as −10 m, which is nearly one standard deviation of elevation changes (11.18 m in Table 3) between 2015 ZY-3 DSM and ASTER GDEM. Considering the impact of surface construction and vegetation, the rising threshold δ↑ is set as 15 m, which is larger than δ↓.. Figure 7 displays the distribution of seven districts with obvious elevation changes. Table 6 shows the statistical results with obvious elevation changes using ZY-3 DSM in 2015 and ASTER GDEM. Four districts of rising elevation (red polygons) and three districts of descending elevation (green polygons) have been extracted. Districts 1–4 show a rising elevation and Districts 5–7 show a descending elevation, which are all marked with numbers in Figure 7.
(1) Deformation in the west open-pit mine. The average elevation change is observed to be 5.56 m in the west open-pit mine and the total ground volume change is 9.50 × 10⁷ m3 in the range of 17.08 km2. The west open-pit mine is now in the pit closed stage; backfill work has been started with mining exploitation only in a small area. This has led to the elevation increase on average and the gradual uplift of the bottom.
Districts 4–6 in Figure 7 are all in the west open-pit mine. Elevation increase and decrease are mixed together (Figure 8). District 4, with rising elevation, is mainly caused by backfilling. The results show that the backfill area is about 3.57 km2, the volume of backfill is about 1.37 × 10⁸ m3, and the average rising elevation is about 36.35 m. The descending area (Districts 5 and 6) is mainly in the north and south pits. District 5 is located to the north of the slope, where small-scale mining is still continuing. At the same time, some small landslides often occurred. Therefore, the results show that the elevation is reduced by 41.77 m on average, the significant descending area is about 1.15 km2, and the descending volume is about 4.81 × 10⁷ m3.
However, the descending area of District 6 is located to the south of the slope, where the landslide phenomenon has recently become more serious due to its long-term mining operation. The occupied area is about 1.10 km2, the average elevation is reduced by 28.66 m, and the descending volume is about 3.14 × 10⁷ m3. The results are consistent with those of previous studies [5,6,22]. The results show that the speed of the deformation process is rapid; range and amplitude are also large. It is noteworthy that the large deformation in the southern slope is in the form of relatively small fissures at the beginning; obvious fissures were found in 2013 (Figure 2a) [22], and by July 2014, the fissure already stretched with a length of more than 3 km, a maximum width of about 40 m, and a maximum drop of about 20 m (Figure 2b). By 2015, the landslide deformation had become quite clear based on the DSM results.
(2) Deformation in east open-pit mine. The average elevation change is observed to be −15.40 m in the east open-pit mine. In the range of 4.68 km2, the total ground volume change is −7.20 × 10⁷ m3. The east open-pit mine is still in the normal mining stage and the amount of dumping has increased after 2015 [41,42]. Due to its normal mining activities, District 7 in the east open-pit mine is the largest descending area (about 3.87 km2). The average elevation is reduced by 31.24 m, and the volume is decreased by about 1.21 × 10⁸ m3, which is larger than the total volume change (−7.20 × 10⁷ m3). A possible reason for this is that one part of the waste rocks is stacked in the mining area and the other part is dumped to the piling fields outside.
A small district (District 3), with an area of about 0.86 km2 to the north of the east open-pit mine, was an underground mine area previously [9] and the surface is reclaimed now, resulting in a rise in elevation.
(3) Deformation in three waste rocks fields. Elevations in the west waste rocks field, east waste rocks field, and Wangliang waste rocks field all increased with average values 3.33 m, 16.78 m, and 10.81 m, respectively. For the waste rocks dumped from the east open-pit mine, elevations show a significant increase in the east waste rocks field and Wangliang waste rocks field, as well as volume changes. The heights in Districts 1 and 2 in the east waste rocks field and Wangliang waste rocks field increase obviously. The area of the two rising districts is 2.90 km2 and 1.11 km2 and the volume change is 6.91 × 10⁷ m3 and 2.40 × 10⁷ m3, respectively. Since the dump area is not uniformly distributed, the volume change in District 1 is greater than the entire volume change in the east waste rocks field.
4.3. Topographical Profile Deformation
Three lines in Figure 7 indicate the detailed locations of the chosen profiles that crossed the active open mining pit and the waste field. Elevation values of the same profile are extracted from the ASTER GDEM and ZY-3 DSM in 2015. The results are shown in Figure 9. The topographic deformation along the profiles using elevation changes could be displayed.
Profile 1 crosses the Hunhe River and the west waste rocks field; the elevation in the west waste rocks field rises slightly. Profile 2 crosses the Hunhe River and the west open-pit mine; the elevation level in the west open-pit mine rises too, but with a more complicated deformation. A landslide in the north slope of the mine pit occurred, as displayed in the topographic profile of 2015. At the same time, the south edge of the mining area moved further toward the south. The south slope shows a declining deformation; the elevation is decreased by 47.28 m in the arrow location for the landslide in the south slope of the pit. The results also demonstrate a large ground fracture.
Profile 3 crosses the Hunhe River, east open-pit mine, and east waste field. It also shows the reduction in elevation change in the east open-pit mine and rising elevation level in the east waste rocks field, demonstrating similar results, as described in Section 4.2.
5. Discussion
5.1. Deformation Status in the Study Area
Deformation with rising or declining elevation couples together in the study area. From the distribution in Figure 7 and Table 6, the districts with remarkable elevation changes are all located in or near the typical regions. Elevation changes in the five typical regions are quite distinct due to simultaneous exploitation, backfilling, and waste dumping. For the active mining area, elevation in the west open-pit mine rises, while elevation in the east open-pit mine descends. The elevation values of the three piling fields all rise to a certain degree, and the increase in the amplitude is more obvious in east waste rocks field, which is currently the most frequently used [41,42].
In the west open-pit mine, it can be inferred that the elevation-rising area is enlarging quickly for the artificial backfill process, but the elevation-declining area is increasing slowly too for the slow deformation of slope sliding. Topographic deformation along the profiles also verifies similar results in typical regions. Large declining deformation (47.28 m) of the landslide in the south slope in Figure 9b is consistent with the results in [6], which use high-resolution remote sensing image SIFT features. However, the scarp height of the landslide was 1.6 m to 7.32 m measured in 2013 [8,22], and then the maximum drop reached more than 18 m [6]. Compared with the results in [5,6,8,22] from earlier times, the amplitude of deformation has been larger over time.
5.2. Uncertainty of Extracted Deformation
The vertical accuracy of DSMs from ZY-3 imagery is 1.72 m to 4.04 m, as shown in the results in Section 4.1, and the horizontal precision can be considered as the resolution, given the rigorous photogrammetric models created in the process. As mentioned in the above section, the deformation areas are extracted pixel by pixel and an accuracy of 0.5 pixels should be ensured in the DSM. In addition, according to the law of error propagation, the extracted parameters for deformation areas have an accuracy of √2 times the above accuracy. Based on Equation (4), the accuracy (RMS errors) of the area (S) and volume changes (ΔV) can be derived according to the law of error propagation [25]:
where L and W are the length and width of grid location (i,j). Table 7 lists the accuracy for the parameters used in this study.
5.3. Accuracy Assessment of DSMs
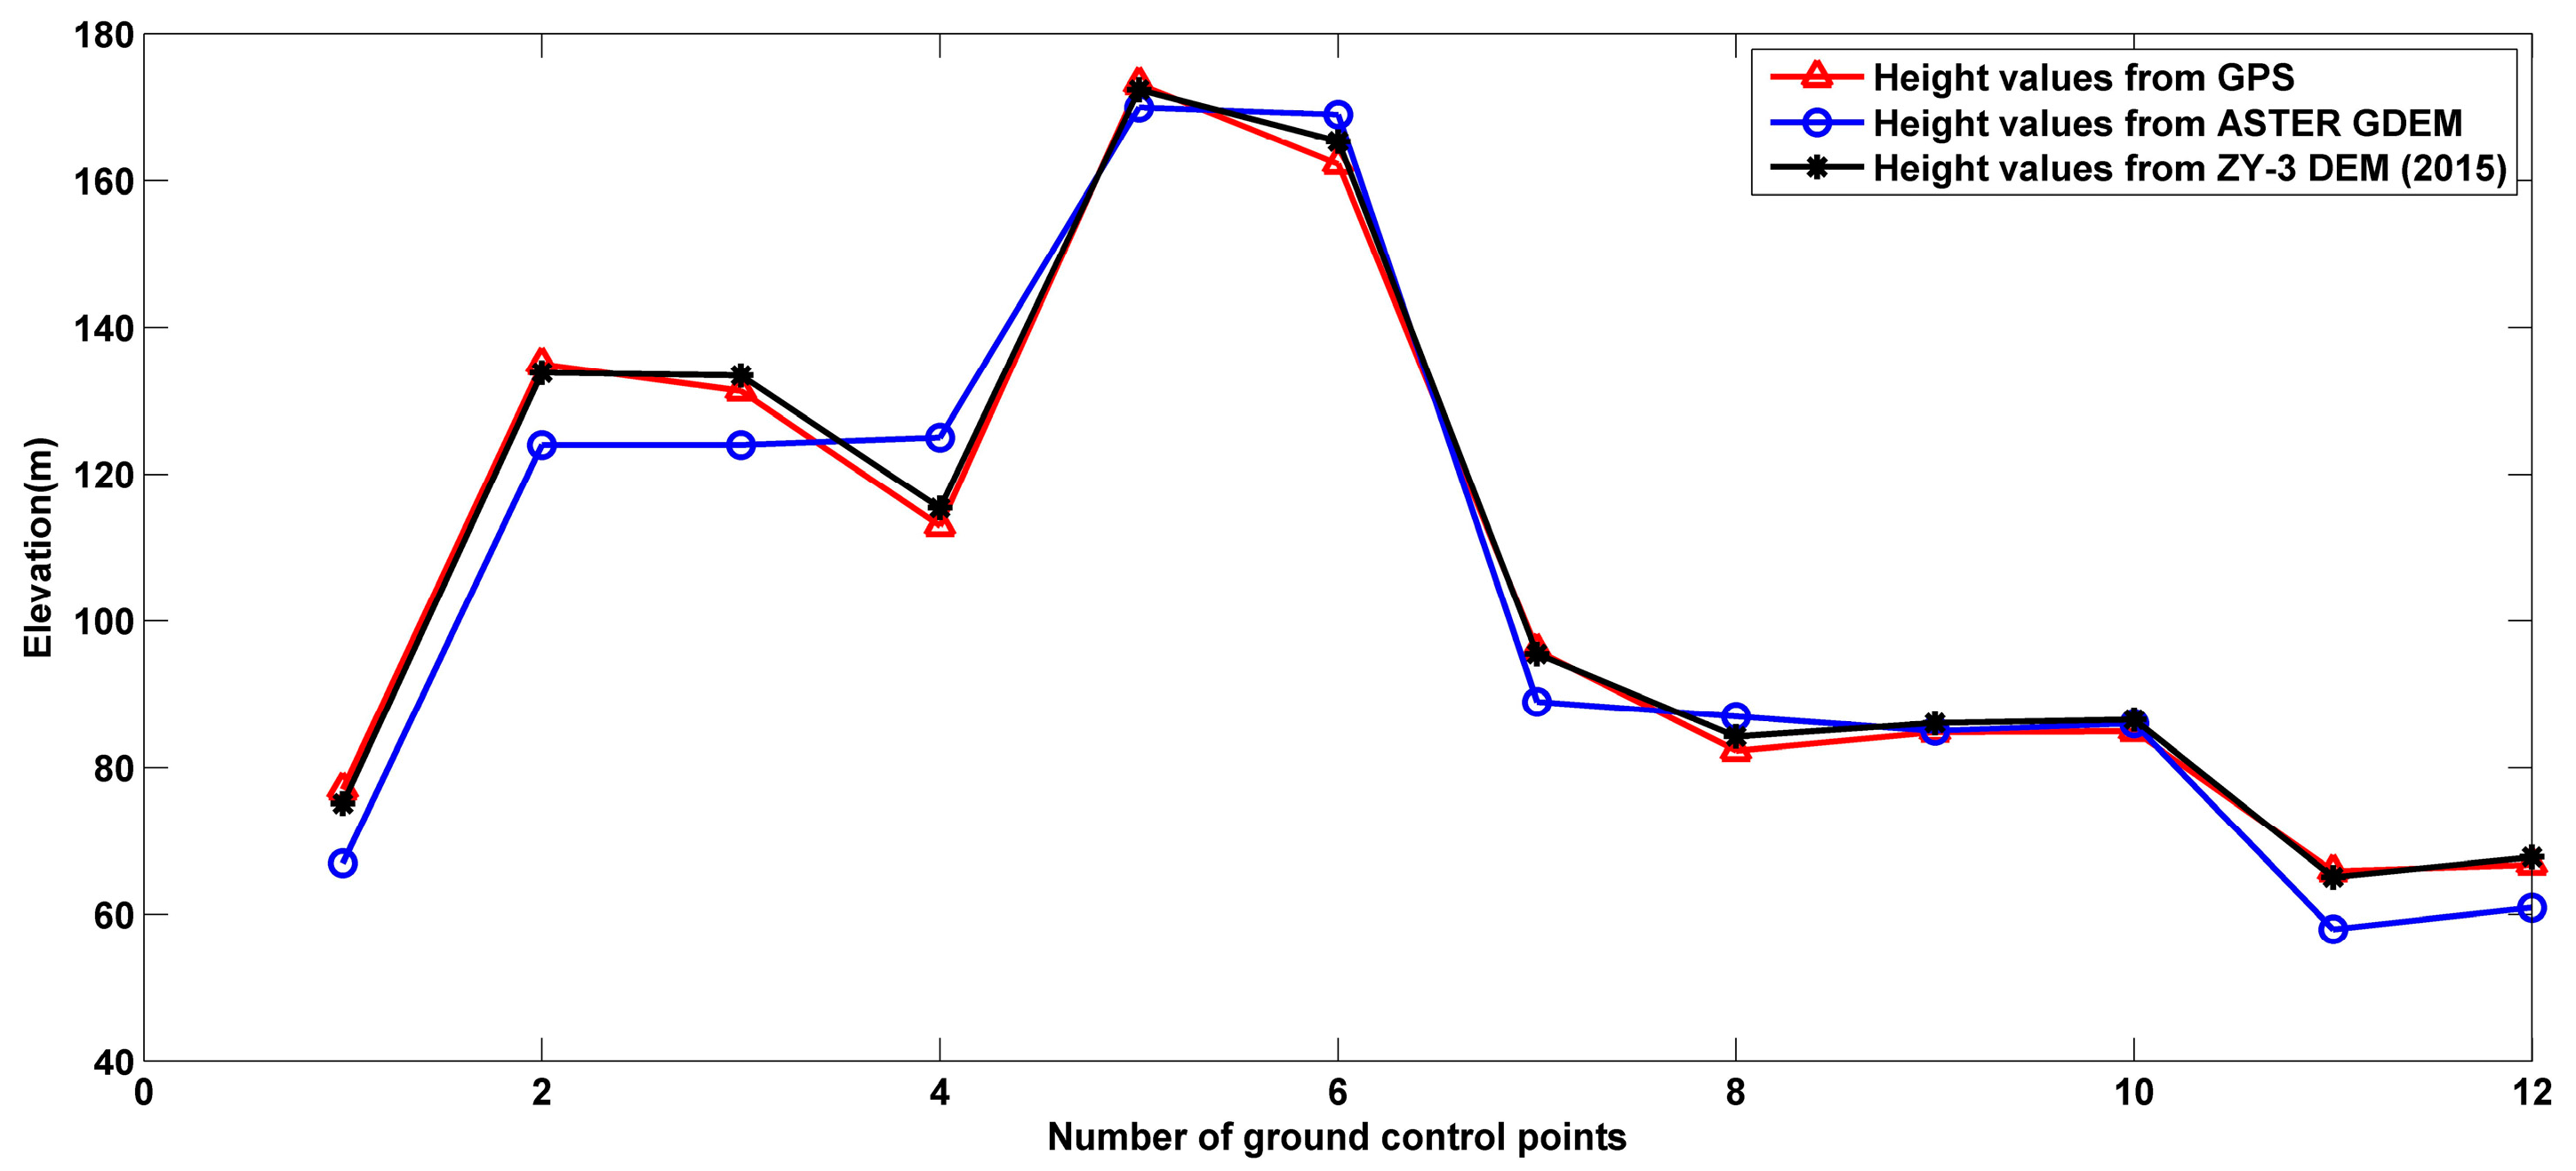
DSMs are important for time series mining deformation or dynamic change. However, the accuracy of ZY-3 DSMs is different depending on the influence of the terrain and the number and distribution of ground control points [30,35]. We use twelve of the ground control points in stable areas as check points to make a comparison of the differences between the datasets and the extracted deformation. Figure 10 shows the GPS measurements and height values extracted from ASTER GDEM and ZY-3 DSM (2015) at the ground control points. Table 8 lists the statistical results. The mean difference between ASTER GDEM and GPS measurements is 2.29 m, the mean difference between ZY-3 DSM (2015) and GPS measurements is 0.70 m, while the mean difference between ZY-3 DSM (2015) and ASTER GDEM is 2.99 m. Compared with the results in Table 3, the threshold of 3 m for the height change in Section 4.1 is reasonable.
That means a large ground deformation, such as a large fracture or landslide, can be monitored using Chinese ZY-3 stereo imagery. Due to the backfilling process while mining in this area, the deformation of more than 100 m is found, especially in the active mining area, where the slope slides steeply and the pit backfill rises on the other side. Therefore, DSMs derived from ZY-3 satellite stereo imagery can be important data resources for topography and deformation monitoring in mining areas.
As the results and reasons shown in Section 4.1, the accuracy of DSMs derived from ZY-3 imagery in 2013 and 2014 is lower than that in 2015, so DSMs derived from ZY-3 imagery in 2013 and 2014 are not used for the typical region and topographic profile deformation in this study. The possible reason is that the time of the control point measurement is much closer to that of 2015. Moreover, the accuracy is relatively high in the pinpointing process of ground points on the image because the ground change is large in the mining operation area. In addition, the snow covering in some districts may have resulted in the degradation of terrain accuracy in 2013. DSM acquired in 2014 has much higher elevation in the west open-pit mine, and heavy fog may be the cause of this result (the black circle indicates the area in Figure 5c). As the minimum elevation is below −300 m in the west open-pit mine prior to 2015, the main errors of the DSMs are located here [43]. There are five ground control points around the west open-pit mine (Figure 1b), but the improvement is very slight in the west open-pit mine for DSMs in 2014 and 2013. This means more GCPs or other extracted ground features in the mining pit are needed for the DSM adjustment.
Time series deformation analysis with more datasets is very important for the development of mining deformation or the dynamic change. New ZY-3 imagery data in this area will be concerned with further deformation development. To improve the precision and quality of DSMs derived from ZY-3 imagery, more stable GCPs or a more accurate DSM will be added in the study area in the future work. In addition, ground invariant features from image feature in the mining area will also be considered as a reference for improvement.
6. Conclusions
This study demonstrates the application and potential of Chinese ZY-3 satellite stereo imagery for accurate DSMs generation from satellite images with a higher temporal frequency. Mapping and quantifying the ground deformation in the mining area with DSMs derived from ZY-3 images are techniques that can be used to detect elevation and volume changes, especially in the open-pit area with its large ground deformation. Regional overall deformation, typical region deformation, and topographical profile deformation are used to analyze the deformation distribution and trends based on the elevation changes. The application in the Fushun case study indicates that:
- (1)
- Deformations in the mining area are complicated for its opencast operational activities. Districts with rising and descending elevations couple together in the active mining area. Deformations, such as landslides, not only occurred in the pit wall but also expanded to the pit outside of the case study. The large deformation around the south slope in the west open-pit mine is a representative example. It means that the ground deformation caused by mining activities has expanded from local deformation to regional ground deformation.
- (2)
- The reasons for the rising elevation are mainly the backfilling of the west open-pit mine and waste rocks from the mining operation in the two open-pit mines. However, in addition to the mining excavation, the slope slippage is a significant reason for the deformation areas with descending elevations.
- (3)
- Ground deformation, especially acute deformation such as large fractures or landslides, can be monitored using Chinese ZY-3 stereo imagery. The experiments using ZY-3 stereo image-derived DSMs in this study present preliminary results of deformation analysis in the mining area.
- (4)
- The numerical results of deformation need more precise ground control data for validation. Multi-temporal and multi-resources of satellite-visible stereo images, LiDAR data, and others can provide more detailed information. However, due to the effect of the mining disturbance, the validation data should keep invariant features and an invariant location. Invariable features will be extracted to constrain the DSM co-registration in future investigations, not just the control points.
Acknowledgments
This research was supported by Foundation of China University of Mining and Technology (No. 2014QNB43), the National Natural Science Foundation of China (Grant No. 41601500, Grant No. 51404254, and Grant No. 41401610), and the Natural Science Foundation of Jiangsu Province of China (No. BK20140186). We thank the editorial help, as well as academic suggestions from the anonymous reviewers.
Author Contributions
Wenmin Hu and Lixin Wu developed the main idea of this study and performed the data processing and analysis. Wei Zhang and Jiaxing Xu gave support to the mining operation and contributed to the discussion of the results. Bin Liu gave support to the DSM generation and accuracy analysis.
Conflicts of Interest
The authors declare no conflict of interest.
References
- Liu, D.Y. Study on Formation Mechanism-Prediction Analysis of Geologic Hazards in Fushun Coalfield. Ph.D. Thesis, Northeastern University, Shenyang, China, 2009. (In Chinese). [Google Scholar]
- Wang, Y.J.; Wang, J.; Huang, Y.; Tian, F.; Chen, G.L. Multi-source Monitoring and Analysis of Surface Disaster in Mining Area. Bull. Surv. Mapp. 2014, s2, 4–9. (In Chinese) [Google Scholar]
- Samsonov, S.; d’Oreye, N.; Smets, B. Ground deformation associated with post-mining activity at the French–German border revealed by novel InSAR time series method. Int. J. Appl. Earth Obs. Geoinf. 2013, 23, 142–154. [Google Scholar] [CrossRef]
- Chaulya, S.K.; Prasad, G.M. Chapter 1—Slope Failure Mechanism and Monitoring Techniques. In Sensing and Monitoring Technologies for Mines and Hazardous Areas; Elsevier: Amsterdam, The Netherlands, 2016; pp. 1–86. [Google Scholar]
- He, L.; Wu, L.; Liu, S.; Wang, Z.; Su, C.; Liu, S.-N. Mapping Two-Dimensional Deformation Field Time-Series of Large Slope by Coupling DInSAR-SBAS with MAI-SBAS. Remote Sens. 2015, 7, 12440–12458. [Google Scholar] [CrossRef]
- Liu, S.; Wang, H.; Huang, J.; Wu, L. High-resolution remote sensing image-based extensive deformation-induced landslide displacement field monitoring method. Int. J. Coal Sci. Technol. 2015, 2, 170–177. [Google Scholar] [CrossRef]
- Li, Z.; Wang, J.A.; Li, L.; Wang, L.; Liang, R.Y. A case study integrating numerical simulation and GB-InSAR monitoring to analyze flexural toppling of an anti-dip slope in Fushun open pit. Eng. Geol. 2015, 197, 20–32. [Google Scholar] [CrossRef]
- Nie, L.; Li, Z.; Lv, Y.; Wang, H. A new prediction model for rock slope failure time: A case study in West Open-Pit mine, Fushun, China. Bull. Eng. Geol. Environ. 2016, 76, 975–988. [Google Scholar] [CrossRef]
- Dong, Y.; Fu, B.; Ninomiya, Y. Geomorphological changes associated with underground coal mining in the Fushun area, northeast China revealed by multitemporal satellite remote sensing data. Int. J. Remote Sens. 2009, 30, 4767–4784. [Google Scholar] [CrossRef]
- Hu, J.; Li, Z.W.; Ding, X.L.; Zhu, J.J.; Zhang, L.; Sun, Q. Resolving three-dimensional surface displacements from InSAR measurements: A review. Earth Sci. Rev. 2014, 133, 1–17. [Google Scholar] [CrossRef]
- Brunori, C.A.; Bignami, C.; Stramondo, S.; Bustos, E. 20 years of active deformation on volcano caldera: Joint analysis of InSAR and AInSAR techniques. Int. J. Appl. Earth Obs. Geoinf. 2013, 23, 279–287. [Google Scholar] [CrossRef] [Green Version]
- Samsonov, S.; Gonzalez, P.J.; Tiampo, K.; d’Oreye, N. Spatio-temporal analysis of ground deformation occurring near Rice Lake, Saskatchewan, and observed by Radarsat-2 DInSAR during 2008–2011. Can. J. Remote Sens. 2013, 39, 27–33. [Google Scholar] [CrossRef]
- Stramondo, S.; Trasatti, E.; Albano, M.; Moro, M.; Chini, M.; Bignami, C.; Polcari, M.; Saroli, M. Uncovering deformation processes from surface displacements. J. Geodyn. 2016, 102, 58–82. [Google Scholar] [CrossRef]
- Bhattacharya, A.; Arora, M.K.; Sharma, M.L. Usefulness of synthetic aperture radar (SAR) interferometry for digital elevation model (DEM) generation and estimation of land surface displacement in Jharia coal field area. Geocarto Int. 2012, 27, 57–77. [Google Scholar] [CrossRef]
- Chen, B.; Deng, K.; Fan, H.; Hao, M. Large-scale deformation monitoring in mining area by D-InSAR and 3D laser scanning technology integration. Int. J. Min. Sci. Technol. 2013, 23, 555–561. [Google Scholar] [CrossRef]
- Mei, S.; Poncos, V.; Froese, C. Mapping millimetre-scale ground deformation over the underground coal mines in the Frank Slide area, Alberta, Canada, using spaceborne InSAR technology. Can. J. Remote Sens. 2008, 34, 113–134. [Google Scholar] [CrossRef]
- Liu, D.; Shao, Y.; Liu, Z.; Riedel, B.; Sowter, A.; Niemeier, W.; Bian, Z. Evaluation of InSAR and TomoSAR for Monitoring Deformations Caused by Mining in a Mountainous Area with High Resolution Satellite-Based SAR. Remote Sens. 2014, 6, 1479–1495. [Google Scholar] [CrossRef]
- Caduff, R.; Schlunegger, F.; Kos, A.; Wiesmann, A. A review of terrestrial radar interferometry for measuring surface change in the geosciences. Earth Surf. Process. Landf. 2015, 40, 208–228. [Google Scholar] [CrossRef]
- Casu, F.; Manconi, A.; Elefante, S.; Zinno, I. Surface Displacement Time Series Retrieved by Fully Exploiting Space-Borne SAR Data, in Engineering Geology for Society and Territory—Volume 2: Landslide Processes; Lollino, G., Giordan, D., Crosta, G.B., Corominas, J., Azzam, R., Wasowski, J., Sciarra, N., Eds.; Springer: Cham, Switzerland, 2015; pp. 417–420. [Google Scholar]
- Casu, F.; Manconi, A.; Pepe, A.; Lanari, R. Deformation Time-Series Generation in Areas Characterized by Large Displacement Dynamics: The SAR Amplitude Pixel-Offset SBAS Technique. IEEE Trans. Geosci. Remote Sens. 2011, 49, 2752–2763. [Google Scholar] [CrossRef]
- Wang, J. Study on the Related Theory and Modeling for Coal Mining Deformation Hazard Monitoring. Ph.D. Thesis, China University of Mining and Technology, Xuzhou, China, 2010. (In Chinese). [Google Scholar]
- Nie, L.; Li, Z.; Zhang, M.; Xu, L. Deformation characteristics and mechanism of the landslide in West Open-Pit Mine, Fushun, China. Arab. J. Geosci. 2015, 8, 4457–4468. [Google Scholar] [CrossRef]
- Nichol, J.E.; Shaker, A.; Wong, M.-S. Application of high-resolution stereo satellite images to detailed landslide hazard assessment. Geomorphology 2006, 76, 68–75. [Google Scholar] [CrossRef]
- Marzolff, I.; Poesen, J. The potential of 3D gully monitoring with GIS using high-resolution aerial photography and a digital photogrammetry system. Geomorphology 2009, 111, 48–60. [Google Scholar] [CrossRef]
- Yue, Z.; Hu, W.; Liu, B.; Liu, Y.; Sun, X.; Zhao, Q.; Di, K. Quantitative analysis of the morphology of martian gullies and insights into their formation. Icarus 2014, 243, 208–221. [Google Scholar] [CrossRef]
- Stumpf, A.; Malet, J.-P.; Delacourt, C. Correlation of satellite image time-series for the detection and monitoring of slow-moving landslides. Remote Sens. Environ. 2017, 189, 40–55. [Google Scholar] [CrossRef]
- James, L.A.; Hodgson, M.E.; Ghoshal, S.; Latiolais, M.M. Geomorphic change detection using historic maps and DEM differencing: The temporal dimension of geospatial analysis. Geomorphology 2012, 137, 181–198. [Google Scholar] [CrossRef]
- Li, D. China’s first civilian three-line-array stereo mapping satellite: ZY-3. Acta Geod. Cartogr. Sin. 2012, 41, 317–322. (In Chinese) [Google Scholar]
- Ni, W.; Sun, G.; Ranson, K.J.; Pang, Y.; Zhang, Z.; Yao, W. Extraction of ground surface elevation from ZY-3 winter stereo imagery over deciduous forested areas. Remote Sens. Environ. 2015, 159, 194–202. [Google Scholar] [CrossRef]
- Liu, B.; Sun, X.; Di, K.; Liu, Z. Accuracy analysis and validation of ZY-3’s sensor corrected products. Remote Sens. Land Resour. 2012, 24, 36–40. (In Chinese) [Google Scholar]
- Tang, X.; Zhang, G.; Zhu, X.; Pan, H.; Jiang, Y.; Zhou, P.; Wang, X.; Guo, L. Triple linear-array imaging geometry model of ZiYuan-3 surveying satellite and its validation. Acta Geod. Cartogr. Sin. 2012, 41, 191–198. (In Chinese) [Google Scholar]
- Zhang, G.; Wang, T.; Li, D.R.; Tang, X.; Jiang, Y.; Pan, H.; Zhu, X. Block adjustment for ZY-3 satellite standard imagery based on strip constraint. Acta Geod. Cartogr. Sin. 2014, 43, 1158–1164. (In Chinese) [Google Scholar]
- Pan, H. Geolocation error tracking of ZY-3 three line cameras. ISPRS J. Photogramm. Remote Sens. 2017, 123, 62–74. [Google Scholar] [CrossRef]
- Tong, X.; Li, L.; Liu, S.; Xu, Y.; Ye, Z.; Jin, Y.; Wang, F.; Xie, H. Detection and estimation of ZY-3 three-line array image distortions caused by attitude oscillation. ISPRS J. Photogramm. Remote Sens. 2015, 101, 291–309. [Google Scholar] [CrossRef]
- Shen, X.; Liu, B.; Li, Q.-Q. Correcting bias in the rational polynomial coefficients of satellite imagery using thin-plate smoothing splines. ISPRS J. Photogramm. Remote Sens. 2017, 125, 125–131. [Google Scholar] [CrossRef]
- Luo, H.; Li, L.; Zhu, H.; Kuai, X.; Zhang, Z.; Liu, Y. Land Cover Extraction from High Resolution ZY-3 Satellite Imagery Using Ontology-Based Method. ISPRS Int. J. Geo-Inf. 2016, 5, 31. [Google Scholar] [CrossRef]
- Wang, X.; Liu, Y.; Ling, F.; Liu, Y.; Fang, F. Spatio-Temporal Change Detection of Ningbo Coastline Using Landsat Time-Series Images during 1976–2015. ISPRS Int. J. Geo-Inf. 2017, 6, 68. [Google Scholar] [CrossRef]
- Johnson, E.A. Geology of the fushun coalfield, Liaoning Province, People’s Republic of China. Int. J. Coal Geol. 1990, 14, 217–236. [Google Scholar] [CrossRef]
- Wu, C.; Yang, Q.; Zhu, Z.; Liu, G.; Li, X. Thermodynamic analysis and simulation of coal metamorphism in the Fushun Basin, China. Int. J. Coal Geol. 2000, 44, 149–168. [Google Scholar] [CrossRef]
- Tachikawa, T.; Kaku, M.; Iwasaki, A.; Gesch, D.; Oimoen, M.; Zhang, Z.; Danielson, J.; Krieger, T.; Curtis, B.; Haase, J.; et al. ASTER Global Digital Elevation Model Version 2—Summary of Validation Results. Available online: http://www.jspacesystems.or.jp/ersdac/GDEM/ver2Validation/Summary_GDEM2_validation_report_final.pdf (accessed on 14 November 2017).
- Bao, Y.; Zhao, Y.; Feng, P.; Sun, P. Production plan management in Fushun east open-pit mine. Opencast Min. Technol. 2016, 31, 11–13. (In Chinese) [Google Scholar]
- Lu, B.; Chen, J.; Sun, K.; Ma, Z. Long term development plan of internal dump in Fushun east open-pit mine. Opencast Min. Technol. 2015, 12, 15–18. (In Chinese) [Google Scholar]
- Hu, W.; Wu, L. Ground Deformation Extraction Using Visible Images and LIDAR Data in Mining Area. ISPRS Int. Arch. Photogramm. Remote Sens. Sp. Inf. Sci. 2016, XLI-B7, 505–512. [Google Scholar] [CrossRef]
Figure 1.
(a) Location of the Fushun study area. The red box marks the coverage of the study area in this study. The background is a shaded image of ASTER GDEM. The left-upper inset is an index map to mark the location of the study area in China. (b) Locations of five typical regions in the study area. The yellow polygons indicate the boundaries of the typical regions, which are the main open mining areas and waste rocks piling fields in the study area. The red triangles mark the locations of ground control points used in this area. The base image was captured by China’s ZY-3 satellite in October in 2015. (c) The scene of the west open-pit mine from Google Images in 2017. The pentacle indicates the location of Qiantai Mountain. (d) The scene of the Wangliang waste rocks field from Google Images.


Figure 2.
(a) A picture of ground fissure at the Qiantai Mountain peak on 16 March 2013 quoted from the article [8,22]; and (b) a picture of the same ground fissure at the Qiantai Mountain peak taken on 16 July 2014.

Figure 3.
Main procedure of ground deformation extraction using ZY-3 stereo images.
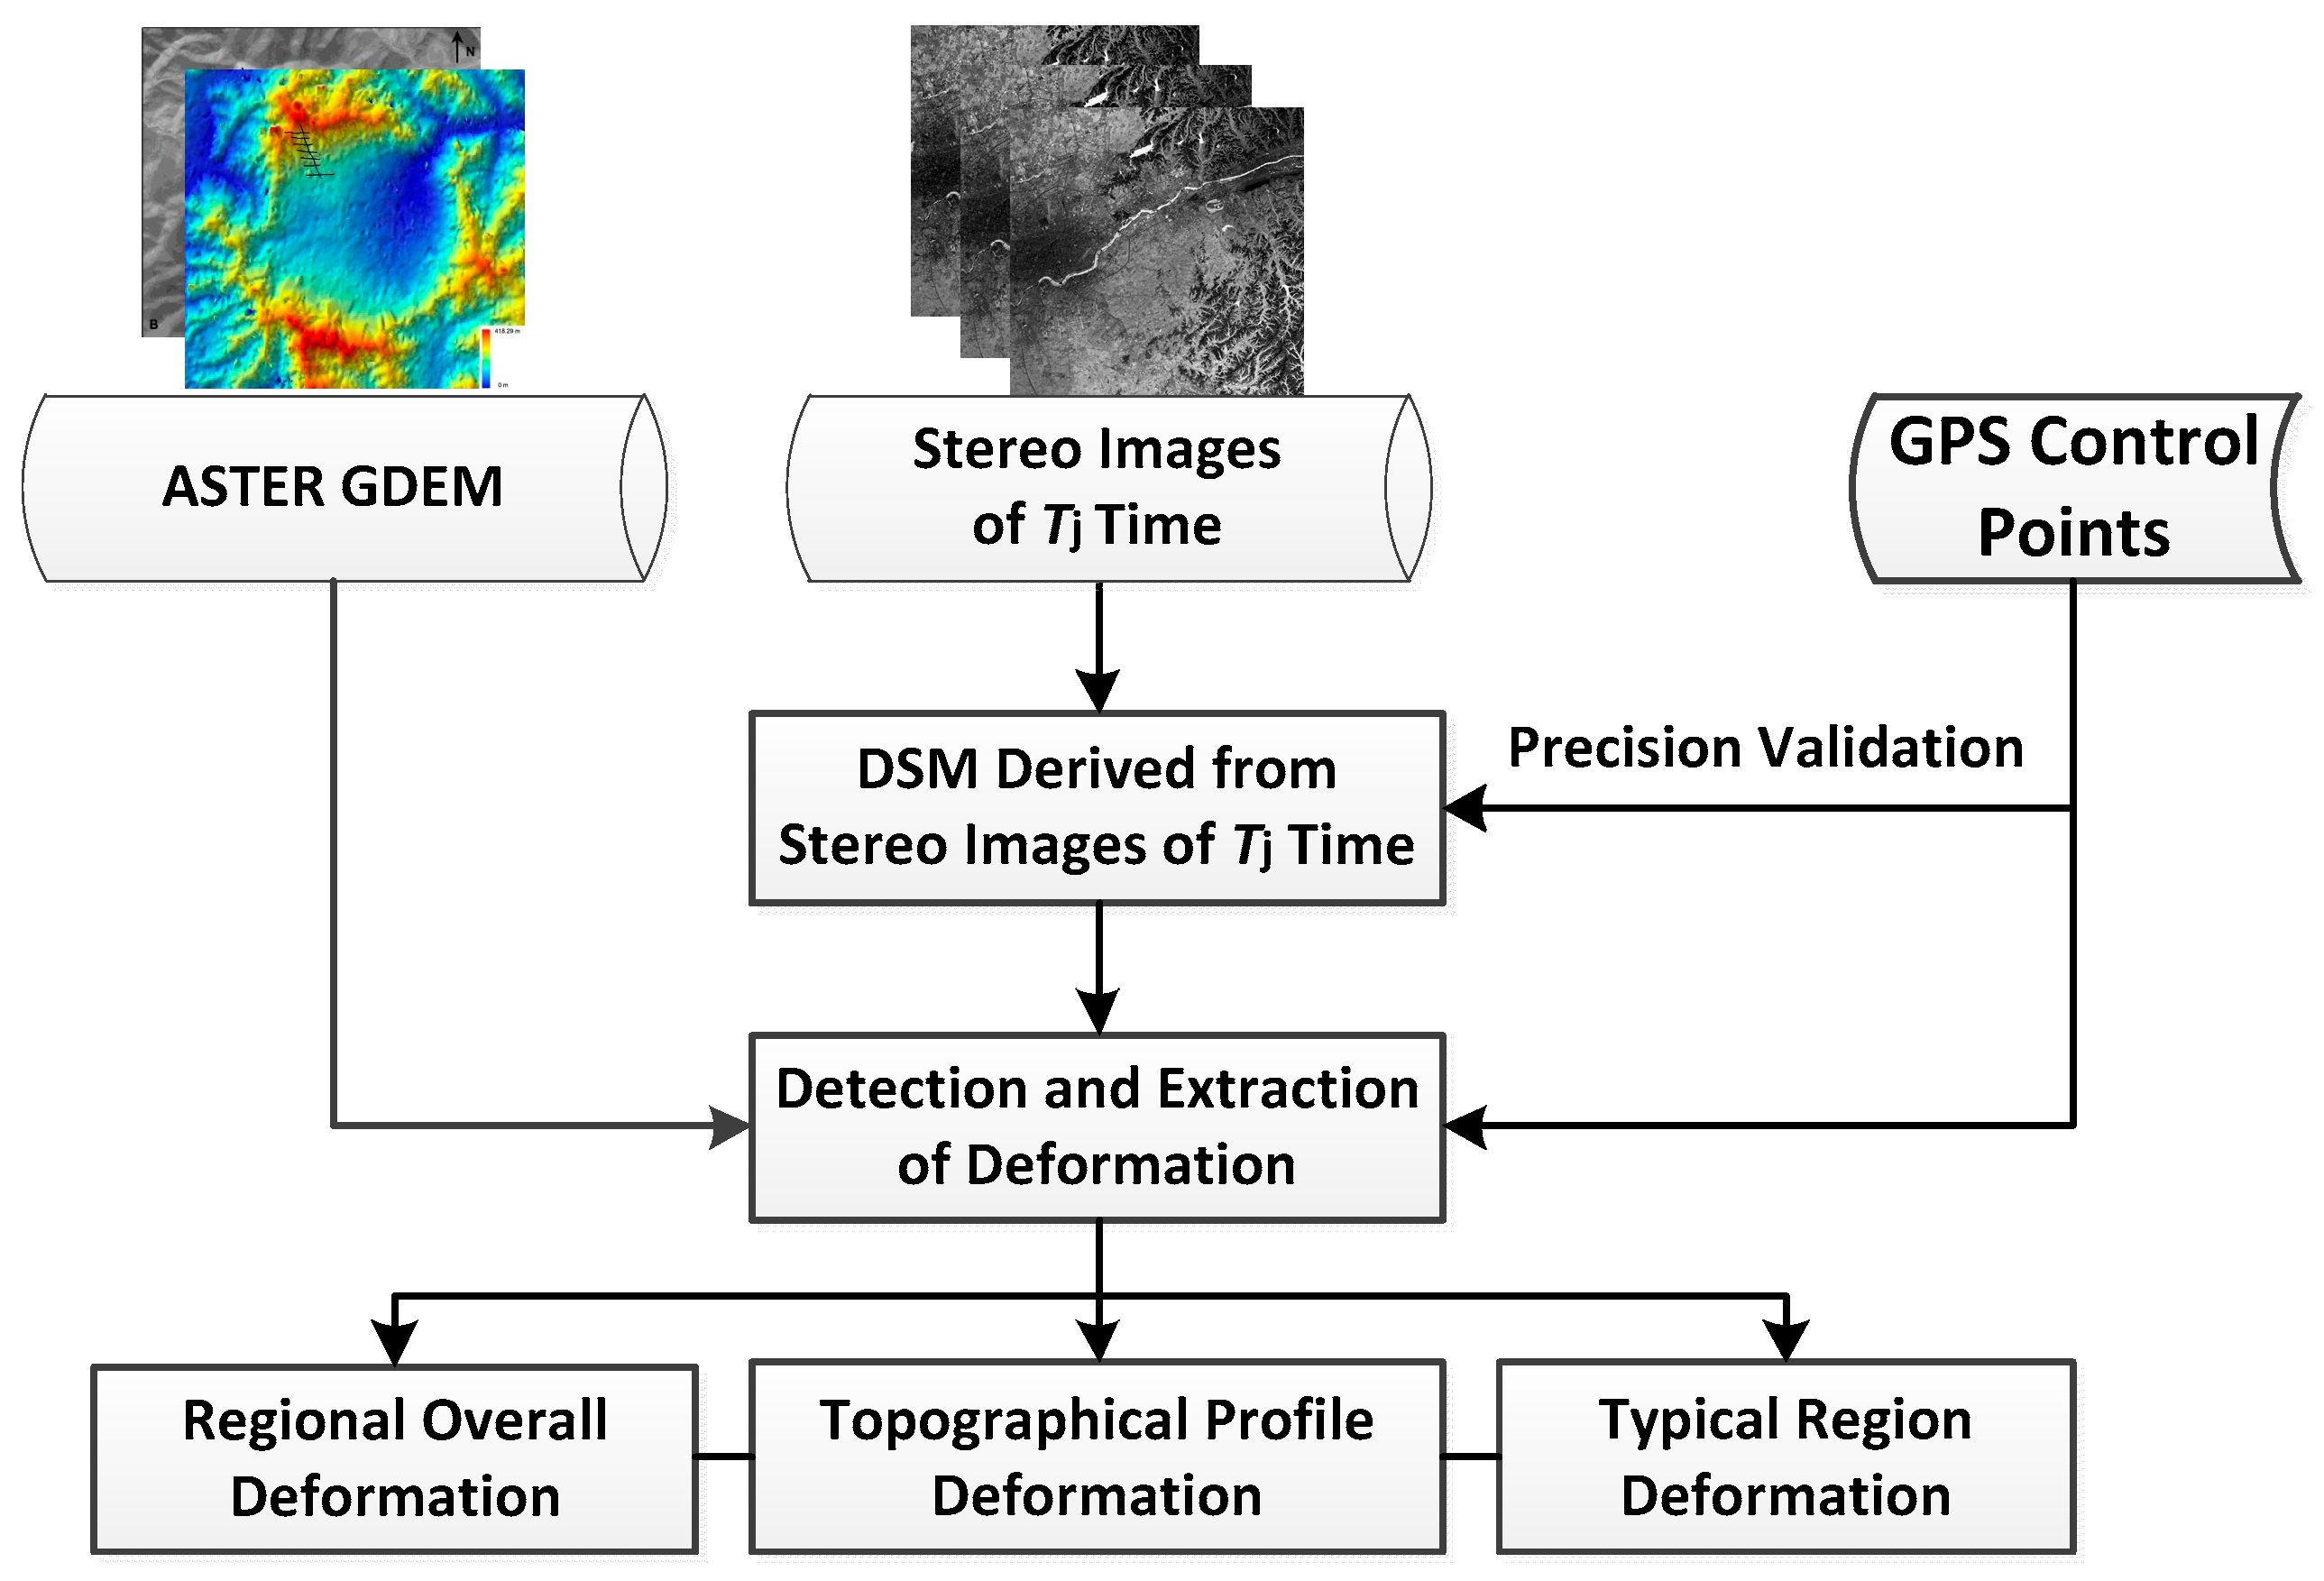
Figure 4.
The flowchart of DSM derived from ZY-3 stereo images.
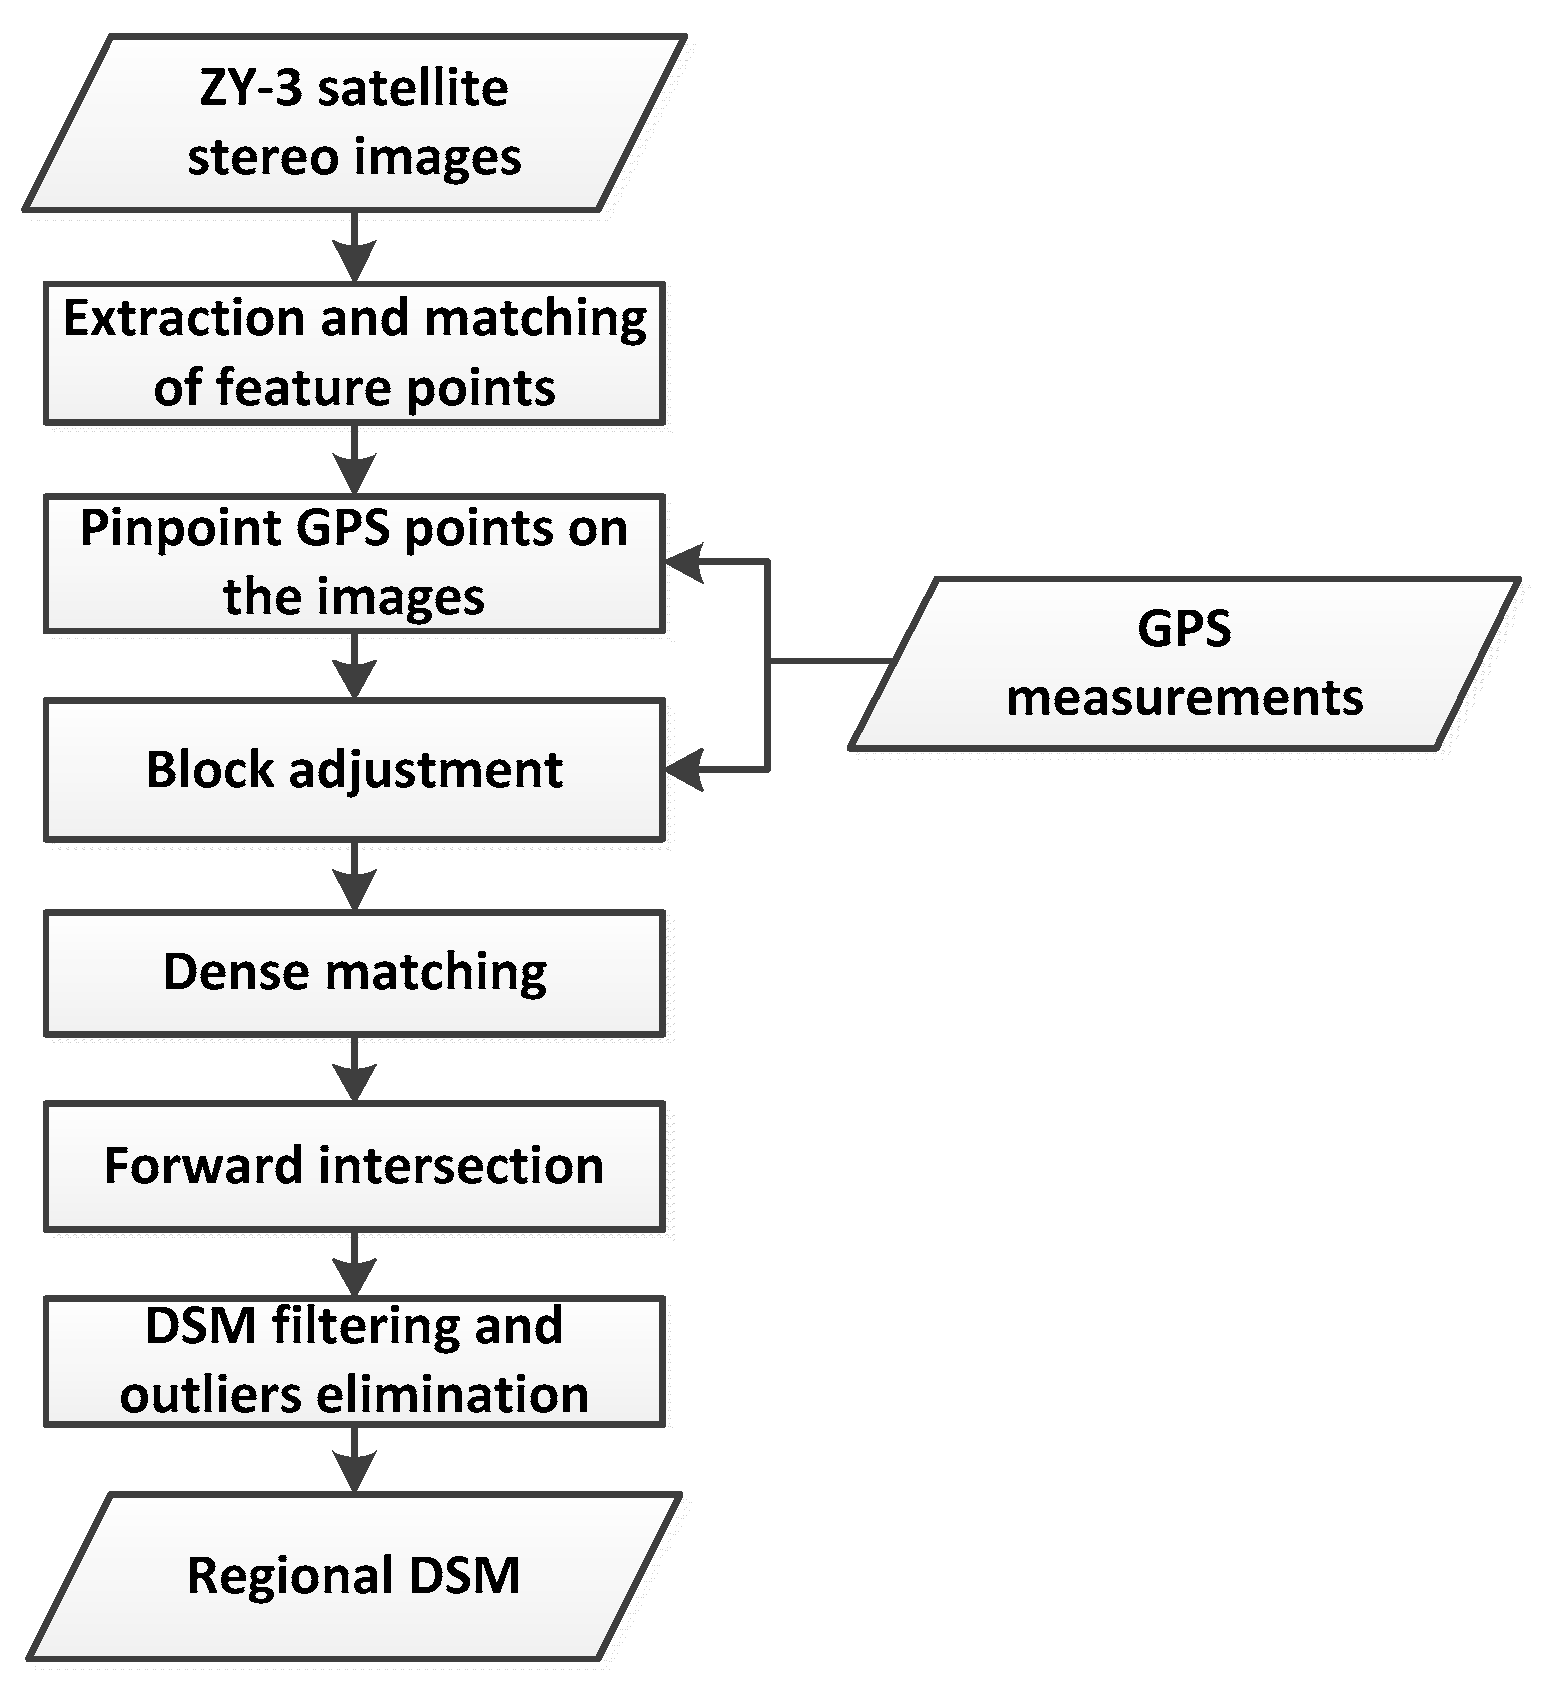
Figure 5.
DSMs in the study area. (a) ASTER GDEM in July 2010 [40]; (b) ZY-3 DSM on 24 December 2013; (c) ZY-3 DSM on 21 April 2014 (the black circle indicates an area of high elevation not real). (d) ZY-3 DSM on 24 October 2015.
Figure 5.
DSMs in the study area. (a) ASTER GDEM in July 2010 [40]; (b) ZY-3 DSM on 24 December 2013; (c) ZY-3 DSM on 21 April 2014 (the black circle indicates an area of high elevation not real). (d) ZY-3 DSM on 24 October 2015.
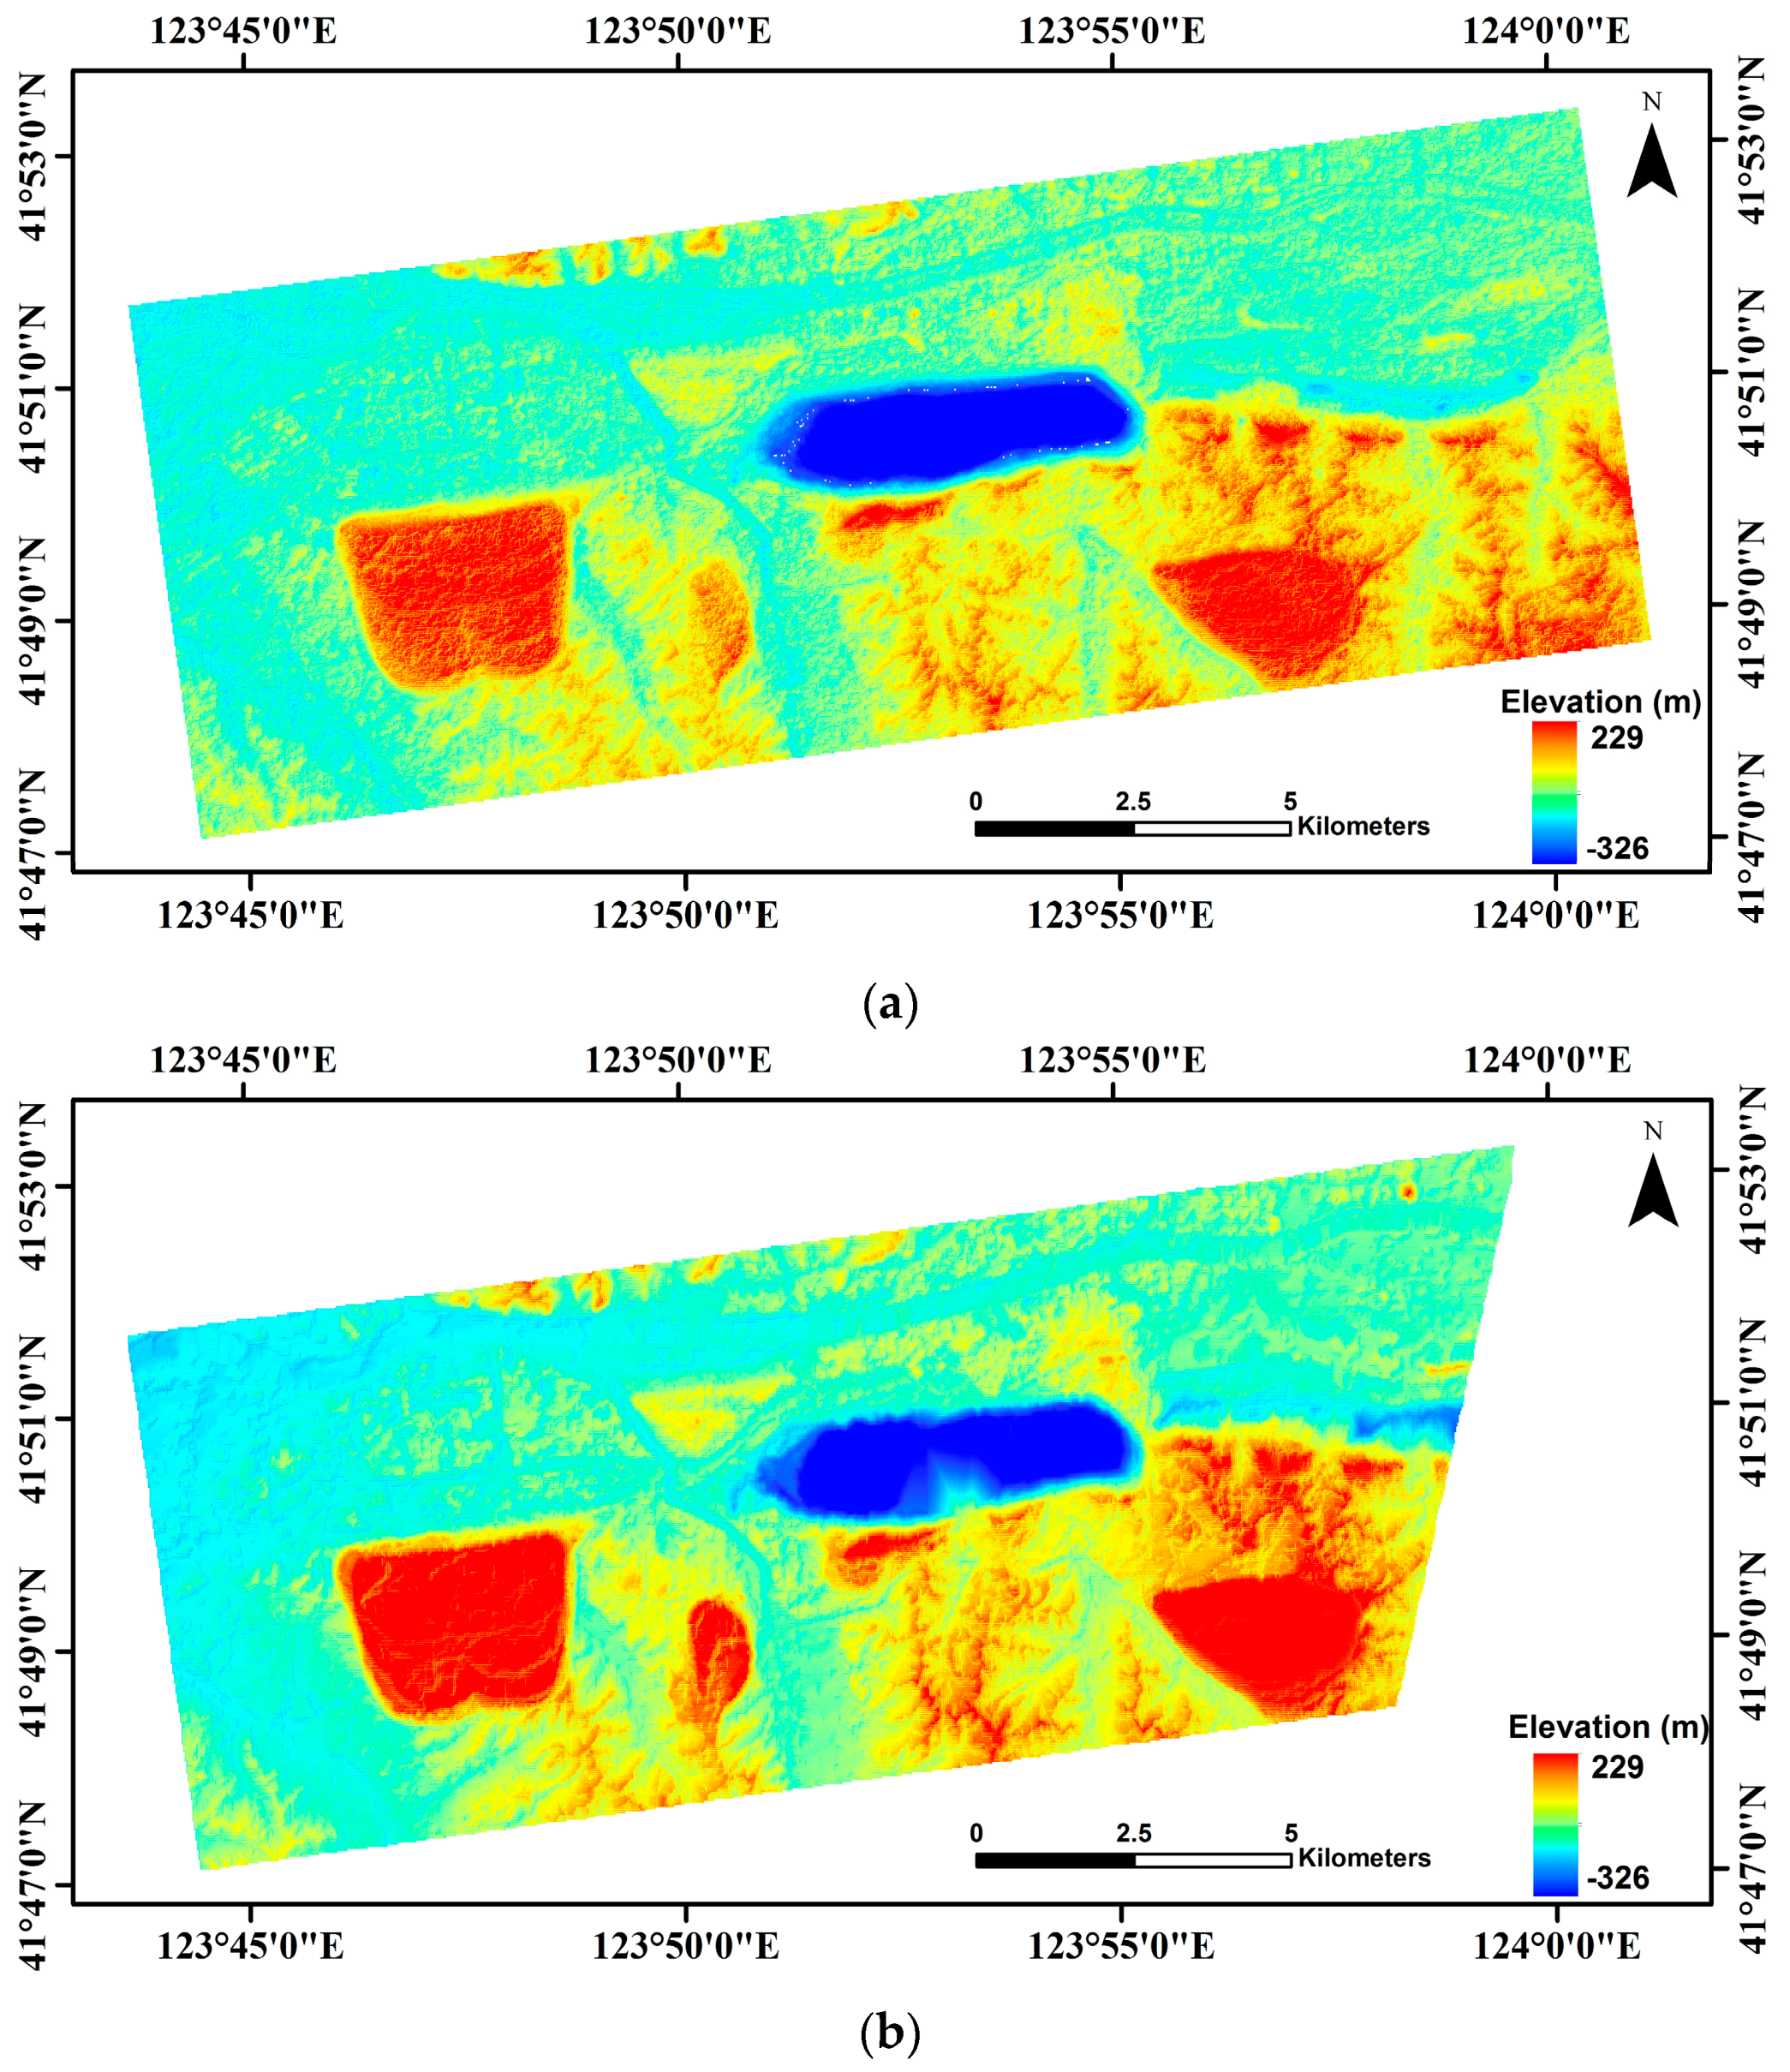
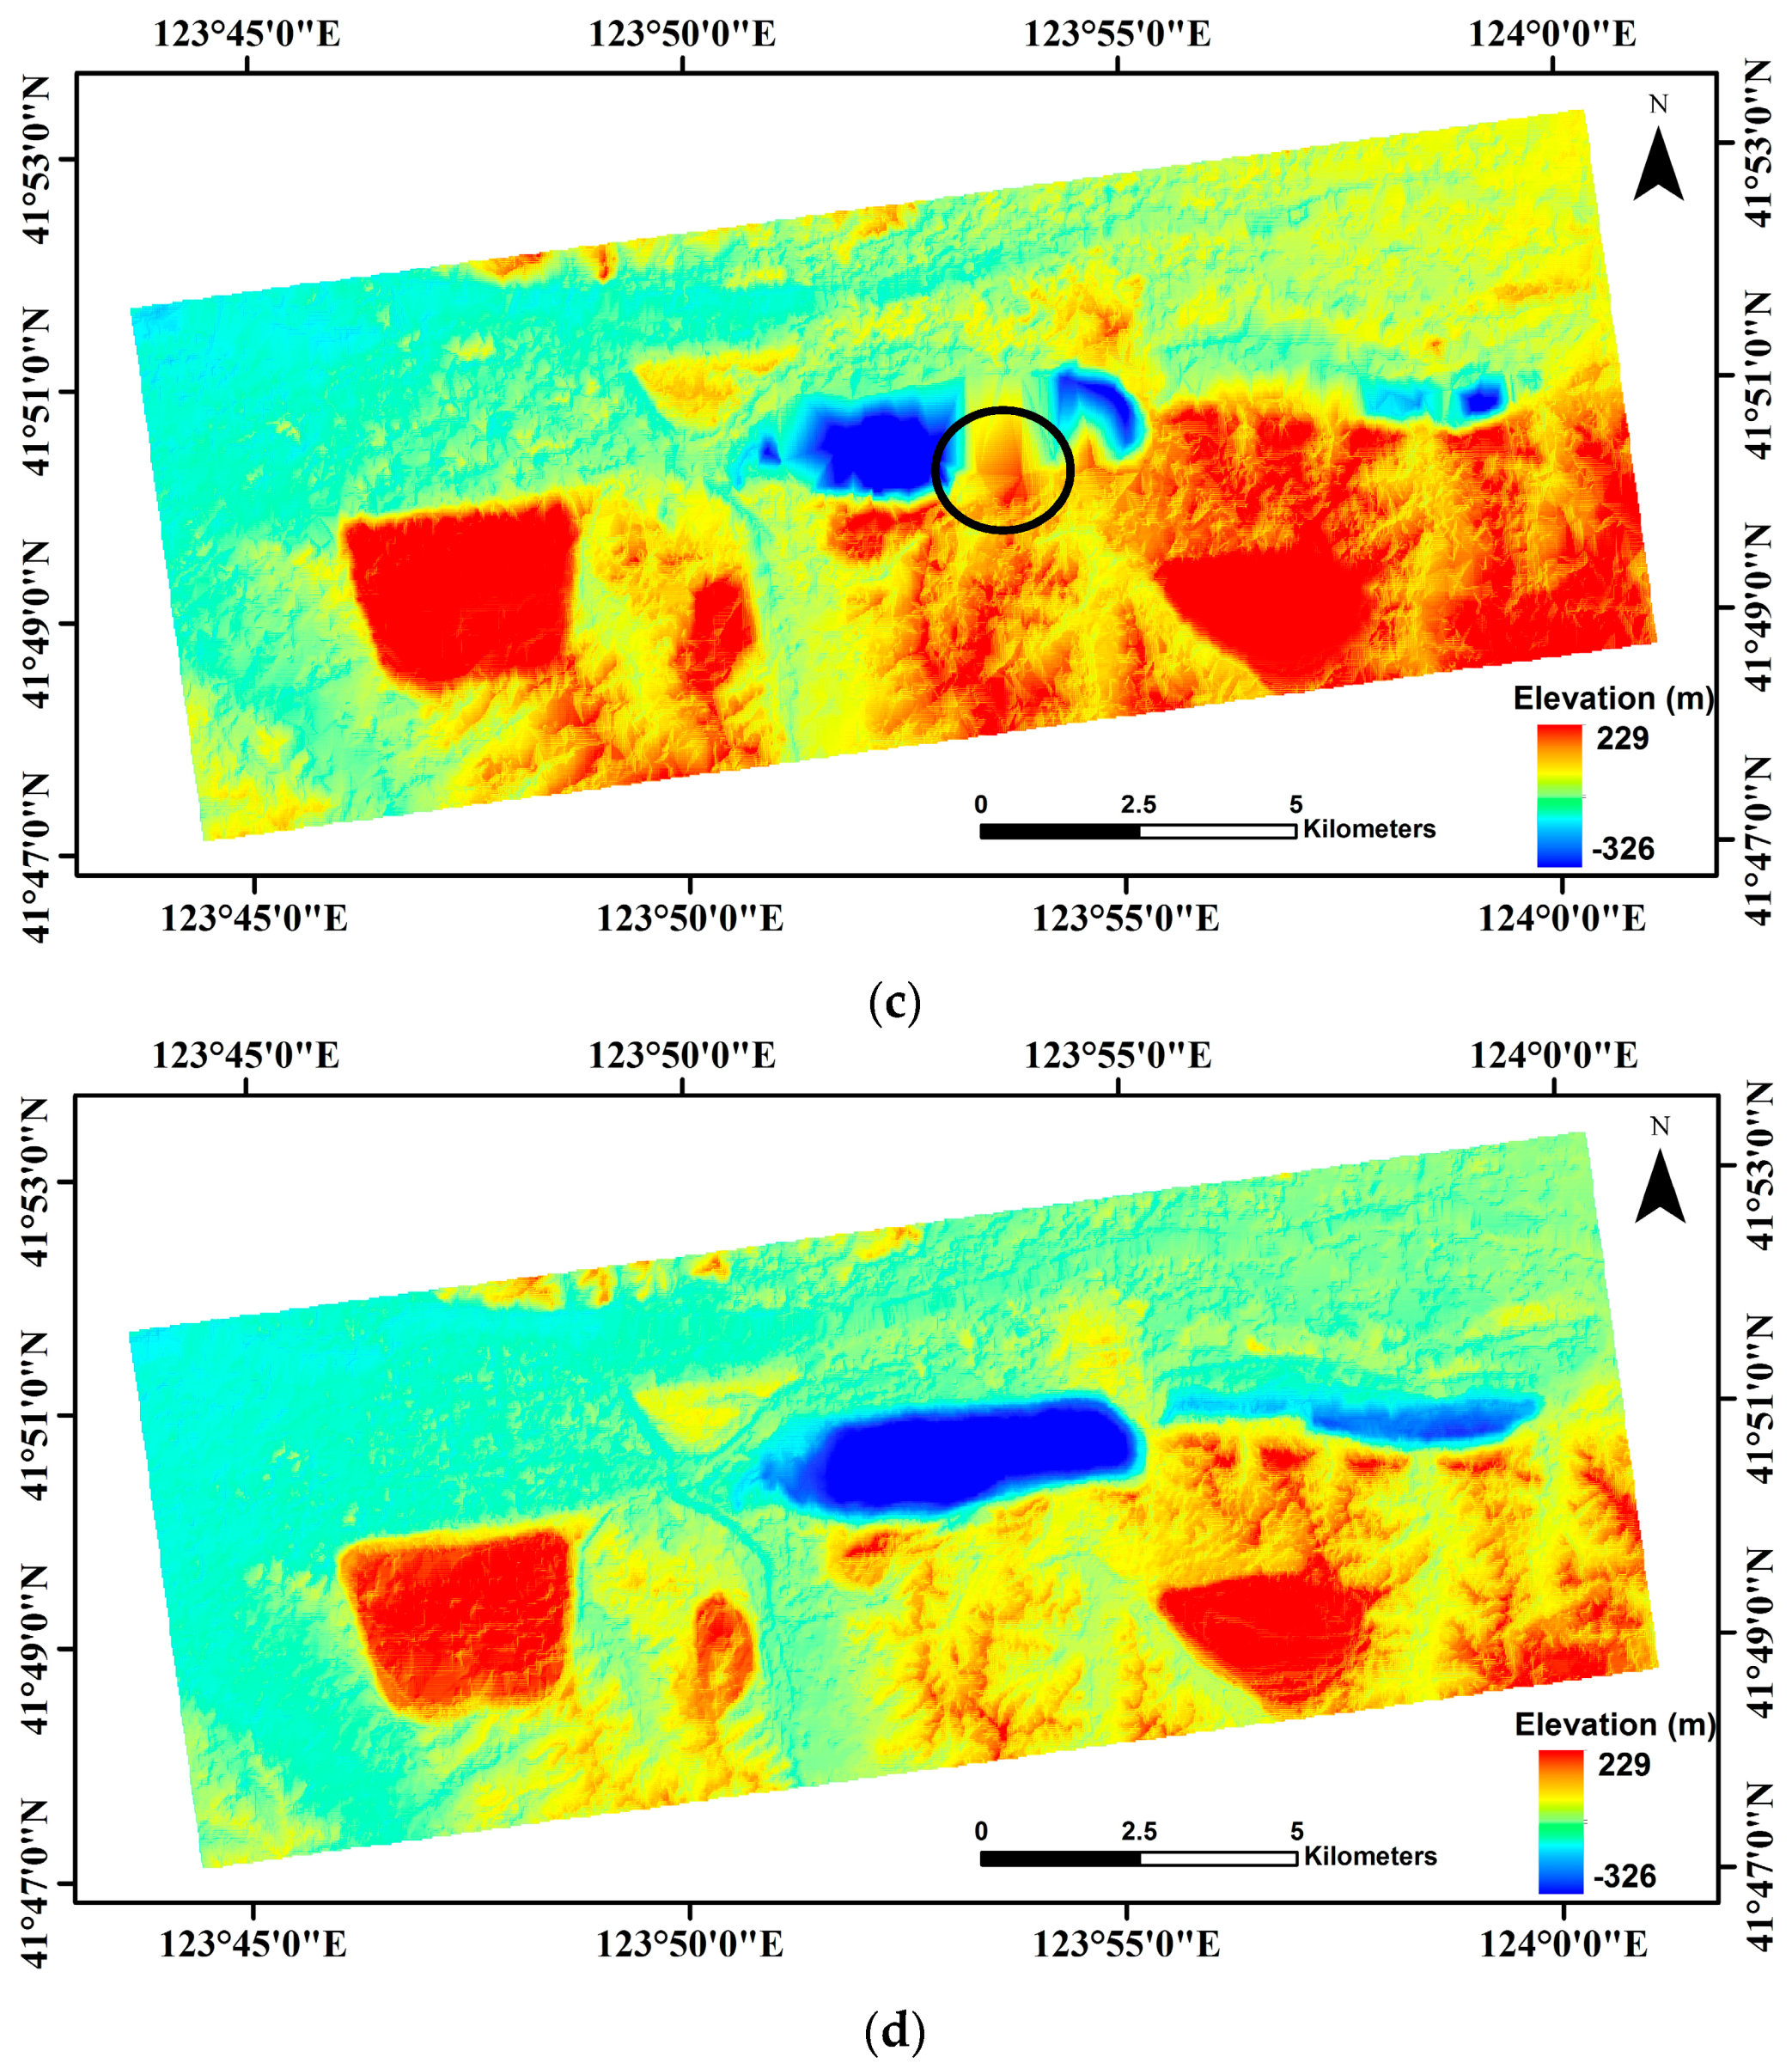
Figure 6.
Overall ground deformation based on the elevation differences. (a) ZY-3 DSM in 2013 and ASTER GDEM; (b) ZY-3 DSM in 2014 and ASTER GDEM; and (c) ZY-3 DSM in 2015 and ASTER GDEM.
Figure 6.
Overall ground deformation based on the elevation differences. (a) ZY-3 DSM in 2013 and ASTER GDEM; (b) ZY-3 DSM in 2014 and ASTER GDEM; and (c) ZY-3 DSM in 2015 and ASTER GDEM.

Figure 7.
Distribution of the seven districts with obvious elevations increase (red polygons) and elevations decrease (green polygons).
Figure 7.
Distribution of the seven districts with obvious elevations increase (red polygons) and elevations decrease (green polygons).

Figure 8.
Deformation in the west open-pit mine and distribution of the Districts 4–6 with obvious elevations increase (red polygons) and elevations decrease (green polygons).
Figure 8.
Deformation in the west open-pit mine and distribution of the Districts 4–6 with obvious elevations increase (red polygons) and elevations decrease (green polygons).
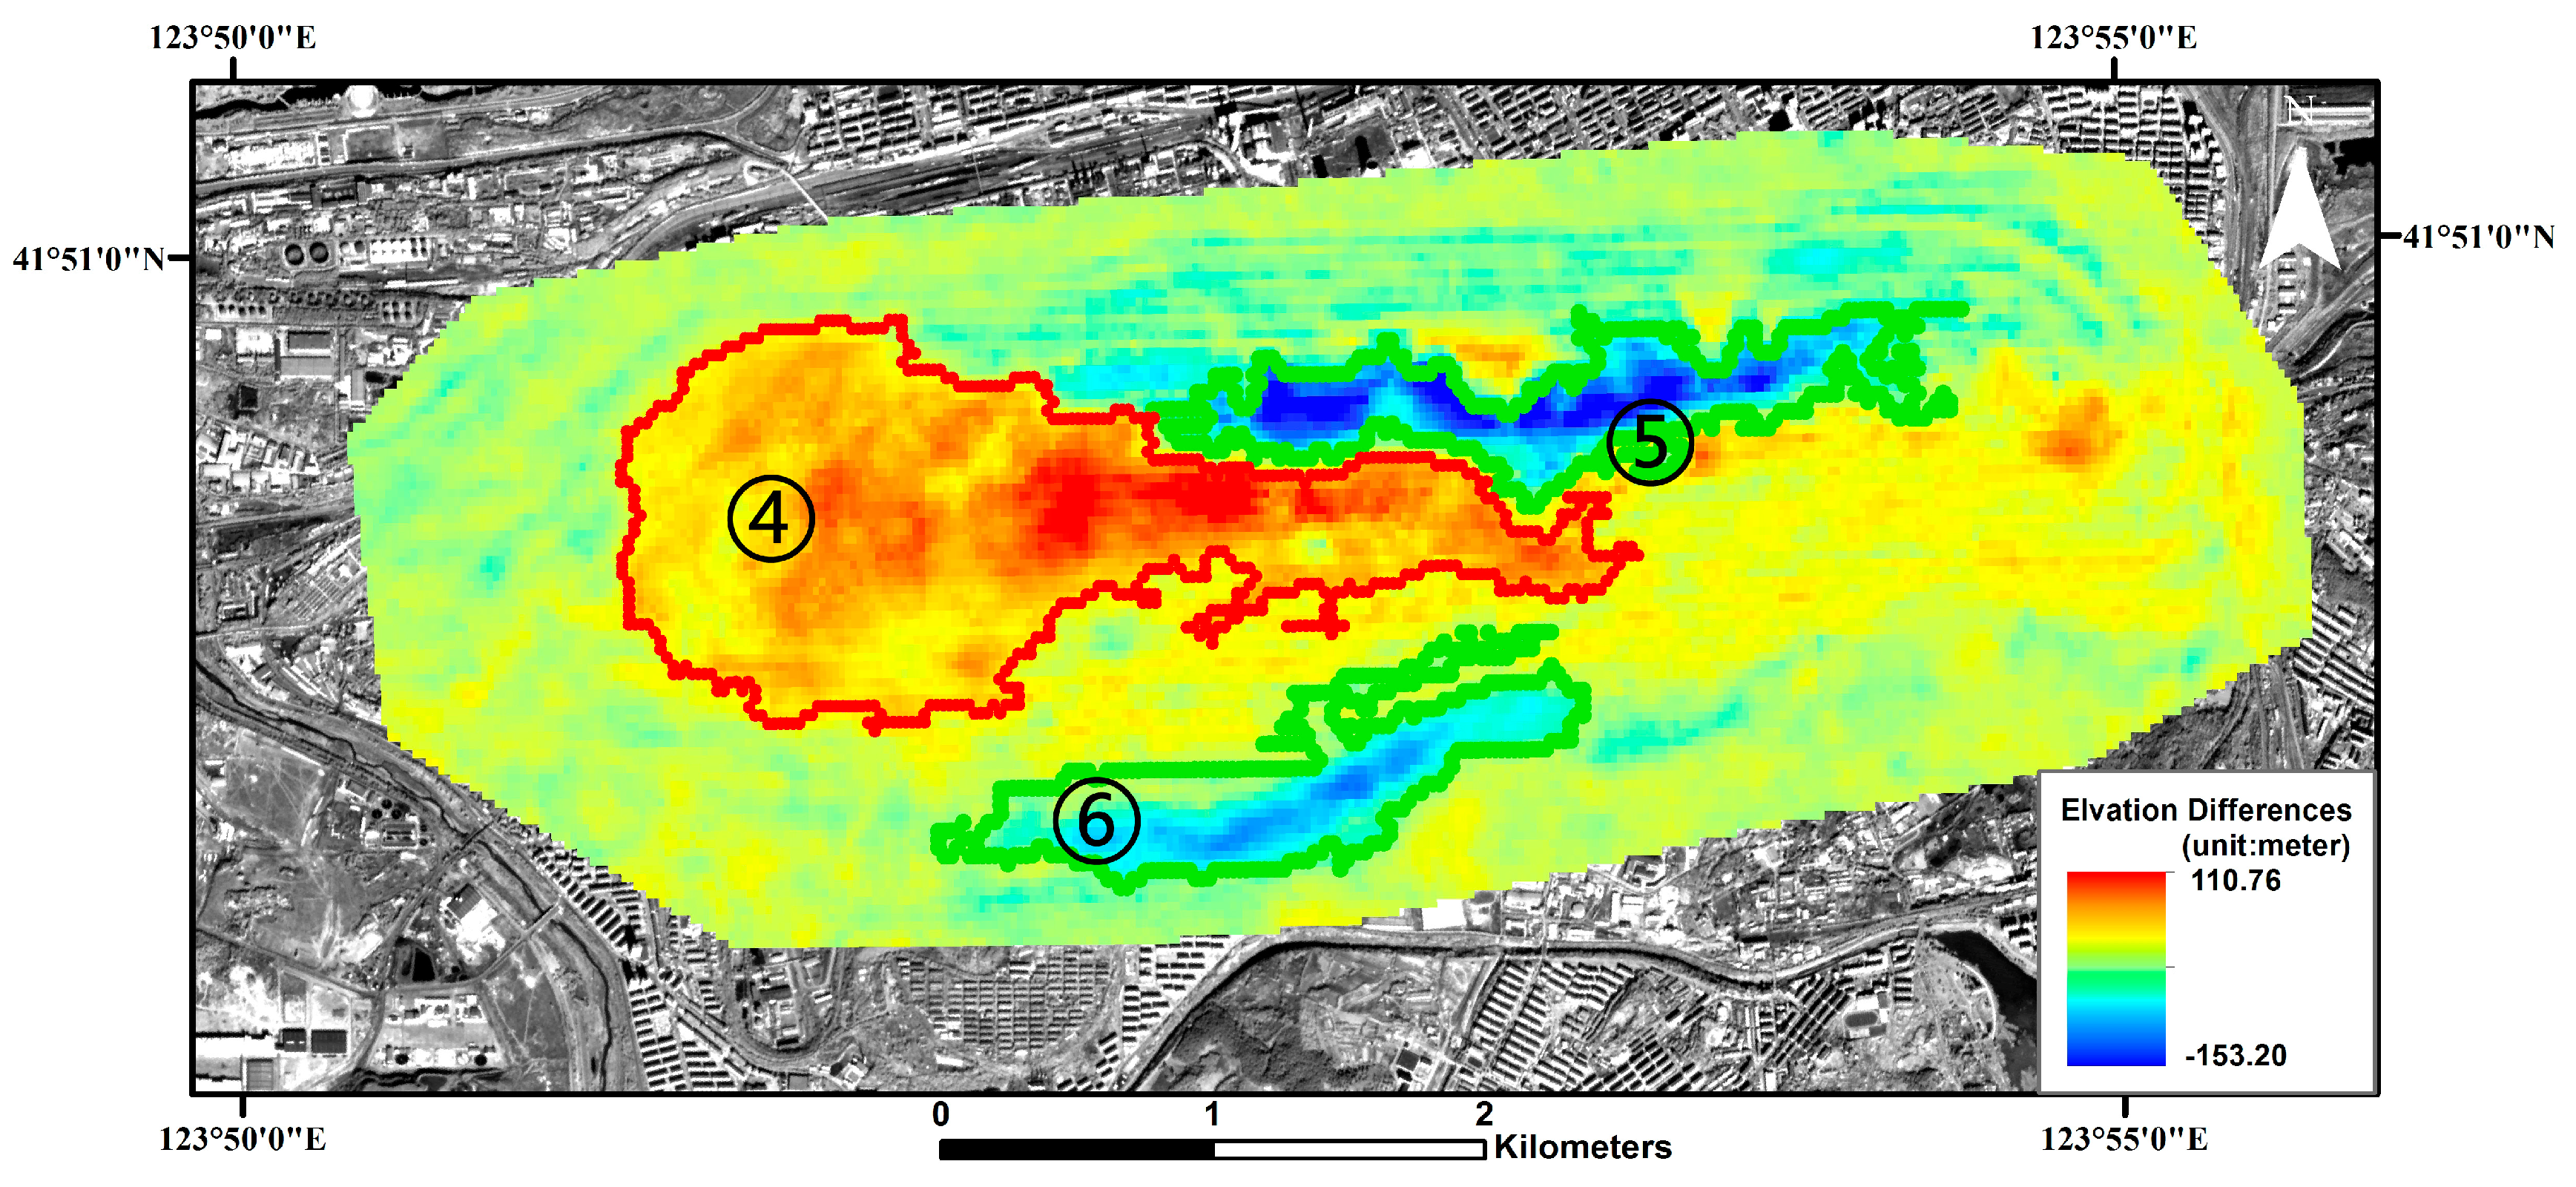
Figure 9.
Topographic deformation along three profiles that cross the active open mining pit and the waste rocks field. (a) Topographic deformation along Profile 1, (b) Profile 2, and (c) Profile 3.
Figure 9.
Topographic deformation along three profiles that cross the active open mining pit and the waste rocks field. (a) Topographic deformation along Profile 1, (b) Profile 2, and (c) Profile 3.
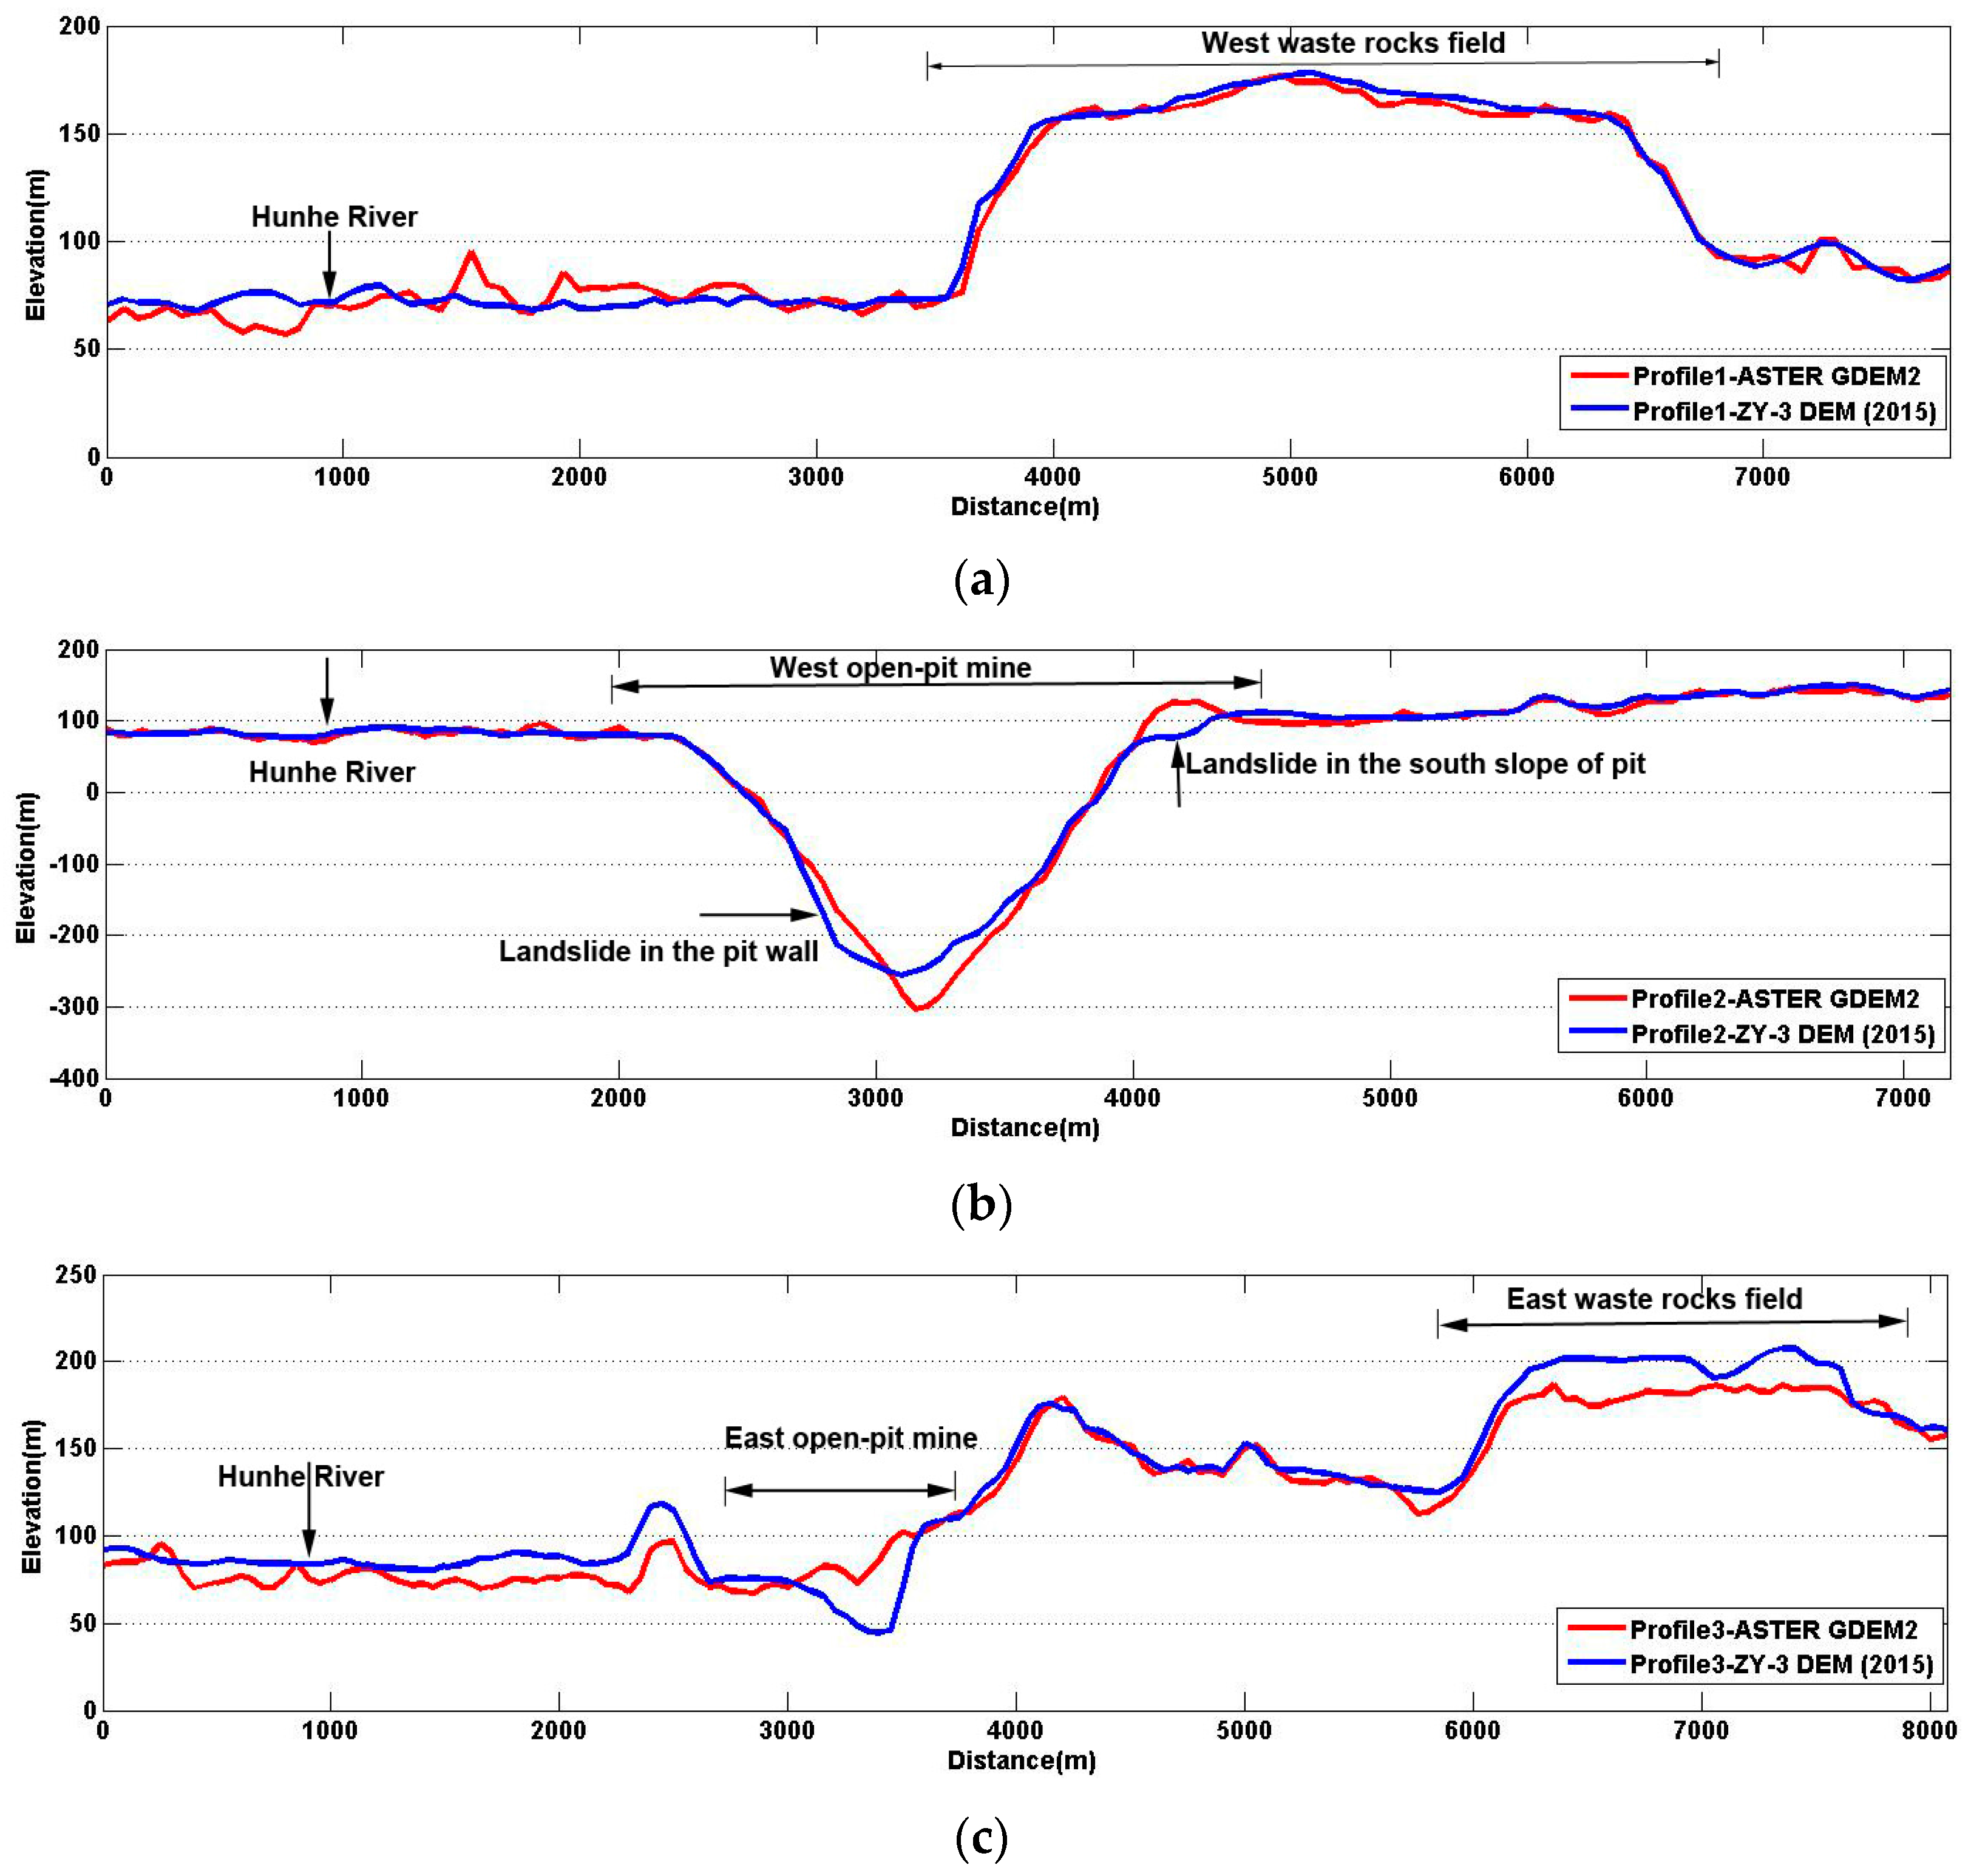
Figure 10.
Comparison of height values extracted from ASTER GDEM and ZY-3 DSM (2015) with twelve ground control points.
Figure 10.
Comparison of height values extracted from ASTER GDEM and ZY-3 DSM (2015) with twelve ground control points.

Table 1.
Datasets used in this study.
| Data Resource | Acquisition Time | DSM Spatial Resolution (m) |
|---|---|---|
| ZY-3 stereo images | 2013-12-24 | 10 |
| 2014-04-21 | 10 | |
| 2015-10-24 | 10 | |
| ASTER GDEM | 2010-7 | 30 |
Table 2.
Results of multi-temporal DSMs in the study area.
| Time | Data Source | Minimum (m) | Maximum (m) | Mean (m) | Standard Deviation (m) | RMS (m) |
|---|---|---|---|---|---|---|
| 2010-07 | ASTER GDEM | −326.00 | 228.00 | 90.83 | 50.24 | 8.68 [40] |
| 2013-12-24 | ZY-3 DSM | −125.64 | 206.01 | 96.54 | 39.52 | 4.04 |
| 2014-04-21 | ZY-3 DSM | −97.97 | 202.33 | 97.41 | 33.71 | 2.11 |
| 2015-10-24 | ZY-3 DSM | −312.49 | 228.39 | 93.86 | 49.85 | 1.72 |
Table 3.
Statistical results of elevation changes between ZY-3 DSMs and ASTER GDEM.
| Data Sets | Minimum (m) | Maximum (m) | Mean (m) | Standard Deviation (m) |
|---|---|---|---|---|
| 2013 ZY-3 DSM and ASTER GDEM | −75.25 | 338.58 | 8.38 | 23.63 |
| 2014 ZY-3 DSM and ASTER GDEM | −72.94 | 361.32 | 6.61 | 31.69 |
| 2015 ZY-3 DSM and ASTER GDEM | −153.20 | 110.76 | 3.12 | 11.18 |
Table 4.
Statistical results of elevation changes between ZY-3 DSM in 2015 and ASTER GDEM.
| Range of Elevation Changes | Ratio | Range of Elevation Changes | Ratio |
|---|---|---|---|
| <−10 m | 5.85% | >10 m | 16.42% |
| −10 m~−3 m | 12.70% | 3 m~10 m | 36.21% |
| −3 m~0 m | 12.17% | 0 m~3 m | 16.65% |
| Total descending | 30.72% | Total rising | 69.28% |
Table 5.
Results of the deformation in typical regions with ZY-3 DSM in 2015 and ASTER GDEM.
| Name of Typical Regions | Parameters of Elevation Changes (m) | Area (km2) | Volume Change (m3) | |||
|---|---|---|---|---|---|---|
| Minimum | Maximum | Mean | Standard Deviation | |||
| 1.West open-pit mine | −153.20 | 110.76 | 5.56 | 25.53 | 17.08 | 9.50 × 10⁷ |
| 2.East open-pit mine | −79.04 | 44.04 | −15.40 | 23.01 | 4.68 | −7.20 × 10⁷ |
| 3.West waste rocks field | −26.60 | 32.42 | 3.33 | 5.99 | 10.96 | 3.65 × 10⁷ |
| 4.East waste rocks field | −26.11 | 58.96 | 16.78 | 10.42 | 3.96 | 6.65 × 10⁷ |
| 5.Wangliang waste rocks field | −21.20 | 43.78 | 10.81 | 11.09 | 2.38 | 2.57 × 10⁷ |
Table 6.
Results of the deformation areas with obvious elevation changes using ZY-3 DSM in 2015 and ASTER GDEM.
Table 6.
Results of the deformation areas with obvious elevation changes using ZY-3 DSM in 2015 and ASTER GDEM.
| Districts with Obvious Elevation Changes | Elevation Increase (↑) or Decrease (↓) | Average of Elevation Change (m) | Area (km2) | Volume Change (m3) |
|---|---|---|---|---|
| ① In east waste rocks field | ↑ | 23.80 | 2.90 | 6.91 × 10⁷ |
| ② In Wangliang waste rocks field | ↑ | 21.59 | 1.11 | 2.40 × 10⁷ |
| ③ In the north of east open-pit mine | ↑ | 19.22 | 0.86 | 1.65 × 10⁷ |
| ④ In west open-pit mine | ↑ | 36.35 | 3.57 | 1.37 × 10⁸ |
| ⑤ In west open-pit mine | ↓ | −41.77 | 1.15 | −4.81 × 10⁷ |
| ⑥ In west open-pit mine | ↓ | −28.66 | 1.10 | −3.14 × 10⁷ |
| ⑦ In east open-pit mine | ↓ | −31.24 | 3.87 | −1.21 × 10⁸ |
Table 7.
Accuracy (root mean square (RMS) errors) for the parameters used in the extracted deformation.
Table 7.
Accuracy (root mean square (RMS) errors) for the parameters used in the extracted deformation.
| Parameters | RMS |
|---|---|
| H (m) | 2.43 a |
| S (km2) | 0.00089 |
| V (m3) | 2.36 × 10³ |
a Refers to the accuracy of DSM in 2015. H is for height change, S is for deformation area, and V is for deformation volume.
Table 8.
Comparison of height values in twelve ground control points.
| Height Differences in GCPs | Minimum (m) | Maximum (m) | Mean (m) | Standard Deviation (m) |
|---|---|---|---|---|
| ASTER GDEM and GPS measurements | −11.01 | 12.05 | −2.29 | 7.27 |
| ZY-3 DSM (2015) and GPS measurements | −1.97 | 3.07 | 0.70 | 1.64 |
| ZY-3 DSM (2015) and ASTER GDEM | −9.62 | 9.84 | 2.99 | 6.07 |
© 2017 by the authors. Licensee MDPI, Basel, Switzerland. This article is an open access article distributed under the terms and conditions of the Creative Commons Attribution (CC BY) license (http://creativecommons.org/licenses/by/4.0/).
Share and Cite
MDPI and ACS Style
Hu, W.; Wu, L.; Zhang, W.; Liu, B.; Xu, J. Ground Deformation Detection Using China’s ZY-3 Stereo Imagery in an Opencast Mining Area. ISPRS Int. J. Geo-Inf. 2017, 6, 361. https://doi.org/10.3390/ijgi6110361
AMA Style
Hu W, Wu L, Zhang W, Liu B, Xu J. Ground Deformation Detection Using China’s ZY-3 Stereo Imagery in an Opencast Mining Area. ISPRS International Journal of Geo-Information. 2017; 6(11):361. https://doi.org/10.3390/ijgi6110361
Chicago/Turabian StyleHu, Wenmin, Lixin Wu, Wei Zhang, Bin Liu, and Jiaxing Xu. 2017. "Ground Deformation Detection Using China’s ZY-3 Stereo Imagery in an Opencast Mining Area" ISPRS International Journal of Geo-Information 6, no. 11: 361. https://doi.org/10.3390/ijgi6110361
Note that from the first issue of 2016, this journal uses article numbers instead of page numbers. See further details here.